 P. Hoagland
 A. Beet1
 D. Ralston
- 1Marine Policy Center, Woods Hole Oceanographic Institution, Woods Hole, MA, United States
- 2Department of Applied Ocean Physics and Engineering, Woods Hole Oceanographic Institution, Woods Hole, MA, United States
- 3College of Earth, Ocean, and Environment, University of Delaware, Newark, DE, United States
- 4Cardno Entrix, Newark, DE, United States
- 5Energy and Environmental Research Associates, Wynnewood, PA, United States
Along the US Atlantic and Gulf coasts, port authorities and governments have been competing for access to federal funds to deepen the channels and berths in each of the major estuary-based harbors, thereby facilitating access by larger containerships. Consistent with a source-to-sea conceptualization, physical modifications of an estuary can result in dynamic changes to its water and sediment flows, resulting in new arrangements of environmental features. These modifications, in turn, can lead to redistributions of the net benefits arising from extant flows of valued ecosystem services to stakeholders and communities in the broader river-estuary system. Here, some of the implications of channel deepening in the Hudson river-estuary system were examined as a case study. An integrated analytical framework was developed, comprising hydrodynamic models of water flows and environmental characteristics, especially salinity; extreme value estimates of the occurrence of regional droughts; and assessments of the welfare effects of changes in ecosystem services. Connections were found among channel deepening in the lower estuary, increased risks to fluvial drinking water withdrawals in the upper estuary, and expected economic losses to hydropower generation in the upper river. The results argue for a more inclusive consideration of the consequences of human modifications of river-estuary systems.
Introduction
Background
Increasingly, water resource managers and coastal planners have called for a management that integrates environments – especially one that recognizes linkages across hydrologic environments in a “source-to-sea” approach. As technical advisors to the Global Environment Facility (GEF) have observed:
[i]ntegrated coastal area and river basin management has further been introduced to better connect [Integrated Water Resource Management] and [Integrated Coastal Management], and approaches recognizing the connection between terrestrial water resources’ flows and the downstream environments are being increasingly applied (Granit et al., 2017) (emphasis added).
Both the academic and technical literatures relating to the source-to-sea concept have focused on the canonical downstream flows of both services and pollutants, where “sources” are typically located upstream of the “recipients.” Although rivers tend to behave in such a manner, estuaries do not, and flows of services or dis-services may occur between the two systems in complex and unanticipated ways. Notably, the integrating principle of source-to-sea does not have to be unidirectionally limited. Its general admonition continues to hold even with complex flows, inferring that a more holistic management, encompassing all of the linked environments, would move toward sustainability. Nevertheless, this theoretical conclusion has been difficult to put into practice:
[t]he biggest challenge lies in fitting such practices into a nested governance system in which the multiple levels of governance interact to establish management frameworks that provide synergies and are able to address the wellbeing of the source-to-sea system as a whole (Granit et al., 2017).
The ecosystem services arising from regional environments, such as the major river systems and their associated estuaries, involve historic patterns of human uses, comprising the combination of natural, manufactured, and human capitals to yield economic benefits. As a leading example along the US Atlantic coast, both the Hudson River and the NY/NJ Harbor have experienced major uses and modifications over centuries (Swaney et al., 2006; Schuyler, 2018), including the widespread exploitation of finfish and shellfish resources (e.g., the American shad Alosa sapidissima and the Eastern oyster Crassostrea virginica); the releases of solid and municipal wastes and an array of toxic industrial effluents; the deepening of estuarine and river channels; the filling, straightening, and hardening of shorelines; and the damming of the Hudson River from its headwaters in the Adirondacks down to the Hudson River Lock and Dam at Troy, New York. Historically, many of these uses and modifications were focused narrowly on the production of specific goods or services, including the free disposal of wastes, without much regard to potential external effects on the capacity of the system to deliver other kinds of services. Even some of the narrowly focused uses, however, especially commercial fishing, were prosecuted to ultimately unsustainable levels (viz., Kurlansky, 2006), thereby impacting adversely the primary beneficiaries as well as others who would benefit from a better managed system. Here the consequences of the upstream flows of an ecosystem dis-service, the salinity intrusion resulting from a major channel deepening project, are explored.
Panama Canal Expansion
In June 2016, a third set of locks was completed and opened for the Panama Canal, significantly expanding the canal’s transportation capabilities (Bogdanich et al., 2016). This $7 billion public works project allowed the transit through the canal of “New Panamax” container ships with lengths of up to 366 m, beams of up to 49 m, and drafts of up to 15.2 m. Ships this large can carry 13,000 twenty-foot equivalent units (TEUs) of containerized cargo, increasing the cargo capacity of container ships moving through the canal by 160 percent. By lessening congestion, locking times, and overall times of transit, this third set of locks effectively doubled the capacity of the canal (Anonymous, 2016).
The Panama Canal’s capacity was expanded in order to recover and maintain the Canal Authority’s market share in maritime transportation routing. A critical complement to the expansion’s success is the receptiveness of commercial shipping ports to New Panamax vessels, especially ports along the US Atlantic and Gulf Coasts (Ramos, 2014). Many factors affect the accessibility of ports, including crane capacity, yard space, ready links to highways and rail lines, and proximity to distribution centers or markets. Among the most critical factors affecting receptiveness, however, are the physical dimensions of the relevant waterway, including channel and berth depths, and the breadth of turning basins. Rodrigue (2017) has described a “race to the bottom” among ports, comprising rent-seeking for federal financial resources and logistical support for navigation channel deepening. The ports of New York, Baltimore, Hampton Roads, and Miami now have 15.2 m channels that can service the New Panamax vessels. Other ports are in the process of or have plans for channel deepening to depths ranging from 13.7 to 15.2 m (Virginia Business, 2017).
The expansion of the Panama Canal and the deepening of US harbors together are expected to shift westward the “line of equivalence” that represents the contour at which shippers moving cargo from Asian suppliers are indifferent between landing cargo at US West and Atlantic/Gulf Coast ports, thereby effectively increasing business for the latter. The deepening of navigation channels also may lead to net benefits for regional economies, as shipping activity in each relevant port is expected to grow, and the costs of dredging – while substantial – may be relatively minor in comparison to the expected scales of resulting economic growth.
Channel Deepening in the NY/NJ Harbor
As a leading example, over the last 25 years, Upper New York Harbor, Newark Bay, the Kill Van Kull, the Arthur Kill, the East River, the Ambrose Channel, and surrounding areas have been dredged an additional 1.5–3.0 m, to a depth of at least 15.2 m to accommodate supertankers and larger container ships (Figure 1). This modification of the physical system is an example of how manufactured capital, in the form of dredging, is applied to natural capital, the estuary, to enhance the flows of a “provisioning” ecosystem service, namely the capacity of the estuary to provide a relatively low-cost mode of cargo transportation. The channel deepening for the NY/NJ Harbor, completed in September 2016, was justified on the basis of its leading to an estimated increase in $11.2 billion in personal income to individuals in the two-state region. Comparing this undeniably crude economic benefit measure to a cost of $1.6 billion for the actual dredging operations, the US Army Corps of Engineers (Army Corps) has calculated a project benefit-cost ratio of nearly 7:1 (US Army Corps of Engineers (USACE), 2016).
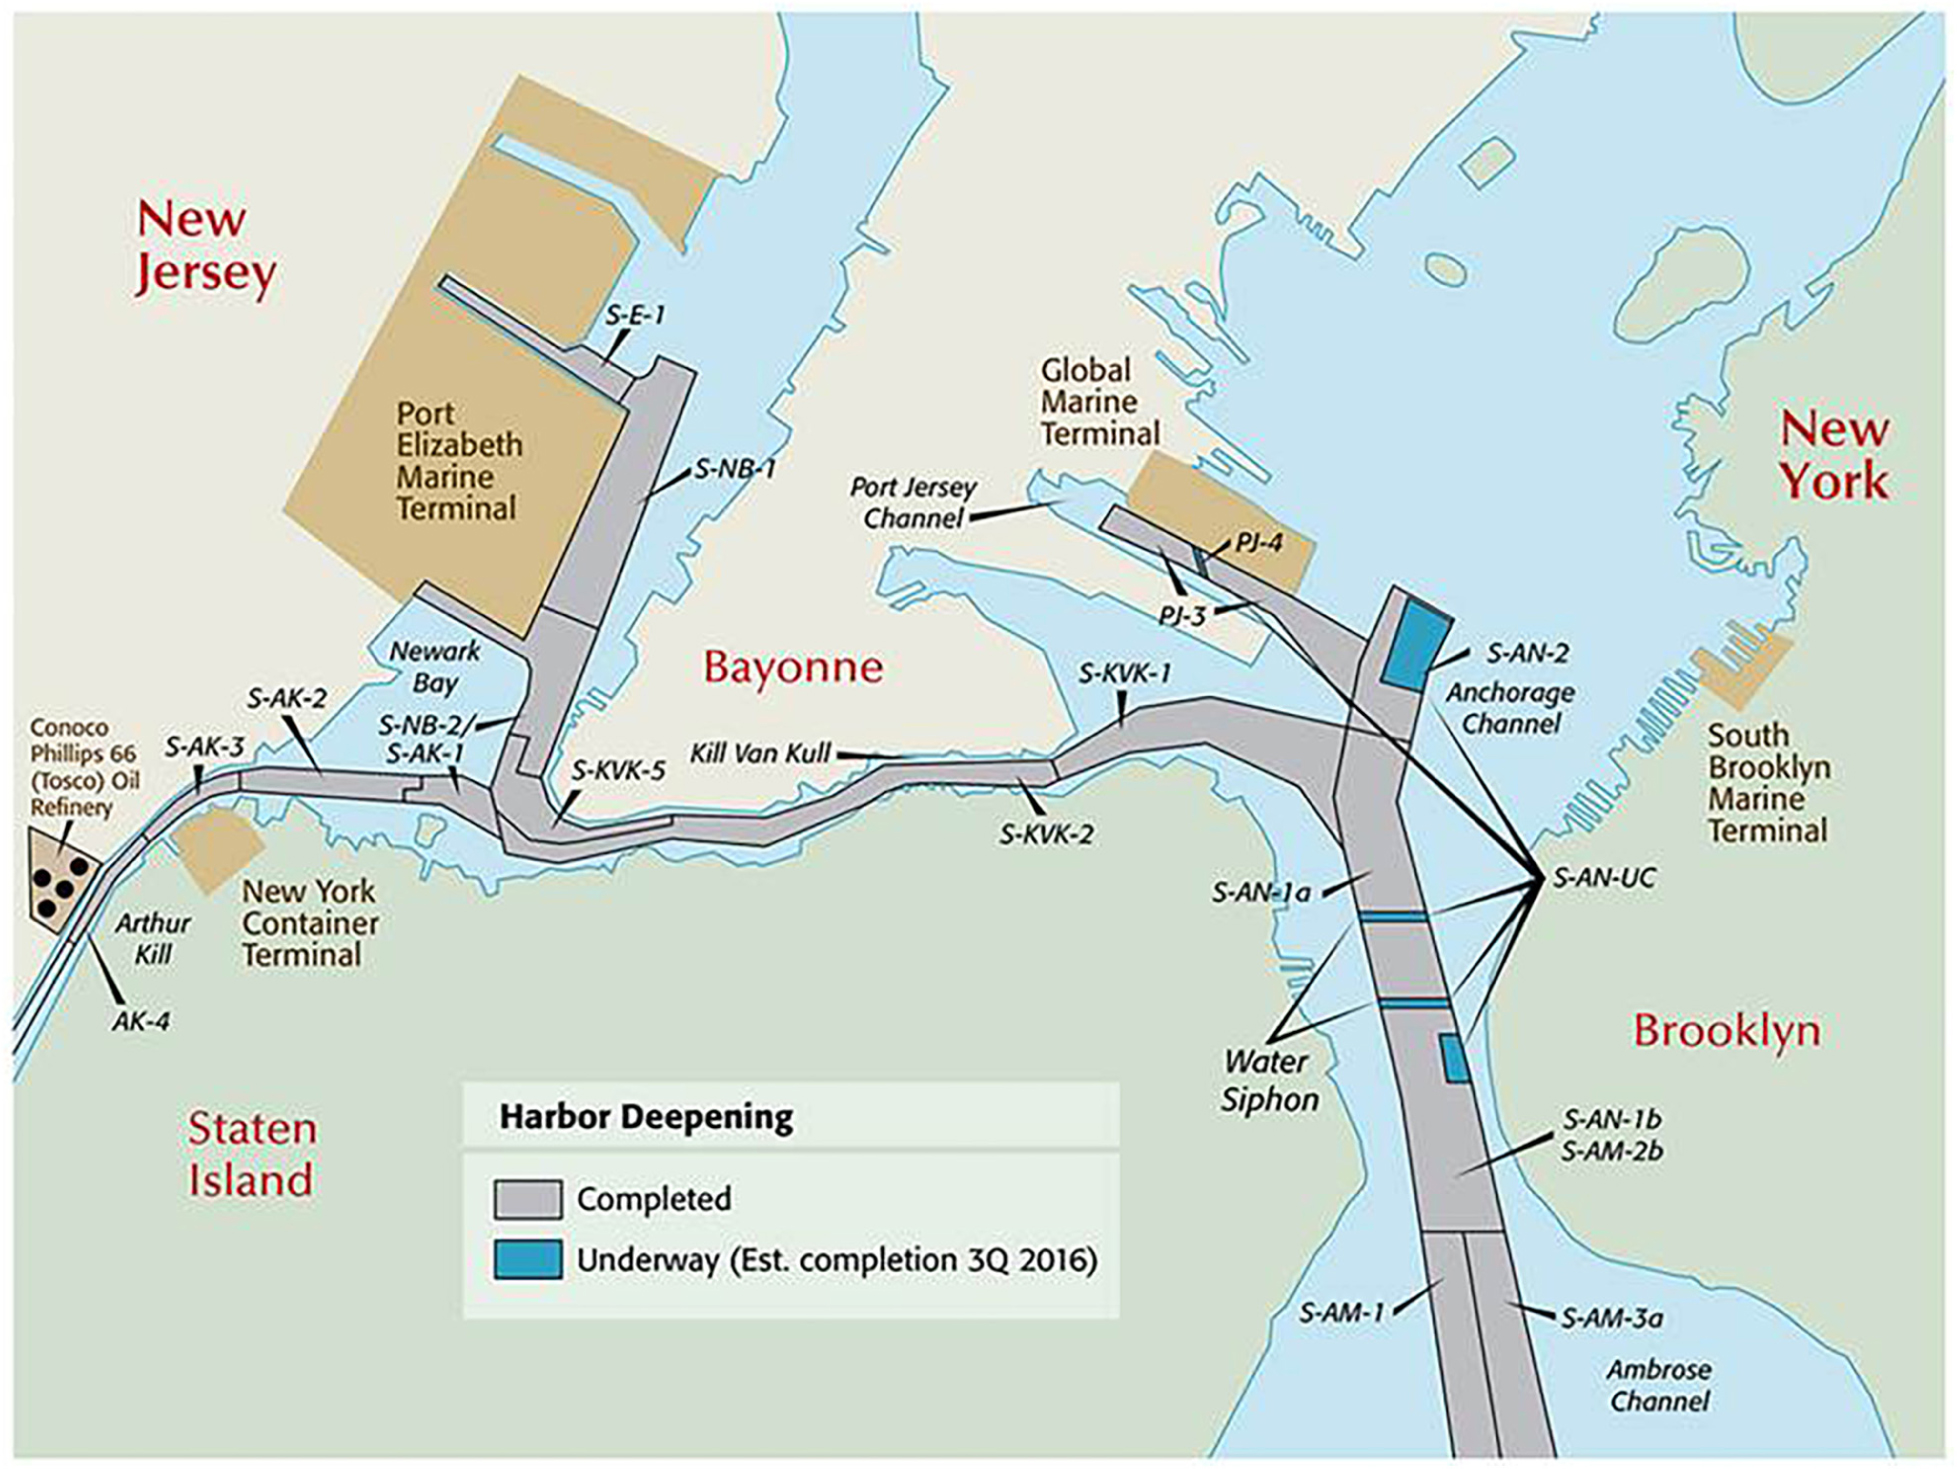
Figure 1. Channel deepening projects in the NY-NJ Harbor, as of September 2016. Source: Port of New York and New Jersey (PNYNJ) (2016). Permission has been received for all previously published copyrighted figures.
While it is important to consider the benefits and costs of a project that can result in major modifications to an estuarine environment, the Corp’s approach to the weighing of costs and benefits to justify channel deepening can be described as overly simplified for several reasons. Most notably, the external costs of many of the potential side-effects of channel deepening were not incorporated into its analysis. Many likely side-effects of channel deepening were identified through assessments of environmental impacts, as required under provisions of the US National Environmental Policy Act (NEPA) (United States Army Corps of Engineers (USACE), 2000), but economic losses (or gains) resulting from these effects were not evaluated in economic terms.
In the case of channel deepening for the NY-NJ Harbor, a central issue concerned the disposition of contaminated dredge spoils. A NY-NJ Harbor Regional Dredging Team (RDT) was established in 2006 to develop a detailed approach to manage the dredged material from the projects (US Army Corps of Engineers (USACE), 1999, 2008). The cost of the placement of dredged material, which in some cases involved its removal from the estuary and its disposal at remote hazardous waste facilities, was considered in the Corp’s analysis of benefits and costs. Further efforts to mitigate the impacts of channel deepening involved the creation of artificial reefs, beach nourishments, and salt marsh restorations. The costs of undertaking the redistribution of dredged sediments in these ways were incorporated into the analysis, but apparently there was no serious attempt to estimate the potential benefits of these projects in economic terms.
Salinity Intrusion
The deepening of the channels of an estuary changes the circulation patterns and distributions of environmental conditions within the system. In particular, in many cases, a deeper estuary leads to a shift upstream in the leading edge of the salinity intrusion, or the transition from brackish water to fresh water (Hansen and Rattray, 1965; MacCready and Geyer, 2010). The density gradient between salt water and fresh water drives an estuarine circulation that is net landward near the bottom of the estuary and net seaward near the surface, transporting denser salt water landward in the process. When an estuary is deepened artificially by dredging, the pressure gradient steepens with the increased depth, and the mixing by tidal currents decreases. Both factors lead to a salinity intrusion that is further upstream, on average, than its original position. The salinity intrusion depends also on the environmental forcing in the estuary, as it responds dynamically to the changes in conditions. The mean seaward flow by the river discharge tends to push the salinity intrusion toward the mouth of the estuary, so the position of the salinity intrusion varies inversely with river discharge. Tidal mixing works to shut down the estuarine circulation and salinity stratification, so during the increased tidal currents of spring tides the landward salt transport decreases and the salinity intrusion is pushed toward the mouth, and during weaker, neap tides the salinity intrusion moves farther landward. This fortnightly to seasonal variation in the salinity intrusion due to the natural forcing is in addition to any secular, anthropogenic changes induced by deepening or other channel modifications.
This study explores one of the potential external effects of the deepening of channels in the NY-NJ Harbor. It focuses on instream withdrawals from the Hudson River for supplies of drinking water in the region surrounding the city of Poughkeepsie, NY. The river’s supply of drinking water constitutes a second kind of provisioning ecosystem service. This service can be affected adversely by changes in the quality of the river’s water, including its level of salinity. During normal circumstances, the river’s salinity content at the location for water withdrawal at Poughkeepsie is well below thresholds that would present a hazard to public health. The quality of this service could be degraded or the service itself could be interrupted during rare periods of drought, or more frequently if the environmental characteristics of the system are altered, such as through channel deepening in the estuary.
In this study, an integrated modeling framework was developed and applied to characterize the potential effects of the upstream movement of the salinity intrusion resulting from increased channel deepening, threatening the river’s drinking water service. Further, the implications of the existing water management regime in the Upper Hudson River that would be triggered in response to the potential salinity contamination of drinking water at Poughkeepsie were examined. The management response would lead to lessened outputs of energy from a hydropower plant located even further upstream, itself constituting another human use of the river-estuary system that relies upon water flows, a third type of provisioning ecosystem service supplied by the river. Integrating four modeling components, the physical and institutional dimensions of the resulting tradeoff in services initiated by channel deepening are discussed, and estimates of the consequent expected economic losses are developed.
Upstream Effects
At Hudson river-kilometer 120, the city of Poughkeepsie, New York operates a freshwater intake to supply more than 20,000 m3d–1 of freshwater to about 125,000 water consumers in the city and its surrounding suburbs (Figure 2). The water is withdrawn from the river by the Poughkeepsie Water Treatment Facility (PWTF), which treats, filters, and delivers potable water to consumers. The water supplied by the facility must meet state drinking water quality standards, including those relating to its salinity content. In particular, the PWTF must supply water that meets a drinking water quality standard for salinity of less than 250 mg/L of chloride, an ionized form of chlorine (Poughkeepsie Water Treatment Facility (PWTF), 2018)1.
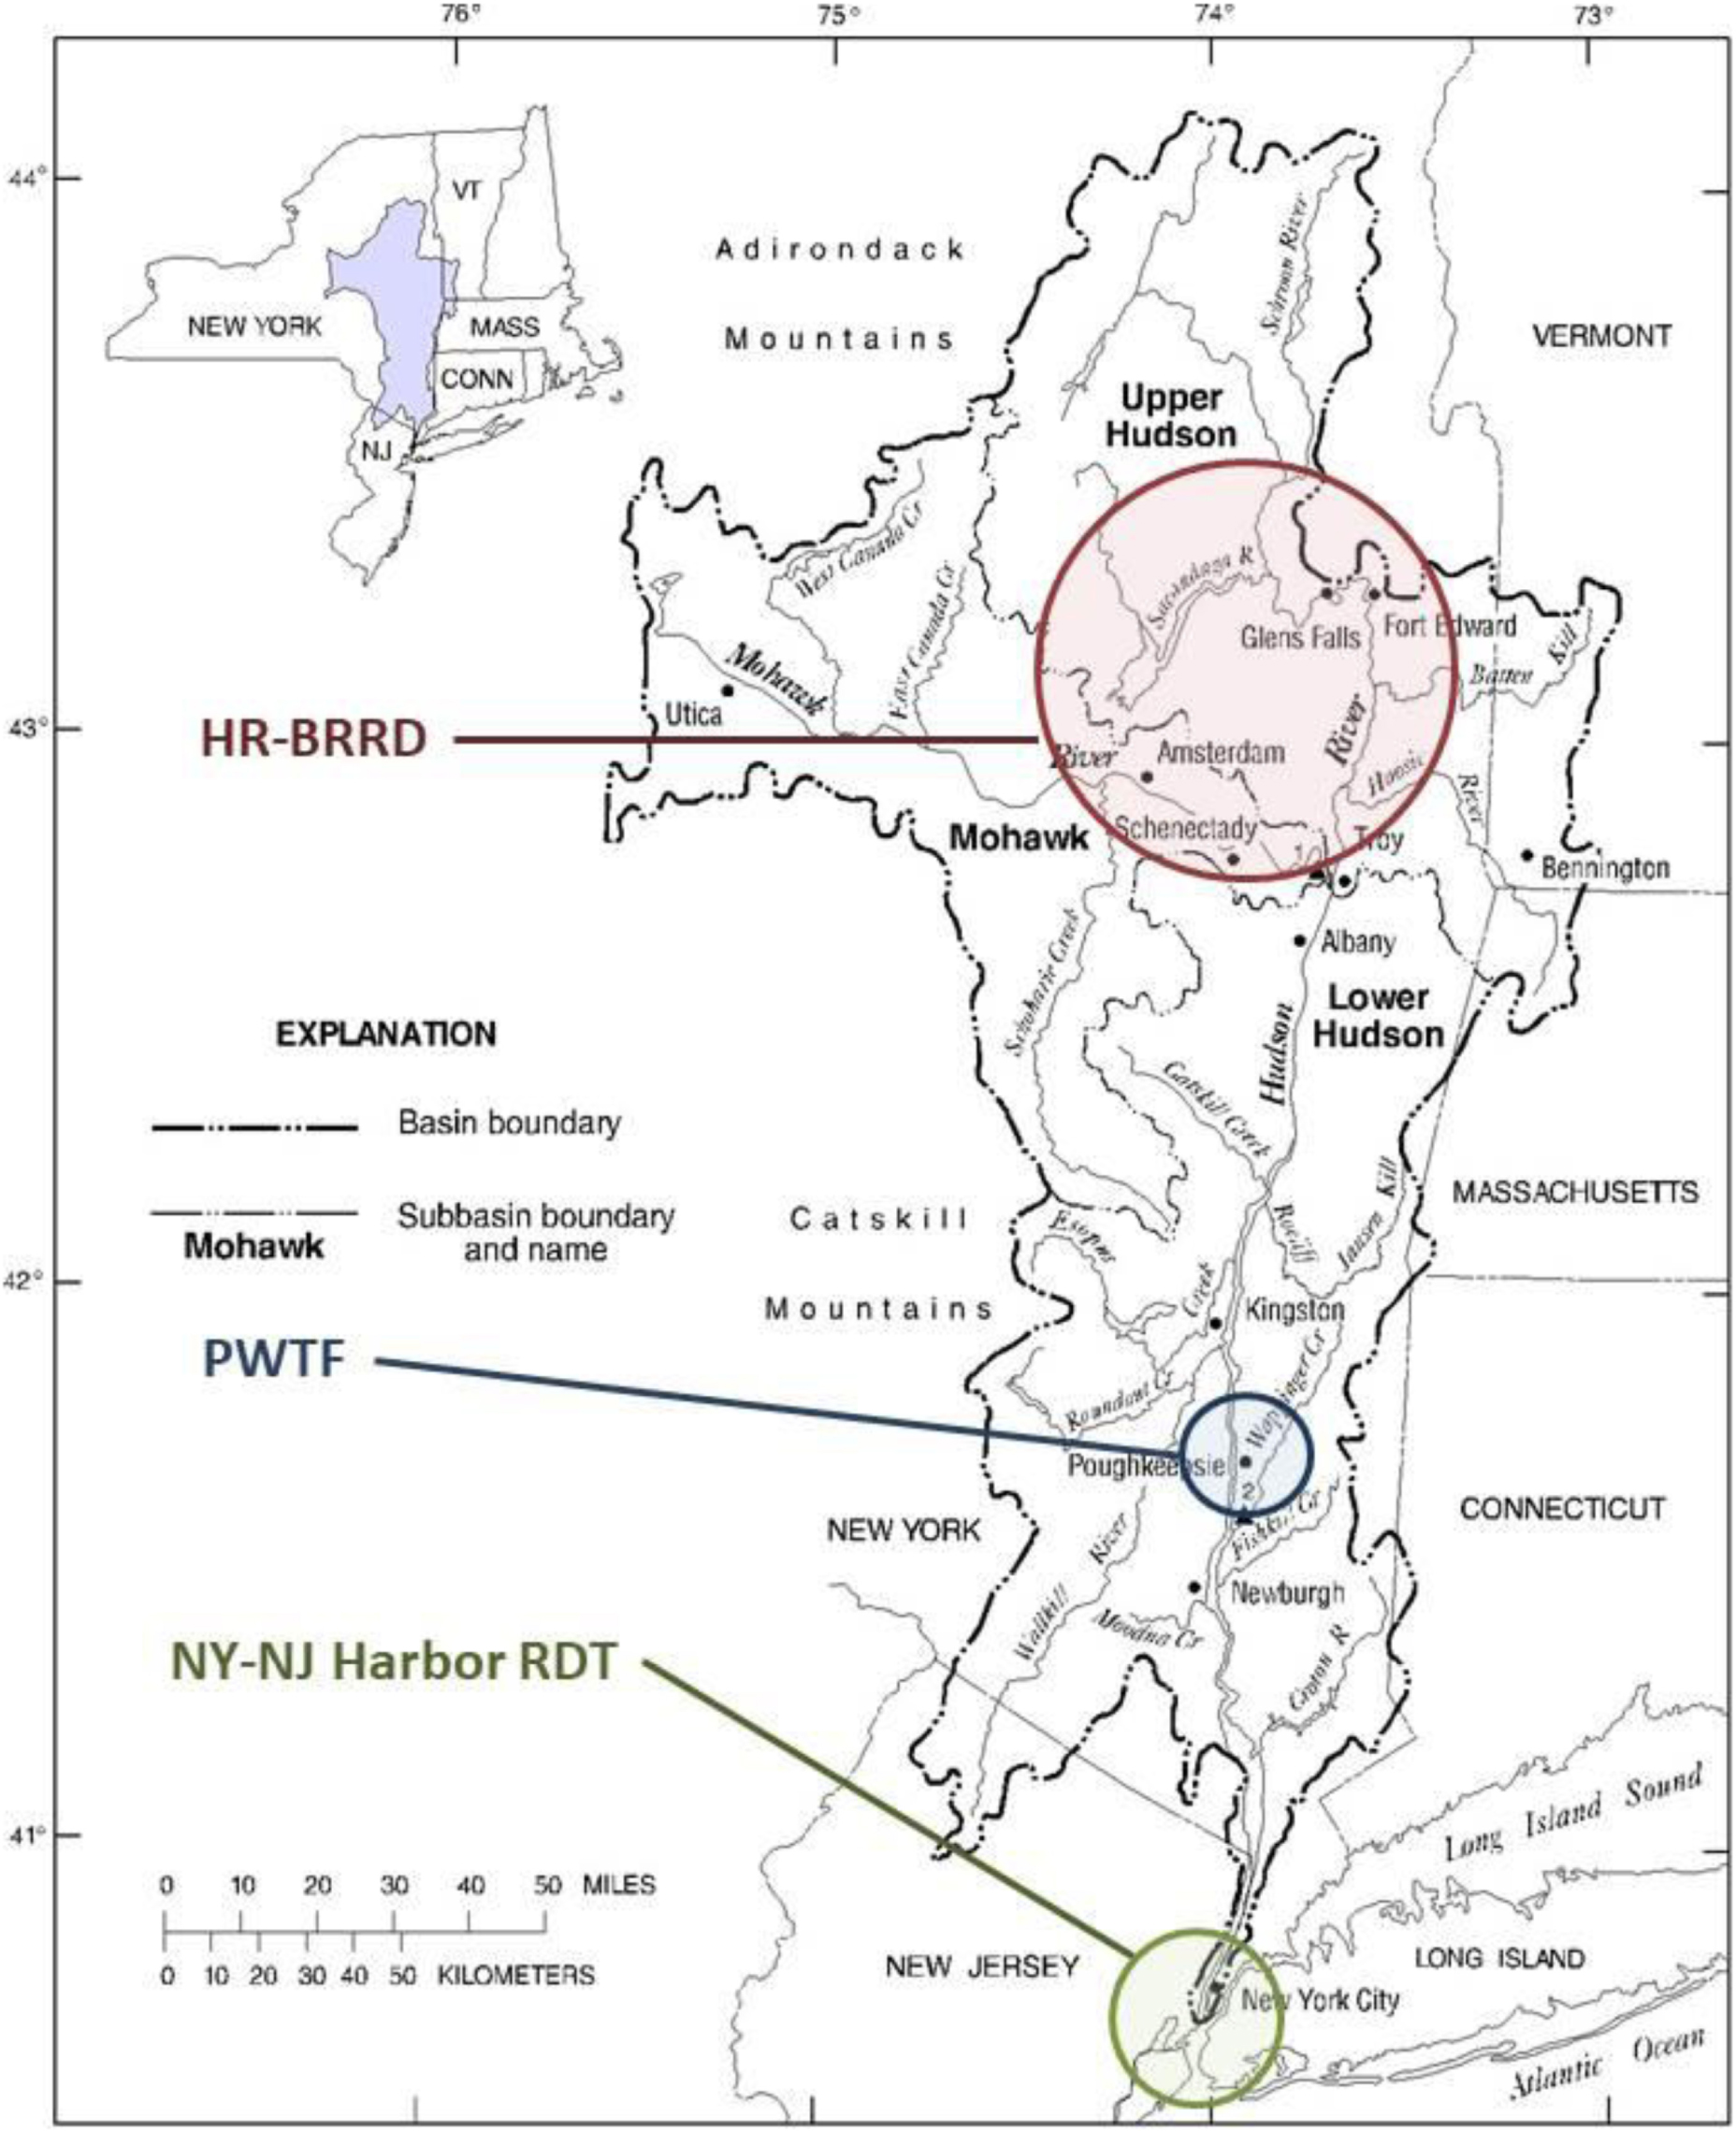
Figure 2. Three seemingly detached management regimes for different ecosystem services in the Hudson River: (a) channel deepening: New York-New Jersey Harbor Regional Dredging Team (NY-NJ Harbor RDT); (b) drinking water withdrawals: Poughkeepsie Water Treatment Facility (PWTF); and (c) hydroelectric power and regulation of downstream freshwater flows: Hudson River-Black River Regulating District (HR-BRRD). Base map from the US Army Corps of Engineers (1982).
During periodic drought events affecting freshwater stocks and flows in the Hudson River, the salinity intrusion occasionally can move far enough up the estuary to intersect the Poughkeepsie drinking water intake (Greer, 1985; Wolff, 1989; Hanley, 1995; Revkin, 1995). The position of a “salt line,” defined as a salinity level of 100 mg/L of chloride, is monitored closely by the PWTF in order to protect public health. Drinking water consumers are notified when salinity levels reach 20 mg/L of sodium (about 36 mg/L of chloride), and water withdrawals must be stopped when they exceed a regulatory threshold of 140 mg/L of sodium (250 mg/L chloride) until the salt line recedes downstream (Poughkeepsie Water Treatment Facility (PWTF), 2018). (Notably, the water treatment facility at Poughkeepsie is not equipped for desalination.) This interruption of withdrawals can be short-term, thereby causing little or no disruption of service, or longer-term, involving the discontinuation of drinking water supplies for an extended period. The latter situation is most likely to occur under conditions of regional drought, when river flows are abnormally low. During the last six decades, the temporary discontinuation of water withdrawals has occurred several times, most notably during the years of 1964, 1985, 1995, and 2002.
In 2000, due to the need to relicense several hydropower plants located on the upper Hudson River, an “Upper Hudson/Sacandaga River Offer of Settlement” (Settlement Offer) was negotiated among the owners of the plants and several other water users (Federal Energy Regulatory Commission (FERC), 2000). The Offer constitutes an agreement to allocate water resources in the Hudson River and Black River Regulating District (HR-BRRD), an administrative region within which hydropower generating facilities are regulated by the US Federal Energy Regulatory Commission (FERC). The stakeholders included hydropower generators, federal and state resource management agencies, municipalities, New York’s Adirondack State Park, tourism businesses, residents, seasonal visitors, and environmental groups. The water users have a variety of interests in upper Hudson River water flows, including electricity generation, maintenance of reservoir levels, fish and wildlife habitat, flood control, tourism and recreation, and “augmented” downstream river flows, among others.
One of the principal responsibilities of the HR-BRRD under the terms of the Settlement Offer is to regulate river flows within the Upper Hudson system. Flow regulation involves flood control during the spring freshet or heavy precipitation events (storms) and the maintenance of minimum flows, especially during the late summer and early autumn. Flows are regulated mainly through controls or discharges of water from Great Sacandaga Lake (GSL), which is a 105 km2 manmade reservoir located wholly within New York’s Adirondack State Park. The reservoir was created in 1930 through the construction of a 335 m long by 30.5 m high earth and concrete dam on the Sacandaga River at Conklingville, New York. The dam also is the site of the E.J. West Project No. 2318 hydropower facility, which is operated by Erie Boulevard Hydropower L.P. The power generated by the plant depends upon both the elevation (head) of the water in the reservoir and the flow through the plant. For the fixed minimum flows required by the Settlement Offer (Federal Energy Regulatory Commission (FERC), 2000, §3.4; Federal Energy Regulatory Commission (FERC), 2002, p. 8, ¶20), the potential power output depends chiefly upon the level of the reservoir’s head (Oak Ridge National Laboratory (ORNL), 2011, p. 22).
The Settlement Offer includes provisions for augmenting downstream river flows under certain conditions. These conditions relate primarily to the maintenance of habitat for fish and wildlife or improvements in water quality (Federal Energy Regulatory Commission (FERC), 2000, p. 3.4). The idea of augmenting downstream flows in the Upper Hudson has been a contentious one, because it implies a drawdown of the level of the lake that could affect both access to and enjoyment of recreation activities on the lake (Wolff, 1989). This is particularly the case during late summer periods of low precipitation or drought when recreation is at its peak, such as during the months of July through September. The language of the Settlement Offer also focuses on augmenting downstream flows for river-based recreation, including whitewater rafting and the supply of water to a canal (the “Feeder Canal”) between Glen’s Falls and Fort Edward, which is now a recreational facility for canoeing and kayaking.
Although the Settlement Offer does not refer explicitly to the need for augmentation to counteract an upstream salt intrusion at Poughkeepsie (or at other minor drinking water withdrawals on the Hudson), it does refer to HR-BRRD’s authority to draw the lake below its minimum mandated level “…because of critical low flows in the Hudson River which adversely affect water quality conditions…” (Federal Energy Regulatory Commission (FERC), 2000, §3.4.1). Importantly, NY State’s emergency management plan for drought assigns authority to HR-BRRD and other state and federal agencies to “manage the water resource[s] of the state to support emergency drought efforts” (New York State Disaster Preparedness Commission (NYSDPC), 2016). In its waterbody inventory, the State’s Division of Water has explained that, during drought years, “water had to be released in order to keep the salt front on the Hudson River below the Poughkeepsie water intake” [emphasis added] (Division of Water (DoW), 1998).
The process of augmenting Hudson River flows with GSL releases to protect the PWTF drinking water intake from salt intrusion remains informal but straightforward, based upon discussions with officials at PWTF, HR-BRRD, and the Division of Water (contacts available upon request). Specifically, if salinity levels were to exceed a threshold of 100 mg/L of sodium, a request would be made by the PWTF through the Division of Water to the HR-BRRD to augment downstream Hudson River flows via releases of water from Great Sacandaga Lake (Poughkeepsie Water Treatment Facility (PWTF), 2015). In late August 1995, such a request was made by PWTF during a drought, and water was subsequently released from the lake (US Geological Survey (USGS), 1999; Bowen and Geyer, 2003).
Hudson River and Estuary 1995 Case Study
To assess the potential consequences of elevated salinity levels reaching Poughkeepsie’s drinking water supply, an integrated modeling framework was designed and implemented to investigate the conditions of the Hudson River during the drought of 1995 as a case study. The case study analyzed as a counterfactual the additional volume of freshwater from Great Sacandaga Lake that would have been required in 1995 with a deepened NY-NJ Harbor channel to augment river flows in order to prevent the salt line from intersecting the Poughkeepsie drinking water intake. Both the volume of augmented flows and the level of Great Sacandaga Lake at the time of release are important factors in estimating consequent potential losses of electricity generating power. Further, the study developed estimates of the potential economic losses to the hydroelectric plant at the Conklingville Dam and the costs of replacement power and increased carbon dioxide emissions from fossil-fuel sources that would result from the reservoir’s lower head due to downstream flow augmentation.
Materials and Methods
The case study methodology comprised the integration of four distinct modeling components (Figure 3). The first component involved simulating the hydrodynamics of the Hudson River to constrain the distribution of salinity under two distinct bathymetric scenarios: before and after the recent channel deepening in the NY-NJ Harbor. In the face of a drought of the severity of the one that occurred in 1995, a second component transformed predictions from the hydrodynamic simulations into estimates of the volume of freshwater required to be released from Great Sacandaga Lake to augment upper Hudson River flows in order to prevent the salt line from intersecting the drinking water withdrawal at Poughkeepsie. The third component estimated a time distribution for the return period of a drought of the level of severity of the one that occurred in 1995, using an extreme-value approach to analyze historical data. The fourth component tied the preceding components together to evaluate the scale of potential economic losses expected as a consequence of a reduced hydropower head in Great Sacandaga Lake.
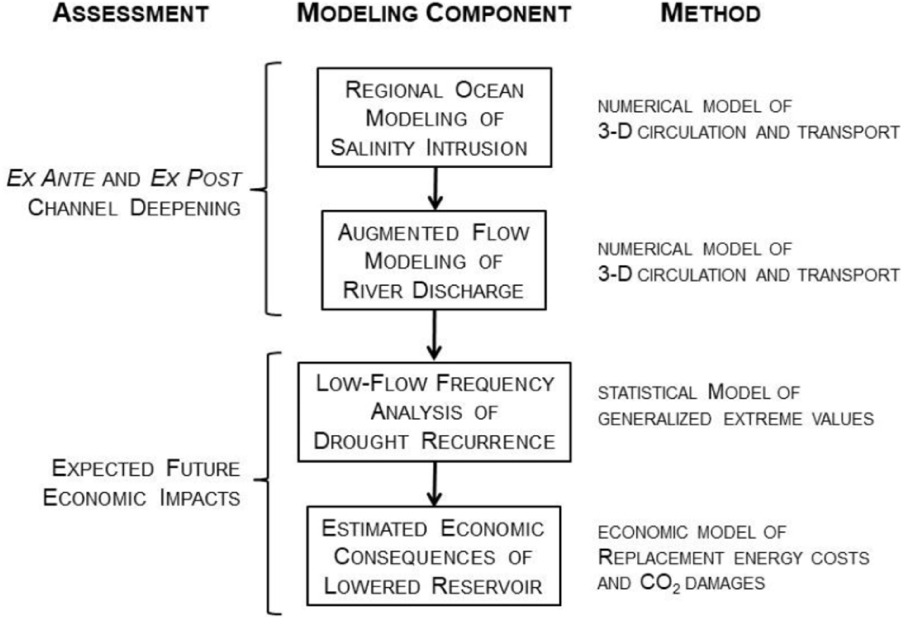
Figure 3. An integrated modeling framework for source-to-sea management.
Regional Ocean Modeling
To evaluate the effects of bathymetric changes from dredging on the salinity distribution in the Hudson, simulations were run using a 3-D circulation and transport numerical model of the estuary. The model is an application of the Regional Ocean Modeling System (ROMS), and it has been previously developed and evaluated extensively against observations of salinity and other environmental parameters in the Hudson (Warner et al., 2005; Ralston et al., 2012, 2013). The geographic domain of the model extends from Upper New York Harbor and the East River northward to Troy, New York, where a dam and a set of locks are located. Poughkeepsie is situated approximately 120 km south of Troy, and 120 km north of Upper New York Harbor (Figure 2). Additional details on the model grid and forcing configuration are found in Ralston and Geyer (2019).
Because the city of Poughkeepsie’s primary source of drinking water is the Hudson River, interest centered on model predictions of salinity in the proximity of the drinking water withdrawal near the river bed. The average salinity in the ocean is approximately 35 practical salinity units (psu), a measure based upon the properties of seawater conductivity. (A public notification threshold for drinking water withdrawals is less than one-hundredth the value of oceanic salinity, or 0.324 psu).
The salinity intrusion in the Hudson varies seasonally with river discharge and on spring-neap time scales with differences in tidal mixing, such that the location of the interface between salt and fresh water can range naturally between about 40 km from the Battery in lower Manhattan (near Piermont, NY) and 120 km (near Poughkeepsie) (Ralston et al., 2008). The salinity intrusion responds dynamically to changes in forcing at time scales similar to or longer than the meteorological time scale of a discharge event (MacCready, 2007), so, to limit the effects of this temporal response factor, simulations were run with constant river discharges and an idealized spring-neap tidal forcing. After the simulations reached a quasi-equilibrium state varying only with the spring-neap forcing, the average salinity distribution in the model was evaluated to relate salinity intrusion lengths, or upstream positions of the salt front as defined by the threshold salinity, to river discharges (Supplementary Material S1).
To quantify how the NY-NJ Harbor deepening that began in 2004 and was completed by 2016 would have altered the location of the salinity intrusion during the drought in 1995, the model was run using both pre- and post-deepening bathymetric conditions. The model grid spacing and boundary forcing otherwise were identical for the two bathymetric cases. The post-deepening case incorporated bathymetric survey data from the Army Corps made after completion of the channel modifications, and, in regions that were unaffected by the deepening project, it used the most recent bathymetric survey data from NOAA (Ralston et al., 2019). For the bathymetry representative of conditions in 1995, regions of the estuary that were affected by the deepening project were returned to their pre-project depths based on NOAA charts. For example, in 1995 the controlling depth in Ambrose Channel at the mouth of the estuary was 13.7 m mean low-lower water (MLLW), and the deepening project lowered it to 16.5 m MLLW. To assess the impacts of the deepening on the salinity intrusion, the model was run for both bathymetric cases, using realistic forcing for the drought period in 1995, and model results were compared with USGS observations of salinity at Poughkeepsie during the same period. The salinity at Poughkeepsie in the model increased for the post-deepening bathymetry, as expected, but the agreement with the observed salinity was better for the case with bathymetry from 1995 (Ralston and Geyer, 2019).
Augmented Flow Modeling
The relationship between discharge and average salinity intrusion length was evaluated using constant discharge simulations for both bathymetric configurations to estimate river discharges both ex ante and ex post. The ex ante scenario refers to the baseline 1995 condition of a regional drought during which the salinity threshold at Poughkeepsie was exceeded, and Hudson River flows were augmented by releases from Great Sacandaga Lake in order to push the salt line to a position downstream from the Poughkeepsie drinking water intake. The ex post scenario was a counterfactual, identical to the ex ante scenario in all respects, except that the ROMS simulations were carried out with a bathymetry that reflected present-day channel deepening in the relevant portions of the lower Hudson estuary.
Supplementary Figure S2 shows the observed daily flows in 1995 measured by a river flow gauge at Green Island, New York. The area below the ex ante flow rate represents the estimated volume of additional water required in 1995 to augment downstream river flows to reduce the risk of salinity intrusion to a fixed percentage. Analogously, the area under the ex post flow rate represents the estimated volume of additional water that would be required with a deepened channel. The difference between the two areas represents the expected additional volume of water required as a direct result of channel deepening.
Low-Flow Frequency Analysis
Next, using extreme value theory, the return period of river flows having a magnitude equal to the low flows observed in 1995 was estimated (Supplementary Material S2). In studies of the effects of climatic conditions on river flows, extreme value theory is referred to typically as “low-flow frequency analysis” (World Meteorological Organization (WMO), 2009). It has been documented that the salinity intrusion observed at Poughkeepsie in 1995 was the result of an extended period of low river flow conditions (Supplementary Figure S3). Because of this, historic river flow data was used as a proxy for drought conditions. (Flows at the USGS stations at Green Island, Cohoes, and Waterford were used to compile historic time series of daily flows from 1931 to 2015 for the Hudson River).
Estimated Economic Consequences
The release of water from Great Sacandaga Lake to augment downstream flows results in a lowered lake elevation (reservoir head). We relied upon measured relationships among the lake’s elevation, water volume, and hydropower generation to characterize the main economic consequences of the deepening of the NY-NJ Harbor and Estuary (Oak Ridge National Laboratory (ORNL), 2011).
Great Sacandaga Lake has a usable storage volume of about 850 million m3 at elevations between 235 and 226 m (Oak Ridge National Laboratory (ORNL), 2011). The lake’s elevation can vary significantly during the year, and Supplementary Figure S4A shows a roughly linear storage-elevation curve, relating the volume of water in the lake to its elevation, and indicating a change in lake height of about 0.9 m corresponding to a volume change on the order of 100 million m3 (Oak Ridge National Laboratory (ORNL), 2011, p. 12).
The generation of electricity through a reservoir hydropower facility depends upon both the reservoir’s head and the flow of water through the plant. Management of the GSL reservoir according to the Settlement Offer requires a minimum flow through the E.J. West hydropower plant in order to benefit downstream hydropower facilities. Although models have been developed to estimate the relationship between water flow and electricity generation at the E.J. West plant based upon privately supplied data (Oak Ridge National Laboratory (ORNL), 2011), public data exist only on the relationship between the GSL head and the generating potential, presumably at flow levels needed to meet the terms of the Settlement Offer. Supplementary Figure S4B depicts the relationship between the elevation and the generating capacity of the plant, ranging from 17.5 MW at full pool (235 m) to 9.4 MW at an elevation of 226 m. Electric generating capacity declines by 0.41 MW for every meter that the lake is lowered at elevations between 235 and 232 m; it declines at a faster rate of 1.17 MW for every meter lower at elevations between 231 and 226 m. Here, the published relationship between the GSL head and the E.J. West plant’s generating capacity was used as a basis for approximating the economic consequences associated with the release of water to augment flows downstream.
Data were compiled on biweekly levels of the elevation of Great Sacandaga Lake during 1995 (US Geological Survey (USGS), 2018). Using the lake’s capacity-elevation relationship, the time distribution of power generated by the E.J. West plant during 1995 was approximated. The same approach was implemented for the counterfactual case of the occurrence of a 1995 drought with the deepening of the NY-NJ harbor channel. In this case, the reduction in hydropower output resulting from a requirement to release more water downstream in the counterfactual case served as the basis for measuring an external effect of the deepened channel.
The economic effect of the loss of hydropower services due to the need to augment flows downstream was estimated as the difference between the variable unit (operating and maintenance) costs of the hydroelectric plant and the sum of the load-based marginal price of electricity generation in the NY Adirondack region plus the social costs of carbon resulting from the burning of natural gas:
where ΔWAF comprises the expected change in welfare (expected economic loss) associated with a requirement to release water from the GSL pool to augment flows downstream; E is the expected value of the bracketed expression; VCH is the variable unit cost per kilowatt-hour of the E.J. West hydropower plant at the Conklingville Dam; LBMP is the load-based marginal price per kilowatt-hour of the last unit of generating capacity, which must replace the lost hydropower (assumed here to be supplied by a natural gas plant); SCC is the social cost of carbon (SCC) (or carbon price) per kilowatt-hour; HAF is the amount of electric generating capacity in kilowatt-hours that is lost to hydropower due to the reduced head in the GSL reservoir, which must be replaced by the gas turbine plant; and r is a social discount rate.
Several important assumptions were made in developing estimates of the potential economic consequences associated with the counterfactual. Where uncertainties existed about parameter values, such as the cost differential between hydropower and replacement electric power, or reasonable choices of analytical values, such as the discount rate or the SCC, we have developed plausible ranges of expected losses. These ranges were used to demonstrate the sensitivity of the model to uncertainty or to parameter choice. Sensitivities for specific parameters were examined using the mean or most likely measures of central tendency for all other parameters.
Importantly, it was assumed for this analysis that the water released from the GSL reservoir to meet the requirement to maintain potable drinking water at Poughkeepsie would not be replenished naturally until the spring freshet the following April. In fact, three storms in October 1995 did result in the partial replenishing of upper Hudson River flows (Supplementary Figure S2; Bowen and Geyer, 2003). Nevertheless, a net loss of water from the reservoir – relative to the 1995 baseline – was assumed in the counterfactual, even during the autumn partial replenishment period. Consequently, there was a net loss of hydropower generation from the time of the release at the end of August until the annual replenishment of the pool in April. (Further, 1995 winter-spring data were utilized to approximate the baseline during the 1996 winter-spring period.) Two-week intervals comprised the time-step for the economic component, and the entire augmented flow was assumed to have occurred during the first 2-week period after which it had been requested by PWTF, beginning on August 27.
The loss of hydropower generation was assumed to have been made up by electricity sourced from an electric utility powered by natural gas (cf., Oak Ridge National Laboratory (ORNL), 2011). Data on unit operation and maintenance costs for the E.J. West plant of $0.043 kWh–1 (2018 dollars) were obtained from the Idaho National Engineering and Environmental Laboratory’s Hydropower Resource Economics Database (IHRED) (Hall et al., 2003). It was assumed that the replacement power would be supplied at a marginal cost equal to the price of electricity. During 2013–15, the mean monthly LBMP of electricity in the Hudson Valley region averaged $0.38 ± $0.23 kWh–1 (one s.d. variation; 2018 dollars). The difference between the unit cost of the E.J. West plant and the price of replacement electricity is roughly consistent with national data, which indicate that, on average, the unit cost of electricity produced by gas turbines can be as much as an order of magnitude more than the unit cost of electricity produced by hydropower (Energy Information Administration (EIA), 2019; Table 8.4). An average ratio of the price of replacement electricity to the cost of hydropower of 8.80 was used to estimate welfare changes, and a range based upon one standard deviation for the LBMP of 3.55–14.04 was used to examine model sensitivity.
The social cost of carbon (SCC) comprises the discounted present value of the potential economic damages believed likely to result from increases in CO2 levels in the atmosphere, leading to climate changes such as temperature increases, increased intensity or frequency of tropical cyclones, droughts, sea-level rises, or public health effects, among other impacts. Estimates of the SCC are subject to much uncertainty, as they rely upon integrated-assessment modeling frameworks that project these future damages for many decades into the future. These estimates also are sensitive to the choice of discount rate used to calculate the present value of future damages. Here, estimates of the SCC rely upon a summary of recent research and model results, deflated into 2018 dollars (Interagency Working Group on the Social Cost of Carbon (IAWG), 2015). A best estimate of $67.81T–1 CO2, based upon a discount rate of 2.5% was used, with a range of $13.32T–1 (at 5%) to $127.15T–1 (at the 95% c.i. for 3%) to examine model sensitivity. Replacement natural gas was assumed to yield 0.55 kg⋅kWh–1 of CO2.
The present value of the estimated welfare change was estimated as a perpetuity, using a discount rate of 2.5%, and a range of discount rates from 1 to 7% were used to examine model sensitivity. The odds of an estimated annual occurrence of a 1995 low-flow event of 20:1 was used to estimate an expected economic damages, with odds of 12:1 and 97:1 around this estimate to examine model sensitivity (95% c.i.; Supplementary Table S1).
Results
The ROMS hydrodynamic model was used to simulate the risks of exceeding drinking water salinity thresholds at the Poughkeepsie water intake during the low discharge period of 1995, comparing results from the baseline case using bathymetry from 1995 with results using bathymetry from 2015 that incorporated the most recent channel deepening in NY Harbor. The relationships between river discharge and salinity intrusion derived from the ROMS simulations for the two bathymetry cases were used to calculate estimates of the additional water volumes, relative to the 1995 bathymetry case, that would have been required with the post-dredging bathymetry to augment the downstream flow from Great Sacandaga Lake for risks of exceeding the drinking water salinity threshold at Poughkeepsie of 1 and 5% of the time (Supplementary Table S2). Both the minimum and maximum volumes were calculated using flow rates estimated at the 95% confidence intervals. For an exceedance of the threshold salinity at the Poughkeepsie drinking water withdrawal occurring 1% of the time, the volume of water needed to augment river flows to move the salt line downstream away from the withdrawal ranged from 271 to 477 million m3.
The duration of low river flow is a critical factor affecting the salinity intrusion length. A scenario representative of a 30 days drought was modeled. This was achieved by applying moving averages of that duration to the transformed daily river flow data (Supplementary Figure S3) from which annual minima were subsequently generated. The GEV distribution was fitted to this scenario (Supplementary Figure S5 and Supplementary Table S2). Following Coles (2001), the model was checked for goodness of fit using a probability plot (Supplementary Figure S5A) and a quantile plot (Supplementary Figure S5B). The absence of significant departures from linearity in these plots indicated good model choice. The density estimate was consistent with a histogram of the observed data (Supplementary Figure S5C), lending further support to the GEV model.
A comparison of the 1995 baseline with the counterfactual, post-dredging case, evaluated at the means or most likely values of model parameters, demonstrated a significant loss in hydropower generation at the Conklingville Dam, ranging from 1,236 to 1,654 MWh during each 2-week period following the release of water to augment flow downstream (Figure 4). Under the counterfactual scenario, over the course of the year, it was estimated that more than 27,000 MWh of electric generating capacity would be lost. This loss of hydropower would translate into a $1.0 million welfare loss for an individual drought event equivalent to the 1995 drought. If droughts of that type were to be experienced every year into the future, the present value of total economic damages would amount to $40.5 million, using a discount rate of 2.5%. Assuming a mid-range return period of 20.3 years for a 1995-scale drought (Supplementary Table S1), the expected present value of total economic damages as a consequence of channel deepening in the NY/NJ Harbor would be $2.0 million.
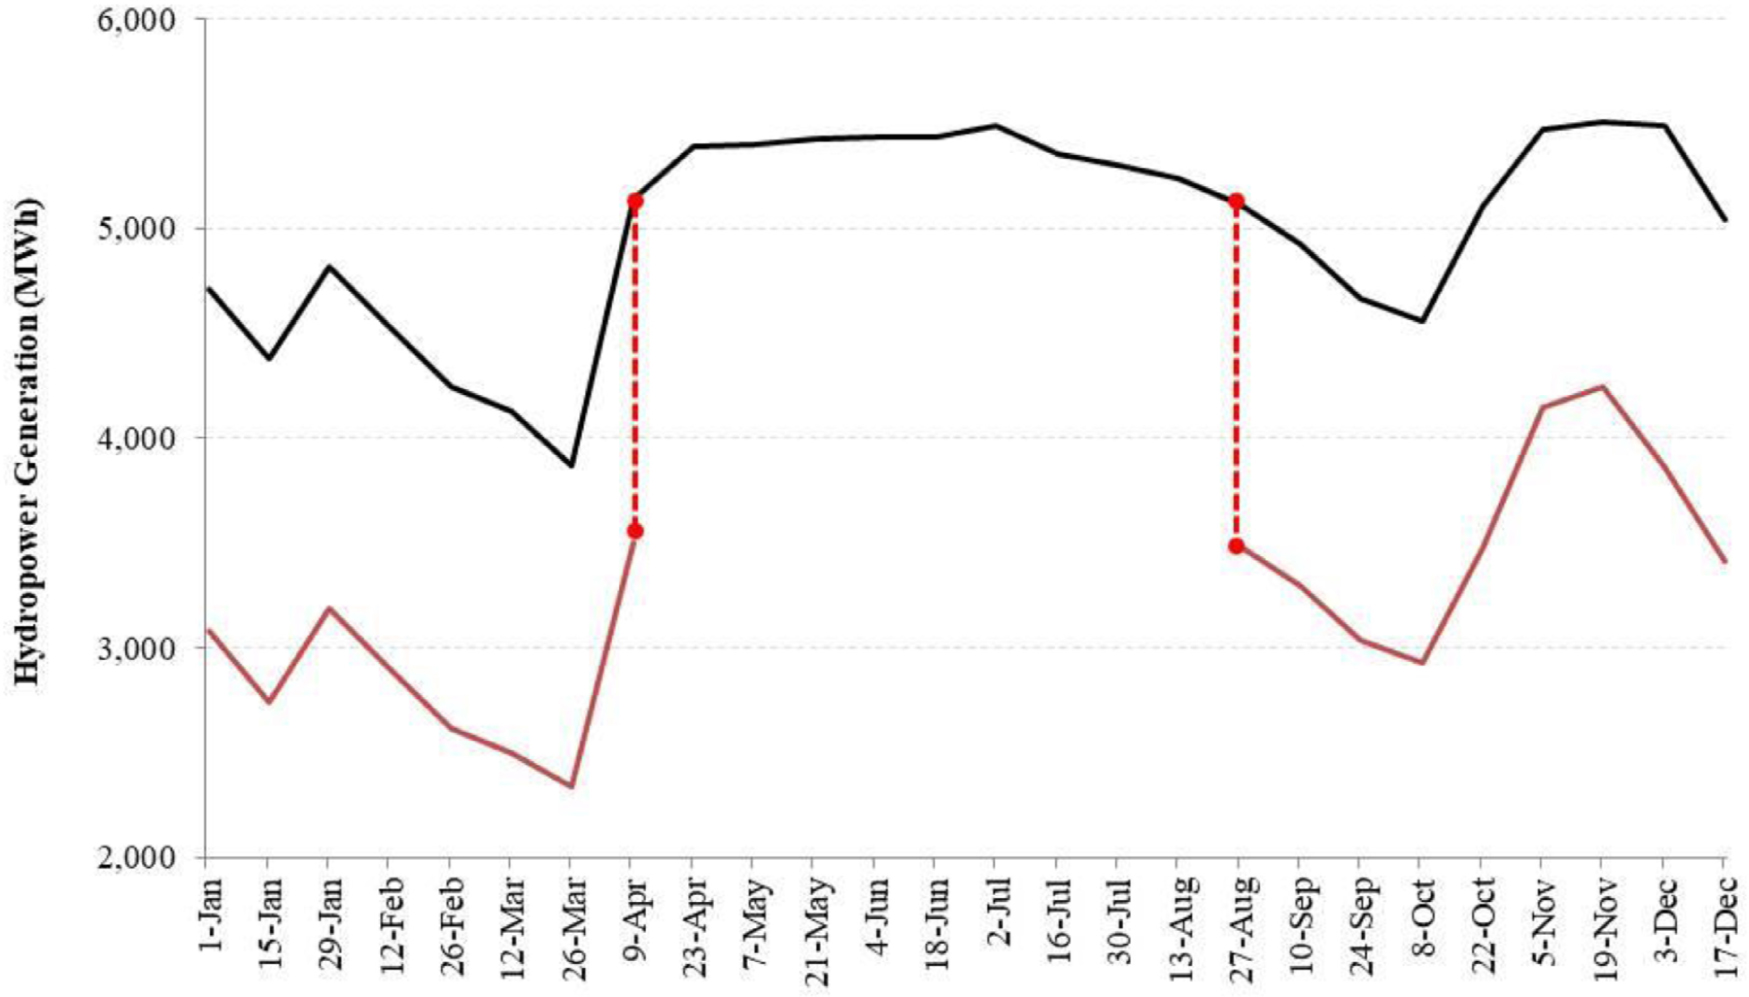
Figure 4. Simulated losses in hydropower generation (MWh/2wk) at the Conklingville Dam as a consequence of the release of water to augment flows downstream at the Poughkeepsie Water Treatment Facility. Simulation carried out at the central values of all varying parameters (see Supplementary Figure S6). Black: actual 1995 generation; red: counterfactual 1995 generation with a deepened channel. Augmented flows were assumed to have been implemented during the fortnight beginning on August 27, 1995; the GSL was assumed to have been replenished to normal levels with the spring freshet by April 23, 1996.
Supplementary Figure S6 depicts the welfare effects of changing model parameter values on expected losses. While the cost of electric power from a gas turbine is an order of magnitude larger than that of hydropower, the model is not very sensitive to variation in the cost markup. Further, the model appears to be only moderately sensitive to estimates of the volume of water required to be released from GSL to augment downstream flows and to the return period of a 1995-scale drought. The model is most sensitive to the choices of both the discount rate and the SCC. Using the extremes of all parameter values, estimates of the expected present value of total economic damages ranged from to $0.02 to $19.5 million.
Discussion
The potential for adverse effects due to channel deepening in NY/NJ Harbor is not an isolated case, as other harbors now are being dredged to 14–15 m, and withdrawals of upstream river waters for drinking or industrial cooling purposes are likely to be affected by these changes as well as by rising sea-levels (cf., Shirazi et al., 2019). Nearly half a century ago, the potential effects of channel deepening on estuarine salinity distributions had been subject to preliminary investigation by the Army Corps for several US estuaries (Wicker, 1969; Brogdon, 1986). It was long suspected that significant increases in the natural depths of most estuaries due to the dredging of navigational channels could lead to saltwater intrusions, but until recently there had been little documentation of the scale of potential impacts (Permanent International Association of Navigation Congresses (PIANC), 1993, App. 3). Some provisioning services now may be especially at risk, including, for example, municipal drinking water withdrawals at Savannah on the Lower Savannah River (Conrads et al., 2010) and at Philadelphia on the Delaware River (Harris, 2012).
In the latter case, during the extended 1961–67 drought-of-record, the water intake for Philadelphia’s Baxter Water Treatment Plant, located at river-kilometer 177, was threatened when the salt line moved up to only a few kilometers downstream from the intake. Since 1931, Delaware River freshwater resources have been subject to flow requirements as set forth in two US Supreme Court decisions, which allocated maximum withdrawals both from Delaware River headwater reservoirs to New York City, in order to meet its drinking water needs, and minimum flow reservoir releases downstream to protect fisheries habitats (so-called “conservation releases”) and other freshwater withdrawals. Agreements reached through the interstate compact that established the Delaware River Basin Commission (DRBC) in 1971 led to an adaptive management process for regulating water flows in the Delaware, involving the careful monitoring of stocks and flows of freshwater from several reservoirs to insure against the possibility of localized shortfalls during periods of low precipitation. Known as the “flexible flow management program,” this process for balancing competing claims for water uses recently has been extended for another decade (Delaware River Basin Commission (DRBC), 2017).
These procedures for balancing water uses in the Delaware system are evidently adequate for mitigating lower than normal precipitation events in local areas, but they may be less than sufficient for more widespread regional droughts of long duration (Perkey et al., 1983). Nevertheless, for the most part, the DRBC has enabled its four voting state parties (NY, NJ, PA, and DE) and two non-voting cities (New York and Philadelphia) to reach negotiated solutions to water allocations, thereby avoiding litigation (Mandanaro and Mason, 2013). In the future, this issue may grow in significance, as atmospheric temperatures increase on average, thereby expanding the demand for freshwater, and as sea-levels rise, helping to shift salinity intrusions further up into the estuary. A former executive director of the DRBC reportedly stated that “…[i]f we had a multi-year drought in 2050 like we had in the 1960s, the salt line would be four miles [6.4 km] above Philadelphia’s water intake point…” (emphasis added) (Harris, 2012).
While it has been beyond the scope of this paper to examine interbasin linkages, the drinking water needs of New York City certainly provide the clearest example of how the hazards of low precipitation events in combination with increasing rates of sea-level rise are jointly distributed across the Delaware and Hudson systems. The City draws nearly half of its daily quantity of drinking water from reservoirs in the Catskill/Delaware Watersheds that serve as headwaters for the Delaware River (Figure 5). During a low precipitation period, this withdrawal likely would constrain the flow down the main stem of the river, subject to the regulatory requirements for minimum flows described earlier. During a severe drought, if New York City were to maintain its allotted withdrawal of 3.03 million m3d–1 (Delaware River Basin Commission (DRBC), 2017) and if minimum downstream flows cannot be maintained, then it is plausible that the drinking water withdrawal at Philadelphia could be threatened by the Delaware salinity intrusion. If New York City were to reduce its withdrawal from the headwater reservoirs to maintain flows in the Delaware, then it must make up the water from some other source. The most probable source is to pump water from the Hudson at its pumping station in Chelsea, New York, located at Hudson river-kilometer 100, downstream from Poughkeepsie. This location experiences salinity intrusion much more frequently than Poughkeepsie, and water for the purpose of New York City’s drinking water supply would need to be diluted with water supplied by aqueduct from the headwater reservoirs. Significant withdrawals at Chelsea, however, could exacerbate the salinity intrusion in the Hudson, causing it to move further upstream to threaten the Poughkeepsie drinking water withdrawal (Weiss et al., 1994). While this scenario seems mostly hypothetical, the Chelsea Pumping Station has been utilized periodically to ensure that it would function in such an event, and the US Geological Survey has been studying the factors that lead to salinity intrusion in the Hudson, including pumping at Chelsea (deVries and Weiss, 2001). The scenario is made more likely in the event of a severe drought, in an environment in which drinking water consumption is growing, where the rate of sea-level rise is increasing, and where NY-NJ Harbor channels have been deepened significantly.
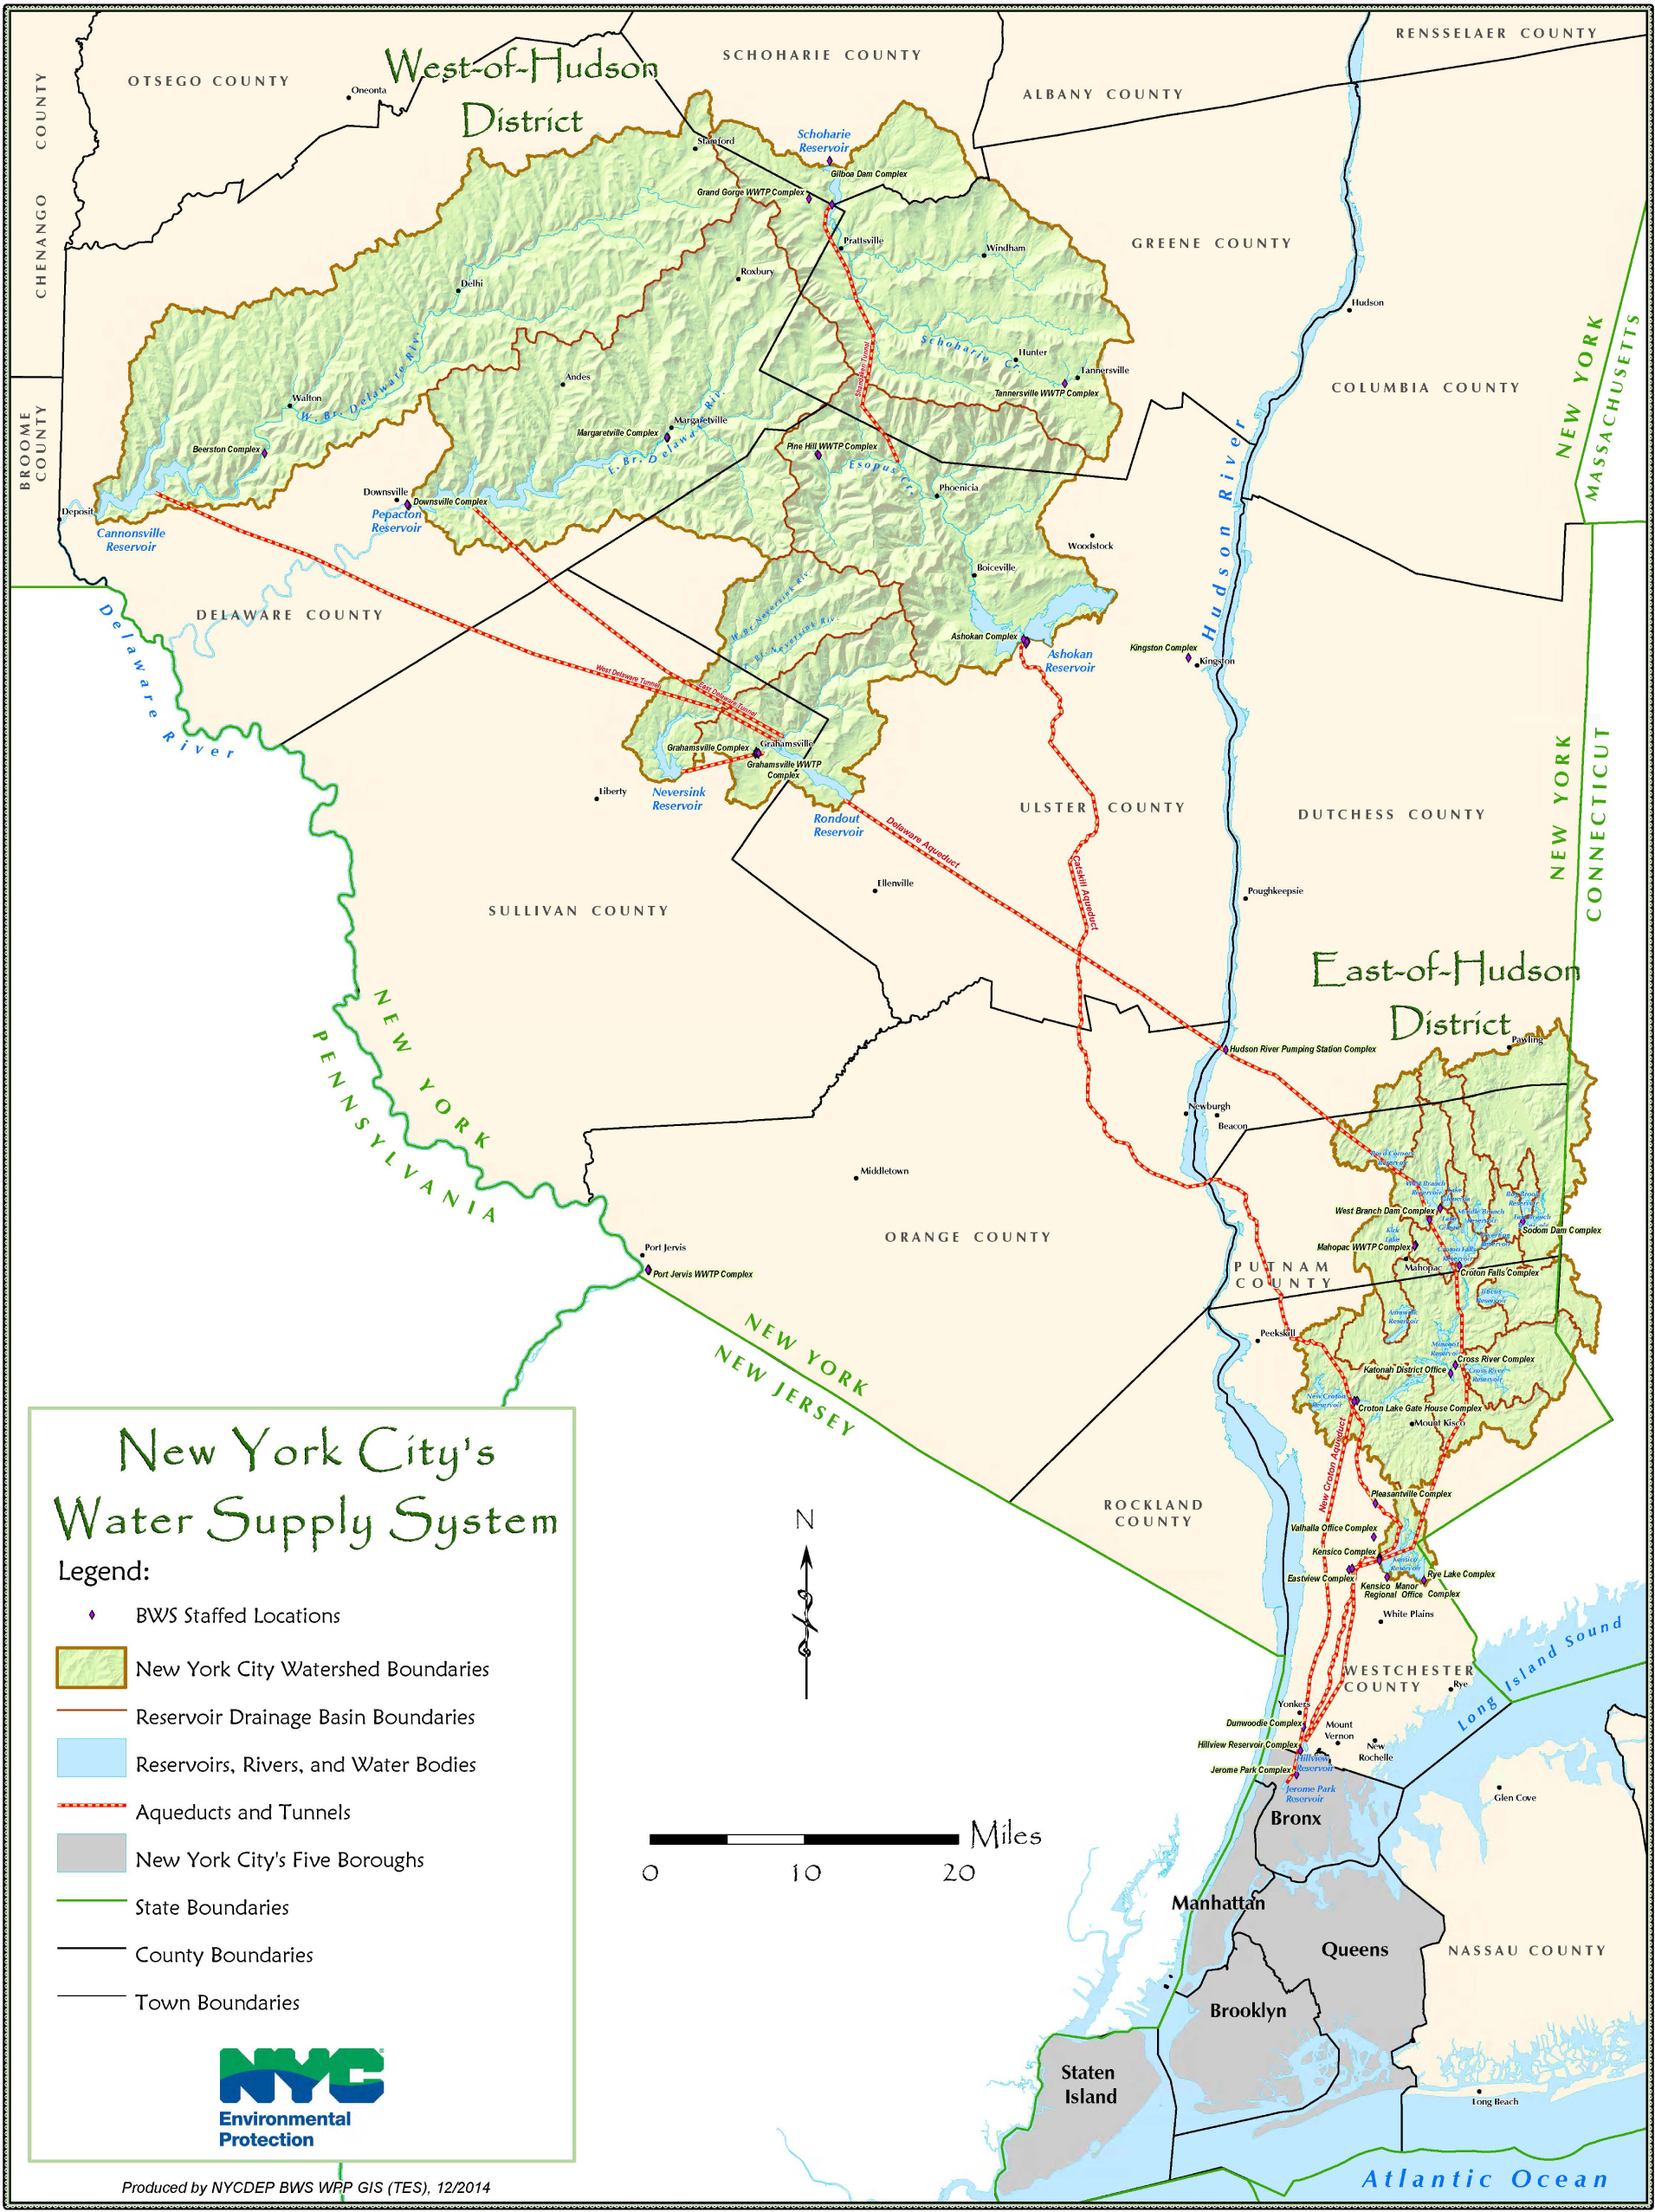
Figure 5. New York City’s water supply system, showing the connections to the Upper Delaware watershed. Source: New York City Department of Environmental Protection, Bureau of Water Supply [NYCDEP/BWS] (2014). Permission has been received for all previously published copyrighted figures.
In the Hudson system, institutions for collective decision-making, such as the NY-NJ Harbor Estuary Program, established under provisions of the federal Clean Water Act, have begun to chip away at the traditional focus on single-purpose uses. A source-to-sea goal of sustainable management of the complete system seems all but unreachable, however, as many powerful stakeholders continue to press for parochial interests, and management regimes pursue conflicting goals. The Hudson system is geographically wide-reaching, and, even in the face of extant requirements to consider the side-effects of modifications to the system (e.g., assessments under provisions of NEPA or the public interest review process of the Army Corps), there still exists no system-wide accounting for such modifications. As a contribution to the Environmental History of the Hudson River, the ecologist Stuart Findlay has argued for the use of an ecosystem service framework to help elucidate the linkages between human actions and nature so that external effects can become more transparent and tradeoffs can be assessed. Findlay has observed that:
“[w]hat has not been fully explored is the network of interactions and feedbacks between ecosystem services and impacts and how these interactions affect future human interactions and ecosystem attributes” (Findlay, 2011).
The rights of the public to use water resources for certain purposes, especially navigation, commerce, and fishing, are well-grounded in the common law, thereby establishing a clear priority for these “public trust” uses over private uses (Slade, 1990). A more modern, dynamic, common-law principle now accommodates an even wider range of public trust uses, comprising recreation, environmental protection, and other water-related uses, including, in some jurisdictions, drinking water withdrawals (viz., Huang, 2009). For example, a New York State court has ruled that “[t]he entire ecological system supporting the waterways is an integral part of them and must necessarily be included within the purview of the [public] trust” [79 Misc. 2d 42, 359 N.Y.S. 2d 848 (1973)].
While the public trust for water resources would appear to justify their protection, a recognized weakness of the public trust principle for management is that there exists no explicit hierarchy or prioritization among trust uses per se. On the other hand, a strength of the expansion of the public trust to a wider array of uses is that managing agencies now have a broader scope for seeking a balance among potentially competing trust uses, consonant with the motivating principle of source-to-sea governance. Emblematic of this balancing are the specific policies elaborated in New York’s coastal management program (New York State (NYS), 2017). Under New York’s law relating to “Waterfront Revitalization of Coastal Areas and Inland Waterways,” state agencies making decisions affecting coastal resources must seek a:
…balance between economic development and preservation that will permit the beneficial use of coastal resources while preventing the loss of living marine resources and wildlife, diminution of open space areas or public access to the waterfront, shoreline erosion, impairment of scenic beauty, or permanent adverse changes to ecological systems (NYS Executive Law, § 912(1) [1981]).
The state’s coastal management policies articulate both the overarching priorities among public trust water uses, along with the relevant legal foundations, and the requirement that managing agencies consider interrelationships among uses – as well as potential cumulative effects. In particular, state agencies are required to advance these policies while, at the same time, not permitting one to supersede another. Thus, Policy 3, which calls for port development, including dredging, must be balanced with Policy 35, which requires dredging to be “…undertaken in a manner that…protects significant fish and wildlife habitats, scenic resources, natural protective features, important agricultural lands, and wetlands…” and with Policy 38, which requires that “[t]he quality and quantity of surface water and groundwater supplies will be conserved and protected, particularly where such waters constitute the primary or sole source of water supply” (New York State (NYS), 2017).
In this study, an integrated modeling framework has been proposed (Figure 3) through which managing agencies can better comprehend the potential effects of pursuing both a policy to promote dredging for port development and a policy to conserve and protect the quality and quantity of surface water supplies. The framework comprises a coupling of empirically based descriptions of physical estuarine and riverine flows, predictions of future low-flow conditions, and estimates of welfare losses from changes in extant ecosystem services. The framework permits simulations of physical and economic effects before and after the implementation of channel deepening in the lower estuary. While the application of the framework to channel deepening at other locations, including Philadelphia, Savannah, or other seaports, will depend upon the regional mix of relevant estuarine ecosystem services, we argue that its modeling components are sufficiently generalizable to these other cases.
In the specific context of the Hudson river-estuary system, the framework links changes in environmental conditions due to estuarine channel deepening to increases in risks to drinking water withdrawals upriver. The management response to the drinking water threat establishes a link even farther upriver, necessitating releases from a freshwater reservoir. These releases in turn would lead to a reduction in the generation of electrical power, ultimately a cost of the channel deepening. This specific tradeoff was not considered during the decision-making process for deepening channels in the NY-NJ Harbor, and there may be several reasons for this oversight. Among the possibilities are the large impacts of dredging and placement or removal of polluted fill material, drawing attention from the impacts to other uses or services; the lack of a widespread appreciation of the consequences of changes in the distribution of salinity due to channel deepening in an estuary; the historically rare occurrence of the movement of the salt line high enough up the river to threaten the Poughkeepsie drinking water withdrawal; and the geographically and politically distinct management regimes governing estuarine channel deepening on the one hand and fluvial freshwater flows on the other. Identifying and clarifying the relevant tradeoffs, and assessing the tradeoffs using integrated approaches such as the one employed in this study, are clear priorities for future research, thereby enabling improved decision-making.
Although the economic costs estimated through the framework for the case examined in this study appear small, on the order of only millions of dollars, they are likely also to be conservative, and further research is warranted to refine these estimates for use in practical decision-making contexts. Other potential costs of water releases to augment flows include lost recreational opportunities on a lower-level Great Sacandaga Lake, reducing its surface area and making access to the lake more difficult (cf., Cordell and Bergstrom, 1993; Allen et al., 1996; Jakus et al., 2000; Hanson et al., 2002); possible reduced property values for residences near the lake, should a different configuration of the shoreline obtain (Lansford and Jones, 1995; Hanson et al., 2002); and the damages from emissions of other pollutants from replacement fossil-fuel-generated electricity, including sulfur and nitrogen oxides and mercury. The occurrence of a drought of extended duration, perhaps lasting more than one season or year, were not examined explicitly in this study, and such an event could well lead to much larger economic consequences. There also is considerable uncertainty about future patterns of precipitation in the Adirondack region, and it is difficult to make skilled predictions about future drought conditions that go beyond what has been experienced historically. Nevertheless, in theory, higher average temperatures and an increased frequency of heat waves due to climate change could lead to droughts that are more frequent or of longer duration. Further research to refine the estimates also might incorporate impacts associated with lost “headwater benefits” from reduced flows to downstream hydroelectric facilities, including higher costs of replacement power and social costs associated with climate change. Lastly, the impacts of sea-level rise on drinking water withdrawals has been a focus of research already in other estuaries undergoing channel deepening, such as the Savannah river-estuary system (Conrads et al., 2010). Sea-level rise also might contribute to the upstream displacement of the salinity intrusion in the Hudson, thereby increasing the risks to drinking water withdrawals at Poughkeepsie over the longer term and suggesting an important focus for future research.
The source-to-sea conceptualization of the external effects of upstream human uses on downstream environments needs updating, as estuaries, those environments that connect rivers to oceans, can involve dynamic complexities that run counter to broad intuition. As an integrating principle, source-to-sea should be generalized to accommodate physical linkages, such as the effects of channel deepening, which move literally from sea to source. Here “source” must be defined more broadly to encompass human uses of ecosystem services that influence or are influenced by other human uses coupled through the entire hydrologic system. Even with this broader conceptualization, the source-to-sea metaphor is highly relevant, calling for the carrying out of a more complete management, where tradeoffs among human uses of valued ecosystem services are identified more clearly, made more transparent, and evaluated more explicitly.
Conclusion
Major modifications of an environment as wide-reaching and complex as the Hudson river-estuary system necessitate more than a focus on single purposes or uses. Sustainable management implies a concern for the dynamic distribution of welfare changes such that future generations will be at least as well off as the present one. This study presented a case of the potential increased risks to an important fluvial ecosystem service, drinking water, as the consequence of human modification of the physical environment to expand another estuarine use, maritime transportation. The proper characterization of the tradeoffs required not only the mapping of the human uses of the system but also the establishment of links in both the physical environment and across concomitant management regimes. As estuaries become reconfigured to accommodate ever larger merchant vessels, and in the face of the increases in the rate of sea level rise and extreme weather, the framework developed for this study should find application in other locations and contexts.
In contrast with the typical unidirectional conceptualization of a river system, flowing downstream from source to sea, salinity intrusion, an ecosystem dis-service, impacted beneficial ecosystem services upstream. In particular, the study revealed that the benefits of channel deepening in the NY-NJ Harbor were not compared with the risks faced by other uses upstream, separating gains from losses across communities, geographies, and over time. The expected present value of total economic damages as a consequence of channel deepening in the NY/NJ Harbor were estimated conservatively to be on the order of $2.0 million, but they could be as much as an order of magnitude higher for the highest values of model parameters. The findings make clear that physical characteristics, environmental features, human uses, and management policies may be linked in ways that heretofore have not been fully appreciated. Further, these links can lead to external effects that may be unanticipated and therefore overlooked in both the examined case and quite possibly in other estuaries subject to channel deepening. A greater awareness of the consequences of human modifications of river-estuary systems is warranted, and, with this knowledge, more sustainable approaches to mitigate adverse effects on some stakeholders and communities might be identified and put in place.
Data Availability Statement
The raw data supporting the conclusions of this article will be made available by the authors, without undue reservation, to any qualified researcher.
Author Contributions
PH, DR, and AB conducted the research, constructed the models, ran the simulations, and wrote the manuscript. All authors contributed to the conception of the integrated analytical framework, the design of the research, and the editing of the manuscript.
Funding
This work was sponsored by NSF Coastal SEES Grant No. 1325136.
Conflict of Interest
YS was employed by the company Cardno Entrix, and EC was employed by Energy and Environmental Research Associates.
The remaining authors declare that the research was conducted in the absence of any commercial or financial relationships that could be construed as a potential conflict of interest.
The handling editor declared a shared affiliation with several of the authors PH, AB, and DR at the time of review.
Acknowledgments
We thank Kelly Dunning for research assistance and Lee Anderson, Bob Chant, Rocky Geyer, Jim Lodge, Tracy Quirk, Chris Sommerfield, Dennis Suszkowski, and participants at seminars at the University of Delaware, University of Rhode Island, and the Woods Hole Oceanographic Institution for helpful discussions and insights.
Supplementary Material
The Supplementary Material for this article can be found online at: https://www.frontiersin.org/articles/10.3389/fmars.2020.00425/full#supplementary-material
Footnotes
- ^ New York State has issued a water quality standard of 250 mg/L for chloride in surface waters used for human consumption (Division of Water (DoW), 1998). The US Environmental Protection Agency (EPA) has set an unenforceable, non-mandatory, secondary maximum contaminant level water quality standard of 250 mg/L chloride in drinking water based on “salty taste” but not on health risks (Environmental Protection Agency (EPA), 2017). There are indications, however, that human consumption of drinking water exhibiting levels of chloride as low as 50 mg/L can lead to health risks for individuals on salt-restricted diets (deVries and Weiss, 2001). EPA has set an aquatic life criterion of 230 mg/L for continuous concentrations of chloride in freshwater (Environmental Protection Agency (EPA), 2004).
References
Abood, K. A. (1974). Circulation in the Hudson River estuary. Ann. N. Y. Acad. Sci. 250, 38–111. doi: 10.1111/j.1749-6632.1974.tb43895.x
Allen, D. S., Jackson, R. S., and Perr, A. (1996). Alabama-Coosa-Tallapoosa and Apalachicola-Chattahoochee-Flint Comprehensive Study, Recreational Demand Element, Draft Report, Waterways Experiment Station, US Army Corps of Engineers, Vicksburg, MS. Available online at: http://www.citeulike.org/group/13619/article/7672512 (accessed February 21, 2019)
Anonymous (2016). Panamax and New Panamax. Maritime Connector. Available online at: http://maritime-connector.com/wiki/panamax/ (accessed February 15, 2019)
Bogdanich, W., Williams, J., and Mendez, E. (2016). The New Panama Canal: A Risky Bet. New York, NY: New York Times,Google Scholar
Bowen, M. M., and Geyer, R. W. (2003). Salt transport and the time-dependent salt balance of a partially stratified estuary. J. Geophys. Res. 108:3158. doi: 10.1029/2001JC001231
Brogdon, N. J. (1986). Estuary Model Test Evaluation. Misc. Pap. HL-86-7. Vicksburg, MS: Waterways Experiment Station,Google Scholar
Coles, S. (2001). An Introduction to Statistical Modeling of Extreme Values. London: Springer-Verlag.
Conrads, P. A., Roehl, E. A., Daamen, R. C., Cook, J. B., Sexton, C. T., Tufford, D. L., et al. (2010). “Estimating salinity intrusion effects due to climate change on the lower Savannah River estuary,” in Proceedings of the 2010 South Carolina Environmental Conference, North Myrtle Beach, SC. Available online at: https://www.researchgate.net/publication/266075179 (accessed February 15, 2019)
Cordell, H. K., and Bergstrom, J. C. (1993). Comparison of recreation use values among alternative reservoir water level management scenarios. Water Res. Res. 29, 247–258. doi: 10.1029/92WR02023
Davison, A. C., and Hinkley, D. V. (1997). Bootstrap Methods and Their Applications. Cambridge: Cambridge University Press.
Delaware River Basin Commission (DRBC) (2017). Flow and Drought Management. West Trenton, NJ: Delaware River Basin Commission.
deVries, M. P., and Weiss, L. A. (2001). Salt-Front Movement in the Hudson River Estuary, New York–Simulations by One-Dimensional Flow and Solute-Transport Models. Water-Resources Investigations Rep. 99-4024. Troy, NY: US Geological Survey, doi: 10.3133/wri994024
Division of Water (DoW) (1998). Ambient Water Quality Standards and Guidance Values and Groundwater Effluent Limitations. Division of Water Technical and Operational Guidance Series (1.1.1). Albany, NY: Division of Water.
Division of Water (DoW) (2007). Waterbody Inventory for Sacandaga River Watershed. Albany, NY: Department of Environmental Conservation.
Energy Information Administration (EIA) (2019). Electric Power Annual 2017. Table 8.4: Average Power-Plant Operating Expenses for Major U.S. Investor-Owned Electric Utilities 2007 through 2017 (Mills per Kilowatthour). Washington, DC: US Department of Energy.
Environmental Protection Agency (EPA) (2004). National Recommended Water Quality Criteria. Washington, DC: Office of Water, Office of Science and Technology.
Environmental Protection Agency (EPA) (2017). Secondary Drinking Water Standards: Guidance for Nuisance Chemicals. Washington, DC: Environmental Protection Agency.
Federal Energy Regulatory Commission (FERC) (2000). Upper Hudson/Sacandaga River Offer of Settlement. Erie Boulevard Hydropower, LP Project Nos. 2318, 2047, 2482, 2554. Washington, DC: Federal Energy Regulatory Commission.
Federal Energy Regulatory Commission (FERC) (2002). Erie Boulevard Hydropower, L.P., Hudson River-Black River Regulating District: Order Approving Offer of Settlement. FERC 100, ¶61,321. FERC Order Approving UH/SR Settlement Offer.pdf. Washington, DC: Federal Energy Regulatory Commission.
Findlay, S. (2011). “Linkages between people and ecosystems: how did we get from separate to equal?,” in Environmental History of the Hudson River, Ch. 2, ed. R. E. Henshaw (Albany, NY: State University of New York Press), 7–12.
Granit, J., Lymer, B. L., Olsen, O., Tengberg, A., Nömmann, S., and Clausen, T. J. (2017). A conceptual framework for governing and managing key flows in a source-to-sea continuum. Water Policy 19, 673–691. doi: 10.2166/wp.2017.126
Hall, D. G., Hunt, R. T., Reeves, K. S., and Carroll, G. R. (2003). Estimation of Economic Parameters of US Hydropower Resources. INEEL/EXT-03-00662. Idaho Falls, ID: Idaho National Engineering and Environmental Laboratory.
Hanley, R. (1995). Lack of Rainfall Blights New York. New York, NY: New York Times,Google Scholar
Hansen, D. V., and Rattray, M. (1965). Gravitational circulation in straits and estuaries. J. Mar. Res. 23, 104–122.
Hanson, T. R., Hatch, L. U., and Clonts, H. C. (2002). Reservoir water level impacts on recreation, property, and nonuser values. J. Am. Water Res. Assoc. 38, 1007–1018. doi: 10.1111/j.1752-1688.2002.tb05541.x
Harris, M. (2012). Philadelphia’s water supply: how human capital and collaboration can overcome significant man-made challenges. Grad. Stud. J. Organ. Dyn. 2:2.
Huang, Y. (2009). Restoring the Trust: An Index of State Constitutional and Statutory Provisions and Cases On Water Resources and the Public Trust Doctrine. Washington, DC: The Center for Progressive Reform,Google Scholar
Interagency Working Group on the Social Cost of Carbon (IAWG) (2015). Technical Support Document: Technical Update of the Social Cost of Carbon for Regulatory Impact Analysis under Executive Order 12866. Washington, DC: IAWG.
Jakus, P. M., Dowell, P., and Murray, M. N. (2000). The effect of fluctuating water levels on reservoir fishing. J. Agricult. Res. Econ. 25, 520–532.
Lansford, N. H., and Jones, L. L. (1995). Effects of LCRA Lakes on Riparian Property Values: Recreational and Aesthetic Components of Lakeside Housing in the Colorado River Basin. Report No. 170. College Station, TX: Texas A&M University.
MacCready, P. (2007). Estuarine adjustment. J. Phys. Oceanogr. 37, 2133–2145. doi: 10.1175/JPO3082.1
MacCready, P., and Geyer, W. R. (2010). Advances in estuarine physics. Annu. Rev. Mar. Sci. 2, 35–58. doi: 10.1146/annurev-marine-120308-081015
Mandanaro, L. A., and Mason, R. J. (2013). Adaptive management and governance of Delaware River water resources. Water Policy 15, 364–385. doi: 10.2166/wp.2012.077
Monismith, S. G., Kimmerer, W., Burau, J. R., and Stacey, M. T. (2002). Structure and flow-induced variability of the subtidal salinity field in northern San Francisco Bay. J. Phys. Oceanogr. 32, 3003–3019. doi: 10.1175/1520-04852002032<3003:SAFIVO<2.0.CO;2
New York City Department of Environmental Protection, Bureau of Water Supply [NYCDEP/BWS] (2014). New York City’s Water Supply System. New York, NY.
New York State (NYS) (2017). Coastal Management Program and Final Environmental Impact Statement. Albany, NY: Department of State.
New York State Disaster Preparedness Commission (NYSDPC) (2016). New York State Comprehensive Emergency Management Plan: Drought Management Coordination Annex. Albany, NY: New York State Disaster Preparedness Commission.
Oak Ridge National Laboratory (ORNL) (2011). Hudson River Basin Headwater Benefits Determination: Draft Basin Scoping Report and Data Sufficiency Assessment. Prepared for the Division of Hydropower Administration and Compliance, Federal Energy Regulatory Commission. Oak Ridge, TN: ORNL.
Perkey, D. J., Young, K. N., and Kreitzberg, C. W. (1983). The 1980-81 drought in Eastern Pennsylvania. Bull. Am. Meteorol. Soc. 64, 140–147. doi: 10.1175/1520-0477(1983)064<0140:tdiep>2.0.co;2
Permanent International Association of Navigation Congresses (PIANC) (1993). Problems Created by Saltwater Infiltration. Report of Working Group no. 6 of the Permanent Technical Committee I. Supplement to Bulletin No. 80. Brussels: General Secretariat of PIANC.
Port of New York and New Jersey (PNYNJ) (2016). Port of NY & NJ, Army Corps Announce Completion of Harbor Deepening Navigation Program. Breaking Waves: Port of New York and New Jersey. Reprinted with permission.
Poughkeepsie Water Treatment Facility (PWTF) (2015). Salt Front Action Plan. Poughkeepsie, NY: Poughkeepsie Water Treatment Facility.
Poughkeepsie Water Treatment Facility (PWTF) (2018). Annual Water Quality Report for Calendar Year 2017: City of Poughkeepsie. Poughkeepsie, NY: Poughkeepsie Water Treatment Facility.
Ralston, D. K., and Geyer, W. R. (2019). Response to channel deepening of the salinity intrusion, estu-arine circulation, and stratification in an urbanized estuary. J. Geophys. Res. 124, 4784–4802. doi: 10.1029/2019JC015006R
Ralston, D. K., Geyer, W. R., and Lerczak, J. (2008). Subtidal salinity and velocity in the Hudson River estuary: observations and modeling. J. Phys. Oceanogr. 38, 753–770. doi: 10.1175/2007JPO3808.1
Ralston, D. K., Geyer, W. R., and Warner, J. C. (2012). Bathymetric controls on sediment transport in the Hudson River estuary: lateral asymmetry and frontal trapping. J. Geophys. Res. 117:C10013. doi: 10.1029/2012JC008124
Ralston, D. K., Talke, S., Geyer, W. R., Al’Zubadaei, H., and Somerfield, C. K. (2019). Bigger tides, less flooding: effects of dredging on barotropic dynamics in a highly modified estuary. JGR-Oceans 124, 196–211. doi: 10.1029/2018JC014313
Ralston, D. K., Warner, J. C., Geyer, W. R., and Wall, G. R. (2013). Sediment transport due to extreme events: the Hudson River estuary after tropical storms Irene and Lee. Geophys. Res. Lett. 40, 5451–5455. doi: 10.1002/2013GL057906
Ramos, S. J. (2014). Planning for competitive port expansion on the U.S. eastern seaboard: the case of the Savannah Harbor Expansion Project. J. Transport Geogr. 36, 32–41. doi: 10.1016/j.jtrangeo.2014.02.007
Revkin, A. C. (1995). Drought Fears Prompt Warning on Water Use. New York, NY: New York Times,Google Scholar
Rodrigue, J.-P. (2017). The Geography of Transport Systems, 4th Edn. New York, NY: Routledge,Google Scholar
Schuyler, D. (2018). Embattled River: The Hudson and Modern American Environmentalism. Ithaca, NY: Cornell University Press.
Shirazi, Y., Carr, E. W., Parsons, G. R., Hoagland, P., Ralston, D. K., and Chen, J.-L. (2019). Increased operational costs of electricity generation due to salinity increases from sea level rise and a deepened channel. J. Environ. Manag. 244, 228–234. doi: 10.1016/j.jenvman.2019.04.056
Slade, D. C. (ed.) (1990). Putting the Public Trust Doctrine to Work. Hartford, CT: Coastal Resources Management Division.
Swaney, D. P., Limburg, K. E., and Stainbrook, K. (2006). Some historical changes in the patterns of population and land use in the Hudson River watershed. Am. Fish. Soc. Symp. 51, 75–112.
United States Army Corps of Engineers (USACE) (2000). New York and New Jersey Harbor Navigation Study Feasibility Report and Final Environmental Impact Statement. New York, NY: USACE.
US Army Corps of Engineers (USACE) (1999). Draft Implementation Strategy of the Dredged Mateerial Management Plan for the Port of New York and New Jersey, Technical Appendix. New York, NY: USACE.
US Army Corps of Engineers (USACE) (2008). Dredged Material Management Plan for the Port of New York and New Jersey, Vol. 1. New York, NY: USACE.
US Army Corps of Engineers (USACE) (2016). New York and New Jersey Harbor Deepening Navigation Program. New York, NY: USACE.
US Geological Survey (USGS) (1999). Drought Brings Environmental, Ecological Changes — Blue Crabs in Downtown Dover and Salty Water Nears Poughkeepsie. Reston, VI: USGS.
US Geological Survey (USGS) (2018). USGS 01323500 Great Sacandaga Lake at Conklingville, NY. Reston, VI: USGS.
Virginia Business (2017). East Coast Channel Depths and Dredging Projects. Available online at: http://www.virginiabusiness.com/images/uploads/port_dredging_chart.png (accessed August 30, 2018)
Warner, J. C., Geyer, W. R., and Lerczak, J. A. (2005). Numerical modeling of an estuary: a comprehensive skill assessment. J. Geophys. Res. 110:C05001. doi: 10.1029/2004JC002691
Weiss, L. A., Schaffranek, R. W., and deVries, M. P. (1994). “Flow and chloride transport in the tidal Hudson River, New York,” in Hydraulic Engineering ‘94: Proceedings of the American Society of Civil Engineers, Vol. 2, 1300–1305. Available online at: http://citeseerx.ist.psu.edu/viewdoc/summary?doi=10.1.1.518.7449 (accessed February 21, 2019)
Wicker, C. F. (1969). New horizons in the field of tidal hydraulics. J. Hydraulics Div. Proc. Am. Soc. Civil Eng. 95, 147–160.
Keywords: salinity intrusion, ecosystem services, channel deepening, source-to-sea, drinking water, hydropower, Regional Ocean Modeling System (ROMS), Hudson River and Estuary
Citation: Hoagland P, Beet A, Ralston D, Parsons G, Shirazi Y and Carr E (2020) Salinity Intrusion in a Modified River-Estuary System: An Integrated Modeling Framework for Source-to-Sea Management. Front. Mar. Sci. 7:425. doi: 10.3389/fmars.2020.00425
Received: 26 March 2020; Accepted: 14 May 2020;
Published: 07 August 2020.
Edited by:
Di Jin, Woods Hole Oceanographic Institution, United StatesReviewed by:
Christian T. K.-H. Stadtlander, Independent Researcher, St. Paul Minnesota, United StatesAndrew M. Fischer, University of Tasmania, Australia
Copyright © 2020 Hoagland, Beet, Ralston, Parsons, Shirazi and Carr. This is an open-access article distributed under the terms of the Creative Commons Attribution License (CC BY). The use, distribution or reproduction in other forums is permitted, provided the original author(s) and the copyright owner(s) are credited and that the original publication in this journal is cited, in accordance with accepted academic practice. No use, distribution or reproduction is permitted which does not comply with these terms.
*Correspondence: P. Hoagland, cGhvYWdsYW5kQHdob2kuZWR1