 David Beauchesne1,2*
 Rémi M. Daigle2
 Steve Vissault3
 Dominique Gravel3
 Andréane Bastien4Simon Bélanger5Pascal Bernatchez5Marjolaine Blais6Hugo Bourdages6
 Clément Chion7Peter S. Galbraith6
 Benjamin S. Halpern8,9Camille Lavoie2
 Christopher W. McKindsey6
 Alfonso Mucci10
 Simon Pineault11Michel Starr6
 Anne-Sophie Ste-Marie4
 Philippe Archambault2
- 1Institut des Sciences de la mer, Université du Québec á Rimouski, Rimouski, QC, Canada
- 2ArcticNet, Québec Océan, Département de Biologie, Université Laval, Quebec, QC, Canada
- 3Département de Biologie, Université de Sherbrooke, Sherbrooke, QC, Canada
- 4St. Lawrence Global Observatory, Rimouski, QC, Canada
- 5Département de Biologie, Chimie et Géographie, Université du Québec à Rimouski, Rimouski, QC, Canada
- 6Fisheries and Oceans Canada, Maurice Lamontagne Institute, Mont-Joli, QC, Canada
- 7Département des Sciences Naturelles, Université du Québec en Outaouais, Gatineau, QC, Canada
- 8National Center for Ecological Analysis and Synthesis, University of California, Santa Barbara, Santa Barbara, CA, United States
- 9Bren School of Environmental Science and Management, University of California, Santa Barbara, Santa Barbara, CA, United States
- 10Department of Earth & Planetary Sciences, McGill University, Montreal, QC, Canada
- 11Ministère de l'Environnement et de la Lutte contre les Changements climatiques, Québec, QC, Canada
The St. Lawrence is a vast and complex socio-ecological system providing a wealth of services that sustain numerous economic sectors. This ecosystem is subject to significant human pressures that overlap and potentially interact with climate-driven environmental changes. Our objective in this paper was to systematically characterize the distribution and intensity of drivers of environmental change (hereafter, drivers) in the St. Lawrence System. We gathered data-based indicators for 22 coastal, climate, fisheries, and marine traffic drivers through collaborations, existing environmental initiatives and open data portals. We show that few areas of the St. Lawrence are free of cumulative exposure. The Estuary, Anticosti Gyre, and coastal areas are particularly exposed, especially in the vicinity of urban centers. We identified six distinct clusters with similar suites of co-occurring drivers and show that certain driver combinations are inherent to different regions of the St. Lawrence and that coastal areas are exposed to all driver types. Of particular concern are two clusters capturing most exposure hotspots and that show the convergence of contrasting cumulative exposure profiles at the head of the Laurentian Channel. Sharing knowledge of drivers emerged as a priority to facilitate future environmental assessment efforts. We thus launch eDrivers, an open knowledge platform gathering experts committed to structuring, standardizing and sharing knowledge on drivers of environmental change in support of holistic science and management. eDrivers was built on a series of guiding principles upholding existing data management and open science standards. We therefore expect it to evolve through time to address knowledge gaps and refine current driver layers. Ultimately, we believe that eDrivers represents a much needed solution that could radically influence broad scale research and management practices by increasing knowledge accessibility and interoperability.
1. Introduction
The St. Lawrence System, formed by one of the largest estuaries in the world and a vast interior sea, is a complex social-ecological system characterized by highly variable environmental conditions and oceanographic processes (El-Sabh and Silverberg, 1990; White and Johns, 1997; Dufour and Ouellet, 2007). It constitutes a unique and heterogeneous array of habitats suited for the establishment of diverse and productive ecological communities (Savenkoff et al., 2000). As a result, the St. Lawrence System has benefited the Canadian economy. It sustains a rich fisheries industry targeting more than 50 species, serves as the gateway to eastern North-America by granting access to more than 40 ports and is the most densely populated Canadian region, hosts a booming tourism industry and an expanding aquaculture production, fosters emerging activities, and boasts a yet untapped hydrocarbon potential (Beauchesne et al., 2016; Archambault et al., 2017; Schloss et al., 2017). With major investments recently made and more forthcoming in economic and infrastructure development and research (e.g., Government of Québec, 2015; RQM, 2018), an intensification of the human footprint is likely in the St. Lawrence System. Consequently, the St. Lawrence System is exposed to an increasing number of drivers of environmental change, as is observed across ecosystems globally (see Halpern et al., 2015b, 2019). We broadly define drivers of environmental change (hereafter, drivers) as any externality that affects environmental processes and disturbs natural systems. Drivers may originate from natural or human-induced biophysical processes (e.g., sea surface-water temperature anomalies and hypoxia) or directly from anthropogenic activities (e.g., fisheries and marine pollution). The potential for complex interactions between co-occurring drivers is the largest uncertainty when studying or predicting environmental impacts (Darling and Côté, 2008; Côté et al., 2016). Multiple drivers can combine non-additively and result in effects that are greater (synergistic effect) or lower (antagonistic effect) than the sum of individual effects (Crain et al., 2008; Darling and Côté, 2008; Côté et al., 2016).
Increasing exposure and the experiences of past ecological tragedies in the St. Lawrence System such as the collapse of cod fisheries (Frank et al., 2005; Dempsey et al., 2018) and the decline of the beluga and right whale populations (Plourde et al., 2014) together urge the need to characterize the distribution, intensity and co-occurrence of drivers in the system. Research on the effects of drivers in marine environments, nonetheless, remains overwhelmingly focused on single driver assessments (O'Brien et al., 2019). Whereas, co-occurring drivers may not interact, driver co-occurrence is a requirement for interactions to exist. Knowledge of their co-distribution can therefore identify areas where driver interactions are most likely observed.
Characterizing drivers is also a necessary step for the application of holistic management approaches. Holistic approaches typically involve, but are not limited to, selecting and describing valued ecosystem components (e.g. habitats and species) and drivers (e.g., marine traffic and ocean acidification), assessing the exposure and vulnerability of valued components to drivers, selecting a proper spatio-temporal scale, monitoring, and public and stakeholder participation (Dubé and Munkittrick, 2001). Gathering environmental knowledge for holistic initiatives can, however, be a very challenging and time consuming—not to say painful—process. On one hand, there is an overwhelming and expanding wealth of data available. Such information overload may inhibit our ability to make decisions based on scientific information, promote massive duplication of effort, disproportionately appropriate research funds to certain sectors, and obscure knowledge gaps amid a sea of information (Eppler and Mengis, 2004). On the other hand, crucial data are lacking and remain largely unavailable or inaccessible for a variety of reasons, including proprietary rights, lack of organizational time, capacity and training, and, in some cases, an unwillingness to share; this curtails our ability for appropriate decision-making.
Current initiatives facilitate the data gathering process by assembling, organizing and sharing environmental knowledge, such as the Ocean Biogeographic Information System (OBIS; OBIS, 2019) for biotic data and Bio-ORACLE (Assis et al., 2018) for abiotic data. However, equivalent platforms for drivers have largely focused on single drivers (e.g., Global Fishing Watch) and platforms collating data-based indicators and knowledge on multiple drivers in a comparable and interoperable way remain conspicuously missing (but see Halpern et al., 2015a). This is in spite of integrated management and assessment approaches requiring efficient data reporting, standardized data management practices, and tools tailored to the study of the effects of multiple drivers (Dafforn et al., 2016; Stock et al., 2018).
The main goal of this study is to characterize the distribution and intensity of drivers in the St. Lawrence System. More specifically, our objectives are to: (1) identify areas of high cumulative exposure to drivers and (2) characterize areas with similar cumulative exposure profiles, i.e., areas exposed to similar suites of co-occurring drivers. An additional objective emerged while addressing the main goal of this manuscript: sharing information about the distribution and intensity of drivers of environmental change in the St.Lawrence. We achieve this through the development of an open knowledge platform, eDrivers, that was designed to facilitate the widespread availability of driver characterization for holistic assessments and management approaches. Here, we present its guiding principles and accompanying tools.
2. Materials and Methods
2.1. St. Lawrence System
The St. Lawrence System is composed of the St. Lawrence Estuary and the Gulf of St. Lawrence (Figure 1). The Estuary is defined by the limit of seawater intrusion, close to Île d'Orléans, to the west and by its connection to the Gulf near Pointe-des-Monts. The surface layer is composed of freshwater flowing seaward, primarily from the Great Lakes Basin through the St. Lawrence River. Atlantic waters intrude landwards at depth into the Gulf and Estuary from Cabot Strait, but as well as from the Strait of Belle Isle (see below).
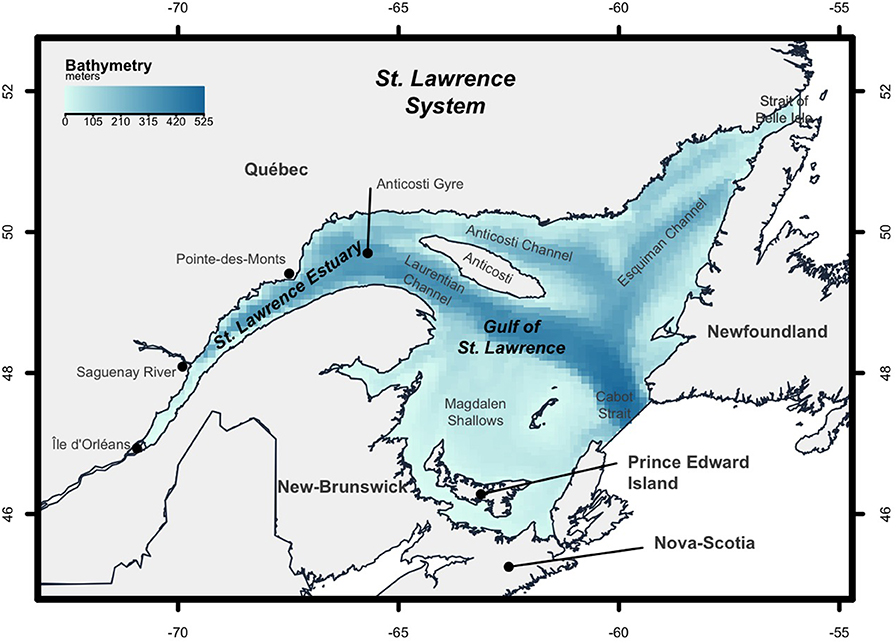
Figure 1. Description of the St. Lawrence System in Eastern Canada, composed of the St. Lawrence Estuary and the Gulf of St. Lawrence. The Estuary is defined by the limit of seawater intrusion, close to Île d'Orléans, to the west and by its connection to the Gulf near Pointe-des-Monts. The Gulf is an interior sea connected to the Atlantic by Cabot Strait and the Strait of Belle Isle to the south and north of Newfoundland, respectively.
The topology of the Northern Gulf is characterized by three deep channels (250–500 m). The Laurentian Channel is the main channel connecting the Estuary to the Atlantic through Cabot Strait. The Esquiman and Anticosti channels are two secondary channels that branch off from the Laurentian Channel to the north toward the Strait of Belle Isle and the Labrador and north of Anticosti Island, respectively. The Southern Gulf hosts the Magdalen Shallows, a vast area with an average depth of ~50 m. The water column in the Gulf and St. Lawrence Estuary includes a seasonal cold intermediate layer that separates the surface and deep layers. Seasonal sea ice affects circulation in the St. Lawrence. Finally, three islands impact the physical dynamics of the St. Lawrence: the Anticosti Island to the north, the Îles de la Madeleine in the middle of the Magdalen Shallows and Prince Edward Island to the south. See Saucier et al. (2003) and Galbraith et al. (2018) for more information on the physical oceanography of the St. Lawrence.
The St. Lawrence drains over 25% of global freshwater reserves through its connection to the Great Lakes Basin, which is home to over 45 million North Americans, i.e., 15 and 30 million in Canada and the United States, respectively. The coasts of St. Lawrence System, as delimited by our study area (Figure 1), boast a much lower population of approximately 1 million Canadians living within 10 km of the coast, with populations mainly located in a few coastal cities in the Estuary and the Southern Gulf (Statistics-Canada, 2017).
2.2. Drivers
Drivers, as broadly defined in this study, are data-based indicators of environmental conditions and human activities that are often referred to as driving forces, stressors, pressures, or states in the scientific and environmental assessment literature (e.g., Kristensen, 2004; Halpern et al., 2019). Defining such categories, however, can be difficult and is often context- and ecosystem-specific (Gari et al., 2015; Dempsey et al., 2018). As such, we refrain from articulating our work around a specific framework or imposing categories on data-based products that may change with a user's objective. Instead, we focus on available data-based indicators that contribute to evaluate the ecosystem's cumulative exposure to multiple threats.
Drivers selection was informed by a global cumulative impact assessment initiative (Halpern et al., 2008, 2015b, 2019) and available from the National Center for Ecological Analysis and Synthesis (NCEAS) online data repository (Halpern et al., 2015a), regional holistic evaluations of the state of the St. Lawrence (Dufour and Ouellet, 2007; Benoît et al., 2012), and communications with regional experts (Table 1). Where regional data on drivers were unavailable, available global data at a resolution adequate for the scale of the St. Lawrence System were used instead (e.g., marine pollution).
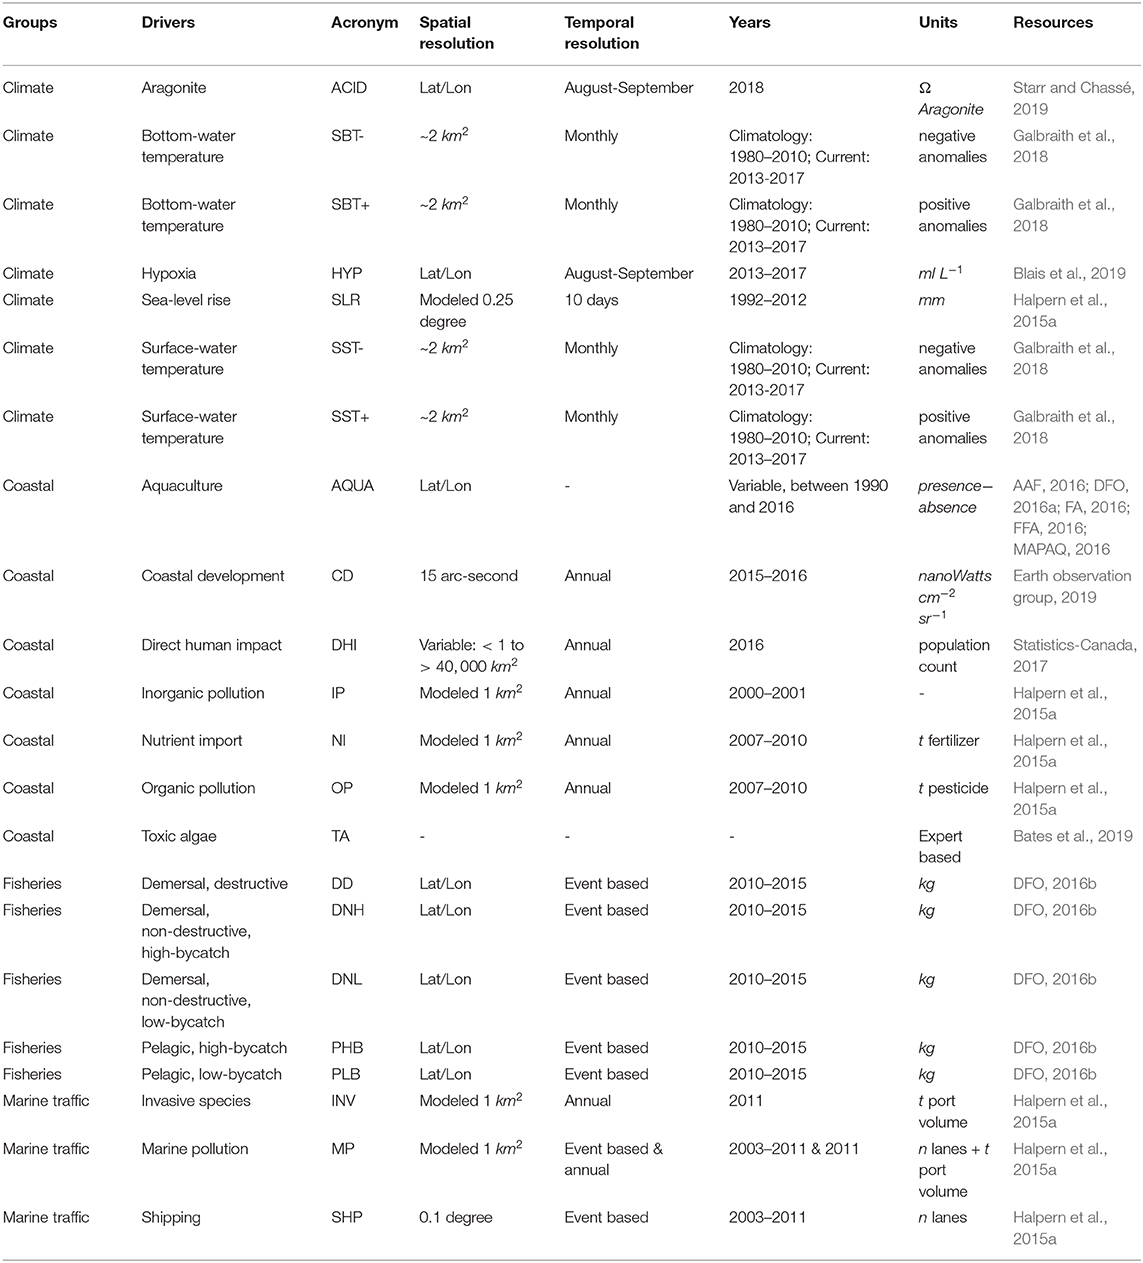
Table 1. List of drivers available on eDrivers and used for the analyses presented in this paper. Further details on methods and data are available in the Supplementary Materials.
We characterized the intensity and distribution of 22 drivers (Table 1). Drivers incorporated in the analyses are varied in origin, i.e., from terrestrial (e.g., nutrient input) to marine (e.g., shipping), and from large scale biophysical processes (e.g., temperature anomalies) to localized anthropogenic activities (e.g., fisheries). Drivers were divided into four groups: coastal, climate, fisheries, and marine traffic (Table 1). All data layers and methodologies are described in the Supplementary Materials.
As in Halpern et al. (2019), drivers with non-normal frequency distributions were log-transformed to avoid underestimating intermediate driver values. All drivers were scaled between 0 and 1 to allow comparisons. The 99th quantile of individual driver distribution was used as the upper limit for scaling to control for extreme values that may or may not represent real observations. The St. Lawrence System was divided into a regular grid of 1 km2 cells into which all drivers were integrated (Figure S2).
2.3. Cumulative Exposure
We begin by providing a simplified two-driver example that focuses on the co-occurrence of hypoxia and demersal destructive fisheries, two drivers that mostly occur in deeper St. Lawrence waters. Driver co-occurrence was evaluated spatially by summing the scaled intensity of drivers in each grid cell. The intensity at which pairs of drivers co-occur was evaluated using a two-dimensional kernel density. This example demonstrates how driver co-occurrence was evaluated and serves as a stepping stone to the integrative indicators used hereafter, i.e., cumulative exposure and cumulative hotspots (objective 1).
We evaluated cumulative exposure (EC) for each grid cell as the sum of scaled driver intensities:
where x is a grid cell, i is a driver, and D is the scaled intensity of driver i. A grid cell with a high EC value is either characterized by multiple drivers at low relative intensity, a few drivers at high relative intensity, or both.
We also identified cumulative hotspots (HC)—i.e., areas where drivers co-occur at high relative intensities—as the number of drivers in each grid cell with scaled intensity contained over their respective 80th percentile:
where, x is a grid cell, i is a driver and D is the scaled intensity of driver i and P80,Di is the 80th percentile of driver i.
2.3.1. Clustering
We identified areas with similar cumulative exposure profiles (objective 2) using a clustering approach (Bowler et al., 2019). We used a partional k-medoids clustering algorithm, CLARA (CLustering for Large Applications; Kaufman and Rousseeuw, 1990), which was designed for large datasets. The CLARA algorithm uses the PAM (Partition Around Medoids) algorithm on a sample from the original dataset to identify a set of k objects that are representative of all other objects, i.e., medoids and that are central to the cluster they represent. The goal of the algorithm is to iteratively minimize intra-cluster dissimilarity. Iterations are compared on the basis of the average dissimilarity between cluster objects and representative medoid to select the optimal set of k medoids that minimizes average dissimilarity. We used the clustering algorithm with the Manhattan distance since this measure is less affected by extreme values (Legendre and Legendre, 2012), as is the k-medoids clustering algorithm (Kaufman and Rousseeuw, 1990). We used 100 iterations using samples of 10,000 observations (i.e., ~5% of observations) to identify clusters. Analyses were performed using the cluster R package (Maechler et al., 2018). Partitional clustering algorithms require a user-defined number of clusters. Values of k ranging from 2 to 10 were tested and validated by selecting the number of clusters that maximized the average silhouette width (Kaufman and Rousseeuw, 1990) and minimized the total within-cluster sum of squares (Figure S4).
2.3.2. Inter-cluster Dissimilarity
Differences between clusters were explored by measuring the total inter-cluster dissimilarity and the contribution of each driver to the total inter-cluster dissimilarity using a similarity percentage analysis (SIMPER) with Manhattan distance (Figure S5; Clarke, 1993). The Manhattan distance was again preferred for continuity with the clustering analysis and to ensure that outliers did not have a strong influence on the analysis. As the drivers dataset is large (~ 250,000 observations), we used a bootstrap procedure for the SIMPER analysis, randomly selecting 5% of each cluster to run the analysis and repeating the process over 300 iterations. We also compared the mean intensity of each driver within each cluster to better capture the inter-cluster dissimilarity.
2.3.3. Intra-cluster Similarity
Intra-cluster similarity was evaluated calculating the intra-cluster Manhattan distance and by transforming the mean contribution to distance (Mc) of each driver by 0.1/(0.1 + Mc) to obtain a similarity measure for each driver (Sd). The total similarity is the sum of all Sd (Figure S6). As with the inter-cluster dissimilarity, we used a bootstrap procedure for the intra-cluster similarity, randomly selecting 25% of each cluster observation to run the analysis and repeating the process over 50 iterations. We did not use the bootstrap procedure for clusters with less than 40,000 observations since computation time was manageable.
3. Results and Discussion
3.1. Cumulative Exposure
We first present the simplified hypoxia-fisheries example to demonstrate how driver co-occurrence was evaluated. Hypoxic bottom waters area mainly found at the head of the Laurentian, Anticosti, and Esquiman channels (Figure 2A). Demersal destructive fisheries are concentrated along the Laurentian Channel, the heads of the Anticosti and Esquiman channels and around the Îles de la Madeleine (Figure 2B). By combining both drivers, we observe that hypoxia and demersal destructive fisheries co-occur mostly at high relative intensity (Figure 2D) in the vicinity of the Anticosti Gyre and the heads of the Esquiman and Anticosti channels (Figure 2C); these are the areas where we might expect interactions between these drivers to be more likely.
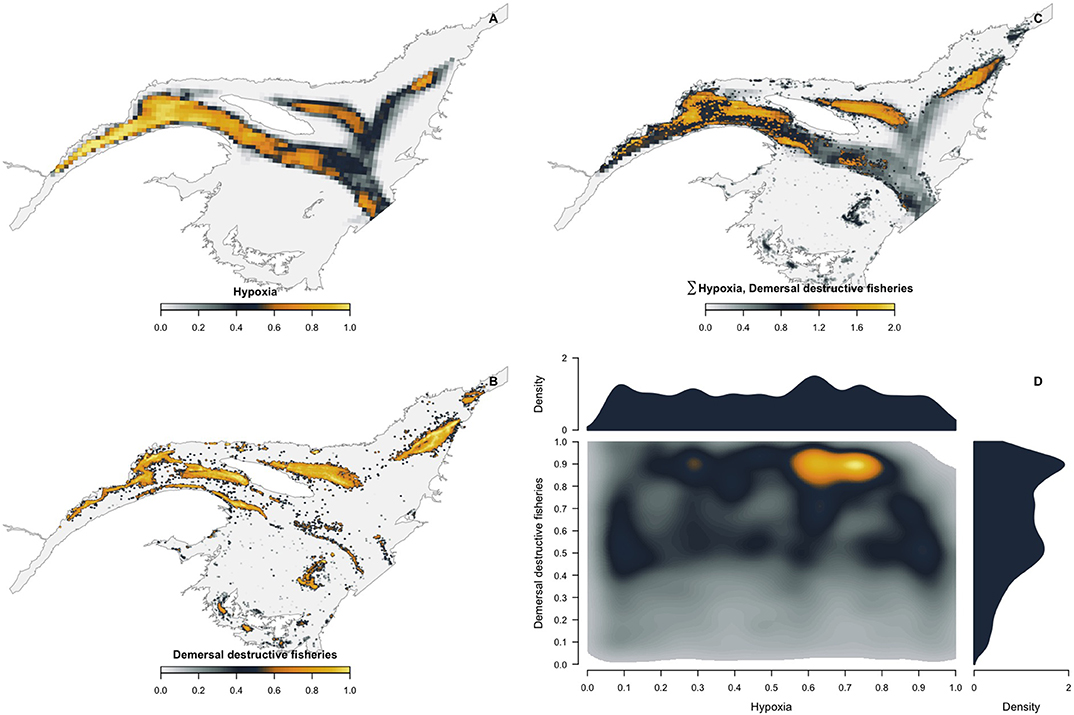
Figure 2. Simplified 2-driver example of driver co-occurrence between hypoxia and demersal destructive fisheries in the St. Lawrence. An index of hypoxia (A) was created using bottom-water dissolved oxygen between 2013 and 2017 (Blais et al., 2019). Demersal destructive fisheries (i.e., trawl and dredges) (B) intensity was evaluated from fisheries catch data collected between 2010 and 2015 used to measure annual area weighted total biomass (kg) in 1 km2 grid cells (DFO, 2016b). See Supplementary Materials for more information on specific methodologies. Relative hypoxic stress and demersal destructive fisheries intensity was summed (C) to visualize their combined spatial distribution and intensity. Finally, individual density and the co-intensity of hypoxia and demersal destructive fisheries was investigated with a two-dimensional kernel analysis (D).
We now focus on the integrative exposure indicators. Apart from the northeastern Gulf, cumulative exposure is ubiquitous in the St. Lawrence (Figure 3). Cumulative exposure is generally highest along coasts (Figure 3), with hotspots located in the vicinity of coastal cities (Figure 4). In general, offshore areas are less exposed to cumulative drivers, with the Estuary and the Anticosti Gyre being notable exceptions (Figures 3, 4). This is not to say that offshore areas are free from exposure, as most of the St. Lawrence is exposed to multiple overlapping drivers (Figures 3, 4). For example, the heads of the Anticosti and Esquiman channels are highly exposed to cumulative drivers (Figure 3).
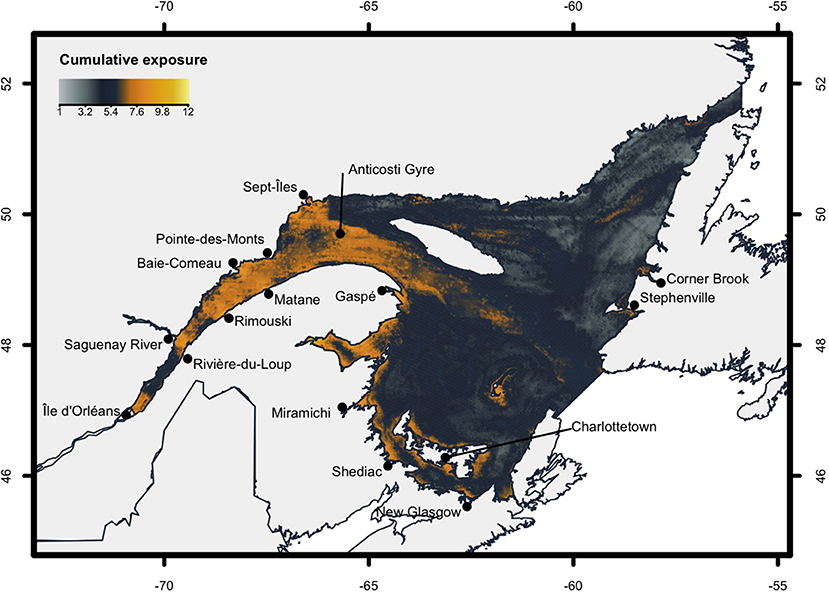
Figure 3. Distribution of cumulative exposure in the St. Lawrence System.
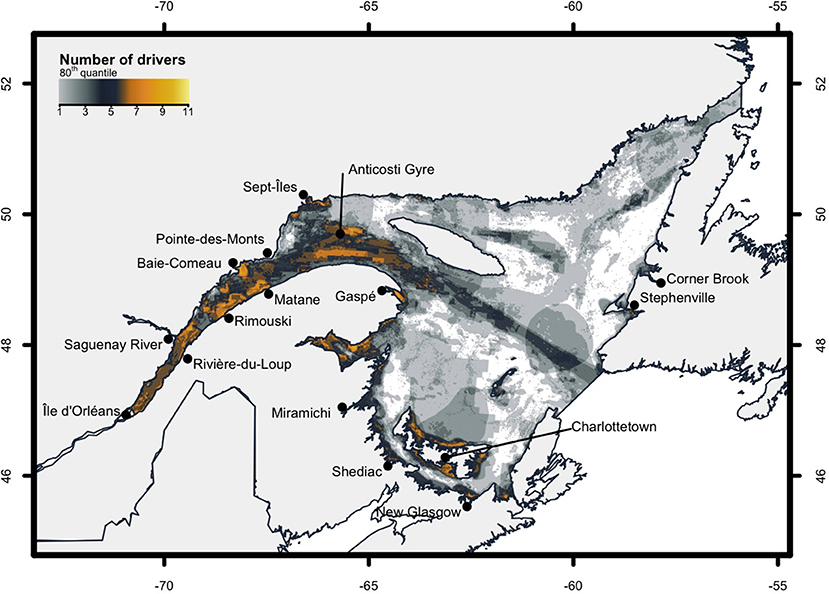
Figure 4. Distribution of cumulative hotspots in the St. Lawrence System.
These results are consistent with observations elsewhere in the world, where cumulative exposure conspicuously arises from and markedly intensifies close to coastal cities and at the mouth of rivers draining highly populated areas (e.g., Halpern et al., 2015b; Feist and Levin, 2016; Mach et al., 2017; Stock et al., 2018). These are areas where human activities (e.g., coastal development and shipping) and footprints (e.g., pollution runoff) are most intense (Feist and Levin, 2016), and on which is overlaid a background of natural disturbances (Micheli et al., 2016). They are also the areas in which the most dramatic increases in exposure are expected, with populations increasing more rapidly along coasts than inland (Feist and Levin, 2016). In the St. Lawrence, large coastal cities are mostly located along the Estuary and the southwestern Gulf, whereas the northeastern Gulf is largely uninhabited or home to small coastal communities. Certain smaller coastal communities with high cumulative exposure are characterized by large industries (e.g., Sept-Îles and Charlottetown).
As for offshore exposure, the Estuary, along with the St. Lawrence River, provide access to and serves as the primary drainage outflow of the Great Lakes Basin, which is home to over 45 million North Americans and is the most densely populated region in Canada (Statistics-Canada, 2017). Most marine traffic thus converges into the Estuary.
Whereas, we cannot ascertain that high exposure areas are the most impacted, we can safely predict that these are the areas where studying ecosystem state will be the most complex due to the uncertainty associated with driver co-occurrence, an uncertainty bound to increase rapidly with the number of co-occurring drivers (Côté et al., 2016).
3.2. Cumulative Exposure Profiles
While informative, the hypoxia-fisheries example focuses on a single pair of drivers and falls short of the number of drivers typically overlapping at high intensities throughout the St. Lawrence (Figure 4). The number of drivers overlapping in the St. Lawrence increases with cumulative exposure (Figure S3). Areas with high exposure such as the Estuary, the Anticosti Gyre, and the southwestern Gulf coastline (Figures 3, 4) are thus areas where driver interactions are most likely and where they can arise between a host of different drivers. Identifying areas with similar cumulative exposure profiles provides a crucial tool to simplify the multi-dimensional complexity of overlapping drivers (Bowler et al., 2019). This could facilitate assessments of the state of species, habitats, and ecosystems located within or moving through areas exposed to similar suites of drivers.
Six distinct clusters were identified in the St. Lawrence (Figure 5, Figures S4, S5). Based on their distribution and representative drivers, clusters can be divided into three offshore and three coastal clusters (Figure 5, Figures S6, S7). Coastal clusters (1–3; Figure 5) include all types of drivers other than hypoxia; they are also the most exposed clusters, both in terms of driver overlap and intensity. Cluster 1 encompasses the coastline and is characterized by higher direct human impact (i.e., population density). Cluster 2 is differentiated from other clusters by the presence of aquaculture sites. Cluster 3 is the most exposed and has a distribution similar to the most exposed coastal hotspots (Figure 4). This cluster is characterized by high intensities of land-based drivers (e.g., nutrient input), demersal non-destructive high bycatch fisheries (e.g., trap fishing), climate drivers and marine traffic drivers in the vicinity of ports.
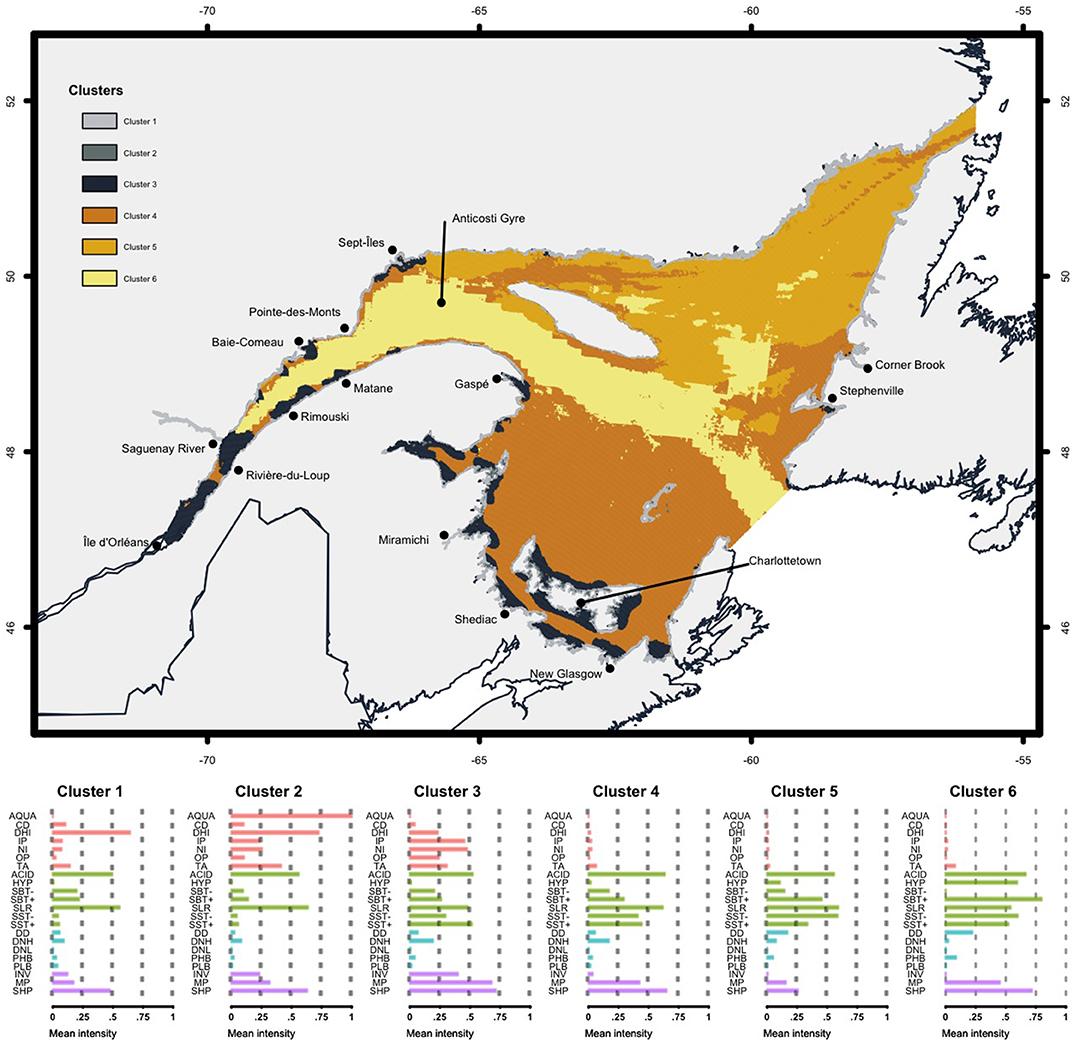
Figure 5. Distribution of areas with similar cumulative exposure profiles in the Estuary and Gulf of St. Lawrence, identified through a clustering approach (Top). Mean intensity of all coastal (red), climate (green), fisheries (blue), and marine traffic (purple) drivers within each cluster (Bottom). Refer to Table 1 for acronym meaning and to the Supplementary Materials for more details.
Offshore clusters (4–6; Figure 5) are generally characterized by high intensity climate and marine traffic drivers. Cluster 4 is differentiated by demersal non-destructive high bycatch fisheries, higher marine traffic drivers compared to cluster 5, and generally corresponds to the whole Southern Gulf. Cluster 5 is characterized by more fisheries types (i.e., demersal destructive and pelagic high bycatch), generally lower intensity marine traffic drivers, and is located almost exclusively in the Northern Gulf. Finally, cluster 6 is the most exposed offshore cluster and includes all offshore hotspots (Figure 4). It is characterized by high intensity hypoxia, marine traffic and pollution, as well as demersal destructive and pelagic high bycatch fisheries. This cluster corresponds primarily to the Laurentian Channel and incorporates parts of the Esquiman and Anticosti channels.
Clusters 3 and 6 capture most coastal and offshore hotspots and are the two most exposed clusters in the St. Lawrence. They offer some insight into the potential importance of considering spatial dynamics in areas intersecting multiple clusters. For example, clusters 3 and 6 meet at the mouth of the Saguenay River. This area is particularly dynamic, with deep Atlantic waters advected through estuarine circulation mixing with surface waters from the St. Lawrence and Saguenay rivers (Dufour and Ouellet, 2007). This results in the convergence of climate drivers from the bottom of the Laurentian Channel and marine traffic drivers (cluster 6) with terrestrial run-off from river outflows and direct human impacts (i.e., population density; cluster 3).
4. Open Knowledge Platform: eDrivers
Sharing the knowledge acquired through the description of drivers in the St. Lawrence emerged as a priority to curtail the need to contact dozens of experts across multiple organizations and over extensive periods of time to assemble the data needed for integrated research and management. It is also a requirement to ensure that this manuscript will not quickly become an outdated snapshot of drivers distribution and intensity in the St. Lawrence System, but rather serve as a stepping stone toward an adaptive and ever-improving collection of knowledge.
As such, we are launching eDrivers, an open knowledge platform focused on sharing knowledge on the distribution and intensity of drivers and on gathering a community of experts committed to structuring, standardizing and sharing knowledge on drivers in support of science and management. In launching this initiative, our objective is to uphold the highest existing standards of data management and open science. We identified four guiding principles (section 5.1) to meet this objective and structure of the initiative (Figure 6).
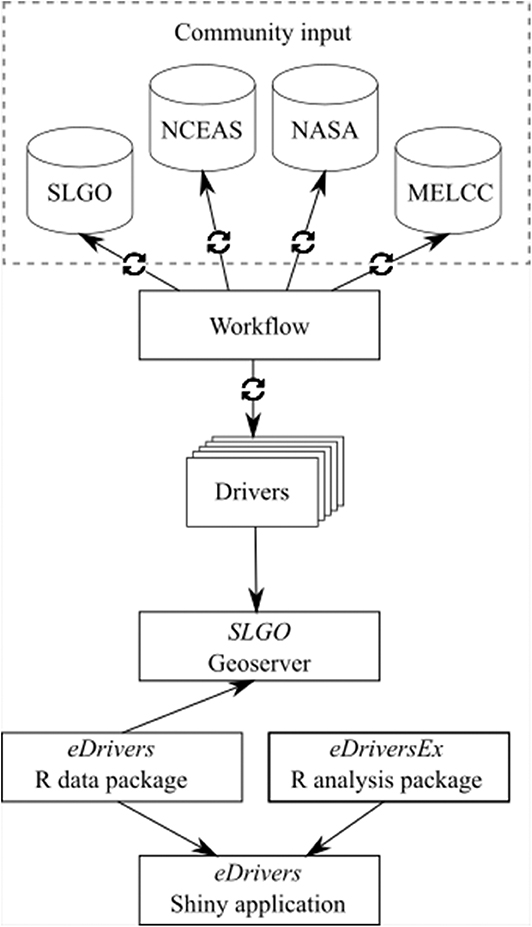
Figure 6. Diagram of the platform structure. Community input in the form of raw data is accessed through the St. Lawrence Global Observatory (SLGO; https://ogsl.ca/en) repository—the platform host—or through open access repositories (e.g., NASA data). The raw data are then processed through a workflow hosted on the eDrivers GitHub organization (https://github.com/eDrivers). Data processing may be as simple as data rescaling or make use of more complex methodologies. All data is then hosted on SLGO's geoserver and accessible through their API. We developed a R package called eDrivers to access the driver layers through R and we are actively developing a second R package called eDriversEx that will include analytical tools to explore drivers data. Finally, we have developed a Shiny application, eDrivers app, that allows users to explore drivers data interactively (https://david-beauchesne.shinyapps.io/eDriversApp/). All R components of the project are hosted and available on the eDrivers GitHub organization. Iterative and adaptive processes are identified by circular arrows.
4.1. Guiding Principles
4.1.1. Unity and Inclusiveness
Why
Operating over such large scales in time, space, and subject matter requires a vast and diverse expertise that cannot possibly be possessed by any one individual or organization. Consequently, we envision an initiative that seeks to mobilize all individuals and entities with relevant expertise.
How
By promoting, consolidating, and working with experts involved in existing and highly valuable environmental initiatives already in place in the St. Lawrence. Notable examples of environmental initiatives are the annual review of physical (Galbraith et al., 2018), chemical, and biological (Blais et al., 2019) oceanographic conditions in the St. Lawrence, the fisheries monitoring program (DFO, 2016b), the annual groundfish and shrimp multidisciplinary survey (Bourdages et al., 2018), the characterization of benthic (Dutil et al., 2011), epipelagic and coastal (Dutil et al., 2012) habitats of the St. Lawrence, and Canada's shoreline classification (ECCC, 2018). There are also nascent efforts to share information on several human activities in the St. Lawrence such as the Marine Spatial Data Infrastructure portal, which provides data on zoning, shipping, port activities, and other human activities in Canadian waters, including the St. Lawrence system (Government of Canada, 2018).
By working with existing data portals whose objective is to share environmental data. We are thus collaborating actively with the St. Lawrence Global Observatory (SLGO) to develop the initiative and to host the platform on their web portal. The mission of SLGO is to promote and facilitate the accessibility, dissemination, and exchange of official and quality data and information on the St. Lawrence ecosystem through the networking of organizations and data holders to meet their needs and those of users, to improve knowledge, and to assist decision-making in areas such as public safety, climate change, transportation, resources, and biodiversity conservation. SLGO is also one of three regional associations spearheading the Canadian Integrated Ocean Observing System (CIOOS1), which will focus on integrating oceanographic data from multiple sources to make them accessible to end-users and to enable the national coordination of ocean observing efforts by integrating isolated or inaccessible data, and by identifying gaps or duplications in observations and research efforts. We are also developing collaborations with the Portal on water knowledge2, an initiative from the Québec provincial government. The aim of this portal is to collect and share accurate, complete, and up-to-date resources on water and aquatic ecosystems to support the mandate of relevant actors and stakeholders working in water and aquatic ecosystems management.
By actively inviting, seeking, and developing collaborations as well as encouraging constructive criticism from the inception and throughout the lifetime of the platform.
By inviting external community contributions (Figure 6). External researchers or entities wishing to submit marine data will be able to do so through SLGO web portal. Submissions through other data portals will also be accepted either through the development of data sharing agreements or with the caveat that shared data are under an open source license and that they adhere to the platform data standards.
4.1.2. Findability, Accessibility, Interoperability, and Reusability
Why
Open knowledge has been propelled to the forefront of scientific research in an era of open, collaborative, and reproducible science. By moving toward large scale, cross-disciplinary research and management projects, there is a growing need to increase the efficiency of data discovery, access, interoperability, and analysis (Reichman et al., 2011; Wilkinson et al., 2016). Our goal is to foster efficient and functional open science by creating a fully open, transparent and replicable open knowledge platform.
How
By building an infrastructure adhering to the FAIR Data Principles, which states that data and metadata must be Findable, Accessible, Interoperable, and Reusable. These (sub)principles focus on the ability of humans and machines to automatically find and (re)use data and knowledge (Wilkinson et al., 2016). As the FAIR Data Principles already exist as a unified set of principles, we adopt them as a set of guiding subprinciples to our initiative.
By making data and associated tools accessible through a variety of ways: the SLGO web portal, two R packages called eDrivers3 and eDriversEx4 to access the data through SLGO's API and to provide analytical tools to explore data, respectively, and a Shiny application5 to explore drivers data interactively (Figure 6). Note that the data are currently contained within and accessible through the eDrivers R package only, as we are actively working to allow users to download selected layers from SLGO's web portal and geoserver. The functions available in eDrivers to access the data have however been developed to ensure forward compatibility once the data are migrated to SLGO's geoserver.
By defining clear data and metadata standards and specifications to support the regional standardization of current and future protocols and practices and to favor interoperability with national and international initiatives like the Essential Ocean Variables (EOV) identified by the Global Ocean Observing System (GOOS). As such, we will adopt the metadata standard currently targeted for CIOOS, i.e., the North American Profile of ISO 19115:2014—Geographic information—Metadata, a schema favored for geospatial data in Canada and the United States.
By providing version control and code access to the workflows set up to generate driver layers from raw data, the R packages and the Shiny application through a GitHub organization called eDrivers6.
4.1.3. Adaptiveness
Why
In the face of uncertainty and in an effort to address impending environmental changes, adaptive management has been identified as the chief strategy to guide efficient decision-making (e.g., Margules and Pressey, 2000; Keith et al., 2011; Jones, 2016; Chion et al., 2018) and has already been discussed in the context of multi-drivers and cumulative impact assessments (Halpern et al., 2015b; Beauchesne et al., 2016; Côté et al., 2016; Schloss et al., 2017). Adaptive management can only be truly achieved through a commitment to adaptive monitoring and data reporting (Margules and Pressey, 2000; Halpern et al., 2012; Lubchenco and Grorud-Colvert, 2015). We further contend that adaptive management requires the development of adaptive monitoring tools and infrastructures, which we seek to address through a continuously-evolving platform.
How
By setting up mechanisms structuring cyclic reviews of platform content, for the integration of new material (e.g., data and methods) as it becomes available or accessible, and by striving to provide time-series data that are crucial to assess temporal trends and potentially early-warning signals of ecosystem change (Figure 6).
4.1.4. Recognition
Why
Like peer-reviewed publications, data must also be given its due importance in scientific endeavors and thus be considered as legitimate citable products contributing to the overall scientific output of data providers (Task Group on Data Citation Standards PractOut of Cite and PractOut of Mind: The Current Sices, 2013; FORCE11, 2014). Appropriate citations should therefore be provided for all data layers used and shared by the platform.
How
By adhering to the Data Citation Principles (FORCE11, 2014), which focus on citation practices that provide appropriate credit to data products.
4.2. Using eDrivers
Using eDrivers is simplified through the tools already in place and will be increasingly accessible as the initiative evolves and other tools are developed to ease user experience. We provide an example of the ease with which the data can be accessed and used with the eDrivers R package to reproduce Figure 2 (Box 1). The code to reproduce all the analyses and figures in this manuscript is also available on GitHub7.
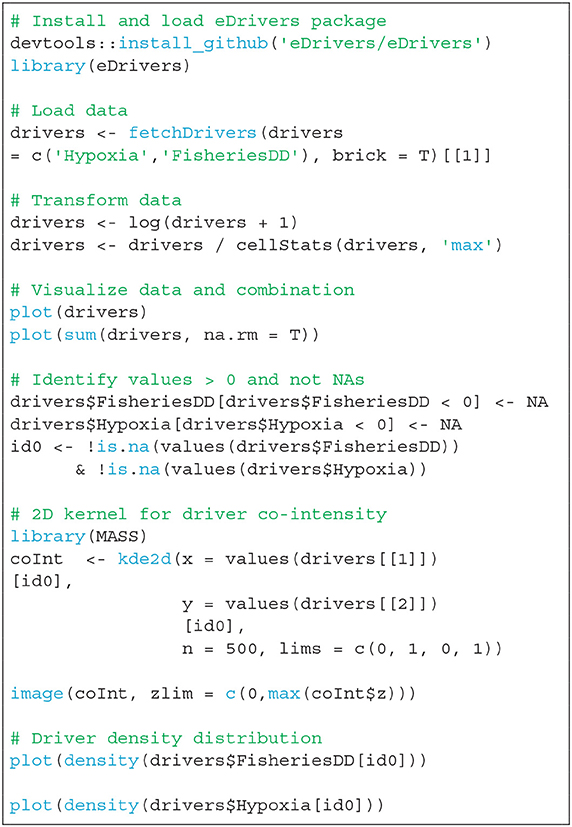
Box 1. Code snippet demonstrating how to use the eDrivers R package to reproduce Figure 2.
5. Perspectives
Understanding how ecosystem state will be affected by global change requires a comprehensive understanding of how threats are distributed and interact in space and time, which in turn hinges on appropriate data tailored to multi-driver studies (Dafforn et al., 2016; Stock et al., 2018; Bowler et al., 2019). In the St. Lawrence, we found that few areas are free from cumulative exposure and that the whole Estuary, the Anticosti Gyre, and coastal southwestern Gulf are particularly exposed to cumulative drivers, especially close to urban areas. We also identified six geographically distinct areas that display similar cumulative exposure profiles; these reveal that coastal areas are particularly exposed to all types of drivers and that certain driver combinations are inherent to certain regions of the St. Lawrence. These results allow us to efficiently identify areas in need of heightened scrutiny from a science and management perspective.
Through eDrivers, these observations will be iteratively improved toward an increasingly robust assessment of cumulative exposure and areas with similar cumulative exposure profiles as gaps in knowledge are addressed or approaches to describe drivers are refined. Arguably, the most meaningful benefit anticipated from eDrivers will be the gain in efficient access to comparable data-based knowledge on the exposure of ecosystems to multiple threats. This could pay quick scientific and management dividends by efficiently drawing on the knowledge and efforts of a wide range of contributors, by expanding avenues of scientific inquiry, by decreasing overall effort duplication and research costs, and by increasing research efficiency (Franzoni and Sauermann, 2014).
Critically, eDrivers will allow the scientific and governmental communities to identify key knowledge gaps that will assist in prioritizing and optimizing research efforts. Ultimately, we believe that eDrivers will operationalize evidence-based decision-making by streamlining data management and research, allowing science output to be available and interpretable on a time scale relevant to management (see Sutherland et al., 2004; Reichman et al., 2011). The platform will thus greatly facilitate the application of broad scale, holistic research and management approaches such as marine spatial planning, ecosystem-based management, and strategic environmental assessments (e.g., Rice, 2011; Halpern et al., 2015b; Jones, 2016).
The next step will be the inclusion of other types of knowledge to our initiative. Our focus has been on a single element required for fully operational impact assessments. Data that provide knowledge on the exposure of ecosystems to drivers are called stressor-based indicators (Dubé and Munkittrick, 2001; Dubé, 2003). These indicators efficiently identify potential local impacts and can be proactively linked to decision-making, yet assume complete knowledge of drivers and fail to diagnose impacts on valued components or non-additive effects. In contrast, effect-based indicators are direct measurements of valued components (e.g., species abundance and biodiversity) and inherently capture the effects of multiple drivers (Dubé and Munkittrick, 2001; Dubé, 2003). Whereas, effect-based indicators are considered superior to stressor-based indicators, they fail to ascribe observed effects to specific drivers. Stressor-based and effect-based indicators are, therefore, both required to diagnose causes of ecosystem change (Jones, 2016). As a collection of knowledge on stressor-based indicators, eDrivers should be weaved with other, comparable, collections of knowledge describing valued ecosystem components that can be linked to drivers and allow for a better understanding of cumulative impacts. Ultimately, interdisciplinary collections of knowledge could be weaved together through social-ecological meta-networks analyses (Dee et al., 2017). In turn, these could be used in conceptual frameworks to help to establish causal relationships between drivers and valued ecosystem components such as the DPSIR (Driving forces–Pressure–State–Impact–Response) framework (Kristensen, 2004; Gari et al., 2015). Within such frameworks, data-based indicators provided through eDrivers could be categorized as driving forces, pressures or states, depending on the objective and context of a study.
Significant effort is still needed to bring our vision to fruition. Foremost is to maintain our efforts to foster collaborations, develop platform content and identify key knowledge gaps. A fair and efficient organizational structure will be developed in order to manage eDrivers as a community and appropriate funding must be secured to continue building this community and ensure the long-term viability of the initiative, although the partnership with SLGO partly addresses this issue. We also wish to provide users with enhanced capabilities and flexibility in using the interactive tool and R package. This could include creating automatic reports and more flexibility for user-defined driver-based indicators.
Finally, terrestrial and coastal environments must be incorporated, as sources of stress within those habitats extend to the marine environments. Moreover, despite coastal areas being recognized as the most exposed to environmental threats, we continue to delineate terrestrial and marine realms, considering coastlines as an impermeable barrier. Whereas, there is a sensible rationale for this division, we must strive to eliminate it if we are to appropriately study and predict the impacts of global change (e.g., see Bowler et al., 2019).
Despite the challenges and work ahead, we are hopeful that this initiative will be very successful. Ultimately, eDrivers represents a much needed solution to address important issues in data management that could radically shift broad scale research and management practices toward efficient, adaptive and holistic ecosystem-based management in the St. Lawrence and elsewhere in the world. All it requires to be successful is for the scientific and political communities to fully commit to open knowledge, adaptive monitoring and, most of all, an integrated vision of ecosystem management.
Data Availability Statement
The datasets generated for this study are openly available. Requests to corresponding author should be made for access to raw data.
Author Contributions
DB, RD, DG, and PA conceived the manuscript and the underlying objectives. DB prepared/formatted the data, performed the analyses, was in charge of technical developments and lead the drafting of the manuscript. All co-authors contributed to data, analyses, and writing based on their respective expertise and contributed to the revision of the manuscript.
Conflict of Interest
The authors declare that the research was conducted in the absence of any commercial or financial relationships that could be construed as a potential conflict of interest.
Acknowledgments
We thank the Fond de Recherche Québécois Nature et Technologie (FRQNT) and the Natural Science and Engineering Council of Canada (CRSNG) for financial support. This project is also supported by Québec Océan, the Quebec Centre for Biodiversity Science (QCBS), Takuvik, and the Notre Golfe networks. This research is also sponsored by the NSERC Canadian Healthy Oceans Network and its Partners: Department of Fisheries and Oceans Canada and INREST (representing the Port of Sept-Îles and City of Sept-Îles).
Supplementary Material
The Supplementary Material for this article can be found online at: https://www.frontiersin.org/articles/10.3389/fmars.2020.00383/full#supplementary-material
Footnotes
2. ^http://www.environnement.gouv.qc.ca/eau/portail/
3. ^https://github.com/eDrivers/eDrivers
4. ^https://github.com/eDrivers/eDriversEx
5. ^https://david-beauchesne.shinyapps.io/eDriversApp/
References
AAF (2016). Marine Aquaculture Site Mapping Program (MASMP). Department of Agriculture, Aquaculture and Fisheries (AAF); Government of New-Brunswick. Available online at: https://www2.gnb.ca/content/gnb/en/departments/10/aquaculture/content/masmp.html
Archambault, P., Schloss, I. R., Grant, C., and Plante, S. eds. (2017). Les Hydrocarbures dans le Golfe du Saint-Laurent - Enjeux Sociaux, Économiques et Environnementaux. Rimouski, QC: Notre Golfe.
Assis, J., Tyberghein, L., Bosch, S., Verbruggen, H., Serrão, E. A., and Clerck, O. D. (2018). Bio-ORACLE v2.0: extending marine data layers for bioclimatic modelling. Glob. Ecol. Biogeogr. 27, 277–284. doi: 10.1111/geb.12693
Bates, S. S., Beach, D. G., Comeau, L. A., Haigh, N., Lewis, N. I., Locke, A., et al. (2019). Marine harmful algal blooms and phycotoxins of concern to Canada. Can. Tech. Rep. Fish. Aquat. Sci. 145, 1–14. doi: 10.1016/j.jmarsys.2014.12.002
Beauchesne, D., Grant, C., Gravel, D., and Archambault, P. (2016). L'évaluation des impacts cumulés dans l'estuaire et le golfe du Saint-Laurent : vers une planification systémique de l'exploitation des ressources. Le Natur. Can. 140, 45–55. doi: 10.7202/1036503ar
Benoît, H. P., Gagné, J. A., Savenkoff, C., Ouellet, P., and Bourassa, M.-N. (2012). State of the Ocean Report for the Gulf of St. Lawrence Integrated Management (GOSLIM). Department of Fisheries and Oceans.
Blais, M., Galbraith, P. S., Plourde, S., Scarratt, M., Devine, L., and Lehoux, C. (2019). Chemical and Biological Oceanographic Conditions in the Estuary and Gulf of St. Lawrence During 2017 [Preprint]. Department of Fisheries and Oceans.
Bourdages, H., Marquis, M.-C., Nozères, C., and Ouellette-Plante, J. (2018). Assessment of Northern Shrimp Stocks in the Estuary and Gulf of St. Lawrence in 2017: Data From the Research Survey. DFO Can. Sci. Advis. Sec. Res. Doc.
Bowler, D. E., Bjorkman, A. D., Dornelas, M., Myers-Smith, I. H., Navarro, L. M., Niamir, A., et al. (2019). Mapping human pressures across the planet uncovers anthropogenic threat complexes. bioRxiv. 432880. doi: 10.1101/432880
Côté, I. M., Darling, E. S., and Brown, C. J. (2016). Interactions among ecosystem stressors and their importance in conservation. Proc. R. Soc. B Biol. Sci. 283:20152592. doi: 10.1098/rspb.2015.2592
Chion, C., Turgeon, S., Cantin, G., Michaud, R., Ménard, N., Lesage, V., et al. (2018). A voluntary conservation agreement reduces the risks of lethal collisions between ships and whales in the St. Lawrence Estuary (Québec, Canada): from co-construction to monitoring compliance and assessing effectiveness. PLoS ONE 13:e0202560. doi: 10.1371/journal.pone.0202560
Clarke, K. R. (1993). Non-parametric multivariate analyses of changes in community structure. Austr. J. Ecol. 18, 117–143. doi: 10.1111/j.1442-9993.1993.tb00438.x
Crain, C. M., Kroeker, K., and Halpern, B. S. (2008). Interactive and cumulative effects of multiple human stressors in marine systems. Ecol. Lett. 11, 1304–1315. doi: 10.1111/j.1461-0248.2008.01253.x
Dafforn, K. A., Johnston, E. L., Ferguson, A., Humphrey, C. L., Monk, W., Nichols, S. J., et al. (2016). Big data opportunities and challenges for assessing multiple stressors across scales in aquatic ecosystems. Mar. Freshw. Res. 67, 393–413. doi: 10.1071/MF15108
Darling, E. S., and Côté, I. M. (2008). Quantifying the evidence for ecological synergies. Ecol. Lett. 11, 1278–1286. doi: 10.1111/j.1461-0248.2008.01243.x
Dee, L. E., Allesina, S., Bonn, A., Eklöf, A., Gaines, S. D., Hines, J., et al. (2017). Operationalizing network theory for ecosystem service assessments. Trends Ecol. Evol. 32, 118–130. doi: 10.1016/j.tree.2016.10.011
Dempsey, D. P., Gentleman, W. C., Pepin, P., and Koen-Alonso, M. (2018). Explanatory power of human and environmental pressures on the fish community of the grand bank before and after the biomass collapse. Front. Marine Sci. 5:37. doi: 10.3389/fmars.2018.00037
DFO (2016a). Prince Edward Island Aquaculture Leases. Aquaculture Division. Prince-Edward-Island: Department of Fisheries and Oceans Canada (DFO). Available online at: http://www.arcgis.com/home/item.html?id=16aa8830c7084a8a92ce066b525978b4
DFO (2016b). Zonal Interchange File Format (ZIFF) Data. A Compilation of Landing Data From Logbook Data Between 2010 and 2015. Mont-Joli, QC: Gestion des données, Institut Maurice Lamontagne; Department of Fisheries and Oceans (DFO).
Dubé, M., and Munkittrick, K. (2001). Integration of effects-based and stressor-based approaches into a holistic framework for cumulative effects assessment in aquatic ecosystems. Hum. Ecol. Risk Assess. 7, 247–258. doi: 10.1080/20018091094367
Dubé, M. G. (2003). Cumulative effect assessment in Canada: A regional framework for aquatic ecosystems. Environ. Impact Assess. Rev. 23, 723–745. doi: 10.1016/S0195-9255(03)00113-6
Dufour, R., and Ouellet, P. (2007). Estuary and Gulf of St. Lawrence Marine Ecosystem Overview and Assessment Report. Can. Tech. Rep. Fish. Aquat. Sci.
Dutil, J.-D., Proulx, S., Chouinard, P.-M., and Borcard, D. (2011). A Hierarchical Classification of the Seabed Based on Physiographic and Oceanographic Features in the St. Lawrence. Can. Tech. Rep. Fish. Aquat. Sci.
Dutil, J.-D., Proulx, S., Galbraith, P. S., Chassé, J., Lambert, N., and Laurian, C. (2012). Coastal and epipelagic habitats of the estuary and Gulf of St. Lawrence. Can. Tech. Rep. Fish. Aquat. Sci. 3009: Ix + 87 pp.
Earth observation group (2019). Version 1 VIIRS Day/Night Band Nighttime Lights. NOAA National Centers for Environmental Information (NCEI).
ECCC (2018). Environment and Climate Change Canada's (ECCC) Atlantic Shoreline Classification. Available online at: https://open.canada.ca/data/en/dataset/30449352-2556-42df-9ffe-47ea8e696f91 (accessed September 19, 2019).
El-Sabh, M. I., and Silverberg, N. (eds.). (1990). Oceanography of a Large-Scale Estuarine System. New York, NY: Springer.
Eppler, M. J., and Mengis, J. (2004). The concept of information overload: a review of literature from organization science, accounting, marketing, MIS, and related disciplines. Inform. Soc. 20, 325–344. doi: 10.1080/01972240490507974
FA (2016). Aquaculture Site Mapping Tool. Department of Fisheries and Aquaculture (FA); Department of Agriculture; Government of Nova-Scotia. Available online at: https://novascotia.ca/fish/aquaculture/site-mapping-tool/
Feist, B. E., and Levin, P. S. (2016). Novel indicators of anthropogenic influence on marine and coastal ecosystems. Front. Mar. Sci. 3:113. doi: 10.3389/fmars.2016.00113
FFA (2016). Description of Aquaculture Sites in Newfoundland. Department of Fisheries, Forestry and Agrifoods (FFA); Government of Newfoundland and Labrador.
FORCE11 (2014). Data Citation Synthesis Group: Joint Declaration of Data Citation Principles. San Diego, CA: FORCE11.
Frank, K. T., Petrie, B., Choi, J. S., and Leggett, W. C. (2005). Trophic cascades in a formerly Cod-dominated ecosystem. Science 308, 1621–1623. doi: 10.1126/science.1113075
Franzoni, C., and Sauermann, H. (2014). Crowd science: the organization of scientific research in open collaborative projects. Res. Policy 43, 1–20. doi: 10.1016/j.respol.2013.07.005
Galbraith, P. S., Chassé, J., Caverhill, C., Nicot, P., Gilbert, D., Lefaivre, D., et al. (2018). Physical Oceanographic Conditions in the Gulf of St. Lawrence during 2017. DFO Can. Sci. Advis. Sec. Res. Doc. 2018/050. Department of Fisheries and Oceans.
Gari, S. R., Newton, A., and Icely, J. D. (2015). A review of the application and evolution of the DPSIR framework with an emphasis on coastal social-ecological systems. Ocean Coast. Manage. 103, 63–77. doi: 10.1016/j.ocecoaman.2014.11.013
Government of Canada (2018). Marine Spatial Data Infrastructure Portal. Available online at: http://msdi-idsm.maps.arcgis.com/home/index.html (accessed November 19, 2019).
Halpern, B. S., Frazier, M., Afflerbach, J., Lowndes, J. S., Micheli, F., O'Hara, C., et al. (2019). Recent pace of change in human impact on the world's ocean. Sci. Rep. 9:11609. doi: 10.1038/s41598-019-47201-9
Halpern, B. S., Frazier, M., Potapenko, J., Casey, K. S., Koenig, K., Longo, C., et al. (2015a). Cumulative Human Impacts: Raw Stressor Data (2008 and 2013). Knowledge Network for Biocomplexity. doi: 10.5063/f1s180fs
Halpern, B. S., Frazier, M., Potapenko, J., Casey, K. S., Koenig, K., Longo, C., et al. (2015b). Spatial and temporal changes in cumulative human impacts on the world's ocean. Nat. Commun. 6:7615. doi: 10.1038/ncomms8615
Halpern, B. S., Longo, C., Hardy, D., McLeod, K. L., Samhouri, J. F., Katona, S. K., et al. (2012). An index to assess the health and benefits of the global ocean. Nature 488, 615–620. doi: 10.1038/nature11397
Halpern, B. S., Walbridge, S., Selkoe, K. A., Kappel, C. V., Micheli, F., D'Agrosa, C., et al. (2008). A global map of human impact on marine ecosystems. Science 319, 948–952. doi: 10.1126/science.1149345
Jones, F. C. (2016). Cumulative effects assessment: theoretical underpinnings and big problems. Environ. Rev. 24, 187–204. doi: 10.1139/er-2015-0073
Kaufman, L., and Rousseeuw, P. (1990). Finding Groups in Data: An Introduction to Cluster Analysis. New York, NY: Wiley.
Keith, D. A., Martin, T. G., McDonald-Madden, E., and Walters, C. (2011). Uncertainty and adaptive management for biodiversity conservation. Biol. Conserv. 144, 1175–1178. doi: 10.1016/j.biocon.2010.11.022
Lubchenco, J., and Grorud-Colvert, K. (2015). Making waves: The science and politics of ocean protection. Science 350, 382–383. doi: 10.1126/science.aad5443
Mach, M. E., Wedding, L. M., Reiter, S. M., Micheli, F., Fujita, R. M., and Martone, R. G. (2017). Assessment and management of cumulative impacts in California's network of marine protected areas. Ocean Coast. Manage. 137, 1–11. doi: 10.1016/j.ocecoaman.2016.11.028
Maechler, M., Rousseeuw, P., Struyf, A., Hubert, M., and Hornik, K. (2018). Cluster: Cluster Analysis Basics and Extensions.
MAPAQ (2016). Description des Sites Maricoles de la Province de Québec. Sous-ministériat aux pêches et à l'aquaculture Commerciales, Direction Régionale des Îles-de-la-Madeleine. Ministère de l'Agriculture, des Pêcheries et de l'Alimentation du Québec (MAPAQ). Ministère de l'Agriculture, des Pêcheries et de l'Alimentation du Québec.
Margules, C. R., and Pressey, R. L. (2000). Systematic conservation planning. Nature 405, 243–253. doi: 10.1038/35012251
Micheli, F., Heiman, K. W., Kappel, C. V., Martone, R. G., Sethi, S. A., Osio, G. C., et al. (2016). Combined impacts of natural and human disturbances on rocky shore communities. Ocean Coast. Manage. 126, 42–50. doi: 10.1016/j.ocecoaman.2016.03.014
OBIS (2019). Ocean Biogeographic Information System. Intergovernmental Oceanographic Commission of UNESCO. Available online at: www.Iobis.org (accessed April 19, 2019).
O'Brien, A. L., Dafforn, K. A., Chariton, A. A., Johnston, E. L., and Mayer-Pinto, M. (2019). After decades of stressor research in urban estuarine ecosystems the focus is still on single stressors: a systematic literature review and meta-analysis. Sci. Tot. Environ. 684, 753–764. doi: 10.1016/j.scitotenv.2019.02.131
Plourde, S., Galbraith, P. S., Lesage, V., Grégoire, F., Bourdages, H., Gosselin, J.-F., et al. (2014). Ecosystem Perspective on Changes and Anomalies in the Gulf of St. Lawrence: A Context in Support of the Management of the St. Lawrence Beluga Whale Population. DFO Can. Sci. Advis. Sec. Res. Doc.
Reichman, O. J., Jones, M. B., and Schildhauer, M. P. (2011). Challenges and Opportunities of Open Data in Ecology. Science 331, 703–705. doi: 10.1126/science.1197962
Rice, J. (2011). Managing fisheries well: Delivering the promises of an ecosystem approach. Fish Fish. 12, 209–231. doi: 10.1111/j.1467-2979.2011.00416.x
RQM (2018). Réseau Québec Maritime (RQM). Available online at: http://rqm.quebec/en/home/ (accessed November 19, 2019).
Saucier, F. J., Roy, F., Gilbert, D., Pellerin, P., and Ritchie, H. (2003). Modeling the formation and circulation processes of water masses and sea ice in the Gulf of St. Lawrence, Canada. J. Geophys. Res. 108. doi: 10.1029/2000JC000686
Savenkoff, C., Vézina, A. F., Roy, S., Klein, B., Lovejoy, C., Therriault, J. C., et al. (2000). Export of biogenic carbon and structure and dynamics of the pelagic food web in the Gulf of St. Lawrence Part 1. Seasonal variations. Deep Sea Res. Part II 47, 585–607. doi: 10.1016/S0967-0645(99)00119-8
Schloss, I. R., Archambault, P., Beauchesne, D., Cusson, M., Ferreyra, G., Levasseur, M., et al. (2017). “Cumulative potential impacts of the stress factors associated with human activities on the St. Lawrence marine ecosystem,” in Hydrocarbon in the Gulf of St. Lawrence - Social, Economic and Environmental Issues, eds P. Archambault, I. R. Schloss, C. Grant, and S. Plante (Rimouski, QC: Notre Golfe), 133–165.
Starr, M., and Chassé, J. (2019). Distribution of Omega Aragonite in the Estuary and Gulf of St. Lawrence in Eastern Canada. Department of Fisheries and Oceans; Department of Fisheries and Oceans.
Statistics-Canada (2017). Population and Dwelling Count Highlight Tables. 2016 Census. Statistics Canada Catalogue no. 98-402-X2016001. Ottawa, ON: Statistics Canada.
Stock, A., Haupt, A. J., Mach, M. E., and Micheli, F. (2018). Mapping ecological indicators of human impact with statistical and machine learning methods: tests on the California coast. Ecol. Inform. 48, 37–47. doi: 10.1016/j.ecoinf.2018.07.007
Sutherland, W. J., Pullin, A. S., Dolman, P. M., and Knight, T. M. (2004). The need for evidence-based conservation. Trends Ecol. Evol. 19, 305–308. doi: 10.1016/j.tree.2004.03.018
Task Group on Data Citation Standards and PractOut of Cite, Out of Mind: The Current Sices, C.-I., and PractOut of Mind: The Current Sices, C.-I. (2013). Out of cite, out of mind: the current state of practice, policy, and technology for the citation of data. Data Sci. J. 12, CIDCR1–CIDCR7. doi: 10.2481/dsj.OSOM13-043
White, L., and Johns, F. (1997). Marine Environmental Assessment of the Estuary and Gulf of St. Lawrence. Department of Fisheries and Oceans.
Keywords: ocean observing systems, St. Lawrence, cumulative exposure, multiple stressors, global change
Citation: Beauchesne D, Daigle RM, Vissault S, Gravel D, Bastien A, Bélanger S, Bernatchez P, Blais M, Bourdages H, Chion C, Galbraith PS, Halpern BS, Lavoie C, McKindsey CW, Mucci A, Pineault S, Starr M, Ste-Marie A-S and Archambault P (2020) Characterizing Exposure to and Sharing Knowledge of Drivers of Environmental Change in the St. Lawrence System in Canada. Front. Mar. Sci. 7:383. doi: 10.3389/fmars.2020.00383
Received: 01 May 2019; Accepted: 05 May 2020;
Published: 24 June 2020.
Edited by:
Saskia Anna Otto, University of Hamburg, GermanyReviewed by:
Caihong Fu, Department of Fisheries and Oceans, CanadaSean Lucey, Northeast Fisheries Science Center (NOAA), United States
Copyright © 2020 Beauchesne, Daigle, Vissault, Gravel, Bastien, Bélanger, Bernatchez, Blais, Bourdages, Chion, Galbraith, Halpern, Lavoie, McKindsey, Mucci, Pineault, Starr, Ste-Marie and Archambault. This is an open-access article distributed under the terms of the Creative Commons Attribution License (CC BY). The use, distribution or reproduction in other forums is permitted, provided the original author(s) and the copyright owner(s) are credited and that the original publication in this journal is cited, in accordance with accepted academic practice. No use, distribution or reproduction is permitted which does not comply with these terms.
*Correspondence: David Beauchesne, ZGF2aWQuYmVhdWNoZXNuZSYjeDAwMDQwO3VxYXIuY2E=