 Francesco Caruso1
 Lijun Dong1Mingli Lin1
 Mingming Liu1,2Zining Gong1,3Wanxue Xu1,3
 Giuseppe Alonge4Songhai Li1*
- 1Marine Mammal and Marine Bioacoustics Laboratory, Institute of Deep-sea Science and Engineering, Chinese Academy of Sciences (CAS), Sanya, China
- 2Department of Earth Sciences, University of Chinese Academy of Sciences, Beijing, China
- 3Department of Electronic, Electrical and Communication Engineering, University of Chinese Academy of Sciences, Beijing, China
- 4Italian National Agency for New Technologies, Energy and Sustainable Economic Development (ENEA)—Observations and Measures for the Environment and Climate, Palermo, Italy
Passive acoustic monitoring (PAM) is increasingly being adopted as a non-invasive method for the assessment of ocean ecological dynamics. PAM is an important sampling approach for acquiring critical information about marine mammals, especially in areas where data are lacking and where evaluations of threats for vulnerable populations are required. The Indo-Pacific humpback dolphin (IPHD, Sousa chinensis) is a coastal species which inhabits tropical and warm-temperate waters from the eastern Indian Ocean throughout Southeast Asia to central China. A new population of this species was recently discovered in waters southwest of Hainan Island, China. An array of passive acoustic platforms was deployed at depths of 10–20 m (the preferred habitat of humpback dolphins), across sites covering more than 100 km of coastline. In this study, we explored whether the acoustic data recorded by the array could be used to classify IPHD echolocation clicks, with the aim of investigating the spatiotemporal patterns of distribution and acoustic behavior of this species. A number of supervised machine learning algorithms were trained to automatically classify echolocation clicks from the different types of short-broadband pulses recorded. The best performance was reported by a cubic support vector machine (Cubic SVM), which was applied to 19,215 5-min recordings (∼4.2 TB), collected over a period of 75 days at six locations. Subsequently, using spectrogram visualization and audio listening, human operators confirmed the presence of clicks within the selected files. Additionally, other dolphin vocalizations (including whistles, buzzes, and burst pulses) and different sound sources (soniferous fishes, snapping shrimps, human activities) were also reported. The detection range of IPHD clicks was estimated using a transmission loss (TL) model and the performance of the trained classifier was compared with data synchronously collected by an acoustic data logger (A-tag). This study demonstrates that the distribution and habitat use of a coastal and resident dolphin species can be monitored over a large spatiotemporal scale, using an array of passive acoustic platforms and a data analysis protocol that includes both machine learning techniques and spectrogram inspection.
Introduction
Cetaceans evolved from terrestrial ancestors, and their morphology and physiology have adapted to enable them to live as air-breathers in the vast ocean (Perrin et al., 2009). In conjunction with this, their methods of interacting with conspecifics and the surrounding environment have also evolved; and sound is their primary resource for communication (Au, 1993; Tyack and Clark, 2000). Species from the Delphinidae family have exceptional acoustic capabilities and rely on sounds for many vital life functions (e.g., navigation, foraging, feeding, intraspecies communication, coordination, and predator detection). However, determining the distribution of dolphins and their habitat use presents a significant challenge (Tyack, 2008). In comparison to visual and photo-identification surveys which only provide information on surface activities over limited time periods, passive acoustic monitoring (PAM) can be applied continuously over extended periods of time, even in rough weather conditions (Mellinger et al., 2007). PAM is a non-invasive and reliable method for surveying mobile and phonating marine organisms, which can provide information regarding species distribution and activity at high spatiotemporal resolutions (Wang et al., 2016; Hildebrand et al., 2019; Monczak et al., 2019). It is especially useful for marine mammals that are otherwise difficult to visually monitor in the natural environment (Cato and McCauley, 2001).
The use of multiple synchronized acoustic recorders can improve our understanding of cetacean movements and vocalizations across large sampling areas and can be useful for studying changes in acoustic behavior over a range of spatial and temporal scales. Large networks of acoustic and seismic sensors have been used to study the calling behavior of baleen whales (Tervo et al., 2012; Guazzo et al., 2017; Fournet et al., 2018; Leroy et al., 2018) using low-frequency data from seafloor seismic surveys (Wilcock, 2012; Caruso et al., 2016). Arrays of recorders have also been utilized to investigate the occurrence and distribution of cetacean species with smaller home ranges, such as resident coastal dolphins (Munger et al., 2016; Temple et al., 2016; Giorli and Au, 2017; Lammers et al., 2017). In recent years, the identification of dolphin vocalizations using large acoustic datasets has improved our ability to study these animals in the wild (Zimmer, 2011). Moreover, the correlation between dolphin acoustic behavior and ambient noise (natural, anthropogenic, and other biological sources) can provide additional insights into their ecology and habitats (Lammers et al., 2017; Marley et al., 2017). In particular, the monitoring of coastal dolphins is essential to identify critical areas of habitat use and mitigate the impacts of anthropogenic activities (Ingram and Rogan, 2002).
Our improved ability to acquire acoustic data continuously from multiple recording stations over extended periods of time has increased the use of automatic signal identification techniques (Zimmer, 2011) and machine learning approaches (Bianco et al., 2019) for detecting marine mammal vocalizations (Shiu et al., 2020). Several detection and classification algorithms have been developed to identify cetacean sounds, particularly the echolocation clicks of toothed whales (Soldevilla et al., 2008; Roch et al., 2011, 2015; Giorli et al., 2016; Caruso et al., 2017; Giorli and Goetz, 2019; Hildebrand et al., 2019). Compared to manual analysis methods (spectrogram analysis), such algorithms have the advantage of being able to quickly and reliably analyze large amounts of data and produce standardized measures of sound characteristics that can be used for statistical analysis (Giorli et al., 2016; Caruso et al., 2017). Among automatic detection systems for small cetaceans (porpoises and dolphins), one approach is the use of data loggers that identify echolocation clicks and provide rapid information regarding animal distribution and biosonar activity (Akamatsu et al., 2005, 2011; Bailey et al., 2010). These instruments save information from detection events and a number of other signal parameters without keeping audio data (Dong et al., 2017; Zein et al., 2019). This allows the user to collect data over extended periods of time without the need to recharge the device’s batteries and without requiring large amounts of memory. This method is limited, however, in that it is unable to provide a full acoustic description of the behavior and surrounding habitat of the species recorded (e.g., vocal repertoire, other sound sources, effect of noise, soundscape trends).
The Indo-Pacific humpback dolphin (IPHD, Sousa chinensis) is a species of coastal Delphinidae which inhabits tropical and warm-temperate waters from eastern India throughout Southeast Asia to central China (Jefferson and Rosenbaum, 2014). At least seven or eight populations are found in Chinese waters (Jefferson and Hung, 2004; Jefferson et al., 2017). The IPHD is classified as “Vulnerable” on the International Union for Conservation of Nature and Natural Resources (IUCN) Red List (Jefferson et al., 2017), is listed as a Grade I National Key Protected Animal by China’s Wild Animal Protection Law (issued in 1988) and its protection is of global interest. However, the distribution and abundance of the IPHD is yet to be comprehensively evaluated (Chen et al., 2009; Jefferson et al., 2017). Generally, it is known that the IPHD prefers enclosed inshore habitats (e.g., estuarine areas, bays, rocky reefs, coastal lagoons, and mangrove swamps), which are shallower than 20–30 m and within a few km from the coast (Ross et al., 1994; Jefferson and Hung, 2004; Parra and Ross, 2009). Furthermore, humpback dolphins are extremely vocal and their acoustic behavior plays a fundamental role in both their recognition of the environment and in mediating social interactions (Van Parijs and Corkeron, 2001; Li et al., 2013).
According to local ecological knowledge and line transect boat-based surveys conducted since 2013, a new IPHD population was recorded in the waters southwest of Hainan Island (northern South China Sea, China) for the first time in 2014 (Li et al., 2016). This finding extended the known distribution of the IPHD more than 300 km southward in Chinese waters (Li et al., 2016). Subsequently, extensive boat-based surveys, conducted over 4 years in the waters southwest of Hainan Island have reported over 30 sightings of IPHDs. This suggests that this population of IPHDs occupy a larger home range than other populations previously described in Chinese waters and in other regions of the world (Karczmarski and Cockcroft, 1998; Keith et al., 2002; Cagnazzi et al., 2011; Xu et al., 2015; Jefferson et al., 2017; Wu et al., 2017). However, little is known regarding this new population of IPHD (Li et al., 2016). Research is required to determine its spatiotemporal distribution and behavior, in order to identify its core habitat, develop conservation management plans which may include the designation of marine protected areas (MPAs).
Several passive acoustic projects have been carried out on the world’s largest population of IPHD in the Pearl River Estuary (China), which has the highest economic development and most severe impact from human coastal activities in China (He et al., 2014). These studies revealed important information regarding the species’ biosonar activity, temporal occurrence, relationship with fish choruses (prey availability), and the potential impact of anthropogenic noise (Wang et al., 2014, 2015, 2019; Pine et al., 2017a, b). Long-term PAM of the IPHD has also been conducted at multiple sampling sites north of Lantau Island (Hong Kong), as a part of the environmental impact assessments for several development coastal projects (Munger et al., 2016). However, PAM has never been proposed to investigate a recently discovered population. Designing a sampling protocol to collect accurate information from large areas of shallow water is challenging. However, passive acoustics, in the form of an array of sensors installed along the coastline, can be used to collect data from zones which are currently data-deficient for marine mammals, and subsequently less studied IPHD populations. Moreover, as specific acoustic behavior is identified across multiple PAM sites, ecological data from cetacean hotspots are acquired simultaneously. Thus, through the analysis of other sound sources recorded concurrently, the detection of dolphin vocalizations may provide additional information on their fine-scale activity (e.g., habitat use) within their supposed area of residence.
In this study, we demonstrate the use of PAM for investigating the IPHD population reported in the shallow waters of Hainan Island. A sampling plan and data analysis protocol were developed and tested. We aimed to apply this novel method to studying the habitat of a vulnerable dolphin species, to assess the potential impacts associated with coastal construction activities and to the development of a Habitat Conservation Plan.
Methods
Study Area and Passive Acoustic Platforms
The study was carried out in the southwestern waters of Hainan Island, in the coastal area spanning from Sanya to Dongfang (Figure 1). Selection was based on preliminary results from previous periodical boat-based visual surveys and local ecological knowledge (Lin et al., 2019). During visual surveys, only IPHD and Indo-Pacific finless porpoise (IPFP, Neophocaena phocaenoides) were observed in the study area. An array of seven PAM platforms (named from P#0 to P#6) were installed on the ocean floor in very shallow waters (10–20 m in depth, Figure 1A). Each platform consisted of a frame supporting a concrete weight and stainless-steel tubes that protected the hydrophone inside the structure (Figure 1B). PAM platform locations were selected based on information from previous visual surveys and the available literature regarding movements and migration patterns of global humpback dolphin populations, which reported ranges of approximately 100–150 km (Karczmarski and Cockcroft, 1998; Keith et al., 2002; Cagnazzi et al., 2011; Jefferson et al., 2017). In our study area, groups of dolphins were usually sighted traveling at less than 20 km/h. Therefore, a distance of approximately 15–20 km between each platform was chosen. The PAM sampling sites were not progressively named numerically from south to north because platform #0 was previously operated by another PAM study (Dong et al., 2017). The PAM platform deployments were carried out during a 5-day cruise between 25 February and 1 March 2018. The area around each monitoring site was characterized by a sandy–muddy seabed.
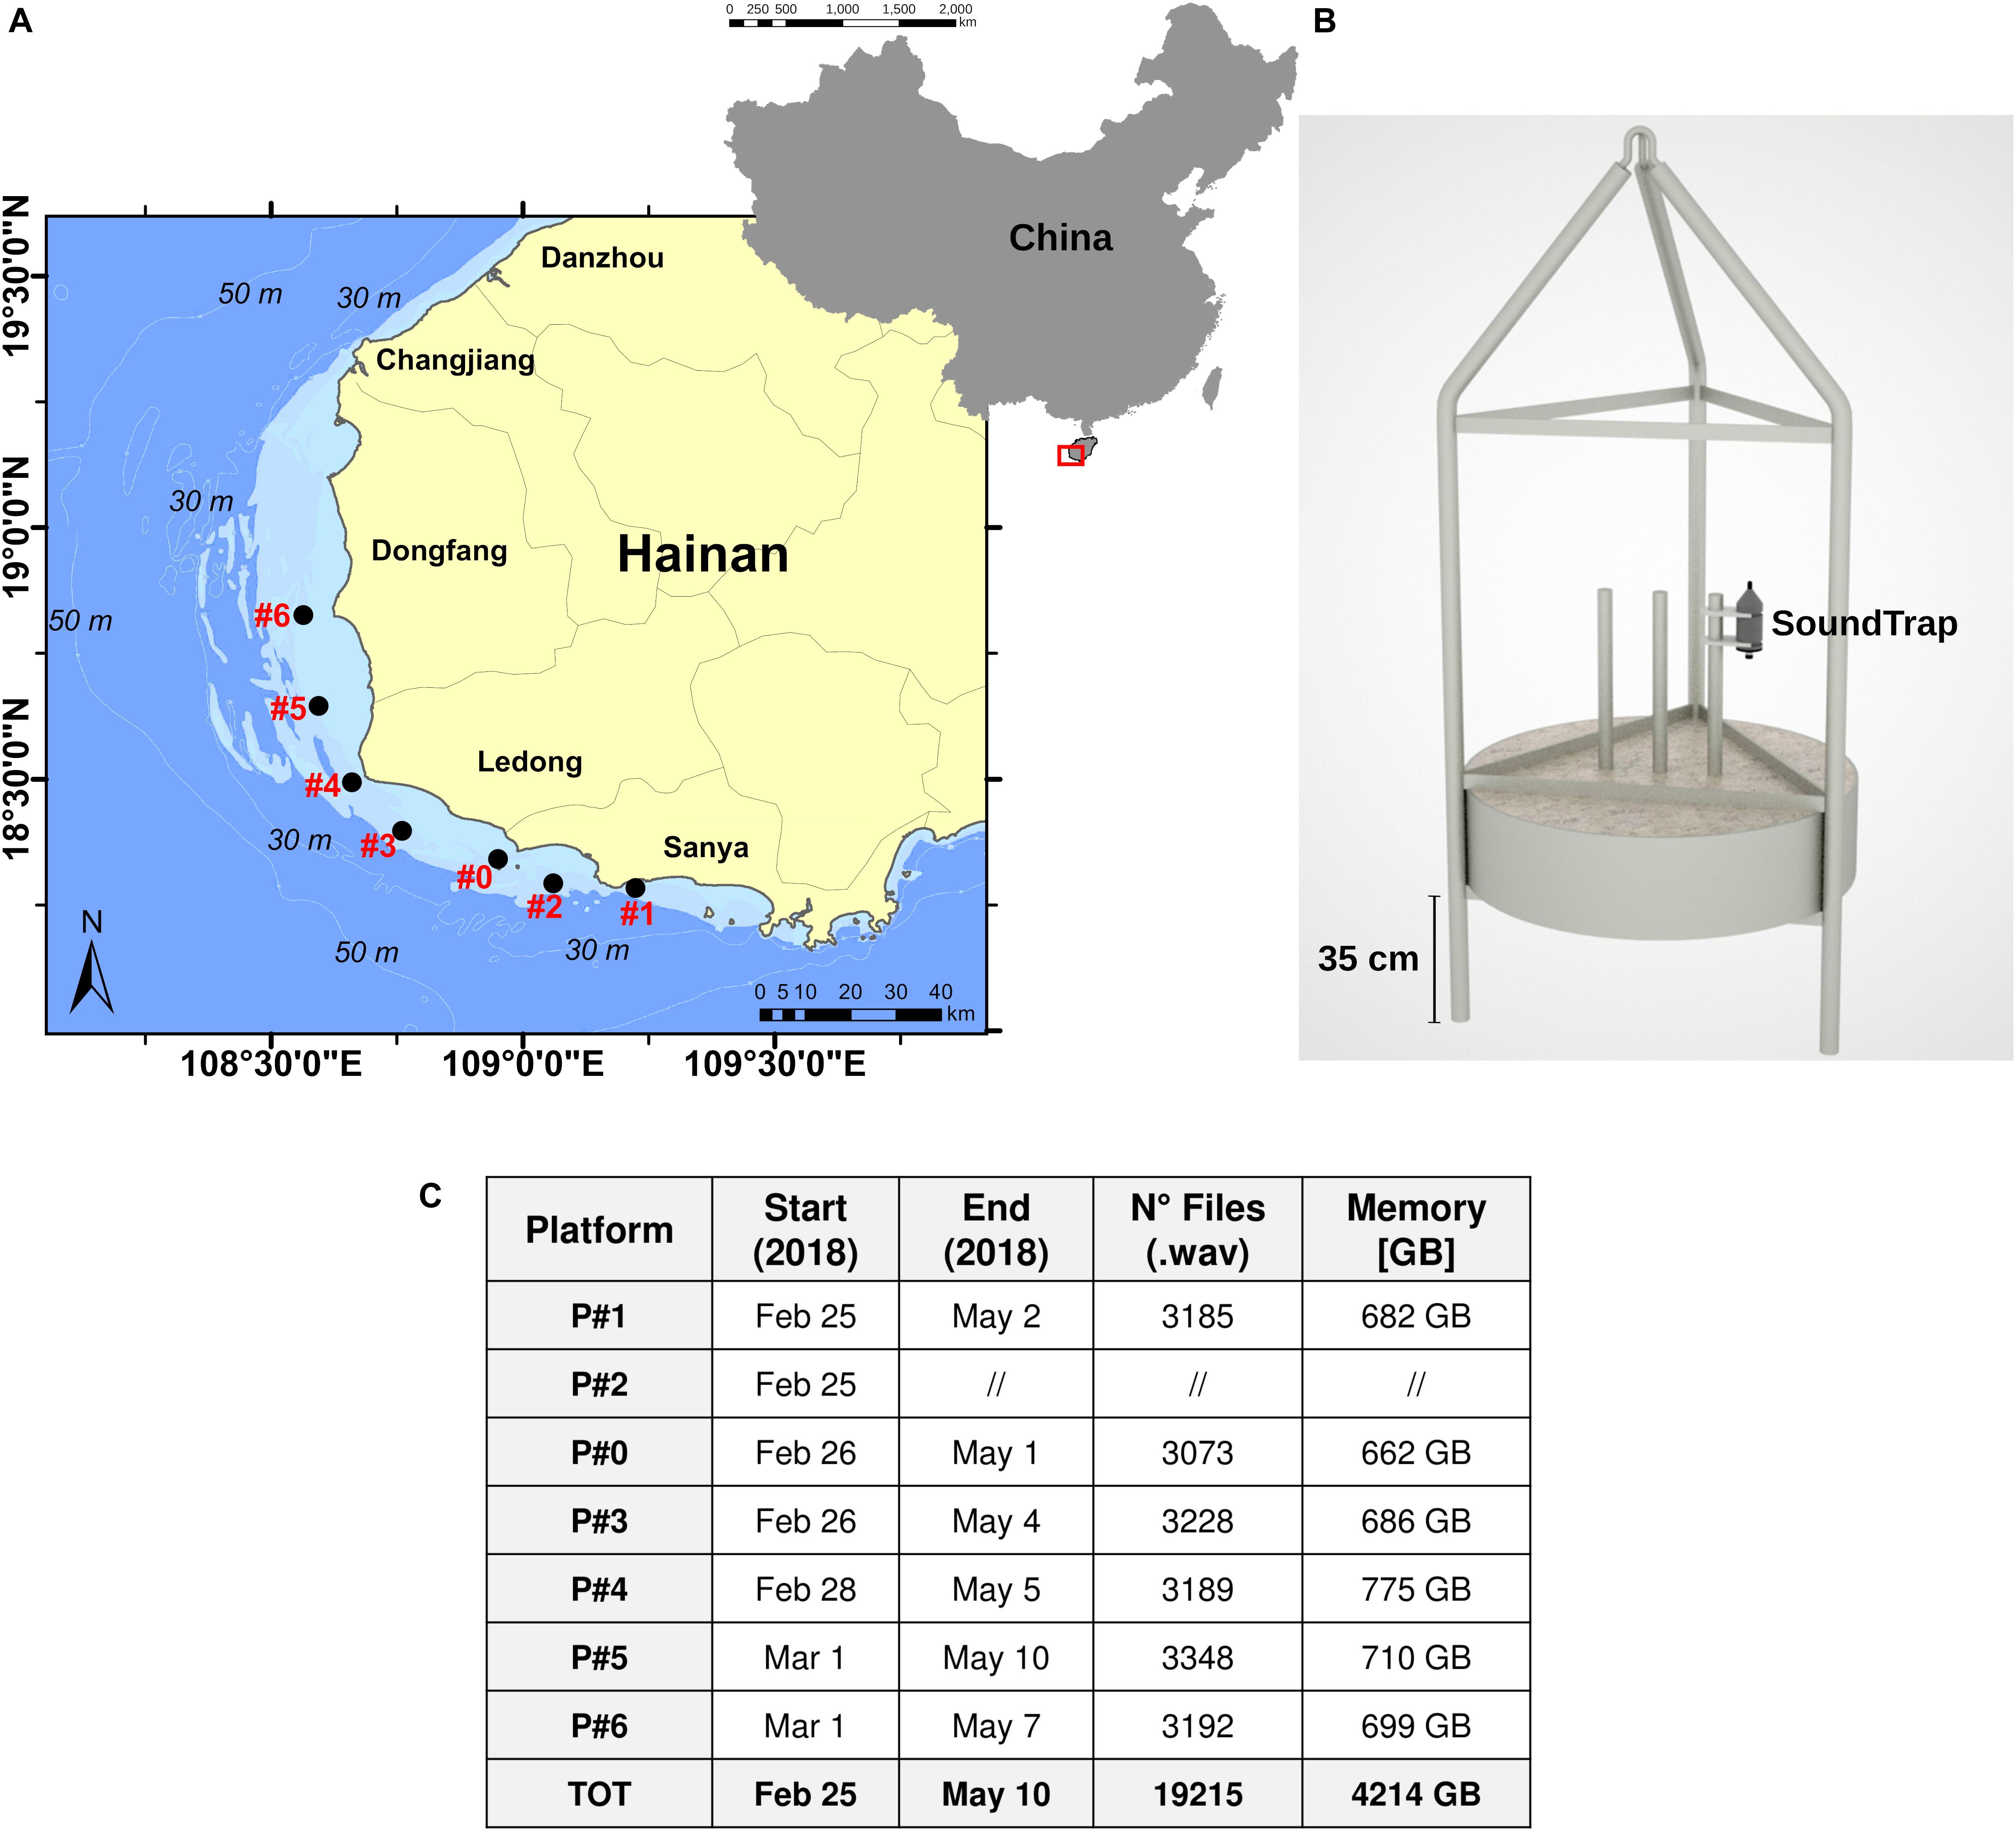
Figure 1. PAM sites and platforms. (A) Map of the locations of the PAM sites. (B) Image of a PAM platform. The acoustic recorder (SoundTrap) was deployed at the center of the frame with a latch system. (C) Table reporting data acquisition information (monitoring period, number of files, storage). The frame P#2 was lost during the study.
An acoustic stationary digital recorder (SoundTrap HF, Ocean Instruments Ltd., New Zealand) was mounted on a stainless-steel bar at the center of the PAM frame, at approximately 1.5 m above the seafloor (Figure 1B). The SoundTrap recorder had a linear frequency range of 20 Hz–150 kHz ± 3 dB, a self-noise of less than sea-state 0 in the bandwidth 100 Hz–2 kHz and a sensitivity of -203 dB re V/μPa (high gain setting with a maximum sound pressure level of 172 dB re 1 μPa peak to peak before clipping). A recording duty cycle of 5 min every 30 min (16.6%) was established, with a sampling frequency of 288 kHz with 16-bit quantization. The acoustic recording spanned over 75 days, between 25 February and 10 May 2018, and consisted of 19,215 5-min recordings (∼4.2 TB, Figure 1C). Platform #0 was also equipped with an A-tag acoustic data logger (Marine Micro Technology, Japan) for the first 31 days of the study, between 26 February and 29 March 2018. One platform (P#2) was lost, most likely as a result of being removed or displaced by fishing trawling activities, and could not be recovered.
Data Analysis Protocol
Data analysis was based on the complementary use of machine learning techniques, in the form of signal processing and classification algorithms, and the manual analysis method based on spectrogram inspection.
Humpback dolphins are known to produce three main types of vocalization (Sims et al., 2012): short-broadband ultrasonic (echolocation) clicks, tonal frequency-modulated whistles, and rapid click-series of pulsed sounds (buzzes and burst pulses). Echolocation clicks are believed to be used primarily to acquire sensory information on the surrounding environment (i.e., to navigate and locate prey or other objects like reefs) (Au, 1993). While, whistles may be commonly used for intra-species social communication and individual recognition (Sayigh et al., 1999; Wang et al., 2013). The functional significance of pulsed sounds (buzzes and burst pulses) is poorly understood in most dolphin species (Lammers et al., 2003), including the IPHD. However, buzzes are generally produced in the terminal phase of the biosonar-based foraging process, while burst pulses are typically isolated from echolocation clicks and are often produced during social interactions and long-range detection (Blomqvist and Amundin, 2004; Lammers et al., 2006; Finneran, 2013; Arranz et al., 2016).
Indo-Pacific humpback dolphin seem to emit echolocation clicks more frequently than other types of vocalizations, and when other vocalizations are produced, clicks are usually recorded alongside them (Munger et al., 2016). Echolocation clicks were previously considered as the most reliable sound with which to detect the presence of IPHD using PAM (Munger et al., 2016). In general, the automatic detection of tonal signals from dolphins is more complex (Zimmer, 2011). Therefore, the presence of IPHD in our data was assessed by detecting and classifying echolocation clicks using custom algorithms, and subsequently, using manual analysis carried out by human operators (spectrogram analysis and audio listening).
Supervised Machine Learning Algorithm
Within machine learning, supervised learning is based on the process of learning patterns in the data, based on information previously labeled by human (Bianco et al., 2019). Labeled data constitute training data that are used to create a predictive classification tool. Thus, the users provide a known set of input data (observations) and a known response to the data (classes), and the algorithm iteratively makes predictions from the input to the desired output (Bianco et al., 2019). Machine learning models were trained to classify echolocation clicks recorded by the passive acoustic platforms to study the acoustic presence of IPHD.
Data-labeling
Acoustic recordings were collected using a SoundTrap during boat-based surveys. In the event of an IPHD or IPFP sighting, the SoundTrap was lowered into the water to record echolocation clicks. The same procedure was applied during different recording sessions of known conditions such as passing vessels or adverse weather conditions (e.g., heavy rain, high sea state). The SoundTrap used the same recording specifications as described in Section “Study Area and Passive Acoustic Platforms.” An experienced researcher analyzed the waveform and spectrogram of the acquired signals using the software Raven Lite (Bioacoustics Research Program, Cornell Lab of Ornithology) and MATLAB (MathWorks, Natick, MA, United States). Short-broadband pulses were identified from acoustic sources of different nature (geophony, biophony, and antropophony). The pulses (observations) were labeled and five classes of short-broadband pulses were defined considering previous knowledge as follows:
• IPFP: Clicks from Indo-Pacific finless porpoise.
• IPHD: Clicks from Indo-Pacific humpback dolphin.
• SNAP: Pulses from snapping shrimps.
• RAIN: Pulses produced by rain.
• SHIP: Ship pulses.
Measuring signal features
Once the data had been labeled, a custom routine (Caruso et al., 2017), developed in MATLAB, was used to extract each pulse recorded during the boat-based surveys and to measure its time-frequency characteristics. The routine first applied a 3 kHz high-pass filter (Butterworth, fourth-order, zero-phase digital filtering). An energy detector based on the Teager-Kaiser Operator was then used to detect the short-broadband pulses (Kaiser, 1990; Klinck and Mellinger, 2011) that exceeded an “adaptive” threshold (Caruso et al., 2017). Each detected pulse was then extracted using a time window of 512 samples (1.8 ms) centered at the peak of the signal. Subsequently, the extracted pulses were oversampled (by a factor of two) and their acoustic features were measured. All parameters related to sound intensity were not considered because they were mainly influenced by an acoustic source of unknown position. The following acoustic features were measured:
• Pulse Duration (d) [μs]: the duration of each pulse was determined from the peak value of the envelope of the Teager-Kaiser Operator. The onset and termination of the click signal were defined as the points at which 10% of the peak value was reached.
• Peak Frequency (fp) [kHz]: the first peak frequency corresponds to the highest amplitude of the power spectral density (PSD) of the pulse.
• Centroid frequency (fc) [kHz]: the frequency value that divides the pulse spectrum in halves of equal energy.
• Bandwidth [kHz]: the bandwidth of the pulse was parameterized by the -3 dB bandwidth (BW–3dB) and the bandwidth root-mean square (RMS, BWRMS). The BW–3dB is the frequency range in which the PSD is above half of its maximum. The BWRMS is a measure of the spectral standard deviation around the centroid frequency of the spectrum (Madsen and Wahlberg, 2007). It can be used as a proxy for the frequency window over which the animal integrates both signal energy and noise (Moehl et al., 2003; Madsen and Wahlberg, 2007).
• QRMS [kHz]: ratio of fc to BWRMS.
• Number of zero crossing (Zc) [#]: the number of times the pulse crosses zero.
• Inter pulse interval (IPI) [ms]: the time interval between consecutive pulses detected.
Figure 2 shows the distribution of values of signal features for the five identified classes.
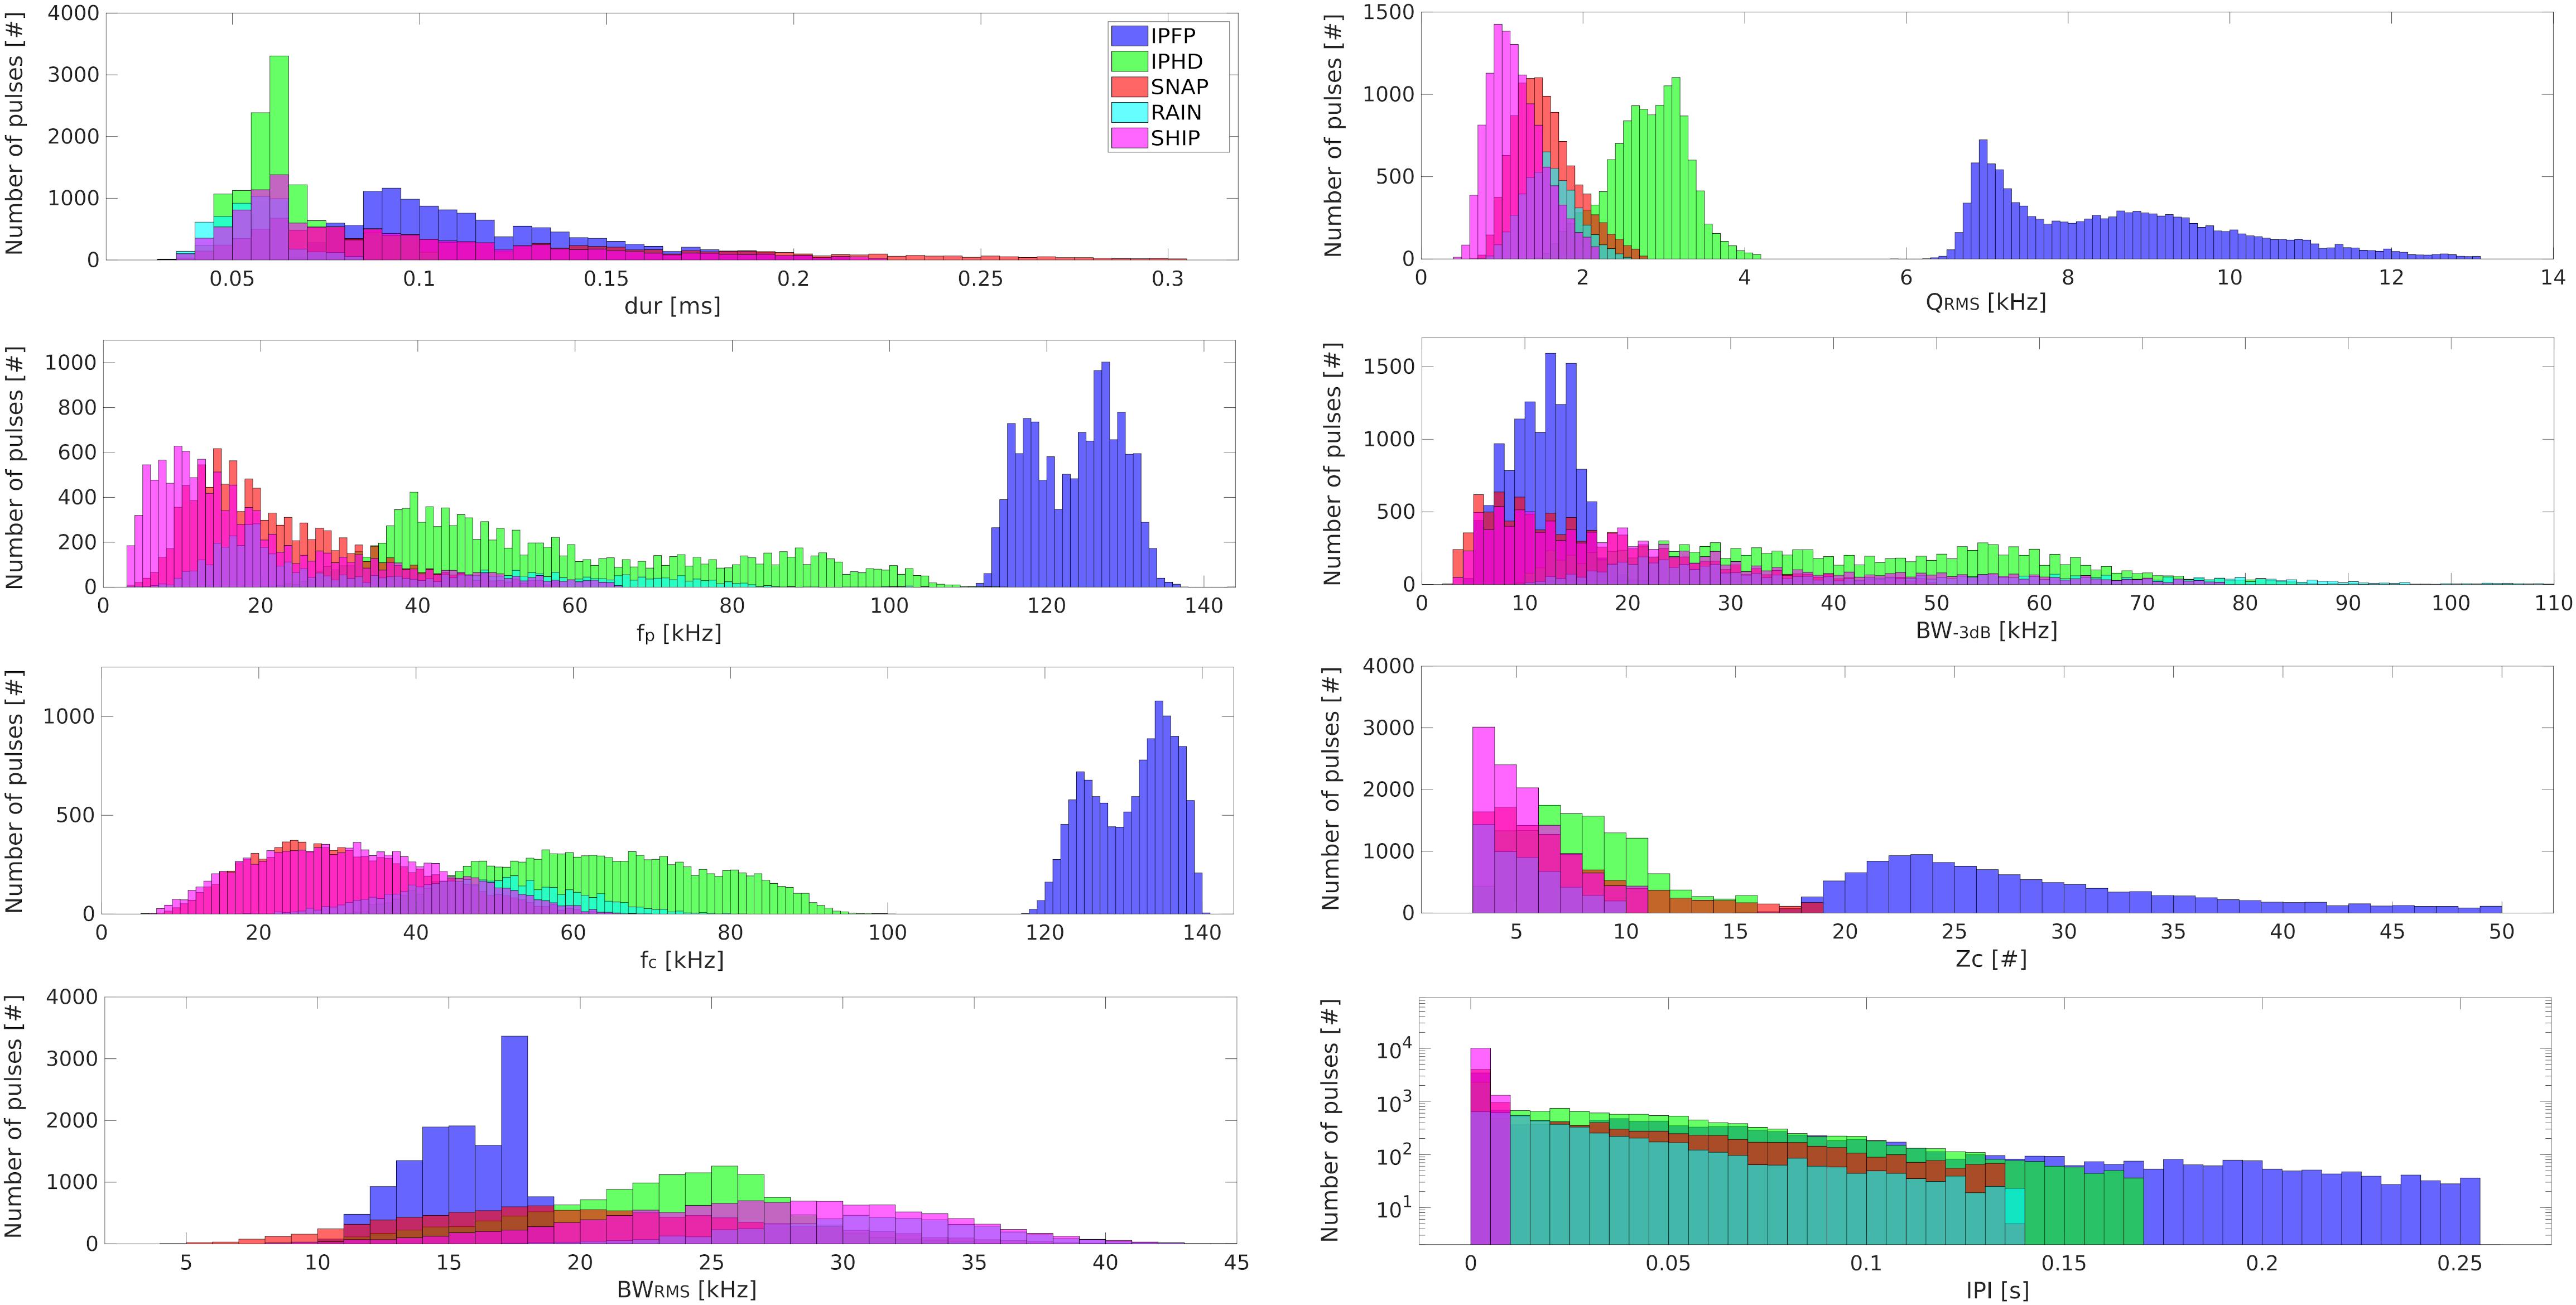
Figure 2. Signal features. Histograms showing the acoustic features measured for the five classes of short-broadband pulses. In blue, echolocation clicks emitted by Indo-Pacific finless porpoise (IPFP). In green, echolocation clicks emitted by Indo-Pacific humpback dolphin (IPHD). In red, pulses emitted by snapping shrimps (SNAP). In cyan, pulses generated by rain (RAIN). In magenta, pulses produced by ship (SHIP).
Creating training data
The input for the machine learning model was composed of the known set of input data (signal features) and the known responses to the data (labels of the five classes identified, Figure 2). Before the training phase, the values of each parameter within a single class were tested for a standard normal distribution using a one-sample Kolmogorov–Smirnov test. The test rejected the null hypothesis at the 5% significance level, so outliers were removed if the data were not normally distributed. Consequently, elements of more than 1.5 interquartile ranges above the upper quartile or below the lower quartile were deleted from the training data.
In total, 51,238 short-broadband pulses were identified as training data. As far as possible, a similar number of pulses for each class was included to balance the input of the machine learning model. The number of pulses for each class was distributed as follows:
• IPFP: 24% of the total.
• IPHD: 24% of the total.
• SNAP: 20% of the total.
• RAIN: 10% of the total.
• SHIP: 22% of the total.
Training data exploration
Data were standardized in order to facilitate the comparison of parameters with different units. The distance of each data point from the mean in terms of the standard deviation was measured. Therefore, the standardized data set had a mean of 0 and a standard deviation of 1, and retained the shape properties of the original dataset (same skewness and kurtosis).
Figure 3 shows a series of scatter plots for the parameters measured with the training data, grouped by the defined classes. These formed the training data necessary for the development of the supervised learning algorithm.
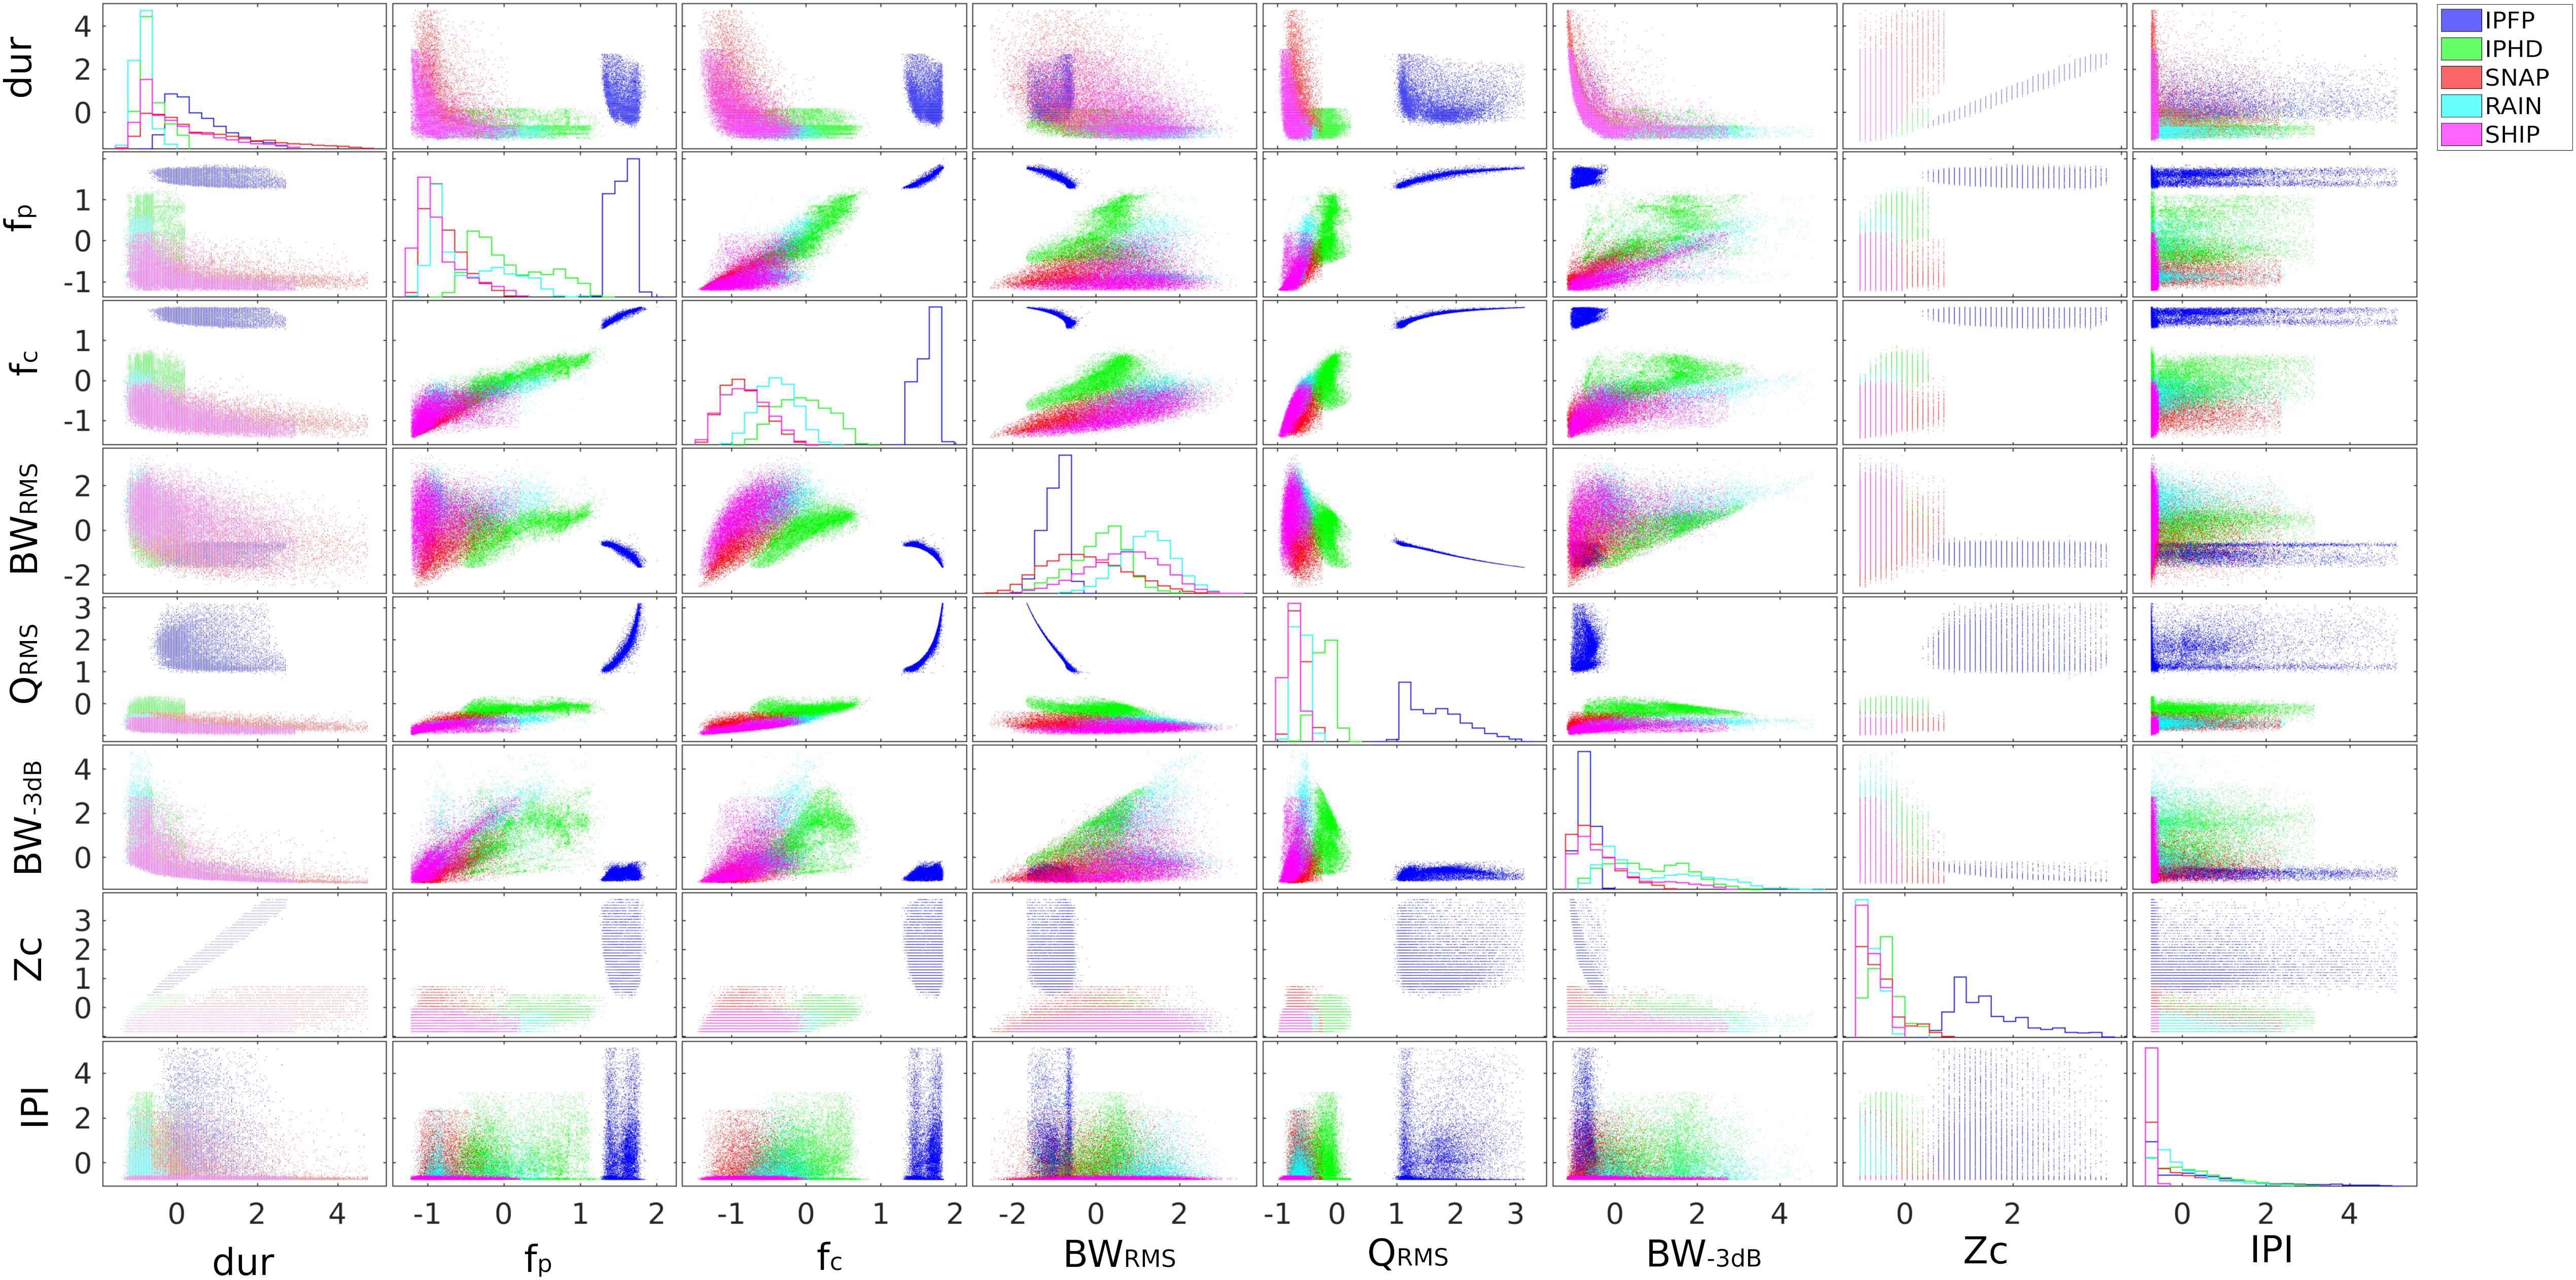
Figure 3. Training data exploration. Series of scatter plots of the training dataset after standardization. The data have been grouped according to the five classes selected (IPFP, IPHD, SNAP, RAIN, SHIP). Each individual set of axes contains a scatter plot of a column of x against another column of x. In the diagonal, graphs of the contours of the grouped histograms (similar to Figure 2 but with standardized data).
Trained classifiers
Different types of classifiers (decision trees, discriminant analysis, support vector machines, and nearest neighbor classifiers) were trained in MATLAB considering the following criteria:
• Observations: 51,238.
• Predictors (signal features): 8.
• Response classes: 5.
• Validation: fivefold cross-validation.
The validation process assessed the performance of each model using new data, compared to the training data. In this study, the k-fold cross-validation method was used to examine the predictive accuracy of the fitted models. This process evaluates the data across the entire training set, dividing it randomly into k groups and then training the model k times, each time leaving a different group out and using it instead as a validation set. Therefore, the cross-validation is repeated until each group has been used as the test set and the average test error is calculated over all groups. The k-fold strategy was used to prevent overfitting and for the selection of the best model.
A classification confusion matrix can be used to visualize the performance of each classifier (Fawcett, 2006). Given a classifier (columns, predicted class) and a set of instances (rows, true class), a two-by-two confusion matrix can be constructed to represent the dispositions of a set of instances (Fawcett, 2006). Therefore, there are four possible outcomes:
• True positive (TP): if the instance is positive and is classified as positive.
• False negative (FN): if the instance is positive and is classified as negative.
• True negative (TN): if the instance is negative and is classified as negative.
• False positive (FP): if the instance is negative and is classified as positive.
The confusion matrix forms the basis for many common performance metrics [TP rate = TP/P; FP rate = FP/N; Precision = TP/(TP+FP); Accuracy = (TP + TN)/TOT], where P represents the number of real positive cases in the data (all output positives), N is the number of real negative cases in the data (all output negatives), and TOT is the total number of instances.
The performance of each trained model (supervised machine learning algorithm) was checked considering the overall accuracy of the validation process (the score represented the accuracy of all observations). The classifier with the best performance was used to predict the new data acquired by the array of passive acoustic platforms.
Spectrogram Visualization and Listening
In the first stages of the development of automatic detection or classification algorithms for a specific and complex underwater habitat, it is imperative to test and confirm their reliability using manual spectrogram analysis (Caruso et al., 2017; Hildebrand et al., 2019). After applying the trained classifier to the data from the six PAM platforms, each file with pulses classified as “IPHD” was manually checked using the program Raven Lite. PAM expert operators analyzed the selected files, and also reported the presence of other signals of interest which were recorded concurrently with the IPHD vocalizations. Information was logged regarding:
• IPHD vocalizations (whistles and click-series of pulsed sounds).
• Phonating animals (snapping shrimps and soniferous fishes).
• Human-related activities (ship noise, explosions, others; the category others included sonar, low frequency pulses, and all acoustic signals considered as man-made).
All these sounds have stereotypical and identifiable spectral components.
Detection Range
The classification process provided information on the time and signal features of the identified IPHD clicks. However, it was not possible to acquire information regarding the distance of detections or the correlated spatial abundance of the animals recorded (DeRuiter et al., 2010). To estimate the probability of click detection as a function of range in the study area, we estimated a transmission loss (TL) model for clicks emitted by IPHDs (Figure 4). Acoustics recordings were collected during IPHD sightings using a six-arm star type hydrophone array with 13 elements, and specific criteria were applied to identify on-axis clicks recorded close to the central hydrophone of the array (Jensen et al., 2009; Gong et al., 2019). The source spectral density level (SSD or SL, dB re 1 μPa/√Hz @ 1 m) of the most intensive on-axis click was estimated and a TL model was applied for all frequency components to study the variation of PSD (dB re 1 μPa/√Hz) during signal propagation. We considered attenuation due to geometric spreading and absorption processes related to seawater properties (Francois and Garrison, 1982a, b). The geometric spreading model was calculated as spherical spreading in approximation for short and high-frequency echolocation clicks (Madsen and Wahlberg, 2007; Villadsgaard et al., 2007; DeRuiter et al., 2010). Propagation loss was simulated assuming the source (dolphin) at different ranges from the platforms (R = 100 m; R = 200 m; R = 500 m; R = 1000 m). The TL model applied the following formulas:
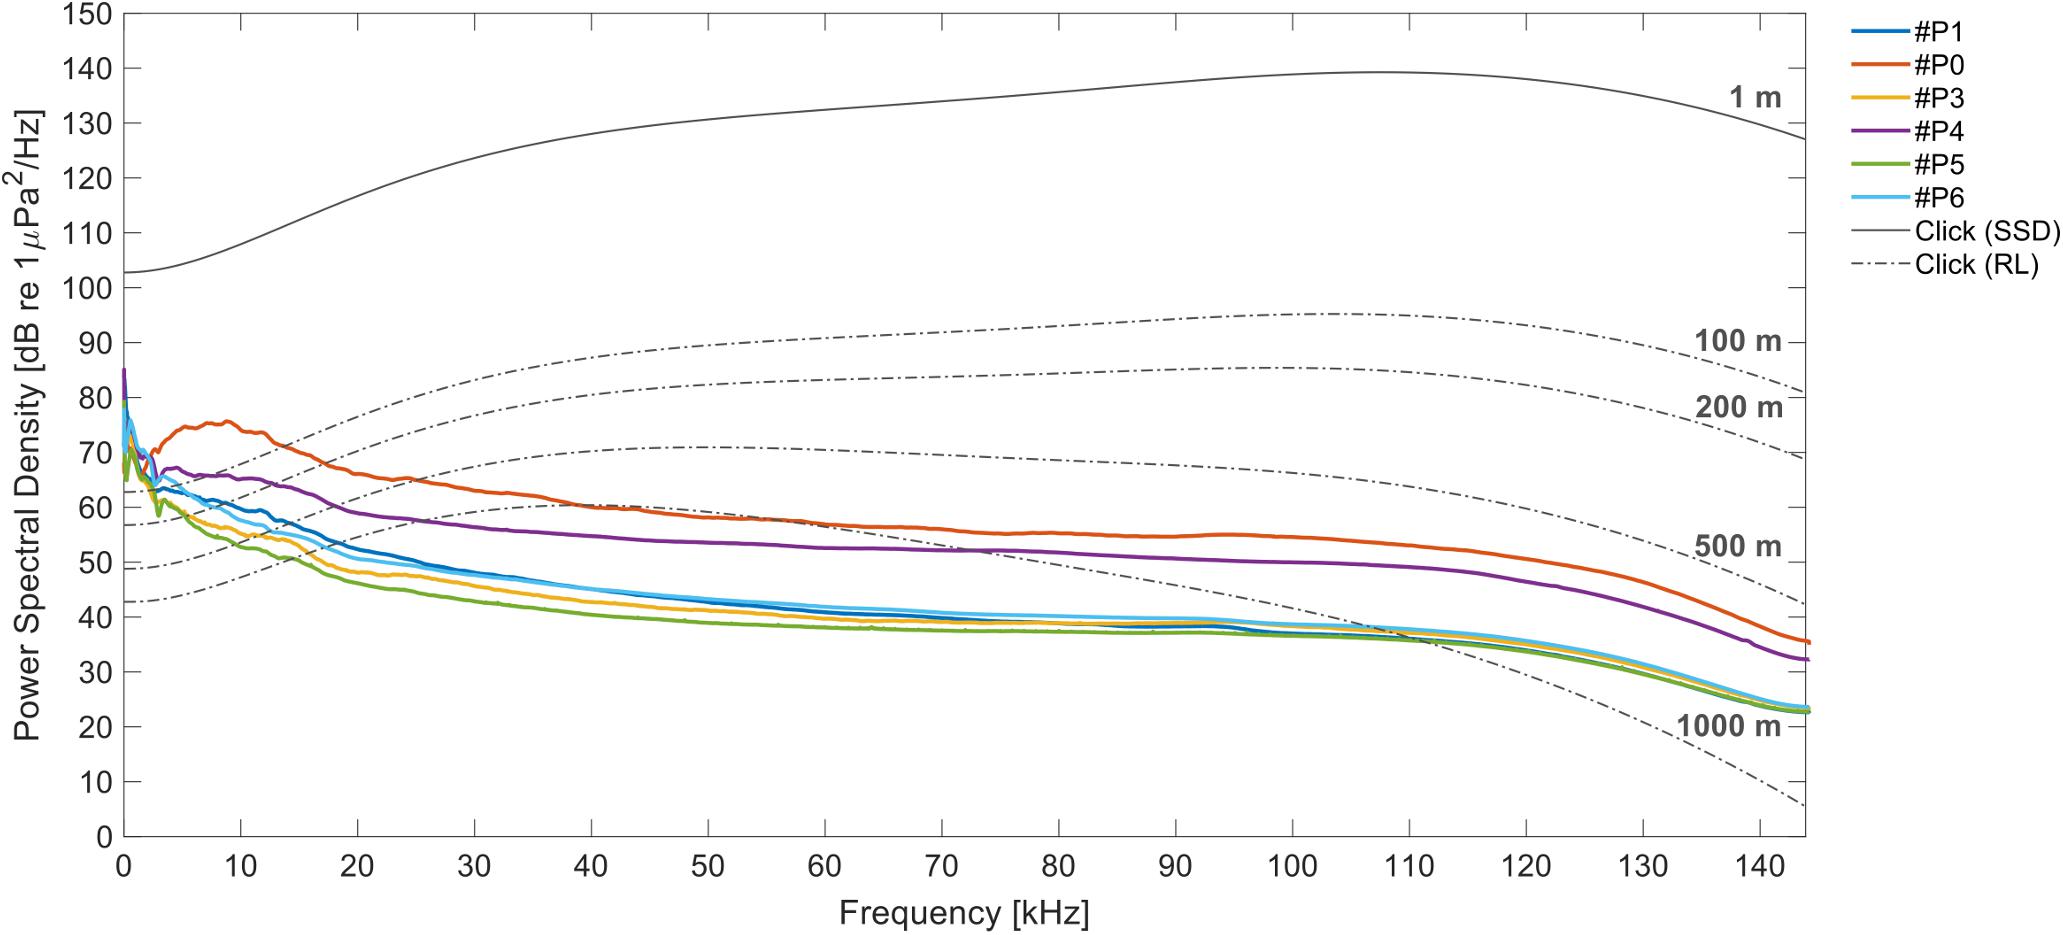
Figure 4. Detection range. The average calculated over all power spectral densities (PSDs, dB re 1 μPa2/Hz) measured for the files acquired by the six platforms (different colors). The gray curve represents the PSD of an IPHD click as source spectral density (SSD, dB re 1 μPa/√Hz @ 1 m). The dotted lines show the received levels (RL) model of the click, respectively, at 100, 200, 500, and 1000 m. The variation of the signal during propagation is shown in relation to the ambient noise recorded at the PAM sites.
The frequency-dependent absorption α coefficient was associated with temperature, hydrostatic pressure, pH, and salinity (Ainslie and McColm, 1998). These measurements were collected using a portable YSI Professional Plus device (Ohio, United States) and a Hondex PS-7 portable Depth Sounder (Honda Electronics, Japan). The detection range of the platforms for IPHD echolocation clicks was estimated in relation to the average PSDs calculated at each PAM location (from the entire dataset). The received levels (RLs) considered the sound pressure received by the recording hydrophone with source at different distances (Figure 4).
Spatiotemporal Distribution and Acoustic Behavior
The IPHD spatial distribution was evaluated across the PAM platforms, based on the number of files with click detections (confirmed by manual analysis). The number of clicks logged per file was also considered as an index of dolphin acoustic activity within the detection range of each platform.
The biosonar activity of the species was also analyzed in relation to the presence of possible temporal patterns. In particular, the diel cycle was explored in relation to the acoustic presence and echolocation activity of IPHDs in the study area and among each deployment location. The probability of detection was investigated based on the time of the day, which was divided into clusters of 4 h (00:00–04:00; 04:00–08:00; 08:00–12:00; 12:00–16:00; 16:00–20:00; 20:00–24:00). Generalized additive mixed models (GAMMs; Wood, 2017) were also used to evaluate the variation of dolphin click occurrence (presence/absence) and number of clicks detected at the daily scale. Binomial-based GAMMs with a logit link function were performed using R (RStudio Inc., Boston, MA, United States). The hour of the day was used as a fixed effect and dolphin occurrence was transformed to a binary scale (1 = present and 0 = absent). The models were fitted using the R package “mgcv” (R Core Team, 2019; Wood, 2019), and the splines library was used to build cyclic cubic regression splines (Wood, 2017). Knots were capped at four smooths following the method described by Dinh et al. (2018). The number of clicks recorded during the entire day and night phase was also inspected, based on the mean time of sunrise and sunset in the study area (25 February–10 May; sunrise: 07:02, sunset: 18:26; acquired from the Time and Date AS website1).
Spatial occurrence of the other sounds identified during the manual analysis (IPHD vocalizations, other phonating animals and anthropogenic sources) were also analyzed to provide insights regarding habitat use and ambient noise characteristics across the study area.
A-tag Acoustic Data Logger
The A-tag acoustic data logger is a submersible acoustic data logger (Marine Micro Technology, Saitama, Japan) which logs the occurrence of possible click events but does not record an audio file (Akamatsu et al., 2005; Li et al., 2010). The A-tag data logger consisted of a waterproof cylindrical aluminum case, two hydrophones (sensitivity of –201 dB re 1 V/μPa, frequency response ± 5 dB in the range of 100–160 kHz), a band-pass filter (-3 dB with a range of 55–235 kHz), an analog-to-digital converter, a CPU (PIC18F6620; Microchip Technology Inc., Chandler, AZ, United States) for system control and data processing, a 128 MB flash memory module for data storage, and two UM-1 batteries (Akamatsu et al., 2005).
Dolphin sonar pulse events were extracted from the A-tag data logger using custom software written in Igor Pro 5.01 (WaveMetrics Inc., Lake Oswego, OR, United States). Following previous work in the study area (Dong et al., 2017), the following discriminating parameters were used to identify dolphin sonar pulse events: the minimum number of pulses (five); the maximum duration of Inter Click Intervals in a click train (200 ms); and the changes in the patterns of the ICIs between two adjacent pulses (smoothly changing patterns, i.e., each ICI greater than half and less than twice the duration of the previous one). After the click trains were extracted, a manual examination was also performed to eliminate false detections such as ship noise and pulses made by snapping shrimps, which were characterized by randomly changing SPLs and/or ICIs (Akamatsu et al., 2011; Dong et al., 2017). A confusion matrix was constructed, based on the acoustic classification process for the True condition (column), while the A-tag was considered the Predicted class (rows).
Results
Identification of IPHD Clicks
The entire acoustic dataset (collected over 75 days, from six platforms, and totaling 19,215 files, ∼4.2 TB) was inspected to search for IPHD clicks. The number of files acquired did not differ significantly across the six PAM sites (one-sample Wilcoxon signed rank test, alpha = 0.01, p > 0.01) and the median number of recordings collected was equal to 3190.5 files.
Echolocation clicks from IPHDs (Figure 5A) were identified through the following processing stages (Figure 5B).
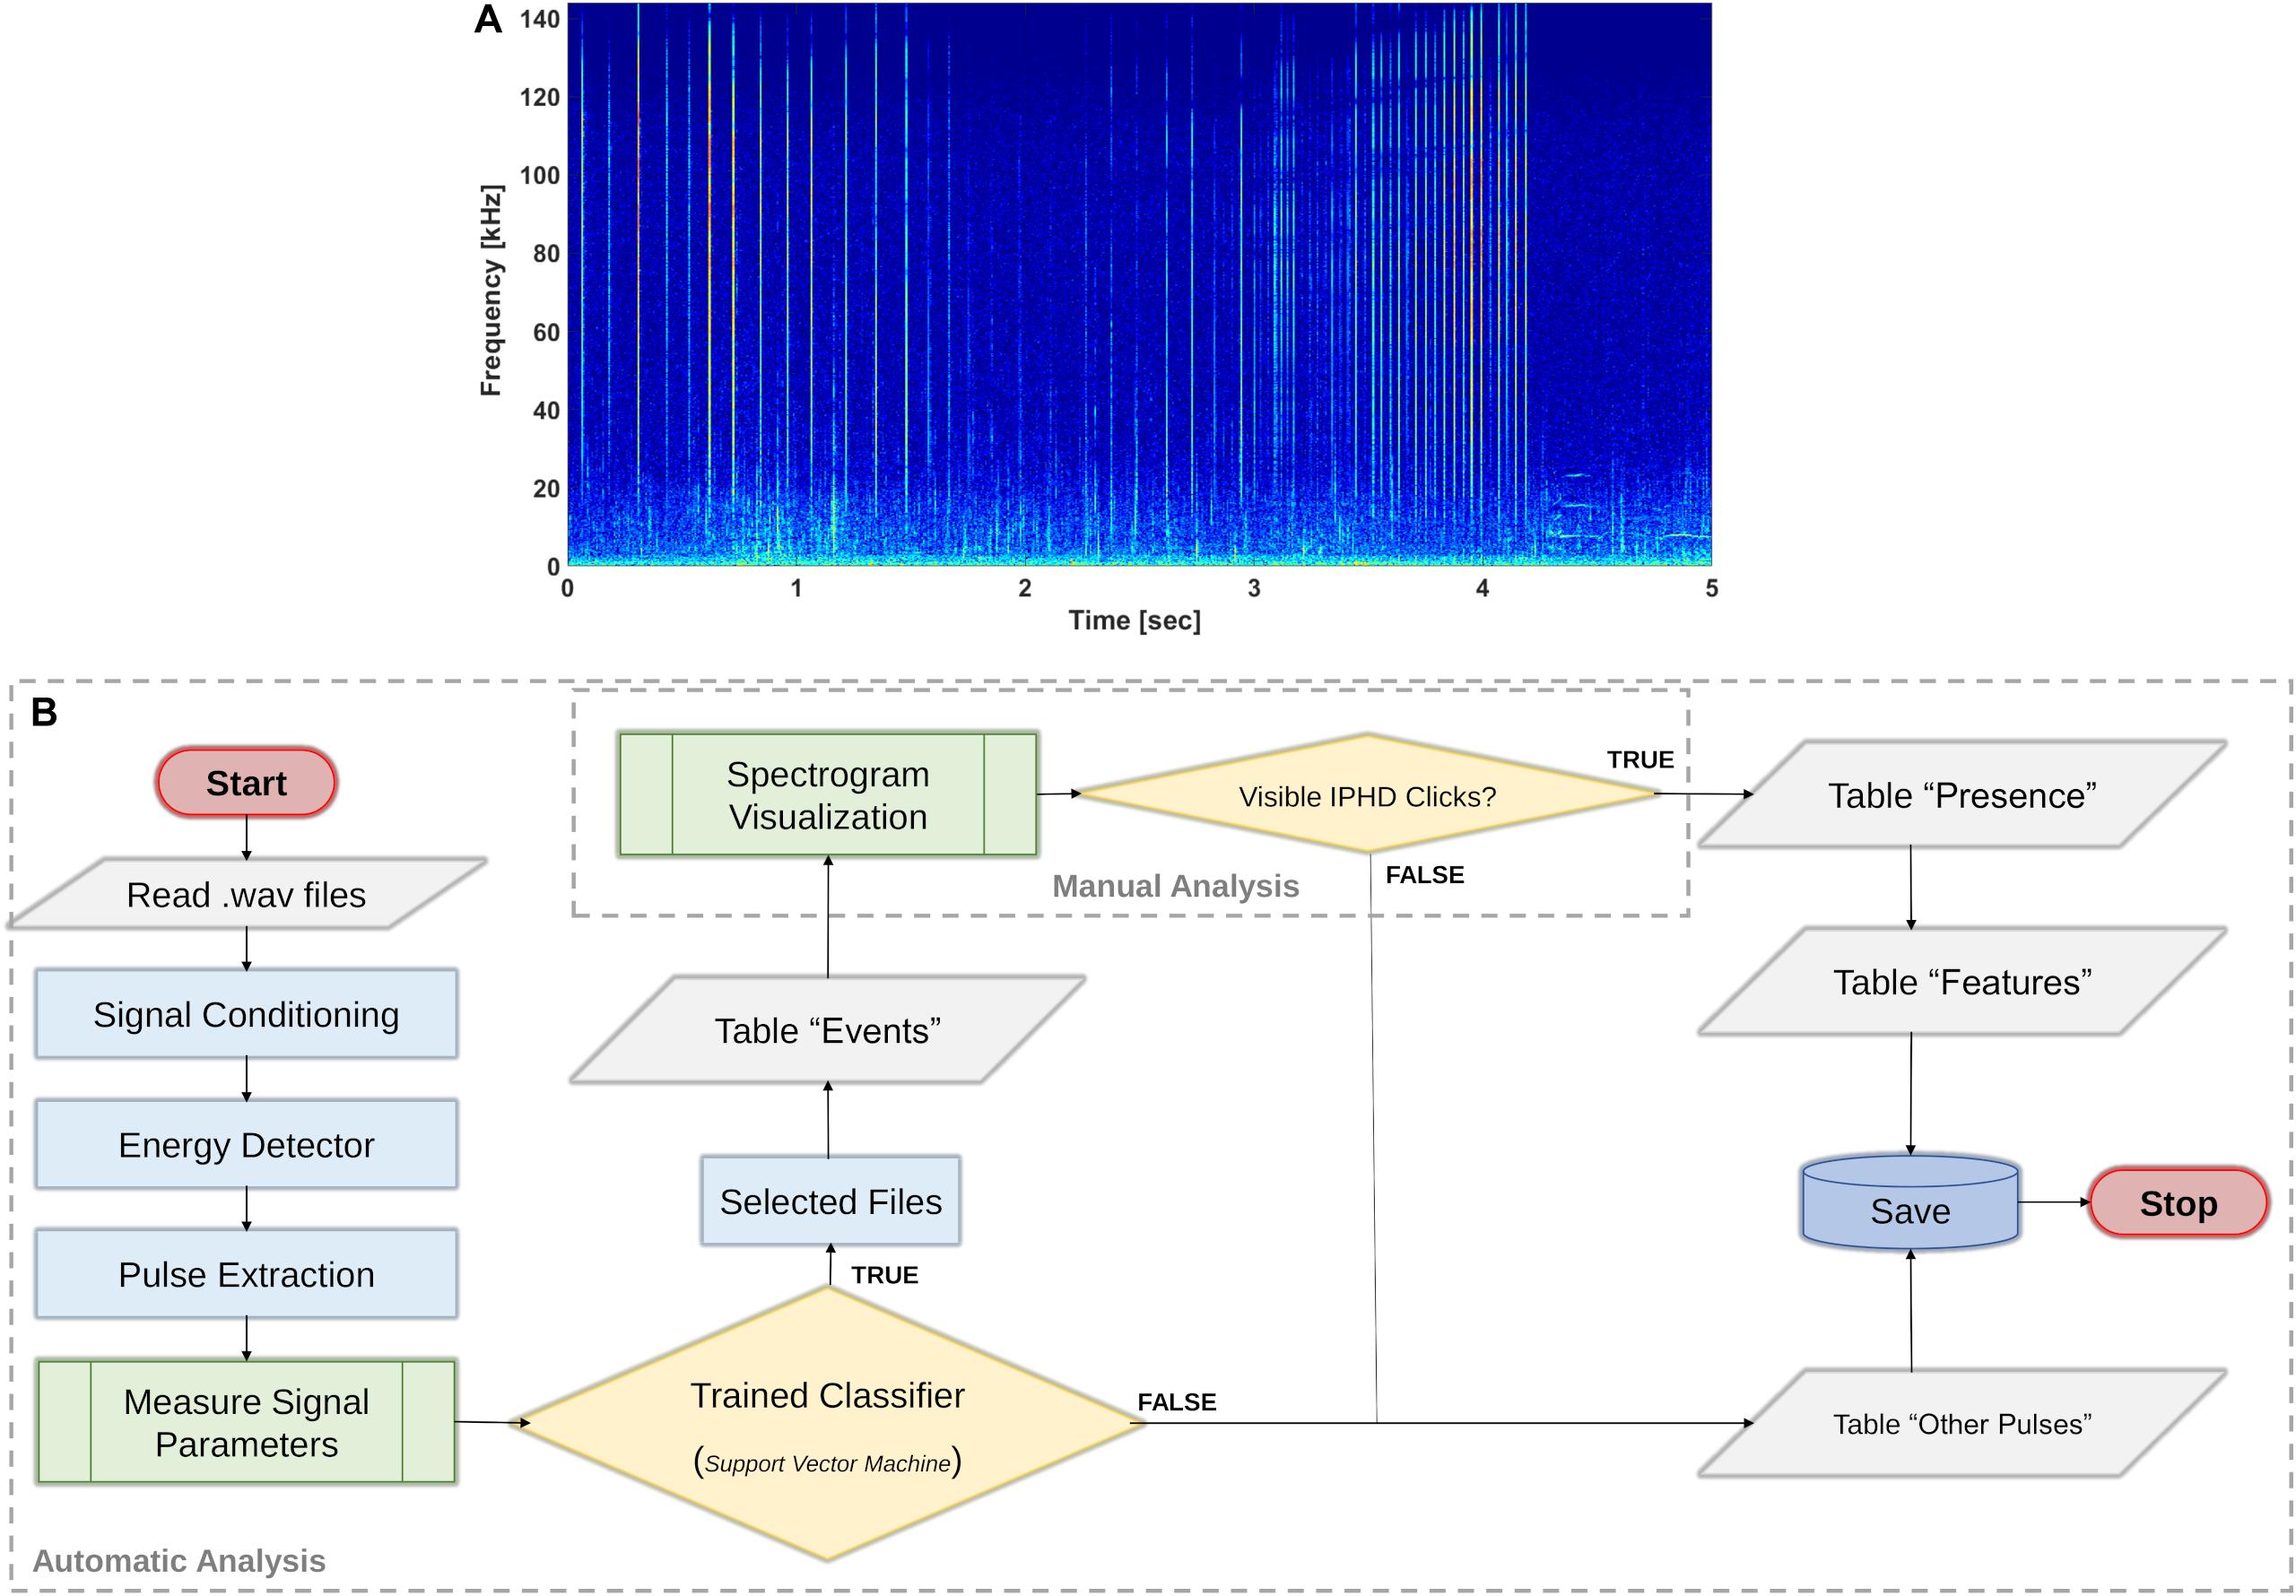
Figure 5. Identification of IPHD clicks. (A) Spectrogram (nfft = 2048; overlap = 50; Hann window) of 5-s file interval with IPHD clicks. (B) The flowchart (International standard symbols for flowchart, ISO 5807:1985) shows the procedure applied for click classification and data analysis. The method considered the application of the trained classifier (Automatic Analysis) and an intermediate step to check the results through spectrogram analysis (Manual Analysis). Additional information about IPHD acoustic behavior and other sound sources were also logged during spectrogram visualization and listening.
1. Pulse detection: short-broadband pulses were detected in the band 3–144 kHz using the methodology described to measure the signal features of the training data (section “Measuring Signal Features”).
2. Trained classifier: the cubic support vector machine (Cubic SVM) had the best performance, with an accuracy of 89.9%. The TP rate for the class “IPHD” was 96%. Figure 6 shows the confusion matrix plot for the selected trained classifier. A post-classification filter was applied to the data, and files which were classified as IPHD, with at least 30 pulses with a duration of less than 100 μs (Fang et al., 2015) were selected. The list of all the files analyzed, with information on the presence/absence of IPHDs and number of clicks per file, was reported in table “Events” (Figure 5B).
3. Manual analysis: expert PAM operators used spectrogram analysis to check the selected files to confirm the presence of dolphin clicks. All the files where click presence was manually confirmed were reported in table “Presence” (Figure 5B), alongside the number of clicks detected.
4. Signal features: the parameters measured for all short-broadband pulses were stored in table “Features” for IPHD clicks and in table “Other Pulses” for the other classes (Figure 5B).
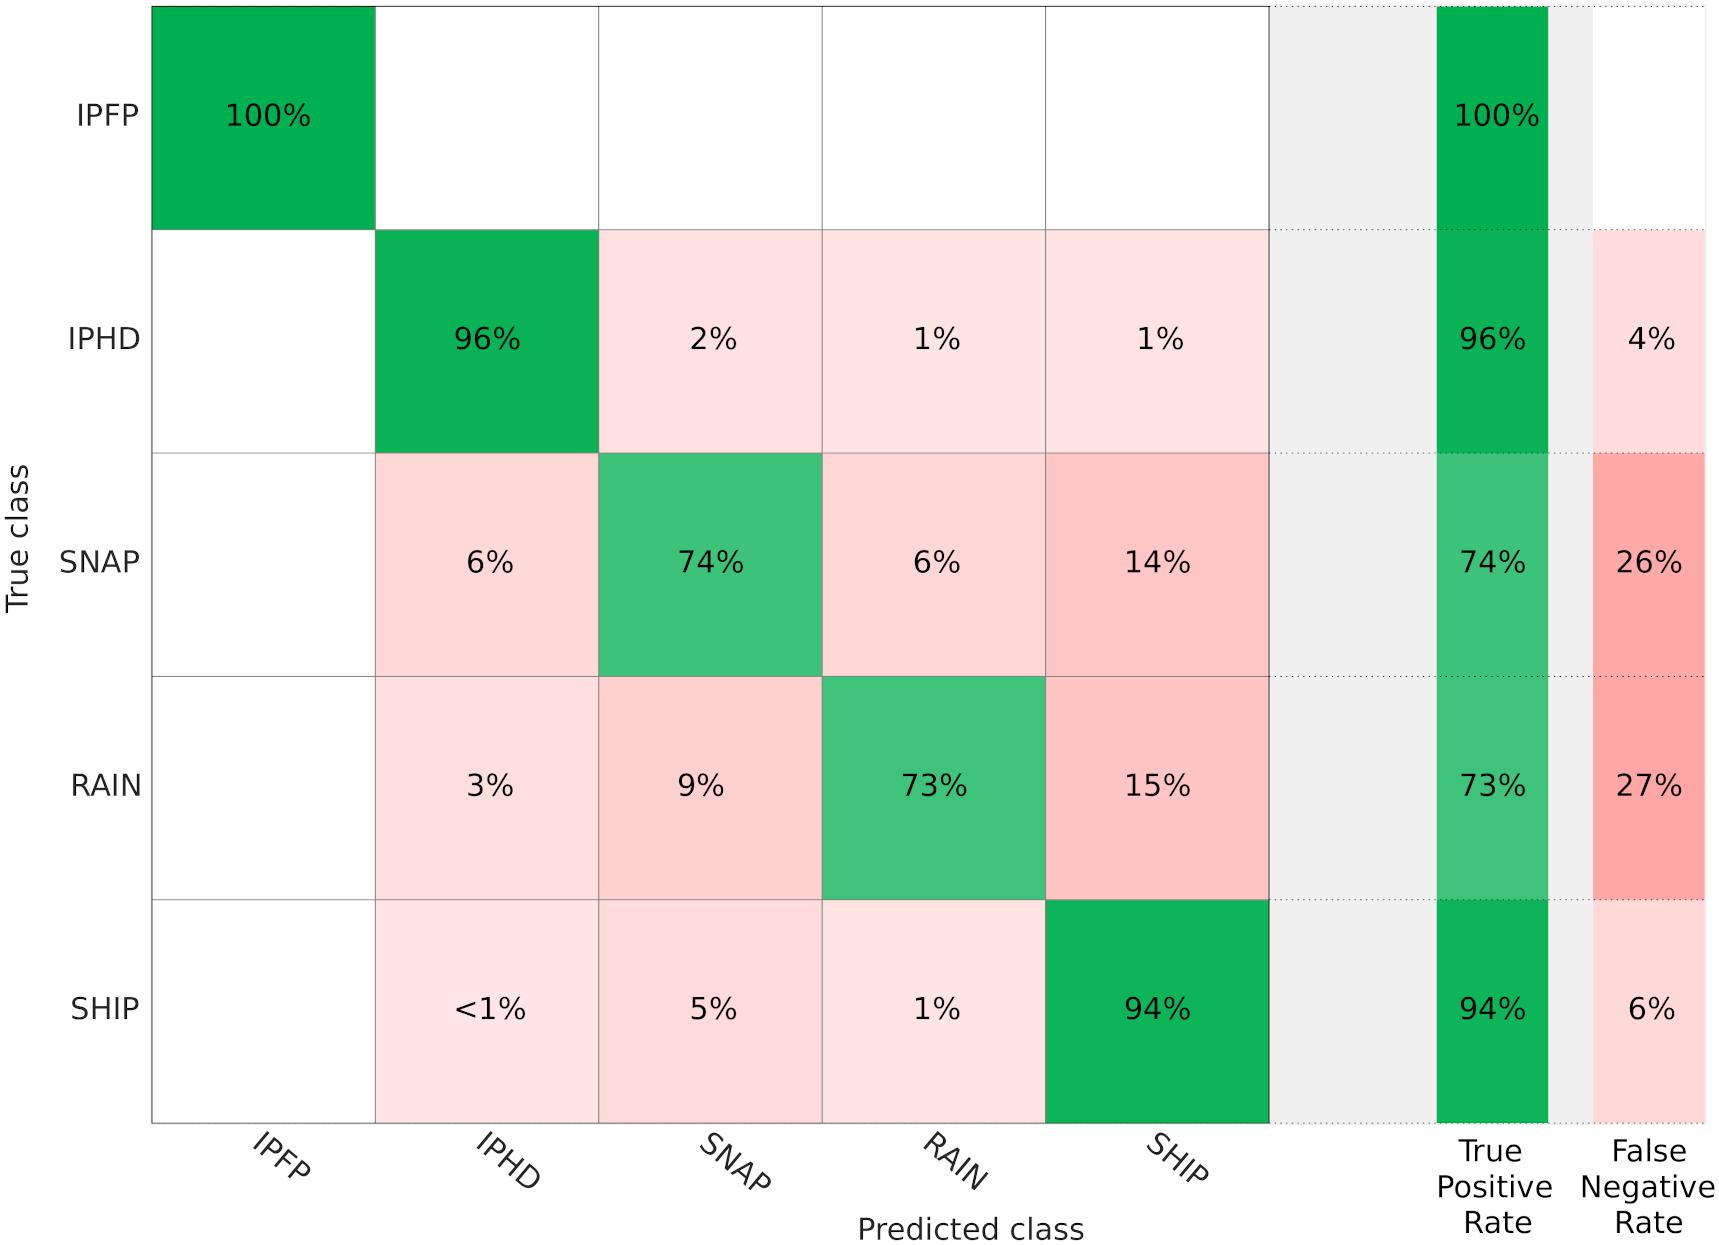
Figure 6. Confusion matrix. The confusion matrix was used to visualize the performance of the trained classifier (Cubic SVM) among the five classes (IPFP, IPHD, SNAP, RAIN, SHIP). The rows show the true class and the columns show the predicted class. Each cell shows how the classifier performed per class, and true positive (TP) rate and false negative (TP) rate are reported. Cross-validation was used, so the confusion matrix was calculated using the predictions on the held-out observations. The diagonal cells show where the true class and predicted class matched. If these cells are green, the classifier has worked well. On the right, a summary of TP rate and FN rate for each class.
Acoustic Occurrence and Spatiotemporal Patterns
According to the TL model of the IPHD clicks and the average PSDs, the acoustic recorders were capable of detecting dolphin clicks at a range of at least 500 m approximately, depending on ambient noise levels (average PSDs) at each PAM site (Figure 4).
In total, 346 recordings were selected based on the presence of pulses classified as “IPHD” (Figure 7A). Within these, the manual analysis reported visible echolocation clicks in 276 files (79.77%; 1.44% of the entire dataset) (Figure 7B). The algorithm performed differently across the six PAM locations (χ2 test, p < 0.001), relative to the spectrogram inspection. The Cubic SVM performed best in site P#6, with 87.61% confirmed presence (Figure 7A). The lowest level of confirmed detections was for site P#1, with 57.89%.
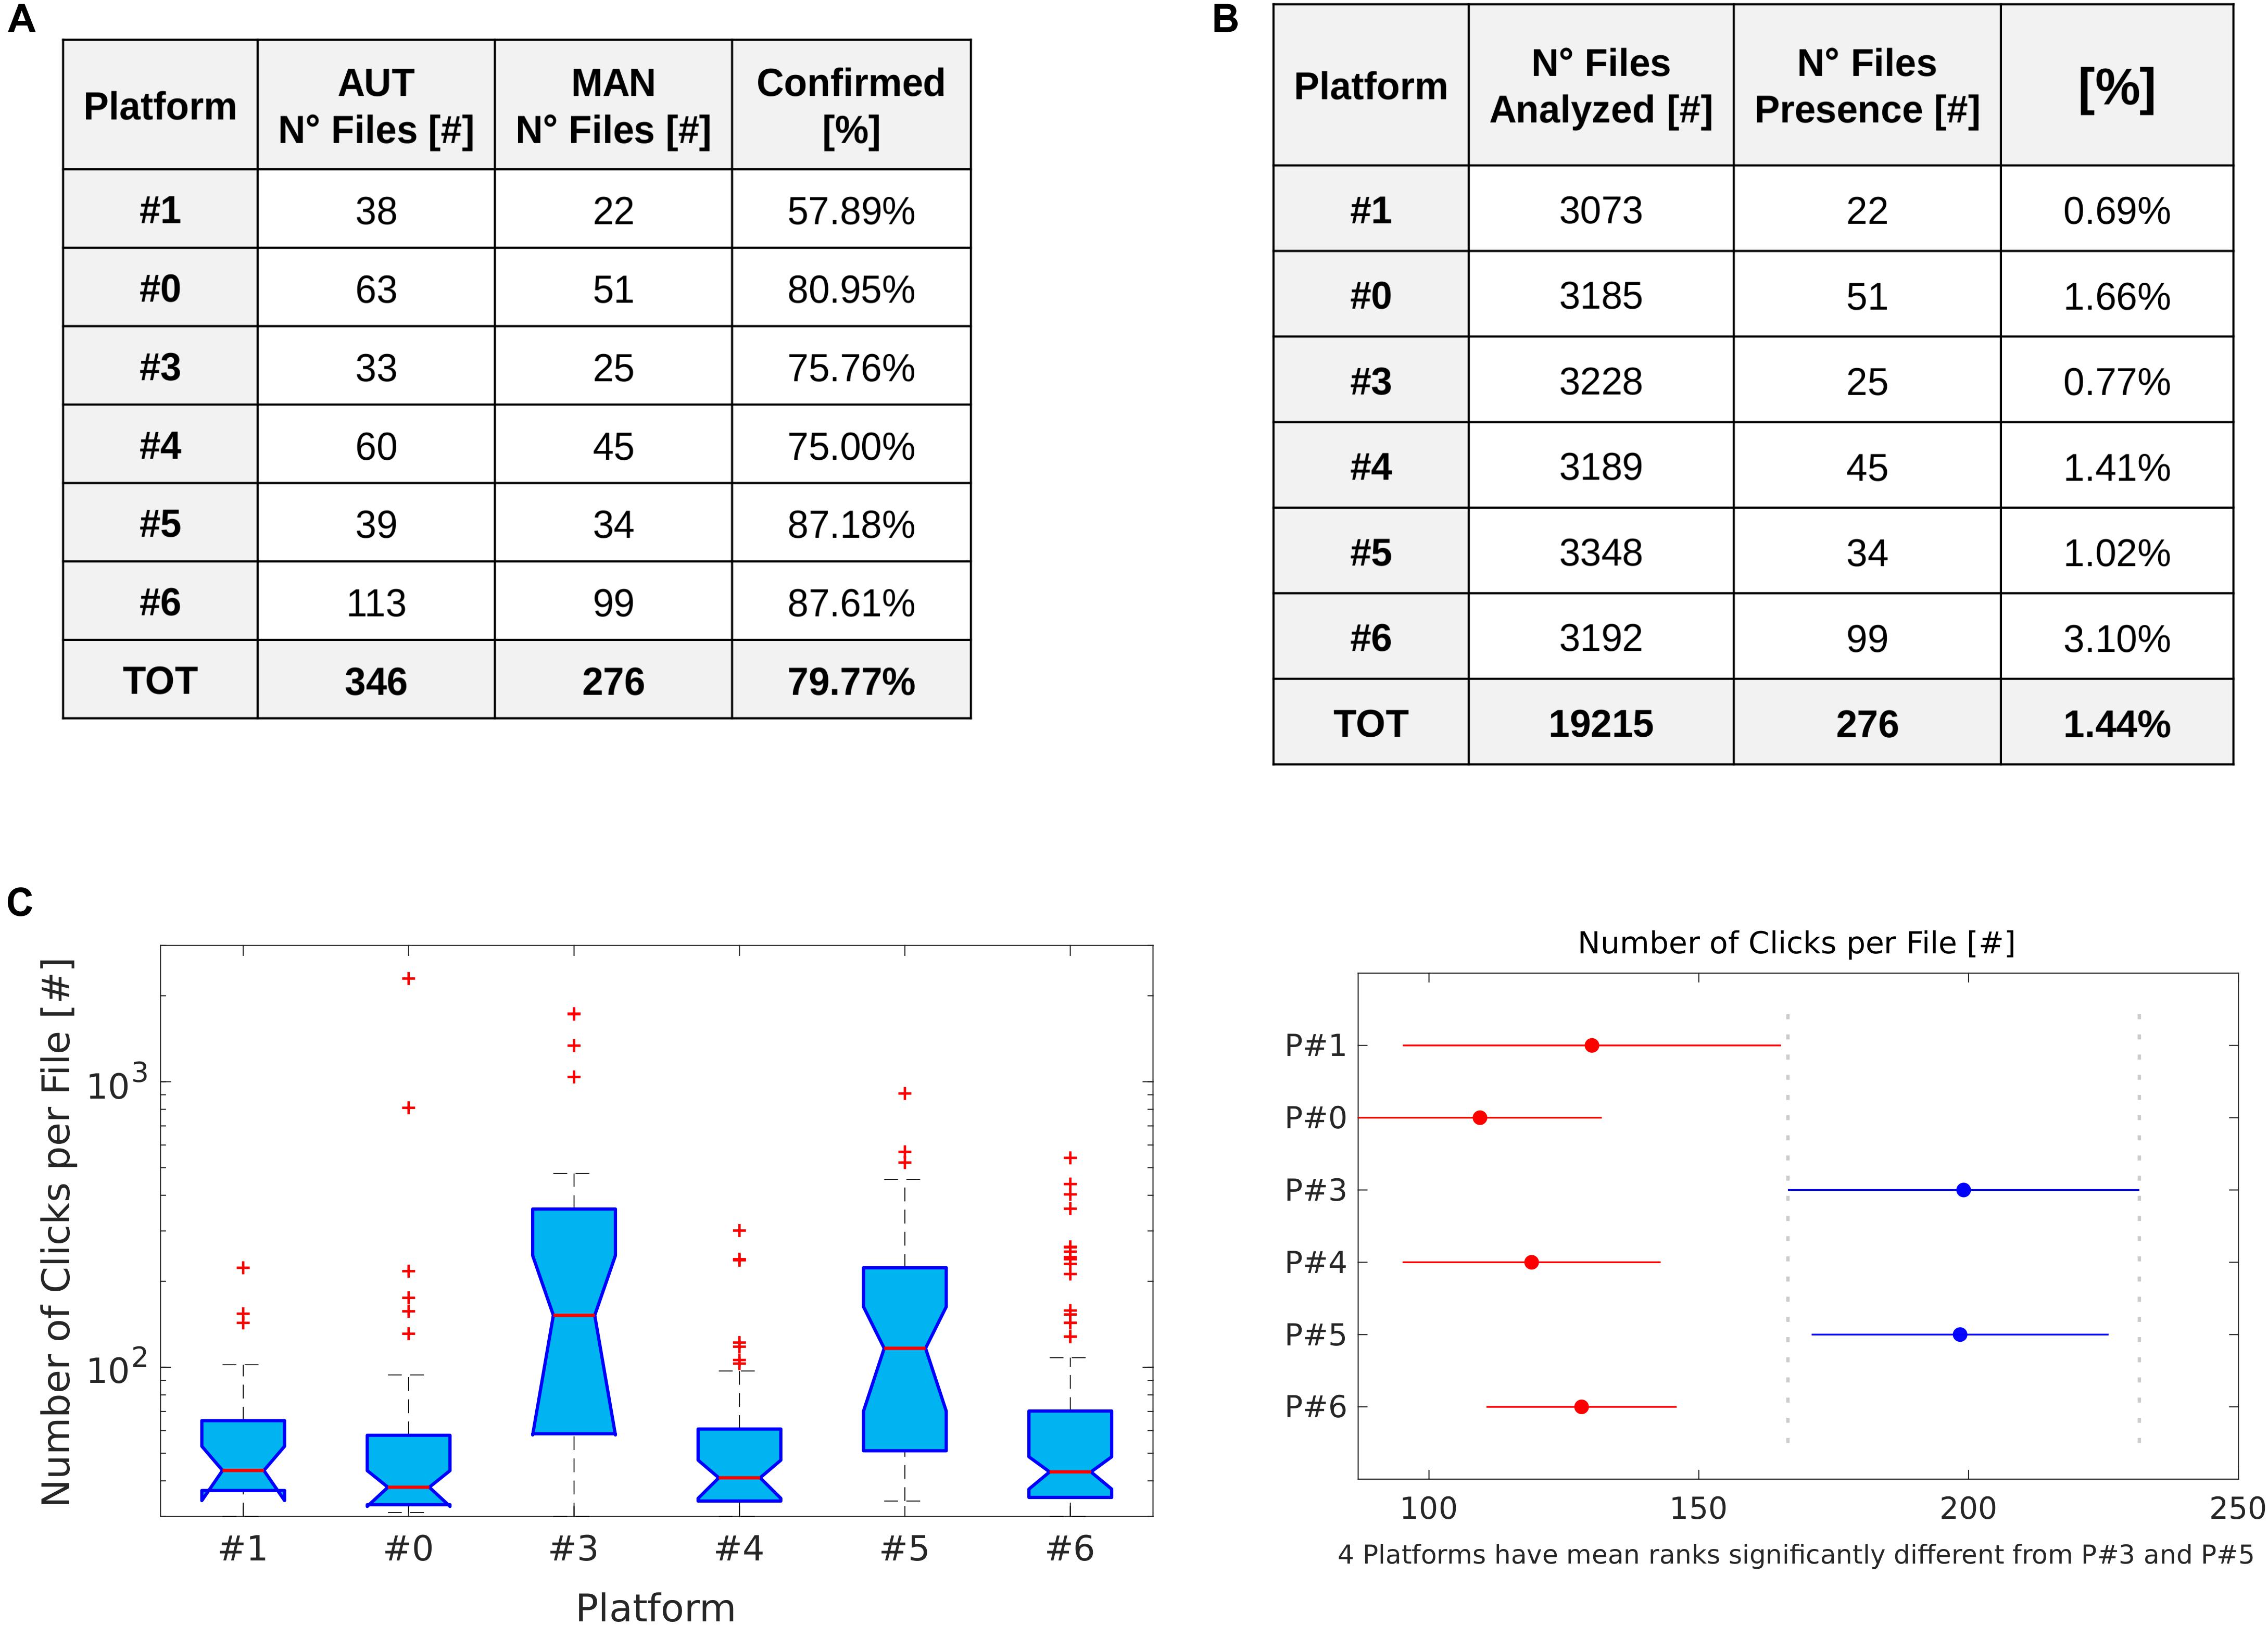
Figure 7. IPHD occurrence. (A) Table showing the results of the checks of automatic detection and classification of IPHD clicks (AUT) through manual analysis (MAN). (B) Table with information about the total number of files acquired by each platform and relative percentage of files with confirmed presence of visible IPHD clicks. (C) Boxplot shows the number of clicks detected per file at the PAM sites (P#1, P#0, P#3, P#4, P#5, P#6). In each box, the central mark indicates the median, and the bottom and top edges of the box indicate the 25th and 75th percentiles, respectively. Whiskers extend to the most extreme data points not considered outliers, and outliers are plotted individually using the “+” symbol (in red). On the right, a multiple pairwise comparison of mean ranks was performed to test significant differences between the PAM sites.
The number of files recorded which contained IPHD clicks was highest at site P#6 (99 files) and lowest at site P#1 (22 files); 51, 25, 45, and 34 files with clicks were recorded at site P#0, P#3, P#4, and P#5, respectively (Figure 7B). The number of files containing clicks did not differ significantly between the 2 months which had the same acquisition effort (April and March) across the six PAM sites (Mann–Whitney U-test, p > 0.05) (Figure 8). However, the number of click events selected per file differed significantly between the PAM sites (Kruskal–Wallis nonparametric test; H [5, N = 6] = 44.9, p < 0.01). The files with the highest number of clicks detected, were recorded at sites P#3 (median: 152; 25th percentile: 58.5; 75th percentile: 358) and P#5 (median: 116.5; 25th percentile: 51; 75th percentile: 223). A multiple pairwise comparison of mean ranks (input from the Kruskal–Wallis test) was performed to test for differences among all the locations (Figure 7C). The two sites with the highest mean number of clicks recorded per file (P#3 and P#5) were significantly different from all other PAM locations (p < 0.05). In Figure 8, the spatiotemporal temporal distribution of dolphin presence is shown in term of number of clicks recorded per day (48 5-min recordings).
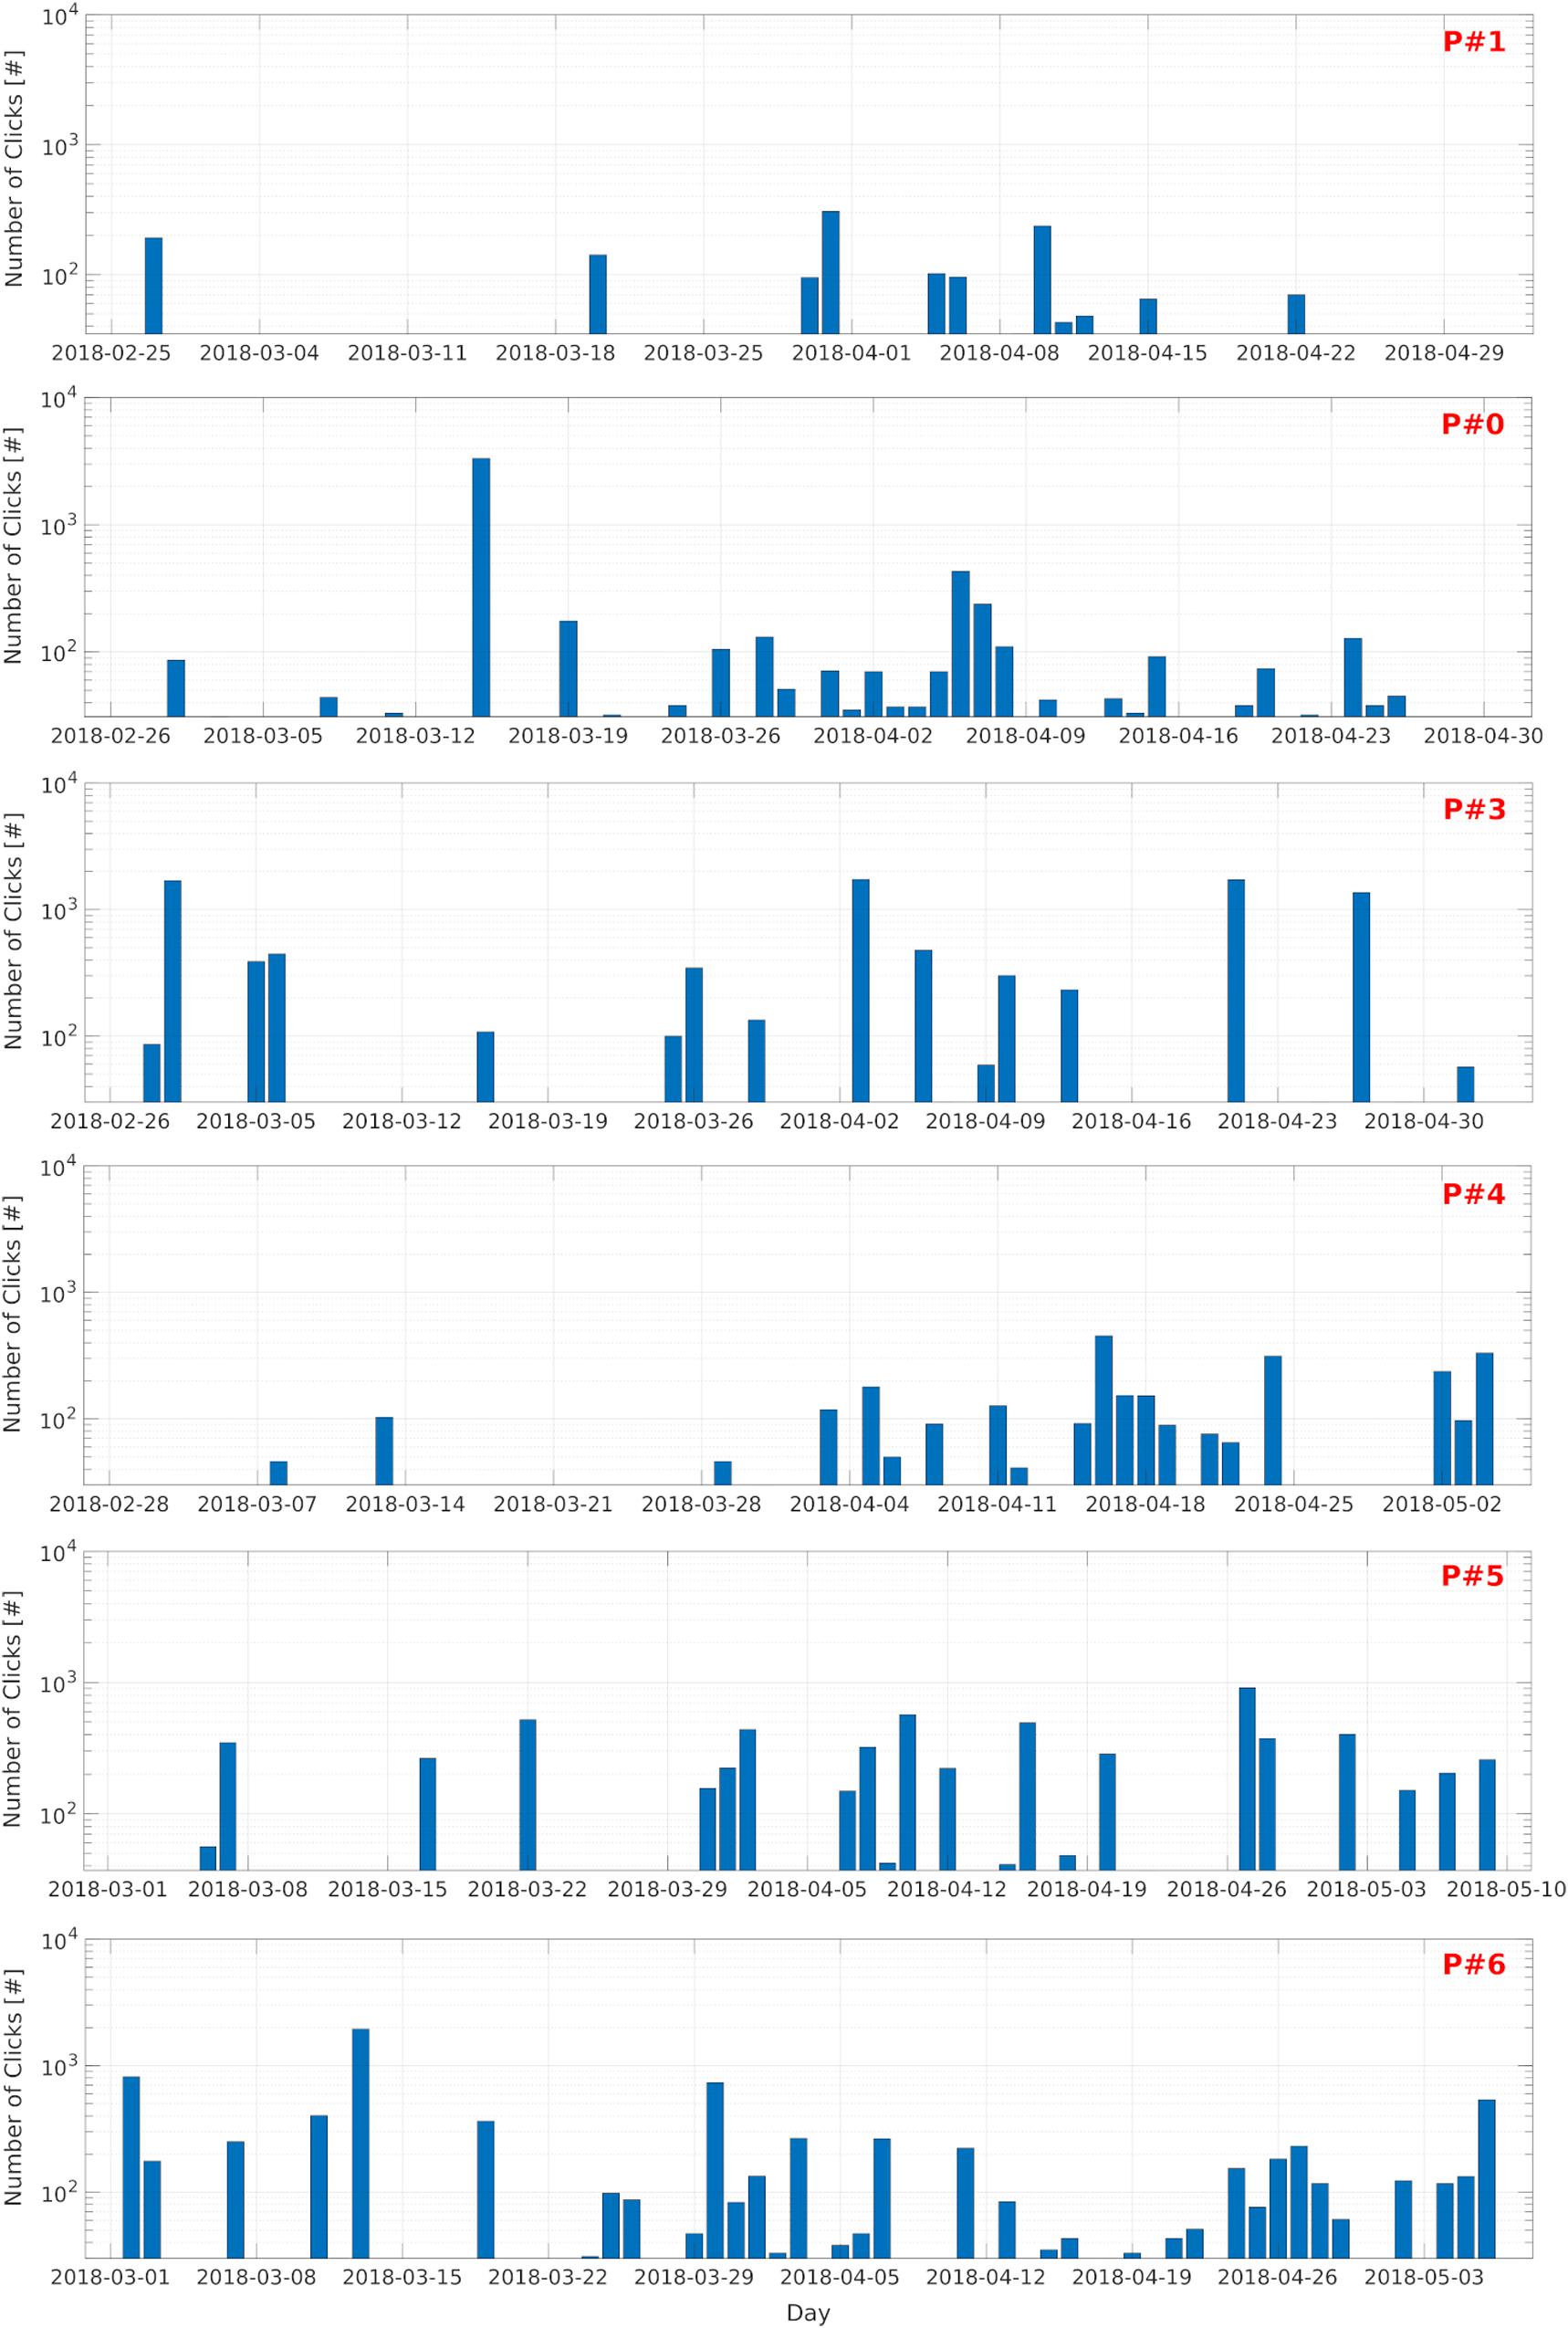
Figure 8. Spatiotemporal distribution. Bar plots showing the number of clicks detected during the study (25 February–10 May 2018) at the PAM sites (P#1, P#0, P#3, P#4, P#5, P#6). Each bar represents the number of clicks detected per day (duty cycle: 5 min every 30 min). Number of clicks (y-axis) is shown in logarithmic scale.
The probability of detection was explored at the daily level, across all the platforms within the 4-h clusters selected (Figure 9), and revealed there was no significant difference in the number of files containing clicks (Kruskal–Wallis nonparametric test; H [5, N = 6] = 9.8, p > 0.05; Figure 9A). Moreover, no significant differences were found between the different platforms across each cluster (all: p > 0.05; Figure 9B). In general, the highest detection probability was identified within the cluster from 04:00 to 08:00 (median: 0.22, 25th percentiles: 0.18, 75th percentile: 0.29). Additionally, GAMMs demonstrated a high variability between the different platforms for dolphin acoustic presence and activity, when hour of the day was used as a fixed effect (Figure 10). The smoothing estimators at site P#4 for both dolphin presence and number of clicks (p < 0.001), and at site P#6 for dolphin presence (p < 0.05), were significantly different. In addition, the number of clicks detected during the day and night phases (Mann–Whitney U-test, p < 0.05) at site P#6 were statistically significant, with a higher rate of clicks recorded during the night. There were no significant differences in the number of clicks recorded at the other PAM sites (Mann–Whitney U-test, p > 0.05). Therefore, hour of the day could not be considered a relevant predictor of dolphin click occurrence within the study area, during the 75 days of monitoring.
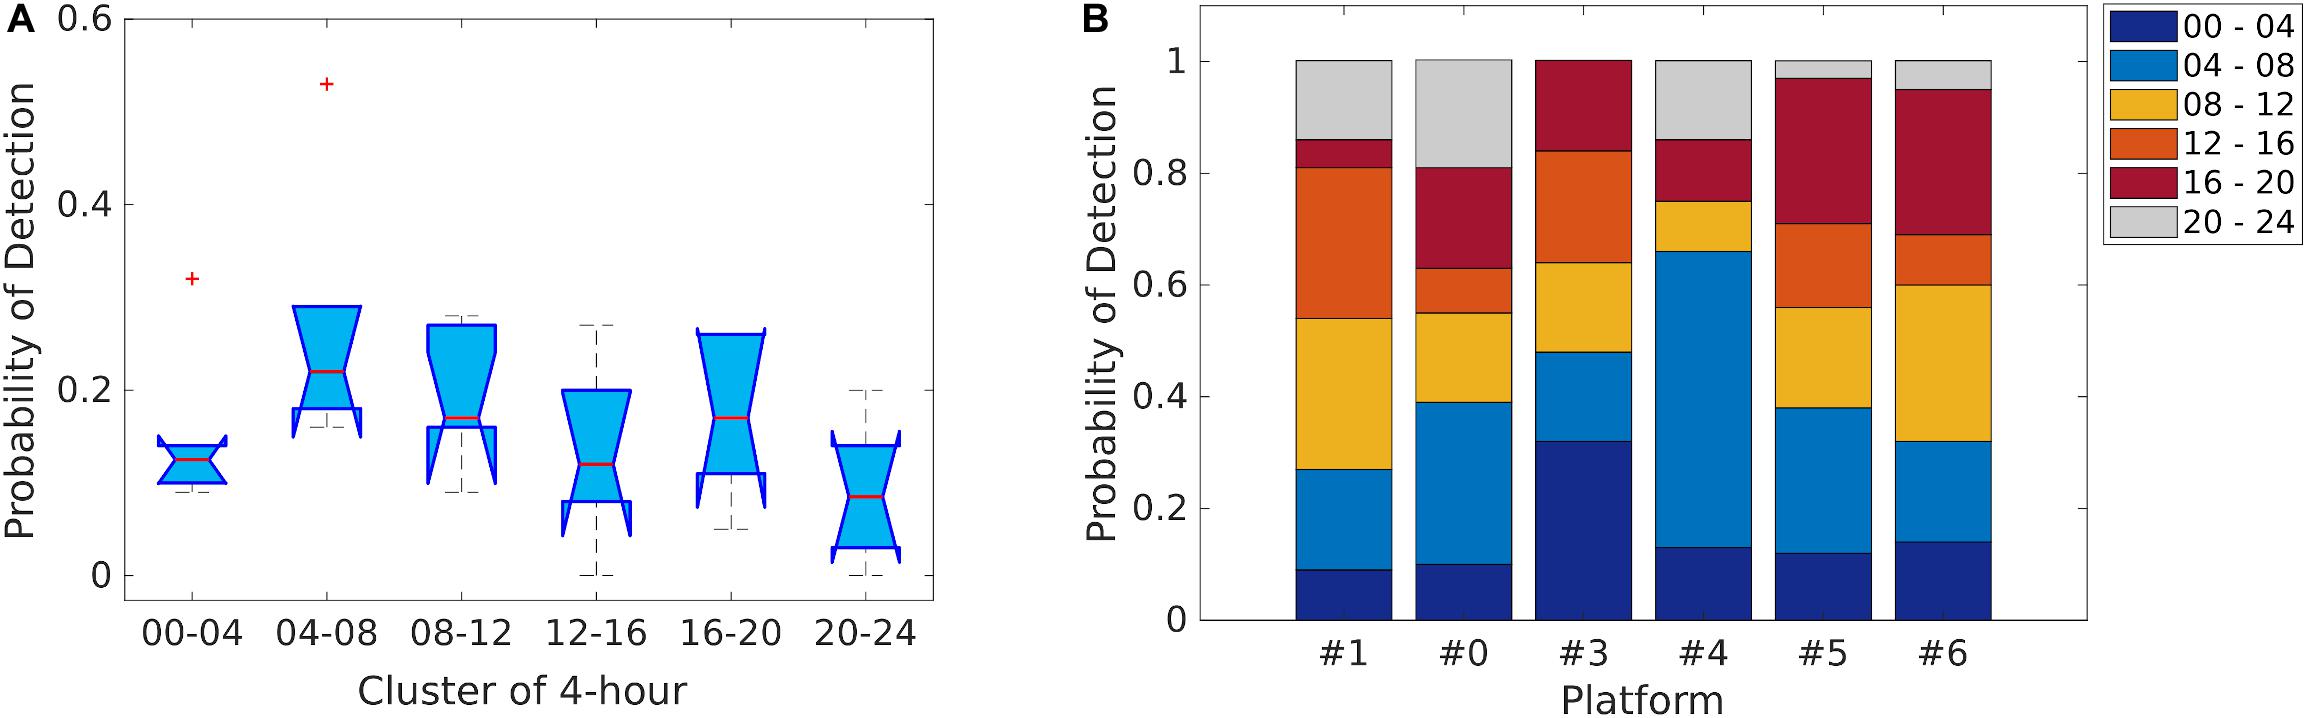
Figure 9. Diel detection probability. (A) Boxplot showing the detection probability in the 4-h clusters selected for all the PAM sites (P#1, P#0, P#3, P#4, P#5, P#6). (B) Stacked bar graph showing the detection probability within the different 4-h clusters for each PAM site.
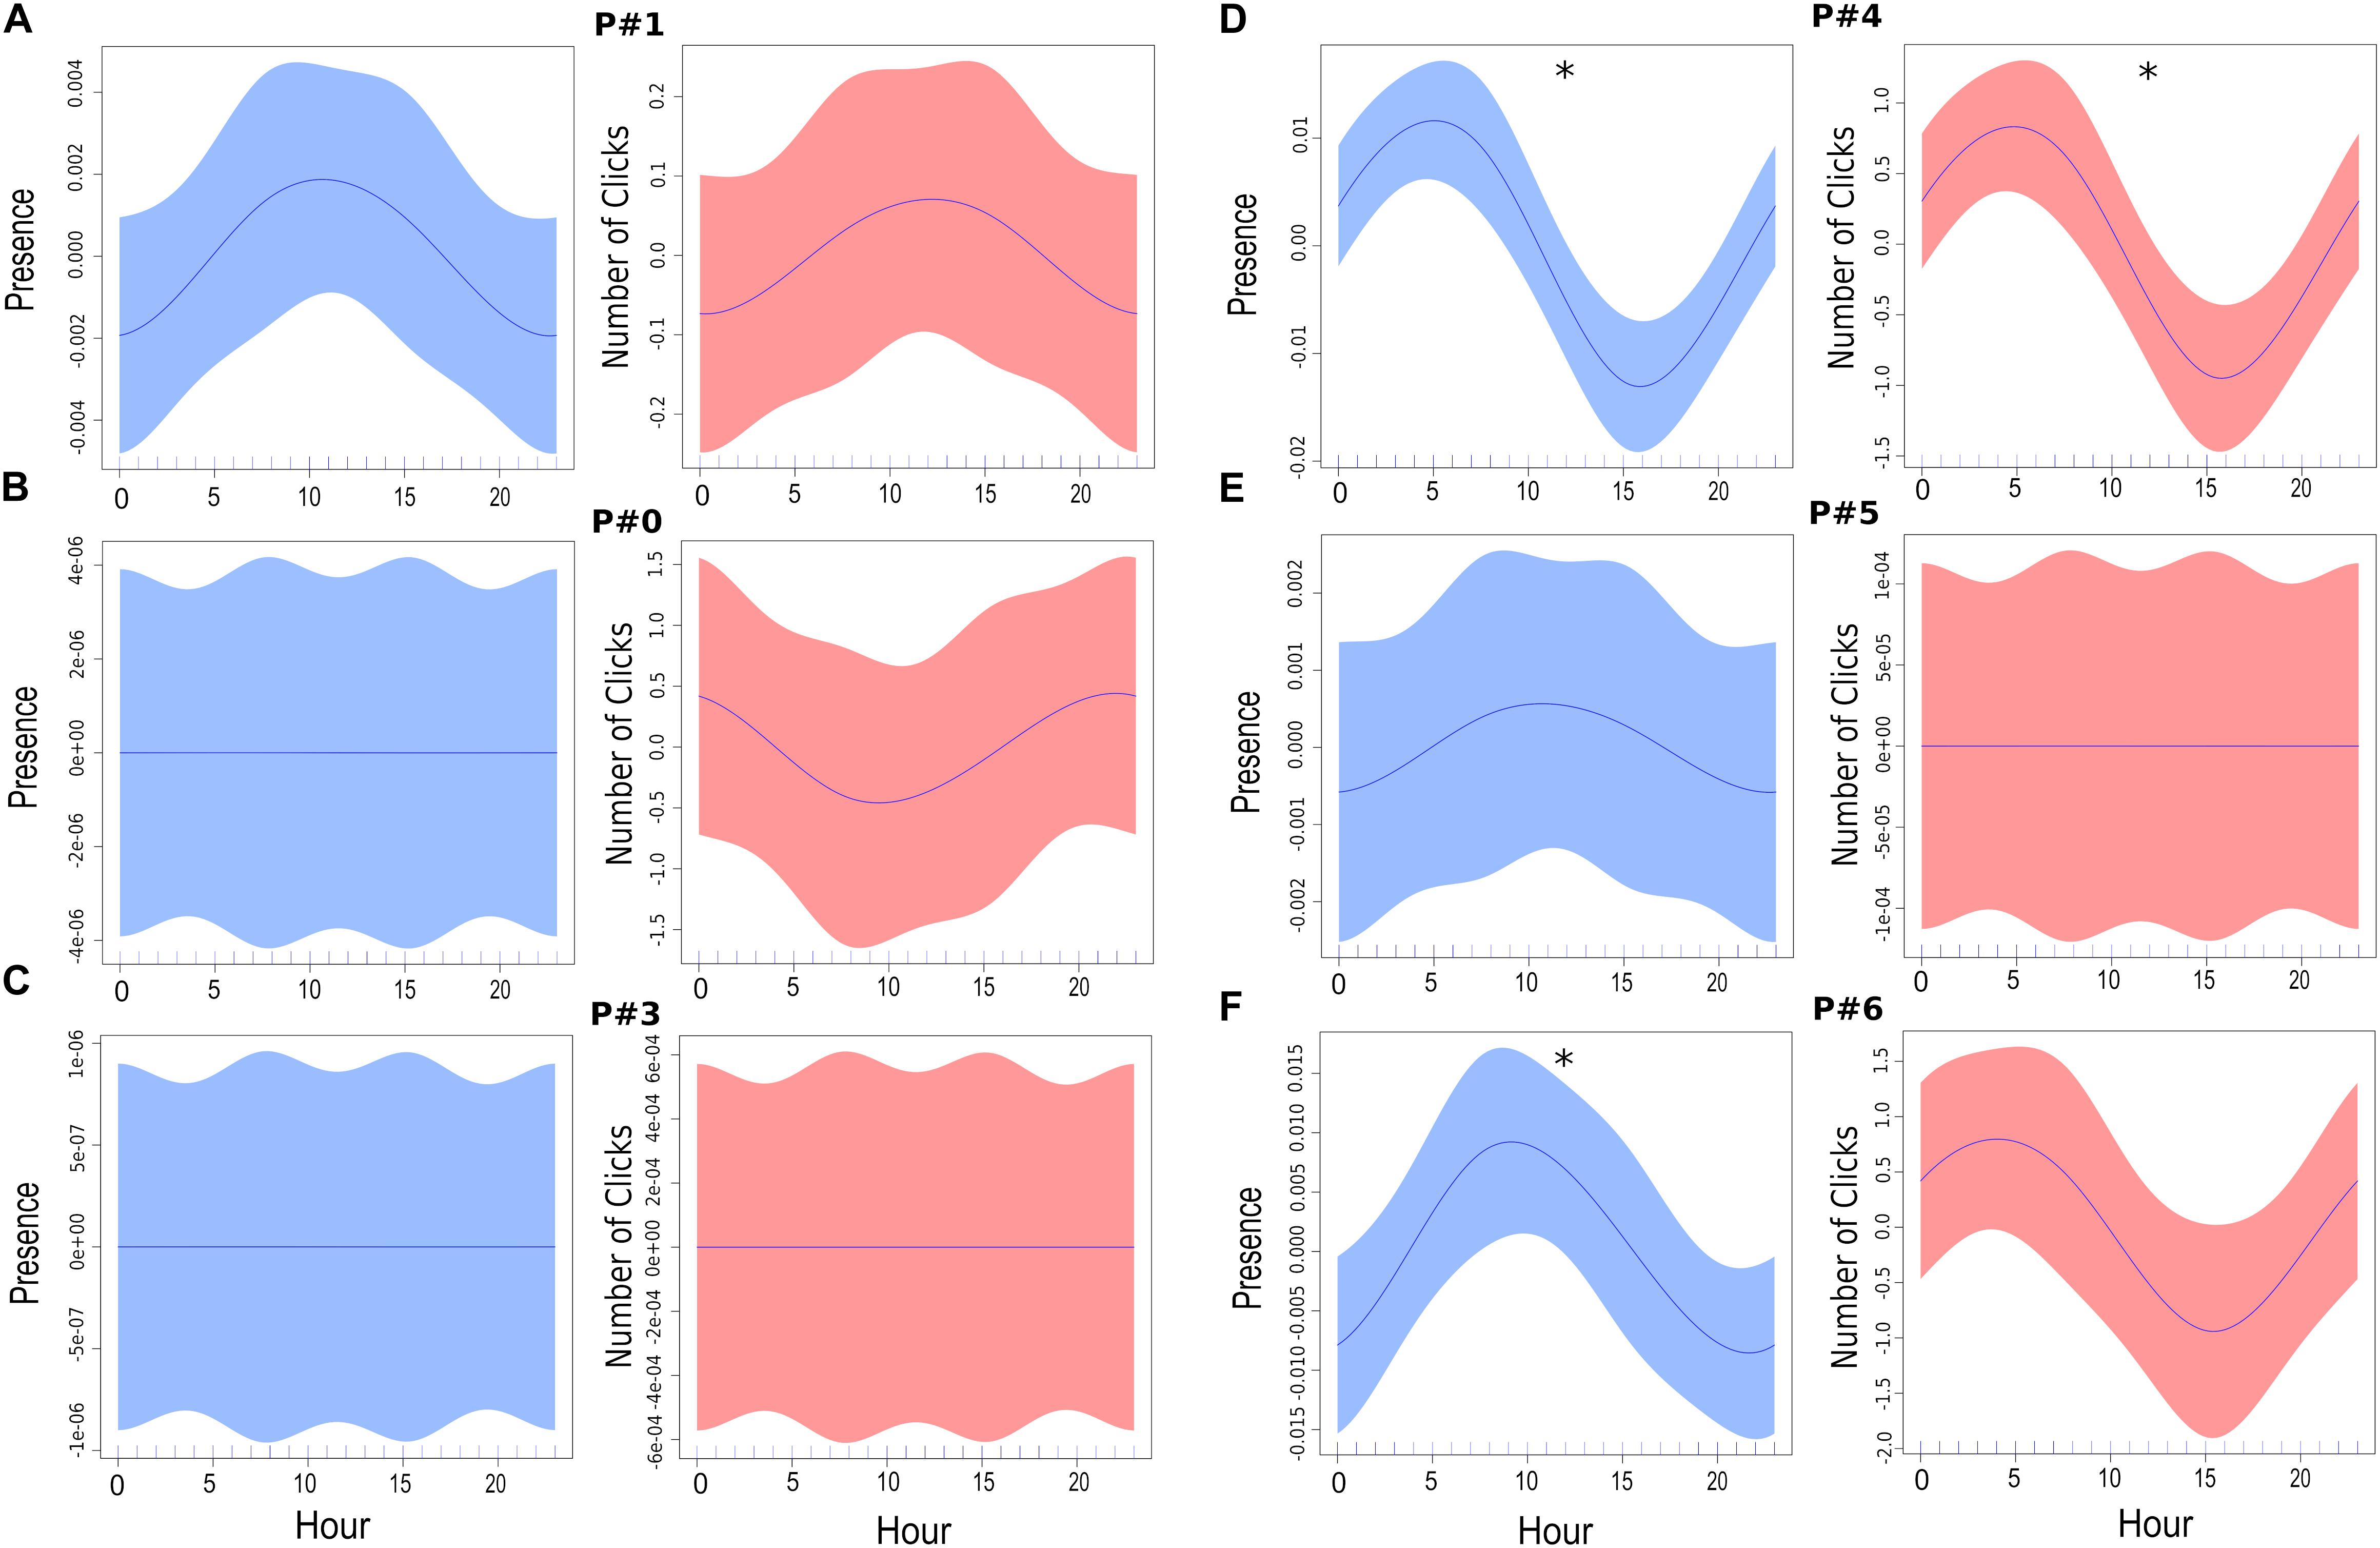
Figure 10. Daily patterns. Plots showing smoothing estimators of GAMMs with hour of the day as fixed effect and knots capped at four smooths. The shaded areas represent the 95% confidence intervals. For each site (A–F), click presence is shown in blue (left) and number of clicks is shown in red (right). Approximate significance of smooth terms: (A) P#1 (n = 3185; Presence: R2 = 0.000583, d.e. = 0.0878%, p-value = 0.141; Number of Clicks: R2 = 0.000227, d.e. = 0.0389%, p-value = 0.251). (B) P#0 (n = 3073; Presence: R2 = 1.3e-10, d.e. = 3.55e-08%, p-value = 0.454; Number of Clicks: R2 = 0.000211, d.e. = 0.0368%, p-value = 0.263). (C) P#3 (n = 3228; Presence: R2 = -9.71e-12, d.e. = 1.56e-09%, p-value = 0.735; Number of Clicks: R2 = 2.37e-11, d.e. = 4.96e-09%, p-value = 0.384). (D) P#4 (n = 3189; Presence: R2 = 0.00585, d.e. = 0.641%, p-value < 0.001*; Number of Clicks: R2 = 0.00419, d.e. = 0.474%, p-value < 0.001*). (E) P#5 (n = 3348; Presence: R2 = 0.000109, d.e. = 0.02%, p-value = 0.303; Number of Clicks: R2 = 1.48e-12, d.e. = 5.54e-10%, p-value = 0.505). (F) P#6 (n = 3192; Presence: R2 = 0.00181, d.e. = 0.227%, p-value = 0.02*; Number of Clicks: R2 = 0.00119, d.e. = 0.16%, p-value = 0.0564). The abbreviation d.e. is the deviance explained by each variable.
Results from the manual analysis of the files selected for the presence of IPHD clicks (276 files) also revealed the spatiotemporal distribution of other IPHD vocalizations and diverse sound sources. The occurrence of whistles and click-series of pulsed sounds differed across the six PAM locations (both: χ2 test, p < 0.01). In conjunction with the number of echolocation clicks detected per file, sites P#3 and P#5 recorded the highest percentage of files containing whistles (52.00 and 44.12% respectively), and bursts pulses and buzzes (P#3: 76.00%; P#5: 47.07%). Sounds from snapping shrimps were identified in all of the files inspected. Calls emitted by fishes (Hawkins, 1986) were identified at significantly different rates across the PAM sites (χ2 test, p < 0.01). Platforms P#6, P#5, and P#3 recorded the highest number of files containing fish calls (80.81%, 76.47%, and 68.00%, respectively). Furthermore, sounds related to human activities within the defined groups (ships noise, explosions, others) were identified in all of the files manually inspected (346 files). Results showed that the distribution of these anthropogenic noise sources differed around the PAM locations (all: χ2 test, p < 0.01). The presence of ship noise was higher at sites P#1 and P#0 (100.00 and 76.19% of the files analyzed contained these noises). Whereas, site P#5 was the quietest location with regard to the presence of ship noise (20.51% of files contained these noises). Explosions were identified in three files (one file each in P#1, P#3, and P#4). The occurrence of other artificial sounds (sonar, low frequency pulses, etc.) was higher at sites P#3 (27.27%), P#4 (23.23%), and P#1 (15.79%) compared to the other locations.
Comparison With A-Tag Data Logger
The output of the classification process was also compared with detections logged by an A-tag data logger during the first 31 days of monitoring at site P#0 (1474 files). Both sets of detections, from the Cubic SVM and the A-tag, were validated using manual checks. Within this sub-dataset, 17 files were selected for the presence of dolphin clicks (Figure 11). Results of the confusion matrix test (Figure 11A) showed that in five files, both methods confirmed the presence of dolphin clicks (TP rate = 1). No FP detections occurred, meaning there were no cases where the trained classifier detected candidate clicks when the A-tag detection was triggered (FP rate = 0). In 98.84% of the dataset (1457 files), neither method identified the presence of dolphin clicks (TN) and in 12 files the A-tag did not trigger with the presence of clicks (FN). In general, in the files classified as TP, a higher number of clicks were identified (mean ± SD = 717 ± 830) compared to the others (mean ± SD = 39 ± 12) (Figure 11B). Nevertheless, the A-tag was highly reliable in terms of the detection of IPHD clicks (accuracy = 0.99).
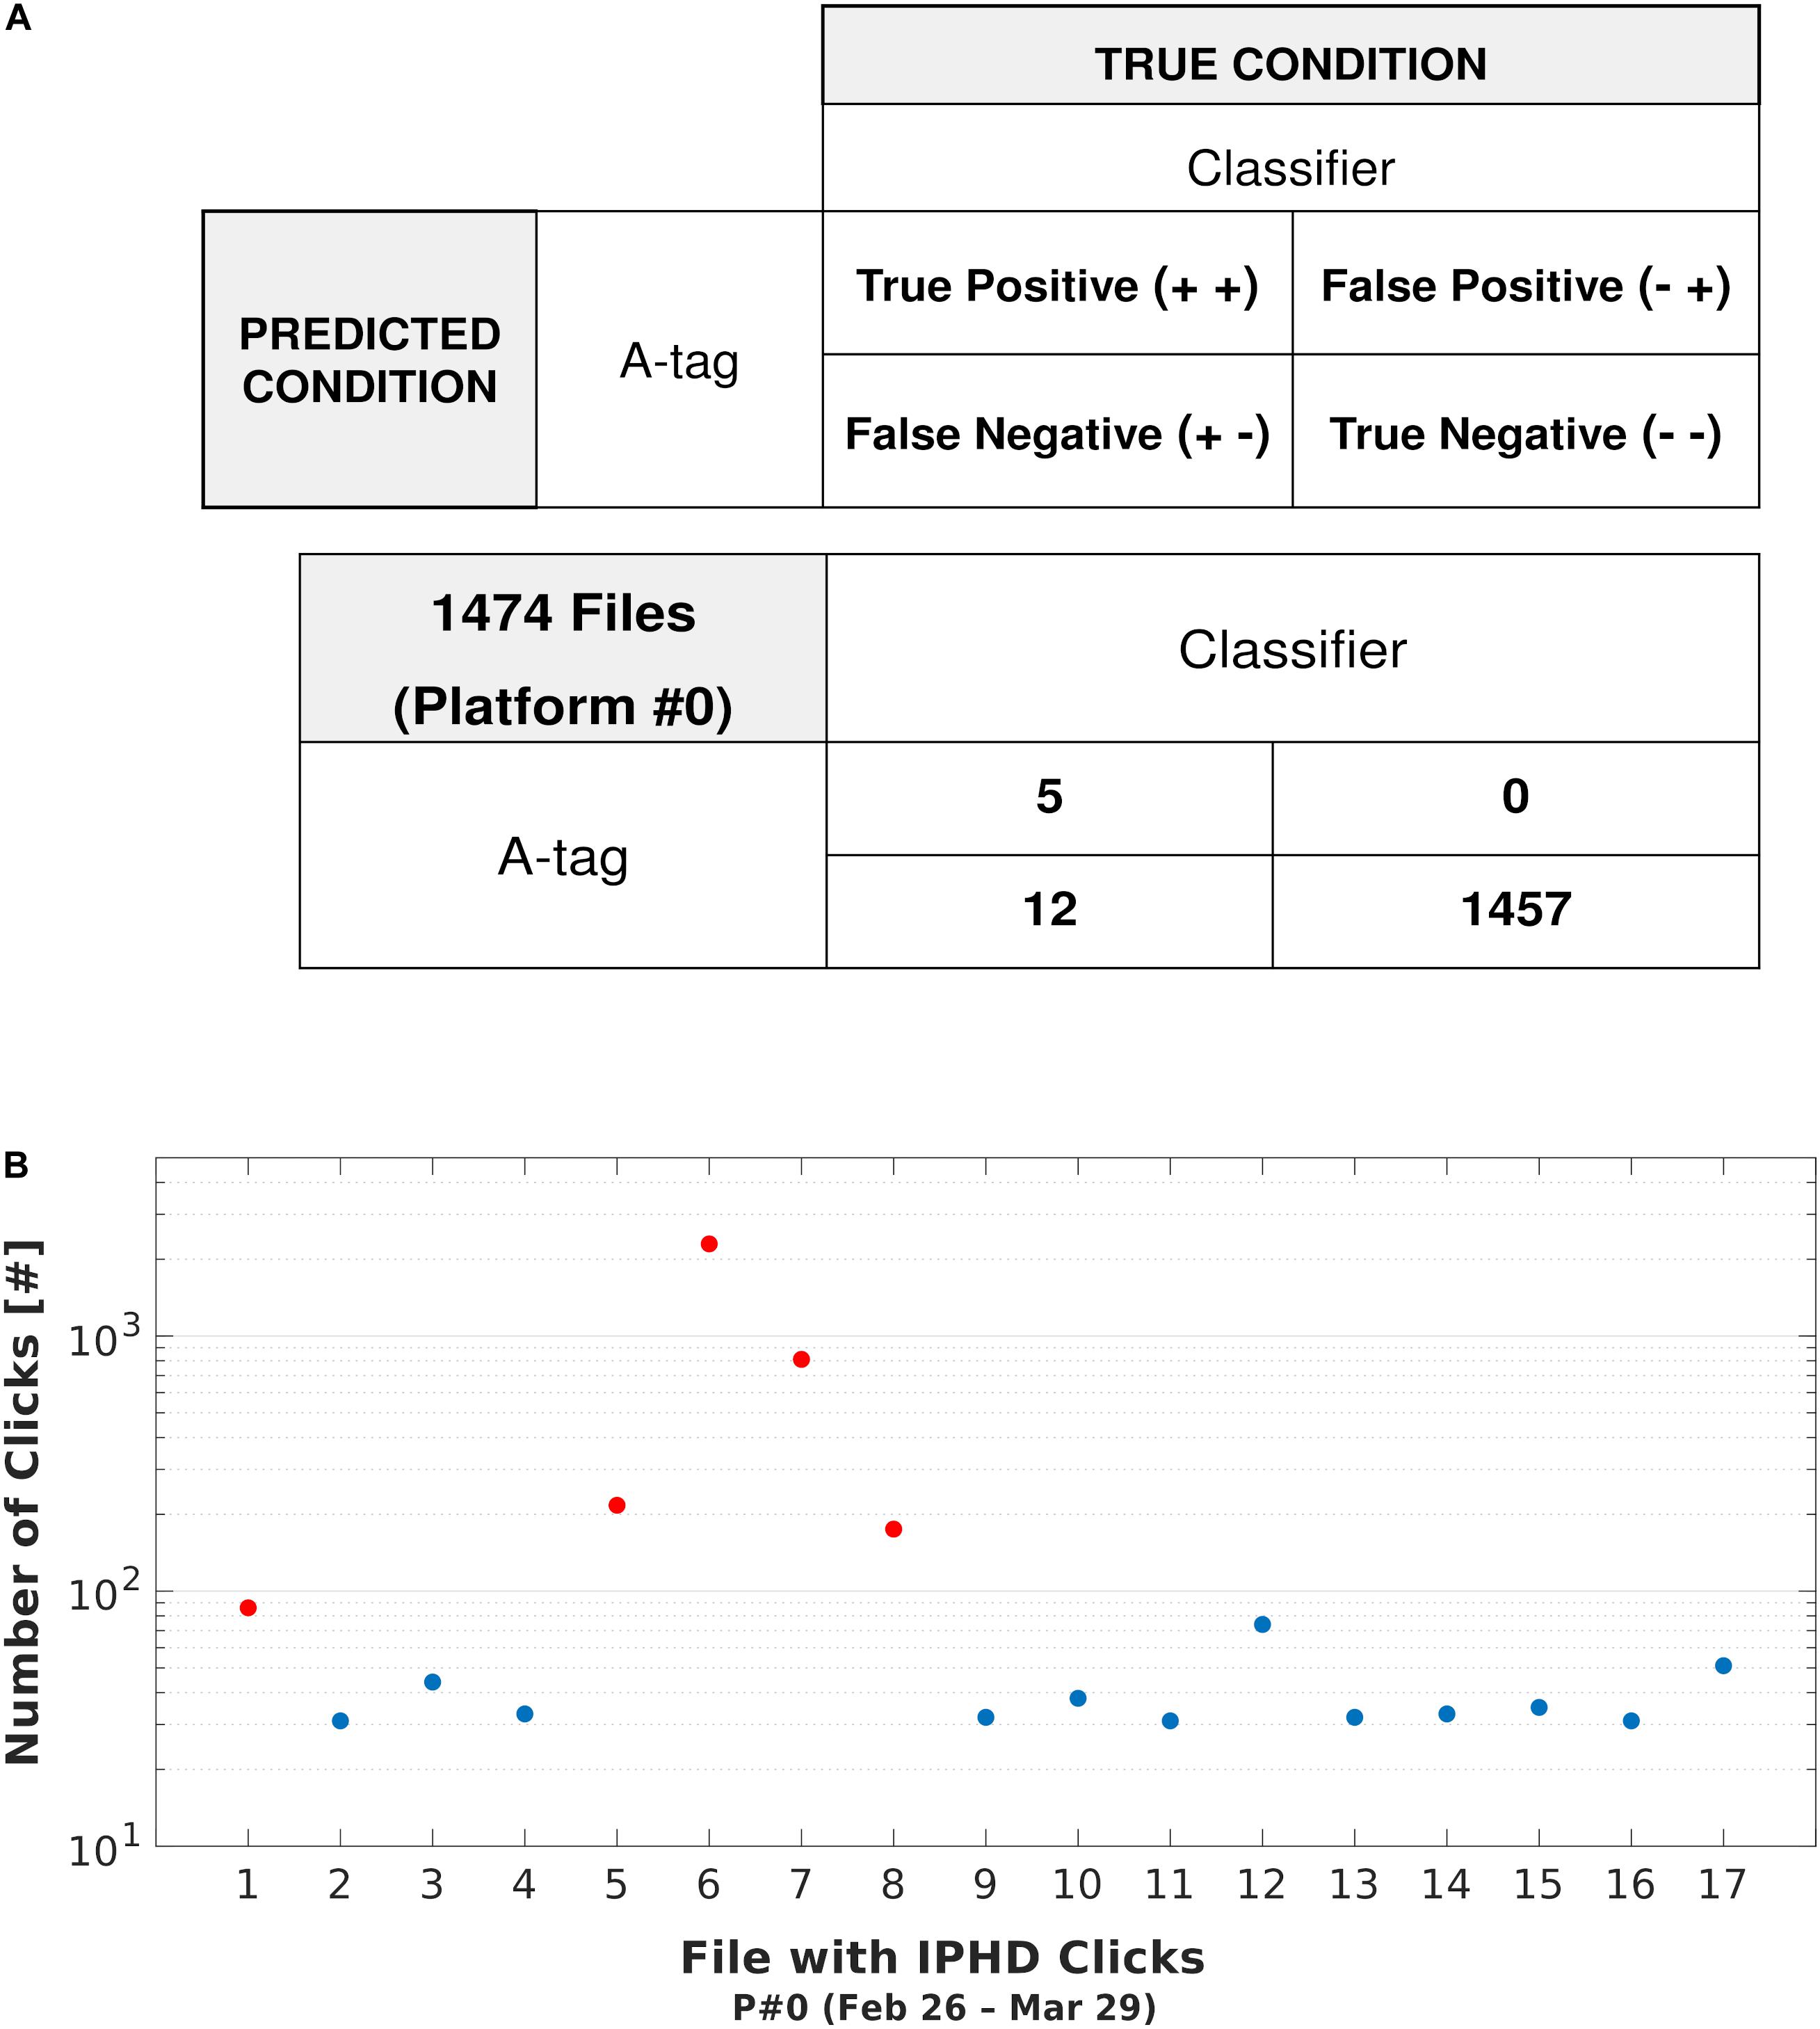
Figure 11. Comparison with A-tag Data Logger. (A) A confusion matrix shows the comparison between A-tag performance and the Cubic SVM. (B) Scatterplot showing the number of clicks detected for files classified as true positive (red dots) and false negative (blue dots). For all of these files, the presence of clicks was confirmed by manual analysis (spectrogram analysis).
Discussion
The distribution and habitat characteristics of the second largest population of IPHD off the east coast of Zhanjiang city (China) were recently studied as part of a 7-year boat-based visual survey effort (Xu et al., 2015). Research has also been carried out on IPHD in the Northern Beibu Gulf (China), using data acquired through a 3-year visual survey study (Wu et al., 2017). Traditional visual surveys of dolphins can cover large spatial areas, and are fundamental for specific research utilizing animal sightings (behavioral ecology, genetics, ecotoxicology, etc.) and for specimen identification (photo identification). The data acquired during boat-based visual surveys are essential for investigating group size and composition, and to fully understand population ecology and inform wildlife management plans (Xu et al., 2015). However, visual surveys are limited by: (1) their high cost and the availability of research vessels and personnel and (2) the difficulties associated with collecting data at night, in rough weather conditions and from animals when they are underwater.
Passive acoustic monitoring surveys are increasingly being adopted as a key sampling approach to acquire novel information about ocean ecosystems, including their biodiversity (Ricci et al., 2016), habitat degradation (Gordon et al., 2018), the distribution and abundance of elusive species (Hildebrand et al., 2019), benthic communities (Freeman and Freeman, 2016), coral reef health (Bertucci et al., 2016), macroalgae production (Freeman et al., 2018), the status of MPAs (Buscaino et al., 2016; Gabriele et al., 2018), and the effect of human activities (Lammers et al., 2017). In this study, we described the use of multiple PAM sites to investigate spatiotemporal patterns in the distribution and acoustic behavior of an IPHD population.
Recently, Munger et al. (2016) conducted a long-term PAM project to investigate IPHD occurrence north of Lantau Island, Hong Kong, as a part of environmental impact assessments for a number of coastal development plans. The survey was designed to monitor potential areas of impact for IPHD, in relation to planned coastal reclamation and seabed modification. Over 2 years of monitoring, Ecological Acoustic Recorders (EARs) were deployed across several PAM sites (13) during different time periods. The EARs were placed in small subgroups, separated by a distance of a few kilometers. The results reported by Munger et al. (2016) were consistent with the known spatial patterns of IPHD in Hong Kong waters, and indicated the potential use of PAM to study the distribution of the species in shallow waters. However, the acoustic data were acquired at a limited sampling frequency (64 kHz) for the analysis of full bandwidth echolocation clicks, and the signal identification was conducted manually (spectrogram visualization). Munger et al. (2016) also reported that a high level of ambient noise generated by human activities and the constant presence of snapping shrimps may compromise the reliability of an automatic detection process.
In this study, a PAM system using multiple recorders (SoundTrap) set to record at a high sampling frequency (288 kHz) was tested, together with a trained classifier (support vector machine) and a specific data analysis protocol, to study the acoustic occurrence of IPHD. The described classifier was able to detect echolocation clicks from IPHD from within a large dataset, avoiding the other signals recorded, and in particular the short-broadband pulses emitted by snapping shrimps and finless porpoises. The Cubic SVM model was highly reliable in the classification process, and the manual analysis confirmed the presence of dolphin clicks in 79.77% of the files automatically selected. As the distribution of the population is not yet clear, data were acquired from a large area. Performance was slightly different across the PAM sites (Figure 7), where the lowest level reported at site P#1 seemed to be related to the strong influence of anthropogenic noise at this location. However, the main goal of the automatic selection was an effective reduction of the large dataset. Only 346 files (1.44% of the total number of files acquired) were manually inspected.
The methodology applied in this study represents an influential approach to a big data challenge, which included the need to examine recordings from multiple platforms and different acoustic scenarios. Spectrogram resolution could be considered a limiting factor during the human-operated checks of the data, especially when low intensity clicks were recorded (when the animals were more than 500 m from the platform or traveling and echolocating in other directions) or in states of high background and broadband noise generated by ship traffic and/or adverse climatic conditions. However, the manual check of the automatic results was imperative as a validation technique (Hildebrand et al., 2019). In addition, the spectrogram analysis was an important complementary monitoring technique which produced information on soundscape composition. The analysis of the selected data revealed significant insights regarding the fine-scale differences between the PAM sites, and possible correlations with dolphin presence and acoustic behavior. For example, IPHD social and feeding sounds were recorded more frequently at sites P#3 and P#5, in conjunction with the automatic detection of the highest number of clicks. This result confirmed the potential applications of PAM using both automatic and manual methods of data analysis.
The acoustic complexity of marine ecosystems in shallow waters can vary within a few kilometers, especially where the transition between sandy, muddy, rocky, and coral seabed creates micro-benthic communities with different acoustic scenarios (Radford et al., 2010; Ceraulo et al., 2018; Lillis et al., 2018), which are also influenced by broadband ship noise and other human activities (Li et al., 2015; Liu et al., 2017; Marley et al., 2017). As such, the differences in the detectability of dolphin clicks across the PAM sites could be a factor of the environment (shallow waters) and the acoustic signal (dolphin click) being investigated. In the future, the use of a specific classification process (trained classifier) for each location will be considered, in order to decrease any potential bias in the analysis (DesJardins and Gordon, 1995). Further investigations are also ongoing to define the spatiotemporal distribution of the other biological sources identified in the study area (finless porpoises, snapping shrimps, soniferous fishes).
The northernmost site (P#6) revealed a higher, consistent acoustic presence of IPHD (the highest number of files with clicks and days with presence; Figures 7, 8). At sites P#3 and P#5, the highest number of clicks in association with the general acoustic activity of IPHD were recorded. These three sites also logged the highest percentage of files containing fish calls which were concurrently recorded with dolphins. These results suggested that the abundance of soniferous fishes could be considered as a possible primary habitat distribution factor and an index of prey availability for IPHD (Munger et al., 2016; Würsig et al., 2016; Pine et al., 2017a, b). The abundance of pulse sounds from snapping shrimps confirmed that this was the most abundant biological sound source in tropical coastal waters (Au and Banks, 1998; Lillis et al., 2018). In addition, the southern sites in the study area (P#1, P#0, P#3, and P#4) appeared to be more influenced by anthropogenic noises, compared to the northern sites (P#5 and P#6). Further analyses are ongoing to describe the variation in the ambient noise levels in the study area in relation to IPHD presence and acoustic behavior, and to describe the long-term acoustic trends and patterns in these sound sources.
The probability of click detection was higher for the 4-h clusters before, during, and after dusk and sunrise (4:00–8:00; Figure 9). A variety of odontocetes species around the world, including IPHD, have been reported as being more active acoustically during the night and close to sunset and sunrise, with specific daily patterns (Benoit-Bird et al., 2009; Soldevilla et al., 2010; Klinck et al., 2012; Au et al., 2013; Baumann-Pickering et al., 2015; Wang et al., 2015; Giorli et al., 2016; Temple et al., 2016; Munger et al., 2016; Caruso et al., 2017). In our study area, the daily patterns of acoustic presence and the number of clicks recorded were very different among the PAM sites (Figure 10). GAMMs revealed that hour of the day was not a relevant predictor of dolphin click occurrence or rate of clicks. Considering only the daily and nightly phases, only site P#6 showed a statistical difference in the number of clicks recorded. This was not found for the other five locations and could be a result of the low number of detections logged by the other platforms. Similar results were also reported by Munger et al. (2016) in Hong Kong waters, where one of the PAM sites recorded an insufficient number of detections to determine diel pattern, despite the long-term monitoring carried out. Overall, Munger et al. (2016) reported a high detection rate of IPHD during nighttime, which reinforces the importance of conducting PAM surveys, and not only visual surveys which are mostly limited to daylight hours.
The comparison between the classifier developed in this study and the A-tag data logger demonstrated the high reliability of both methods for the detection of IPHD clicks (Figure 11). No recordings were marked as FP and the two approaches had similar results for the selection of files without click events (TN). The classifier had a higher resolution (12 files) in the identification of clicks (FN). Within the FN class, all the recordings contained a lower number of clicks than the TP class (Figure 11). Therefore, mainly in the cases where few clicks were recorded, the A-tag did not identify events. The acoustic data logger was highly reliable. However, there were both advantages and limitations associated with using this device to analyze dolphin occurrence. Using the A-tag, it was possible to acquire data with a higher duty cycle, reduce the data storage requirement (as no audio files were saved), and accelerate the data processing and availability of results. Despite this, the absence of audio files for post-processing analyses, for example, for the measurement of additional click parameters, the detection of other sounds, and the assessment of environmental noise levels and temporal patterns of the soundscape, was a disadvantage. Additionally, the detection range of the SoundTrap was estimated as larger than previous estimates for the A-tag in the study area (Dong et al., 2017). Dong et al. (2017) estimated a detection range of 200 m for IPHD clicks. Whereas, in this study, we estimated a detection range for the acoustic platforms of at least 500 m (Figure 4). However, we strongly suggest carrying out a manual check of the results when using both methods.
Conclusion
The IPHD is a nationally protected species of high conservation value in China. However, it is predicted that in the near future, the recently discovered Hainan population will be subject to a series of environmental upheavals. The methodology described in this study demonstrates the potential of PAM for the investigation of the ecology of nearshore dolphin species. The study involved the deployment of underwater acoustic platforms in shallow waters within the supposed habitat of the IPHD, and the acquisition of data simultaneously at six locations distributed along more than 100 km of coastline. Preliminary information regarding habitat use has been acquired and the hotspot areas characterized by higher acoustic activity were identified (P#6, P#5, and P#3), in relation to IPHD feeding and social sounds. As the highest number of detections were recorded at the northernmost site (P#6), the survey area has been extended, and new platforms have been installed north of this location. During future PAM projects, the occurrence of typical Inter Click Intervals will be considered as a significant parameter in the automatic classification of clicks from other cetacean species (Frasier et al., 2017). The results of this study also revealed preliminary information regarding the distribution of other phonating animals and noise producing human activities. The use of PAM has expanded our survey ability in the study area. Furthermore, the information regarding the IPHD acoustic occurrence will be crucial in advancing this field of investigation. Recent boat-based surveys focused in the hotspot areas defined in this study, and the rate of animal encounters is increasing considerably. Therefore, our demonstration that PAM is a powerful technique which can be applied to monitor IPHD habitat, and to improve the efficiency of the direct monitoring of this recently discovered population is very timely.
Data Availability Statement
The datasets generated for this study are available on request to the corresponding author.
Ethics Statement
The data collection and use protocols were approved by the Institute of Deep-sea Science and Engineering, Chinese Academy of Sciences, with the ethics approval code IDSSESYLL-MMMBL-01.
Author Contributions
FC, LD, and SL conceived the study and coordinated the PAM project. LD, FC, WX, ZG, MLL, and MML carried out the platform deployments and data collection. FC and GA designed the data analysis protocol and the classification process. FC, DL, WX, and ZG analyzed the acoustic data. FC, LD, SL, MLL, MML, WX, and ZG provided ideas, materials, and analysis tools. All authors reviewed the manuscript.
Funding
This study was financially supported by a major science and technology project in Hainan Province (ZDKJ2016009-1-1), National Natural Science Foundation of China (Nos. 41422604 and 41306169), the Biodiversity Investigation, Observation and Assessment Program (2019-2023) of Ministry of Ecology and Environment of China, and Indian Ocean Ninety-east Ridge Ecosystem and Marine Environment Monitoring and Protection, and the China Ocean Mineral Resources R&D Association (Grant No. DY135-E2-4).
Conflict of Interest
The authors declare that the research was conducted in the absence of any commercial or financial relationships that could be construed as a potential conflict of interest.
Acknowledgments
We would like to thank all the staff and students at the Institute of Deep-sea Science and Engineering (Chinese Academy of Sciences) for their help during this study. We would also like to express our gratitude to the local fishermen who provided assistance. We also wish to thank Giacomo Giorli for his assistance with the text review, Rosario Grammauta for his valuable advice regarding the TL model, and Nicolò Caruso for designing Figure 1B. FC would like to thank the President’s International Fellowship Initiative (PIFI) of the Chinese Academy of Sciences. We would like to thank Editage (www.editage.com) for English language editing.
Footnotes
References
Ainslie, M. A., and McColm, J. G. (1998). A simplified formula for viscous and chemical absorption in sea water. J. Acoustic. Soc. Am. 103, 1671–1672. doi: 10.1121/1.421258
Akamatsu, T., Kimura, S., Li, S., Dong, L., Wang, K., and Wang, D. (2011). “A stereo acoustic event recorder for monitoring abundance and movements of dolphins and porpoises,” in Proceedings of the 2011 IEEE Symposium and 2011 Workshop on Scientific Use of Submarine Cables and Related Technologies (SSC), Underwater Technology (UT), Tokyo, 1–2.
Akamatsu, T., Matsuda, A., Suzuki, S., Wang, D., Wang, K., Suzuki, M., et al. (2005). New stereo acoustic data logger for free-ranging dolphins and porpoises. Mar. Technol. Soc. J. 39, 3–9. doi: 10.4031/002533205787443980
Arranz, P., DeRuiter, S. L., Stimpert, A. K., Neves, S., Friedlaender, A. S., Goldbogen, J. A., et al. (2016). Discrimination of fast click series produced by tagged Risso’s dolphins (Grampus griseus) for echolocation or communication. J. Exp. Biol. 219, 2898–2907. doi: 10.1242/jeb.144295
Au, W. W. L., and Banks, K. (1998). The acoustics of the snapping shrimp Synalpheus parneomeris in Kaneohe Bay. J. Acoust. Soc. Am. 103, 41–47. doi: 10.1121/1.423234
Au, W. W. L., Giorli, G., Chen, J., Copeland, A., Lammers, M., Richlen, M., et al. (2013). Nighttime foraging by deep diving echolocating odontocetes off the Hawaiian islands of Kauai and Ni’ihau as determined by passive acoustic monitors. J. Acoust. Soc. Am. 133, 3119–3127. doi: 10.1121/1.4798360
Bailey, H. R., Clay, G., Coates, E. A., Lusseau, D., Senior, B., and Thompson, P. M. (2010). Using T-PODs to assess variations in the occurrence of coastal bottlenose dolphins and harbour porpoises. Aquat. Conserv. Mar. Freshw. Ecosyst. 20, 150–158. doi: 10.1002/aqc.1060
Baumann-Pickering, S., Roch, M. A., Wiggins, S. M., Schnitzler, H. U., and Hildebrand, J. A. (2015). Acoustic behavior of melon-headed whales varies on a diel cycle. Behav. Ecol. Sociobiol. 69, 1553–1563. doi: 10.1007/s00265-015-1967-0
Benoit-Bird, K. J., Dahood, A. D., and Würsig, B. (2009). Using active acoustics to compare lunar effects on predator–prey behavior in two marine mammal species. Mar. Ecol. Prog. Ser. 395, 119–135. doi: 10.3354/meps07793
Bertucci, F., Parmentier, E., Lecellier, G., Hawkins, A. D., and Lecchini, D. (2016). Acoustic indices provide information on the status of coral reefs: an example from Moorea Island in the South Pacific. Sci. Rep. 6:33326. doi: 10.1038/srep33326
Bianco, M. J., Gerstoft, P., Traer, J., Ozanich, E., Roch, M. A., Gannot, S., et al. (2019). Machine learning in acoustics: theory and applications. J. Acoust. Soc. Am. 146, 3590–3628. doi: 10.1121/1.5133944
Blomqvist, C., and Amundin, M. (2004). “High frequency burst-pulse sounds in agonistic/aggressive interactions in bottlenose dolphins, Tursiops truncatus,” in Echolocation in Bats and Dolphins, eds J. A. Thomas, C. Moss, and M. Vater (Chicago, IL: University of Chicago Press), 425–430.
Buscaino, G., Ceraulo, M., Pieretti, N., Corrias, V., Farina, A., Filiciotto, F., et al. (2016). Temporal patterns in the soundscape of the shallow waters of a Mediterranean marine protected area. Sci. Rep. 6:34230. doi: 10.1038/srep34230
Cagnazzi, D. D. B., Harrison, P. L., Ross, G. J. B., and Lynch, P. (2011). Abundance and site fidelity of Indo-Pacific Humpback dolphins in the Great Sandy Strait, Queensland, Australia. Mar. Mamm. Sci. 27, 255–281. doi: 10.1111/j.1748-7692.2009.00296.x
Caruso, F., Alonge, G., Bellia, G., De Domenico, E., Grammauta, R., Larosa, G., et al. (2017). Long-term monitoring of dolphin biosonar activity in deep pelagic waters of the Mediterranean Sea. Sci. Rep. 7:4321. doi: 10.1038/s41598-017-04608-6
Caruso, F., Lizarralde, D., Elsenbeck, J., Collins, J., Zimmer, W. M. X., and Sayigh, L. (2016). Detection and tracking of fin whales during seismic exploration in the Gulf of California. Proc. Mtgs. Acoust. 27:070021. doi: 10.1121/2.0000424
Cato, D. H., and McCauley, R. D. (2001). Ocean ambient noise from anthropogenic and natural sources in the context of marine mammal acoustics. J. Acoust. Soc. Am. 110:2751. doi: 10.1121/1.4777575
Ceraulo, M., Papale, E., Caruso, F., Filiciotto, F., Grammauta, R., Parisi, I., et al. (2018). Acoustic comparison of a patchy Mediterranean shallow water seascape: Posidonia oceanica meadow and sandy bottom habitats. Ecol. Indic. 85, 1030–1043. doi: 10.1016/j.ecolind.2017.08.066
Chen, B. Y., Zheng, D. M., Yang, G., Xu, X. R., and Zhou, K. Y. (2009). Distribution and conservation of the Indo-Pacific humpback dolphin in China. Integr. Zool. 4, 239–246. doi: 10.1111/j.1749-4877.2009.00160.x
DeRuiter, S. L., Hansen, M., Koopman, H. N., Westgate, A. J., Tyack, P. L., and Madsen, P. T. (2010). Propagation of narrow-band-high-frequency clicks: measured and modeled transmission loss of porpoise-like clicks in porpoise habitats. J. Acoust. Soc. Am. 127, 560–567. doi: 10.1121/1.3257203
DesJardins, M., and Gordon, D. F. (1995). Evaluation and selection of biases in machine learning. Mach. Learn. J. 5, 1–17.
Dinh, J. P., Suca, J. J., Lillis, A., Apprill, A., Llopiz, J. K., and Mooney, T. A. (2018). Multiscale spatio-temporal patterns of boat noise on U.S. Virgin Island coral reefs. Mar. Pollut. Bull. 136, 282–290. doi: 10.1016/j.marpolbul.2018.09.009
Dong, L., Liu, M., Dong, J., and Li, S. (2017). Acoustic occurrence detection of a newly recorded Indo-Pacific humpback dolphin population in waters southwest of Hainan Island, China. J. Acoust. Soc. Am. 142, 3198–3204. doi: 10.1121/1.5011170
Fang, L., Li, S., Wang, K., Wang, Z., Shi, W., and Wang, D. (2015). Echolocation signals of free-ranging Indo-Pacific humpback dolphins (Sousa chinensis) in Sanniang Bay, China. J. Acoust. Soc. Am. 138, 1346–1352. doi: 10.1121/1.4929492
Fawcett, T. (2006). An Introduction to ROC Analysis. Pattern Recognit. Lett. 27, 861–874. doi: 10.1016/j.patrec.2005.10.010
Finneran, J. J. (2013). Dolphin ‘packet’ use during long-range echolocation tasks. J. Acoust. Soc. Am. 133, 1796–1810. doi: 10.1121/1.4788997
Fournet, M. E. H., Matthews, L. P., Gabriele, C. M., Haver, S., Mellinger, D. K., and Klinck, H. (2018). Humpback whales Megaptera novaeangliae alter calling behavior in response to natural sounds and vessel noise. Mar. Ecol. Prog. Ser. 607, 251–268. doi: 10.3354/meps12784
Francois, R. E., and Garrison, G. R. (1982a). Sound absorption based on ocean measurements. Part I: pure water and magnesium sulfate contributions. J. Acoustic. Soc. Am. 72, 896–907. doi: 10.1121/1.388170
Francois, R. E., and Garrison, G. R. (1982b). Sound absorption based on ocean measurements. Part II: boric acid contribution and equation for total absorption. J. Acoustic. Soc. Am. 72, 1879–1890. doi: 10.1121/1.388673
Frasier, K. E., Roch, M. A., Soldevilla, M. S., Wiggins, S. M., Garrison, L. P., and Hildebrand, J. A. (2017). Automated classification of dolphin echolocation click types from the Gulf of Mexico. PLoS Comput. Biol. 13:e1005823. doi: 10.1371/journal.pcbi.1005823
Freeman, L., and Freeman, S. (2016). Rapidly obtained ecosystem indicators from coral reef soundscapes. Mar. Ecol. Prog. Ser. 561, 69–82. doi: 10.3354/meps11938
Freeman, S. E., Freeman, L. A., Giorli, G., and Haas, A. F. (2018). Photosynthesis by marine algae produces sound, contributing to the daytime soundscape on coral reefs. PLoS One 13:e0201766. doi: 10.1371/journal.pone.0201766
Gabriele, C. M., Ponirakis, D. W., Clark, C. W., Womble, J. N., and Vanselow, P. B. S. (2018). Underwater acoustic ecology metrics in an Alaska marine protected area reveal marine mammal communication masking and management alternatives. Front. Mar. Sci. 5:270. doi: 10.3389/fmars.2018.00270
Giorli, G., and Au, W. W. L. (2017). Spatio-temporal variation and seasonality of Odontocetes’ foraging activity in the leeward side of the island of Hawaii. Deep Sea Res. Part I Oceanogr. Res. Pap. 121, 202–209. doi: 10.1016/j.dsr.2017.01.013
Giorli, G., Au, W. W. L., and Neuheimera, A. (2016). Differences in foraging activity of deep sea diving odontocetes in the Ligurian Sea as determined by passive acoustic recorders. Deep Sea Res. Part I Oceanogr. Res. Pap. 107, 1–8. doi: 10.1016/j.dsr.2015.10.002
Giorli, G., and Goetz, K. T. (2019). Foraging activity of sperm whales (Physeter macrocephalus) off the east coast of New Zealand. Sci. Rep. 9, 1–9.
Gong, Z., Dong, L., Caruso, F., Lin, M., Liu, M., Dong, J., et al. (2019). Echolocation signals of free-ranging pantropical spotted dolphins (Stenella attenuata) in the South China Sea. J. Acoust. Soc. Am. 145, 3480–3487. doi: 10.1121/1.5111742
Gordon, T. A., Harding, H. R., Wong, K. E., Merchant, N. D., Meekan, M. G., McCormick, M. I., et al. (2018). Habitat degradation negatively affects auditory settlement behavior of coral reef fishes. Proc. Natl. Acad. Sci. U.S.A. 115, 5193–5198. doi: 10.1073/pnas.1719291115
Guazzo, R. A., Helble, T. A., D’Spain, G. L., Weller, D. W., Wiggins, S. M., and Hildebrand, J. A. (2017). Migratory behavior of eastern North Pacific gray whales tracked using a hydrophone array. PLoS One 12:e0185585. doi: 10.1371/journal.pone.0185585
Hawkins, A. D. (1986). “Underwater sound and fish behaviour,” in The Behaviour of Telost Fishes, ed. T. J. Pitcher (Sydney: Springer-Verlag), 114–151. doi: 10.1007/978-1-4684-8261-4_5
He, Q., Bertness, M. D., Bruno, J. F., Li, B., Chen, G., Coverdale, T. C., et al. (2014). Economic development and coastal ecosystem change in China. Sci. Rep. 4:5995.
Hildebrand, J. A., Frasier, K. E., Baumann-Pickering, S., Wiggins, S. M., Merkens, K. P., Garrison, L. P., et al. (2019). Assessing seasonality and density from passive acoustic monitoring of signals presumed to be from pygmy and dwarf sperm whales in the gulf of Mexico. Front. Mar. Sci. 6:66. doi: 10.3389/fmars.2019.00066
Ingram, S. N., and Rogan, E. (2002). Identifying critical areas and habitat preferences of bottlenose dolphins Tursiops truncatus. Mar. Ecol. Prog. Ser. 244, 247–255. doi: 10.3354/meps244247
Jefferson, T. A., and Hung, S. K. (2004). A review of the status of the Indo-Pacific humpback dolphin (Sousa chinensis) in Chinese waters. Aquat. Mamm. 30, 149–158. doi: 10.1016/bs.amb.2015.07.003
Jefferson, T. A., and Rosenbaum, H. C. (2014). Taxonomic revision of the humpback dolphins (Sousa spp.), and description of a new species from Australia. Mar. Mamm. Sci. 30, 1494–1541. doi: 10.1111/mms.12152
Jefferson, T. A., Smith, B. D., Braulik, G. T., and Perrin, W. (2017). Sousa chinensis (Errata Version Published in 2018). The IUCN Red List of Threatened Species 2017: e. T82031425A123794774. Available online at: http://dx.doi.org/10.2305/IUCN.UK.2017- 3.RLTS.T82031425A50372332. en (accessed October 11, 2018).
Jensen, F. H., Bejder, L., Wahlberg, M., and Madsen, P. T. (2009). Biosonar adjustments to target range of echolocating bottlenose dolphins (Tursiops sp.) in the wild. J. Exp. Biol. 212, 1078–1086. doi: 10.1242/jeb.025619
Kaiser, J. F. (1990). “On a simple algorithm to calculate the “Energy” of a Signal,” in Proceedings of IEEE Conference on Acoustics, Speech, and Signal Processing, Albuquerque, NM, 381–384.
Karczmarski, L., and Cockcroft, V. G. (1998). Matrix photo-identification technique applied in studies of free-ranging bottlenose and humpback dolphins. Aquat. Mamm. 24, 143–147.
Keith, M., Peddemors, V., Bester, M. N., and Ferguson, J. W. H. (2002). Population characteristics of Indo-Pacific humpback dolphins at Richards Bay, South Africa: implications for incidental capture in shark nets. Afr. J. Wildl. Res. 32, 153–162.
Klinck, H., and Mellinger, D. K. (2011). The energy ratio mapping algorithm: a tool to improve the energy-based detection of odontocete echolocation clicks. J. Acoust. Soc. Am. 129, 1807–1812. doi: 10.1121/1.3531924
Klinck, H., Mellinger, D. K., Klinck, K., Bogue, N. M., Luby, J. C., Jump, W. A., et al. (2012). Near-real-time acoustic monitoring of beaked whales and other cetaceans using a SeagliderTM. PLoS One 7:e36128. doi: 10.1371/journal.pone.0036128
Lammers, M. O., Au, W. W. L., Aubauer, R., and Nachtigal, P. (2006). “A comparative analysis of the pulsed emissions of free-ranging hawaïan spinner dolphins,” in Echolocation in Bats and Dolphins, eds J. Thomas, C. Moss, and M. Vater (Chicago, IL: University of Chicago Press), 414–419.
Lammers, M. O., Au, W. W. L., and Herzing, D. L. (2003). The broadband social acoustic signaling behavior of spinner and spotted dolphins. J. Acoust. Soc. Am. 114, 1629–1639. doi: 10.1121/1.1596173
Lammers, M. O., Howe, M., Zang, E., McElligott, M., Engelhaupt, A., and Munger, L. (2017). Acoustic monitoring of coastal dolphins and their response to naval mine neutralization exercises. R. Soc. Open Sci. 4:170558. doi: 10.1098/rsos.170558
Leroy, E. C., Royer, J.-Y., Bonnel, J., and Samaran, F. (2018). Long-term and seasonal changes of large whale call frequency in the southern Indian Ocean. J. Geophys. Res. Oceans 123, 8568–8580. doi: 10.1029/2018JC014352
Li, S., Akamatsu, T., Dong, L., Wang, K., Wang, D., and Kimura, S. (2010). Widespread passive acoustic detection of Yangtze finless porpoise using miniature stereo acoustic data-loggers: a review. J. Acoust. Soc. Am. 128, 1476–1482. doi: 10.1121/1.3455829
Li, S., Lin, M., Xu, X., Xing, L., Zhang, P., Gozlan, R. E., et al. (2016). First record of the Indo-Pacific humpback dolphins (Sousa chinensis) southwest of Hainan Island, China. Mar. Biodivers. Rec. 9:3.
Li, S., Wu, H., Xu, Y., Peng, C., Fang, L., Lin, M., et al. (2015). Mid- to high-frequency noise from high-speed boats and its potential impacts on humpback dolphins. J. Acoust. Soc. Am. 138, 942–952. doi: 10.1121/1.4927416
Li, S. H., Wang, D., Wang, K. X., Hoffmann-Kuhnt, M., Fernando, N., Taylor, E. A., et al. (2013). Possible age-related hearing loss (presbycusis) and corresponding change in echolocation parameters in a stranded Indo-Pacific humpback dolphin. J. Exp. Biol. 216, 4144–4153. doi: 10.1242/jeb.091504
Lillis, A., Caruso, F., Mooney, T. A., Llopiz, J., Bohnenstiehl, D., and Eggleston, D. B. (2018). Drifting hydrophones as an ecologically meaningful approach to underwater soundscape measurement in coastal benthic habitats. J. Ecoacoust. 2:#STBDH1. doi: 10.22261/JEA.STBDH1
Lin, M., Xing, L., Fang, L., Huang, S.-L., Yao, C.-J., Turvey, S. T., et al. (2019). Can local ecological knowledge provide meaningful information on coastal cetacean diversity? A case study from the northern South China Sea. Ocean Coast. Manage. 172, 117–127. doi: 10.1016/j.ocecoaman.2019.02.004
Liu, M., Dong, L., Lin, M., and Li, S. (2017). Broadband ship noise and its potential impacts on Indo-Pacific humpback dolphins: implications for conservation and management. J. Acoust. Soc. Am. 142, 2766–2775. doi: 10.1121/1.5009444
Madsen, P. T., and Wahlberg, M. (2007). Recording and quantification of ultrasonic echolocation clicks from free-ranging toothed whales. Deep Sea Res. I 54, 1421–1444. doi: 10.1016/j.dsr.2007.04.020
Marley, S. A., Erbe, C., Salgado Kent, C. P., Parsons, M. J. G., and Parnum, I. M. (2017). Spatial and temporal variation in the acoustic habitat of bottlenose dolphins (Tursiops aduncus) within a Highly Urbanized Estuary. Front. Mar. Sci. 4:197. doi: 10.3389/fmars.2017.00197
Mellinger, D. K., Stafford, K. M., Moore, S. E., Dziak, R. P., and Matsumoto, H. (2007). An overview of fixed passive acoustic observation methods for cetaceans. Oceanography 20, 36–45. doi: 10.5670/oceanog.2007.03
Moehl, B., Wahlberg, M., Madsen, P. T., and Heerfordt Lund, A. (2003). The monopulsed nature of sperm whale clicks. J. Acoust. Soc. Am. 114, 1143–1154. doi: 10.1121/1.1586258
Monczak, A., Mueller, C., Miller, M. E., Ji, Y., Borgianini, S. A., and Montie, E. W. (2019). Sound patterns of snapping shrimp, fish, and dolphins in an estuarine soundscape of the southeastern USA. Mar. Ecol. Prog. Ser. 609, 49–68. doi: 10.3354/meps12813
Munger, L., Lammers, M. O., Cifuentes, M., Würsig, B., Jefferson, T. A., and Hung, S. K. (2016). Indo-Pacific humpback dolphin occurrence north of Lantau Island, Hong Kong, based on year-round passive acoustic monitoring. J. Acoust. Soc. Am. 140, 2754–2765. doi: 10.1121/1.4963874
Parra, G. J., and Ross, G. J. B. (2009). “Humpback Dolphins S. chinensis and S. teuszii,” in Encyclopedia of Marine Mammals, eds W. F. Perrin, B. Würsig, and J. G. M. Thewissen (San Diego, CA: Elsevier Academic Press), 576–582.
Perrin, W. F., Würsig, B. G., and Thewissen, J. G. M. (2009). Encyclopedia of Marine Mammals. San Diego, CA: Elsevier Academic Press.
Pine, M. K., Wang, K., and Wang, D. (2017a). Fine-scale habitat use in Indo-Pacific humpback dolphins, Sousa chinensis, may be more influenced by fish rather than vessels in the Pearl River Estuary, China. Mar. Mamm. Sci. 33, 291–312. doi: 10.1111/mms.12366
Pine, M. K., Wang, D., Porter, L., and Wang, K. (2017b). Investigating the spatiotemporal variation of fish choruses to help identify important foraging habitat for Indo-Pacific humpback dolphins, Sousa chinensis. ICES J. Mar. Sci. 75, 510–518. doi: 10.1093/icesjms/fsx197
R Core Team (2019). The R Project for Statistical Computing. Available online at: https://www.R-project.org/ (accessed September 28, 2019).
Radford, C. A., Stanley, J. A., Tindle, C. T., Montgomery, J. C., and Jeffs, A. G. (2010). Localised coastal habitats have distinct underwater sound signatures. Mar. Ecol. Prog. Ser. 401, 21–29. doi: 10.3354/meps08451
Ricci, S. W., Eggleston, D. B., Bohnenstiehl, D. R., and Lillis, A. (2016). Temporal soundscape patterns and processes in an estuarine reserve. Mar. Ecol. Prog. Ser. 550, 25–38. doi: 10.3354/meps11724
Roch, M. A., Klinck, H., Baumann-Pickering, S., Mellinger, D. K., Qui, S., Soldevilla, M. S., et al. (2011). Classification of echolocation clicks from odontocetes in the Southern California Bight. J. Acoust. Soc. Am. 129, 467–475. doi: 10.1121/1.3514383
Roch, M. A., Stinner-Sloan, J., Baumann-Pickering, S., and Wiggins, S. M. (2015). Compensating for the effects of site and equipment variation on species identification of delphinids from their echolocation clicks. J. Acoust. Soc. Am. 173, 22–29. doi: 10.1121/1.4904507
Ross, G. J. B., Heinsohn, G. E., and Cockcroft, V. G. (1994). “Humpack dolphins Sousa chinensis (Osbeck, 1765), Sousa plumbea (G. Cuvier, 1829) and Sousa teuszii (Kukenthal, 1892),” in Handbook of Marine Mammals: The First Book of Dolphins, Vol. 5, eds S. H. Ridgway and R. Harrison (London: Academic Press), 23–42.
Sayigh, L. S., Tyack, P. L., Wells, R. S., Solow, A. R., Scott, M. D., and Irvine, A. B. (1999). Individual recognition in wild bottlenose dolphins: a field test using playback experiments. Anim. Behav. 57, 41–50. doi: 10.1006/anbe.1998.0961
Shiu, Y., Palmer, K. J., Roch, M. A., Fleishman, E., Liu, X., Nosal, E. M., et al. (2020). Deep neural networks for automated detection of marine mammal species. Sci. Rep. 10:607. doi: 10.1038/s41598-020-57549-y
Sims, P. Q., Vaughn, R., Hung, S. K., and Würsig, B. (2012). Sounds of Indo-Pacific humpback dolphins (Sousa chinensis) in West Hong Kong: a preliminary description. J. Acoust. Soc. Am. 131, EL48–EL53. doi: 10.1121/1.3663281
Soldevilla, M. S., Henderson, E. E., Campbell, G. S., Wiggins, S. M., Hildebrand, J. A., and Roch, M. A. (2008). Classification of Risso’s and Pacific white-sided dolphins using spectral properties of echolocation clicks. J. Acoust. Soc. Am. 124, 609–624. doi: 10.1121/1.2932059
Soldevilla, M. S., Wiggins, S. M., and Hildebrand, J. A. (2010). Spatial and temporal patterns of Risso’s dolphin echolocation in the Southern California Bight. J. Acoust. Soc. Am. 127, 124–132. doi: 10.1121/1.3257586
Temple, A. J., Tregenza, N., Amir, O. A., Jiddawi, N., and Berggren, P. (2016). Spatial and temporal variations in the occurrence and foraging activity of coastal Dolphins in Menai Bay, Zanzibar, Tanzania. PLoS One 11:e0148995. doi: 10.1371/journal.pone.0148995
Tervo, O. M., Christoffersen, M. F., Simon, M., Miller, L. A., Jensen, F. H., Parks, S. E., et al. (2012). High source levels and small active space of high-pitched song in bowhead whales (Balaena mysticetus). PLoS One 7:e52072. doi: 10.1371/journal.pone.0052072
Tyack, P. L. (2008). Implications for marine mammals of large-scale changes in the marine acoustic environment. J. Mammal. 89, 549–558. doi: 10.1644/07-MAMM-S-307R.1
Tyack, P. L., and Clark, C. W. (2000). “Communication and acoustic behavior of dolphins and whales,” in Hearing by Whales and Dolphins, eds W. W. L. Au, R. R. Fay, and A. N. Popper (New York, NY: Springer), 156–224. doi: 10.1007/978-1-4612-1150-1_4
Van Parijs, S. M., and Corkeron, P. J. (2001). Vocalizations and behaviour of Pacific humpback dolphins Sousa chinensis. Ethology 107, 701–716. doi: 10.1121/1.3663281
Villadsgaard, A., Wahlberg, M., and Tougaard, J. (2007). Echolocation signals of wild harbour porpoises, Phocoena phocoena. J. Exp. Biol. 210, 56–64. doi: 10.1242/jeb.02618
Wang, D., Garcia, H., Huang, W., Tran, D. D., Jain, A. D., Yi, D. H., et al. (2016). Vast assembly of vocal marine mammals from diverse species on fish spawning ground. Nature 531, 366–370. doi: 10.1038/nature16960
Wang, Z.-T., Akamatsu, T., Nowacek, D. P., Yuan, J., Zhou, L., Lei, P.-Y., et al. (2019). Soundscape of an Indo-Pacific humpback dolphin (Sousa chinensis) hotspot before windfarm construction in the Pearl River Estuary, China: Do dolphin engage in noise avoidance and passive eavesdropping behavior? Mar. Pollut. Bull. 140, 509–522. doi: 10.1016/j.marpolbul.2019.02.013
Wang, Z.-T., Fang, L., Shi, W.-J., Wang, K.-X., and Wang, D. (2013). Whistle characteristics of free-ranging Indo-Pacific humpback dolphins (Sousa chinensis) in Sanniang Bay, China. J. Acoust. Soc. Am. 133, 2479–2489. doi: 10.1121/1.4794390
Wang, Z.-T., Nachtigall, P. E., Akamatsu, T., Wang, K. X., Wu, Y. P., Liu, J. C., et al. (2015). Passive acoustic monitoring the diel, lunar, seasonal and tidal patterns in the biosonar activity of the Indo-Pacific humpback dolphins (Sousa chinensis) in the Pearl River Estuary, China. PLoS One 10:e0141807. doi: 10.1371/journal.pone.0141807
Wang, Z.-T., Wu, Y., Duan, G., Cao, H., Liu, J., Wang, K., et al. (2014). Assessing the underwater acoustics of the World’s largest vibration hammer (OCTA-KONG) and its potential effects on the Indo-Pacific humpbacked Dolphin (Sousa chinensis). PLoS One 9:e110590. doi: 10.1371/journal.pone.0110590
Wilcock, W. S. D. (2012). Tracking fin whales in the Northeast Pacific Ocean with a seafloor seismic network. J. Acoust. Soc. Am. 132, 2408–2419. doi: 10.1121/1.4747017
Wood, S. (2017). Generalized Additive Models. New York, NY: Chapman and Hall. doi: 10.1201/9781315370279
Wood, S. (2019). mgcv: Mixed GAM Computation Vehicle With Automatic Smoothness Estimation (Version 1.8-31). Available online at: https://CRAN.R-project.org/package=mgcv (accessed September 28, 2019).
Wu, H., Jefferson, T. A., Peng, C., Liao, Y., Huang, H., Lin, M., et al. (2017). Distribution and Habitat Characteristics of the Indo-Pacific Humpback Dolphin (Sousa chinensis) in the Northern Beibu Gulf, China. Aquat. Mamm. 43, 219–228. doi: 10.1578/AM.43.2.2017.219
Würsig, B., Parsons, E. C. M., Piwetz, S., and Porter, L. (2016). The behavioural ecology of Indo-Pacific Humpback Dolphins in Hong Kong. Adv. Mar. Biol. 73, 65–90. doi: 10.1016/bs.amb.2015.08.008
Xu, X., Song, J., Zhang, Z., Li, P., Yang, G., and Zhou, K. (2015). The world’s second largest population of humpback dolphins in the waters of Zhanjiang deserves the highest conservation priority. Sci. Rep. 5:8147. doi: 10.1038/srep08147
Zein, B., Woelfing, B., Dähne, M., Schaffeld, T., Ludwig, S., Rye, J. H., et al. (2019). Time and tide: seasonal, diel and tidal rhythms in Wadden Sea Harbour porpoises (Phocoena phocoena). PLoS One 14:e0213348. doi: 10.1371/journal.pone.0213348
Keywords: passive acoustic monitoring, Indo-Pacific humpback dolphin, spatiotemporal patterns, distribution, acoustic behavior, coastal waters
Citation: Caruso F, Dong L, Lin M, Liu M, Gong Z, Xu W, Alonge G and Li S (2020) Monitoring of a Nearshore Small Dolphin Species Using Passive Acoustic Platforms and Supervised Machine Learning Techniques. Front. Mar. Sci. 7:267. doi: 10.3389/fmars.2020.00267
Received: 03 July 2019; Accepted: 03 April 2020;
Published: 28 April 2020.
Edited by:
Jeremy Kiszka, Florida International University, United StatesReviewed by:
Adrian C. Gleiss, Murdoch University, AustraliaGail Schofield, Queen Mary University of London, United Kingdom
Copyright © 2020 Caruso, Dong, Lin, Liu, Gong, Xu, Alonge and Li. This is an open-access article distributed under the terms of the Creative Commons Attribution License (CC BY). The use, distribution or reproduction in other forums is permitted, provided the original author(s) and the copyright owner(s) are credited and that the original publication in this journal is cited, in accordance with accepted academic practice. No use, distribution or reproduction is permitted which does not comply with these terms.
*Correspondence: Songhai Li, lish@idsse.ac.cn