
94% of researchers rate our articles as excellent or good
Learn more about the work of our research integrity team to safeguard the quality of each article we publish.
Find out more
ORIGINAL RESEARCH article
Front. Mar. Sci. , 22 April 2020
Sec. Marine Biogeochemistry
Volume 7 - 2020 | https://doi.org/10.3389/fmars.2020.00248
This article is part of the Research Topic Effects of Extreme Weather Events on Coastal Carbon and Nutrient Cycling View all 11 articles
Extreme weather events such as tropical storms and hurricanes deliver large amounts of freshwater (stormwater and river discharge) and associated dissolved organic carbon (DOC) to estuaries and the coastal ocean, affecting water quality, and carbon budgets. Hurricane Harvey produced an unprecedented 1000-year flood event in 2017 that inundated the heavily urbanized and industrialized Houston/Galveston region (TX, United States). Within a week, storm-associated floodwater delivered 87 ± 18 Gg of terrigenous dissolved organic carbon (tDOC) to Galveston Bay and the Gulf of Mexico continental shelves. In situ decay constants of 8.75–28.33 year−1 resulted in the biomineralization of ∼70% of tDOC within 1 month of discharge from the flood plain. The high removal efficiency of tDOC was linked to a diverse microbial community capable of degrading a wide repertoire of dissolved organic matter (DOM), and suggested hurricane-induced flood events affect net CO2 exchange and nutrient budgets in estuarine watersheds and coastal seas.
Coastal zones connect land and ocean ecosystems and play an important role in the global carbon cycle (Bauer et al., 2013; Regnier et al., 2013). Shelf and shallow water regions together with tidal wetlands are responsible for ∼1/3 of the ocean’s entire carbon burial (Duarte et al., 2005). Coastal zones are also prodigious CO2 outgassing regions (0.1–0.4 Pg year−1), as rivers deliver vast stores of terrigenous organic matter to estuaries and the ocean that are efficiently mineralized (Bianchi et al., 2013; Najjar et al., 2018). Further, sun-lit shallow surface waters contribute 10–30% of ocean primary production, and feed productive biological habitats and fisheries (Najjar et al., 2018).
At the same time, these ecologically sensitive ecosystems have undergone profound changes experiencing heavy urbanization and industrialization over the last century (McGrane et al., 2016; Freeman et al., 2019). By 2100, more than 50% of the world’s population will live within proximity of the coast accelerating pressure on biogeochemical processes, water quality, and ecosystem services (Neumann et al., 2015). These future changes and emerging issues in urban coastal systems are amplified by sea-level rise and enhanced storm activity. In some regions, including the Gulf of Mexico, subsidence and erosion will exacerbate the negative consequences along coast zones.
Extreme weather events, such as tropical storms and hurricanes, induce extensive precipitation, and massive flooding. Flood waters mobilize large amounts of organic carbon stored in coastal watersheds affecting biogeochemical pathways and carbon storage (Bauer et al., 2013; Bianchi et al., 2013; Hounshell et al., 2019). Previous studies suggested that extreme weather events can account for an important fraction (20–50%) of the annual riverine dissolved organic carbon (DOC) flux in coastal regions (Avery et al., 2004; Yoon and Raymond, 2012; Bianchi et al., 2013; Osburn et al., 2019; Paerl et al., 2019). The substantial input of terrigenous organic matter is known to change DOC composition and bioreactivity in coastal waters (Osburn et al., 2012; Bianchi et al., 2013). Furthermore, Balmonte et al. (2016) and Steichen et al. (2020) have demonstrated that post-hurricane hydrological and geochemical perturbations reshape the bacterial community structure in coastal rivers with the potential to disrupt biological networks.
During flood conditions, estuaries act mainly as flow-through systems for precipitation, and stormwater to the ocean (Bauer et al., 2013; Hounshell et al., 2019). Following extreme weather events, mobilized terrigenous DOC (tDOC) is mineralized by microbial and photochemical processes resulting in outgassing of CO2 (Bianchi et al., 2013; Osburn et al., 2019). Mineralization of tDOC can explain most of the CO2 flux in temperate and high-latitude estuarine and coastal ecosystems (Crosswell et al., 2014; Kaiser et al., 2017a; Hounshell et al., 2019; Osburn et al., 2019). Extreme weather events shift the carbon balance in coastal ecosystems from net uptake to a net source of CO2 to the atmosphere for a period up to several months (Crosswell et al., 2014; Osburn et al., 2019; Paerl et al., 2019).
The frequency and intensity of extreme weather events are predicted to increase in future climate scenarios (Bender et al., 2010; Lehmann et al., 2015; Emanuel, 2017), yet critical knowledge on coastal carbon biogeochemical cycling is still limited (Paerl et al., 2019). Hurricane Harvey struck the southwest coast of Texas as a Category 4 storm on 26 August, 2017. After stalling for 2 day over South Texas, the hurricane returned to the Gulf of Mexico and made a second landfall just east of Houston on 30 August. Over a five-day period, the hurricane produced unprecedented precipitation (>500 mm with return period exceeding 2000 year) within the Houston-Galveston watershed, and entered the annals of history as the wettest and the second most expensive hurricane in the history of the United States. This study examines dissolved organic matter (DOM) fluxes and carbon budgets in Galveston Bay (TX, United States) after Hurricane Harvey over a four-week period through chemical analysis of common biochemicals (lignin, enantiomeric amino acids). In addition, the mineralization of tDOC is explored relative to the microbial community structure. Results from this study revealed fundamental mechanisms that drive organic carbon processing during extreme storm events in coastal ecosystems.
Galveston Bay sits on the northeastern Texas Coast of the Gulf of Mexico, and is the seventh largest estuary in the continental United States. The bay surface area is 1.6 × 10⁹ m2, and the average depth is 2.1 m (Figure 1). Water exchange between the bay and Gulf of Mexico is limited by narrow outlets, and the average water residence time is 30–60 day (Rayson et al., 2016). Bolivar Roads is the main outlet of Galveston Bay, accounting for around 80% of the outflow (Galveston Bay National Estuary Program, 1994). The dredged Houston Ship Channel runs north from Bolivar Roads through the bay to the man-made Port of Houston at an average depth of 40 feet and 300–400 feet in width.
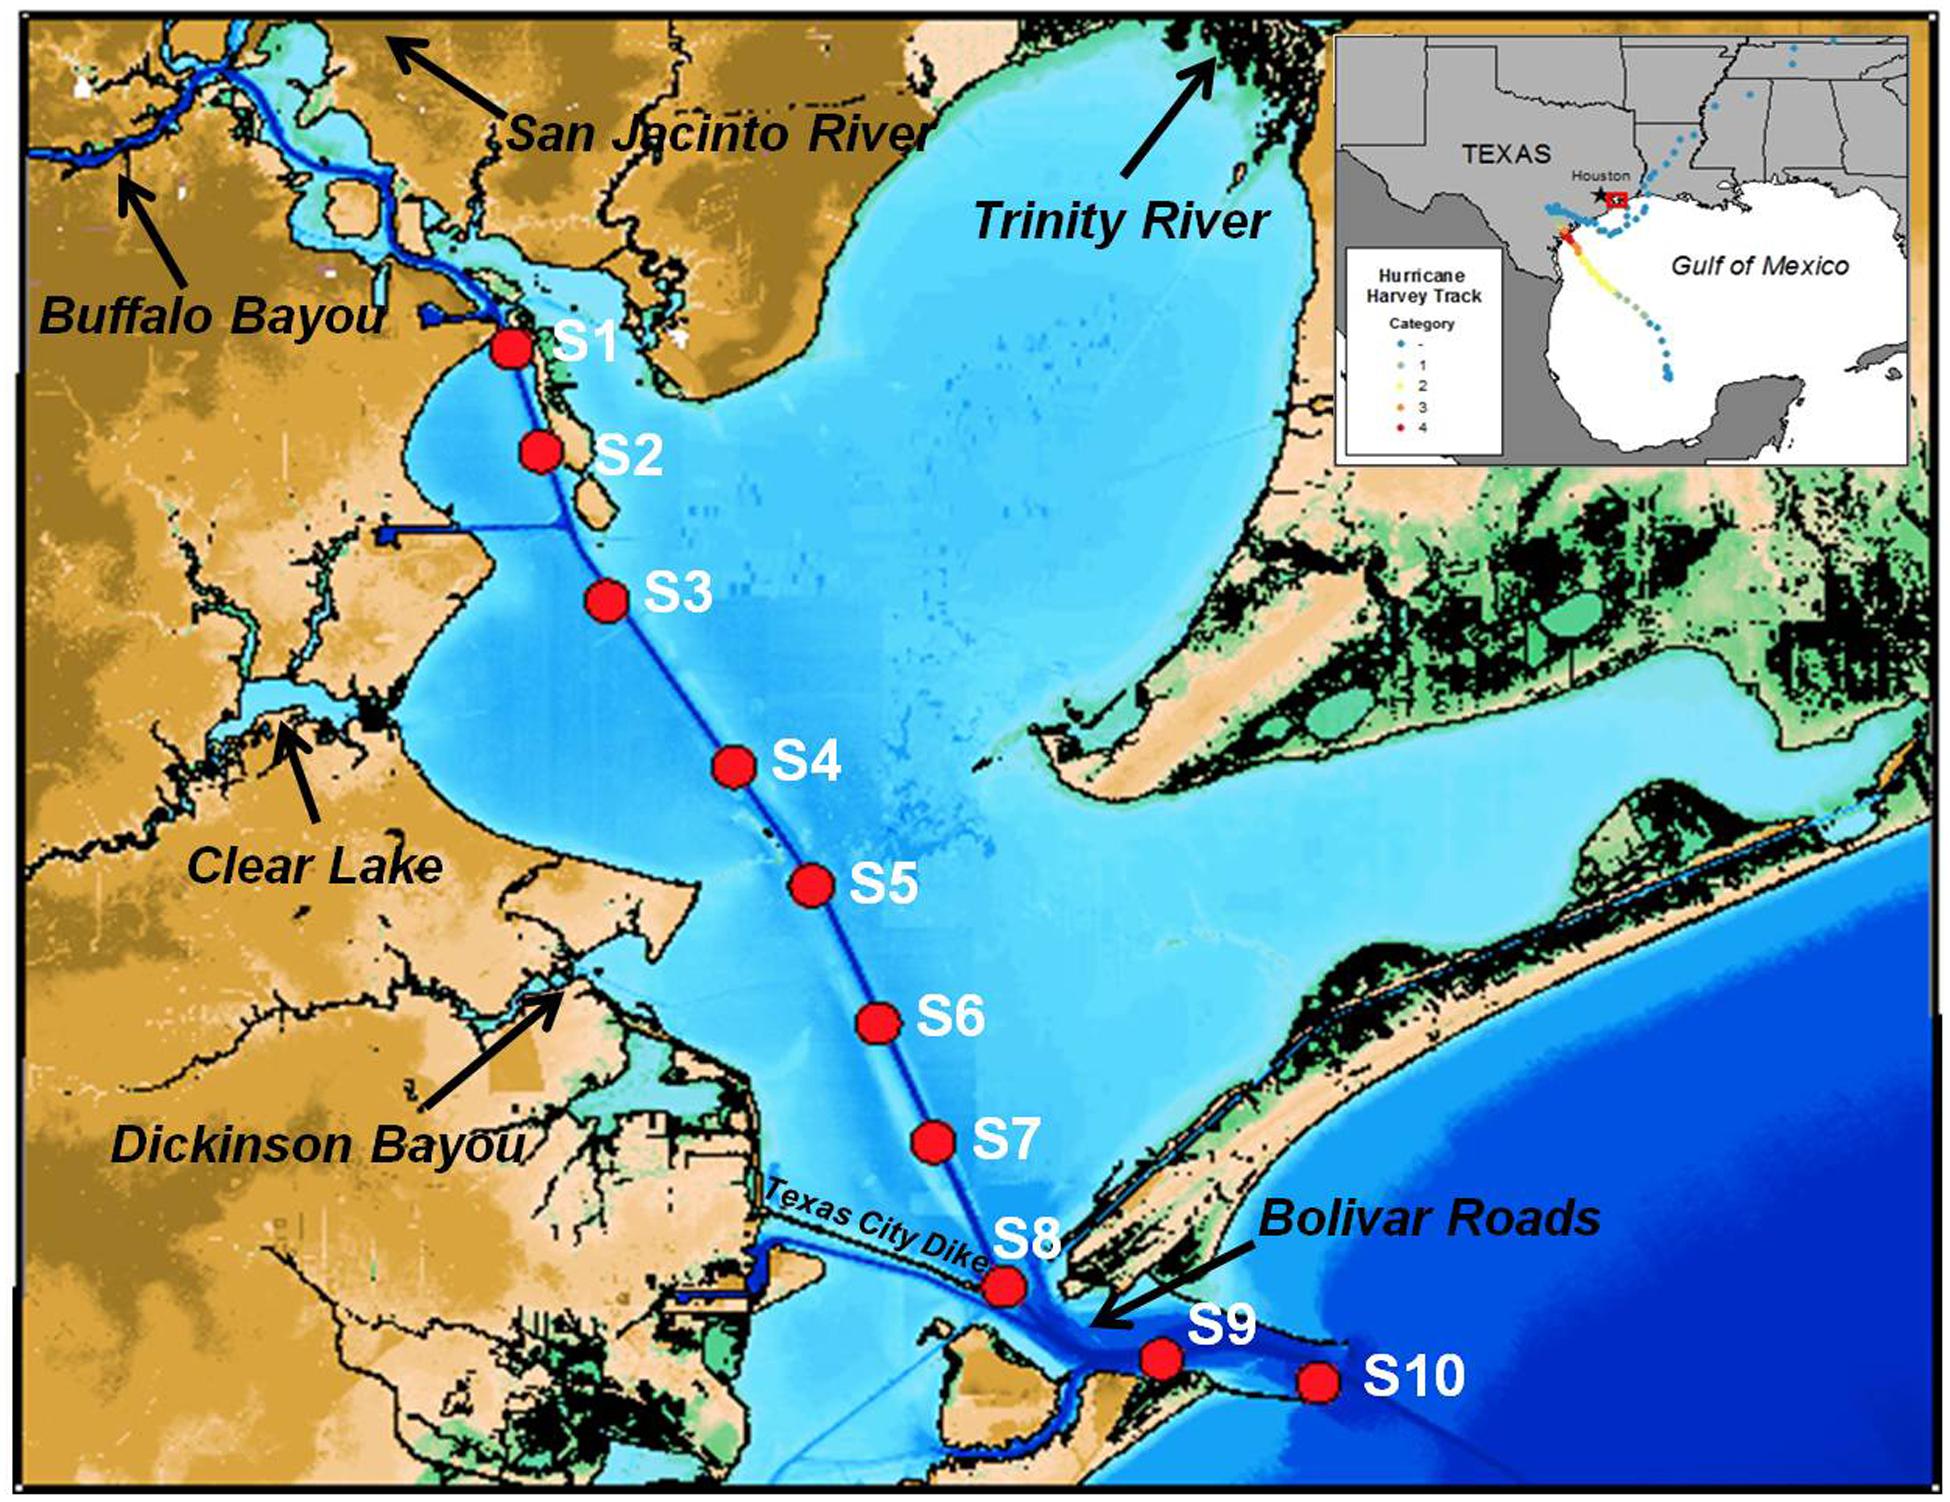
Figure 1. Map of Galveston Bay showing locations of sampling stations (red dots). The inset shows the track of Hurricane Harvey.
Fresh water inflows to the bay are dominated by the Trinity River, the San Jacinto River, and Buffalo Bayou. The Trinity River and San Jacinto River host natural ecosystems and heavily urbanized areas, and water flow is controlled by a series of lakes and reservoirs. Buffalo Bayou bisects the Houston metropolitan area and joins the San Jacinto River at the mouth of the bay. Water flow through the main stream channel of Buffalo Bayou is regulated through large man-made flow control structures west of Houston. The confluence of Buffalo Bayou and San Jacinto River forms the entrance to the Port of Houston with numerous industrial and petrochemical facilities in low-lying, flood-prone areas.
Surface water samples were collected on five consecutive one-day trips aboard R/V Trident along a transect from the Port of Houston to the Galveston Bay entrance following Hurricane Harvey from Sep 4 to Sep 28, 2017 (Figure 1). Samples were filtered on board through 0.2 μm Whatman -Nucleopore Q-TEC filters (Filtration Solutions) for DOC, optical, and chemical analysis.
Concentrations of DOC were measured by high temperature catalytic oxidation using a Shimadzu TOC-V total organic carbon analyzer. Deep seawater reference standards (Consensus Reference Program, University of Miami) were used to assure the accuracy of DOC measurements. Absorbance was measured in a 1 cm quartz cuvette from 200 to 800 nm using a dual-beam spectrophotometer (UV-1800, Shimadzu) with Milli-Q water as the reference blank. Specific UV absorbance (SUVA254) was determined by dividing the UV absorbance at 254 nm by the DOC concentration. The spectral slope (S275–295) was calculated using the linear regression of natural log-transformed absorption spectra (Helms et al., 2008).
Samples for dissolved lignin (900 mL) were acidified to pH 2.5 using 6 mol L−1 sulfuric acid and extracted through Agilent PPL cartridges (1 g) at 10 mL min−1. After extraction cartridges were rinsed with 10 mL of deionized water acidified to pH 2.5 and dried for 30 s to remove residual water. The cartridges were eluted with 20 mL of methanol at 2 mL min−1, and the eluate was stored in glass vials at -20°C until analysis. Concentrations of lignin phenols were determined using ultra-high performance liquid chromatography-electrospray ionization-tandem mass spectrometry after CuSO4 oxidation following the methods described in Yan and Kaiser (2018a, b). Aliquots of methanol extracts (∼30 μg sample OC content) were dried in reaction vials and re-suspended in 200 μL of 1.1 mol L−1 argon-sparged NaOH, followed by addition of 10 μL of 10 mmol L−1 CuSO4 and 10 μL of 0.2 mol L−1 ascorbic acid. Reaction vials were vigorously mixed and placed into 60-mL pressure-tight teflon vessels filled with 5 mL of 1 mol L−1 NaOH. The oxidation was conducted at 150°C a for 120 min. Sample solutions were spiked with 13C labeled surrogate standards and purified with Waters HLB cartridges (30 mg, 1 mL). Separation and detection of lignin phenols was performed on an Agilent Infinity 1260 series UHPLC system coupled to an Agilent 6420 QqQ detector operating in alternating positive and negative modes with dynamic multiple reaction monitoring. Eleven lignin phenols were determined in all samples, including vanillyl phenols (V; vanillin, acetovanillone, and vanillic acid), syringyl phenols (S; syringaldehyde, acetosyringone, and syringic acid), p-hydroxyl phenols (P; p-hydroxybenzaldehyde, p-hydroxyacetophenone, and p-hydroxybenzoic acid), and cinnamyl phenols (C; p-coumaric acid and ferulic acid). The sum of nine V, S and P phenols (TDLP9) was used as a tracer of tDOC and was not affected by any nonlignin sources (Fichot and Benner, 2012). Cinnamyl phenols were only used for source identification because of significant different reactivities to TDLP9 (Hernes et al., 2007).
Total hydrolyzable enantiomeric dissolved amino acids (free and combined) including L-and D- forms of aspartic acid, glutamic acid, serine, histidine, threonine, glycine, arginine, alanine, tyrosine, valine, isoleucine, phenylalanine, leucine, and lysine were analyzed using high performance liquid chromatography and fluorescence detection. After microwave assisted vapor phase hydrolysis (Kaiser and Benner, 2005), amino acid monomers were derivatized with a mixture of N-isobutyryl-L-cysteine and o-phthaldialdehyde and separated on an Agilent Poroshell 120 EC-C18 column (4.6 mm × 100 mm, 2.7 μm). A binary solvent system was employed: mobile phase A was 48 mmol L−1 KH2PO4 with pH adjusted to 6.25, and mobile phase B was methanol/acetonitrile (13/1, v/v). The linear gradient program was: 0% B at 0 min, 39% B at 13.3 min, 54% B at 19.2 min, 60% B at 21.3 min, 80% B at 22 min, and hold at 80% B for 1 min. The flow rate was 1.5 mL min−1 and column temperature was maintained at 35°C. Excitation and emission wavelength of the detector was set to 330 nm and 450 nm, respectively. Racemization of amino acid enantiomers occurring during acidic hydrolysis was corrected using the average rates determined on free and protein amino acids (Kaiser and Benner, 2005). Total D-amino acids (D-AA) was defined as the sum of the four D-enantiomers of aspartic acid (D-Asx), glutamic acid (D-Glx), serine (D-Ser), and alanine (D-Ala), which were ubiquitously present in all samples.
The amino acid degradation index was calculated based on the relative abundance of amino acids following the method described by Dauwe et al. (1999). All measured amino acids were included in the calculation. Relative abundances of combined D/L forms of amino acids were normalized by subtracting the average and divided by the standard deviation before principle component analysis.
For the 16S ribosomal RNA (rRNA) gene analysis, the water samples were filtered on 0.2 μm polyethylsulfone (PES) membrane filters immediately after returning to shore. Filters were stored in -80°C freezer until total nucleic acid was extracted, using the MO Bio PowerSoil DNA Isolation Kit (cat. no. 128888-50). PCR amplification, using Promega GoTaq Flexi DNA Polymerase was performed following the 16S rRNA gene Illumina amplicon protocol from the Earth Microbiome project1. Each sample was amplified in triplicate 25 μL reactions with the following cycling parameters: 95°C for 3 min, 30 cycles of 95°C for 45 s, 50°C for 60 s, and 72°C for 90 s, and a final elongation step at 72°C for 10 min. V4 region amplifications were performed using the 515F-806R primer pair (10 μM each) modified to include recently published revisions that reduce bias against the Crenarchaeota and Thaumarchaeota lineages as well as the SAR11 bacterial clade (Parada et al., 2016). The primer pair was additionally modified to include Golay barcodes and adapters for Illumina MiSeq sequencing. Final primer sequences are detailed in Walters et al. (2016). After PCR amplification, samples were run on a 1.5% agarose gel and quantified using Tecan Genios Spark 10 M microplate reader and QuantiFluor DNA dye. Following amplification, the triplicate products were combined together and run on a 1.5% agarose gel to assess amplification success and relative band intensity. Amplicons were then quantified with the QuantiFluor dsDNA System (Promega), pooled at equimolar concentrations, and purified with an UltraClean PCR Clean-Up Kit (MoBio Laboratories; Carlsbad, United States). The purified library, along with aliquots of the three sequencing primers, were sent to the Georgia Genomics Facility (Athens, GA, United States) for MiSeq sequencing (v2 chemistry, 2 × 250 bp). Sequence reads were processed using mothur v.1.39.5 following the MiSeq SOP protocol (Schloss et al., 2009; Kozich et al., 2013). DNA sequences generated can be found in the GenBank Sequence Read Archive under the accession number PRJNA558756.
For the metagenomic analysis, samples (between 4 and 20 L) were pre-filtered immediately after sampling with a nitex filter (30 μm) to remove small grazers and large particles, then filtered through a glass fiber filter (GF/F with a 0.7 μm pore-size or GF/D with a 2.7 μm pore-size), followed by a 0.22 μm pore-size polyvinylidene fluoride (PVDF) filter. Filters were stored at -20°C until further use. DNA was extracted from the GF and PVDF filters (cut to represent ∼3 L of initial samples) via a phenol chloroform method. Filters were aseptically cut to represent a volume of ∼3 L of initial sample water, i.e., if 4 L of water was filtered then 3/4 of the filtered would be used for extraction. Briefly, samples were incubated in 10 mL of lysis buffer (120 mM NaCl, 225 mM sucrose, 6 mM EDTA, and 15 mM Tris HCl, pH = 9) and lysozyme (100 mg mL−1) at 37°C at 350 rpm for 30 min, then with proteinase K (20 mg mL−1) and 10% SDS at 50°C at 350 rpm overnight. DNA was extracted using saturated phenol (pH of 8) followed by two rounds of chloroform:isoamyl alcohol 24:1 before ethanol precipitation (Green and Sambrook, 2017). Residual phenol and chloroform was removed with the QIAamp® DNA mini and Blood mini kit. DNA samples were stored at −20°C until further use. DNA samples were sequenced using Illumina HiSeq chemistry (2 × 150 bp) at the Texas A&M Genomics & Bioinformatics facility in College Station, TX. BBTools were used to remove adapter sequences, sequence artifacts, and merge sequences2 before de novo assembly with MEGAHIT (Li et al., 2015). Gene prediction was performed using Prodigal (Hyatt et al., 2010) and the translated amino acid sequences were compared to the GenBank nr database using DIAMOND (Buchfink et al., 2015). The results were used to visualized the abundance of characteristic SEED metabolic pathways using MEGAN (Huson et al., 2011). Data are available through the BCO-DMO portal3.
Bacterial contributions to DOC were estimated following the methods of Kaiser and Benner (2008) according to:
where BiomarkerDOM and Biomarkerbacterial DOM were the C-normalized yields of D-Asx, D-Glx, and D-Ala in sample DOM and freshly-produced bacterial DOM. C-normalized yields of D-Asx, D-Glx, and D-Ala in bacterial DOM were 24.3 nmol mg C−1, 16.5 nmol mg C−1, and 35.0 nmol mg C−1, respectively, and were representative of coastal and marine bacterial assemblages.
Two methods were used to estimate DOC export to the bay for the storm event. One method used the measured river DOC concentrations during the first sampling cruise and freshwater export flux. Estimated freshwater volumes for the event was 14–17 × 109 m3 (Du et al., 2019a, b). The second method followed the approach of Officer, 1979 and used in other studies (Cai et al., 2004; He et al., 2010). The calculation of the DOC concentration for freshwater input is graphically shown in Supplementary Figure S1, applying at tangent to a fitted DOC/salinity relationship at a salinity of 7. This yielded a DOC concentration of 409 μmol L−1 for a salinity of 0.
The removal of tDOC was calculated from correlations of carbon-normalized concentrations of p-hydroxy phenols, vanillyl phenols, and syringyl phenols (TDLP9-C) with river water fractions. Carbon-normalized concentrations of TDLP9 were calculated by dividing the sum of TDLP9 by the DOC concentration and reported in units of nmol mg C−1. Conservative mixing of TDLP9-C concentrations in bay waters is described by a rational model, i.e., a ratio of simple polynomials with a 0 intercept according to:
where fR is the fraction of river water and α,β are model parameters. Model parameter β was estimated from a theoretical mixing model of river and ocean water from fR = 0 to fR = 1. Model parameter α was fitted with a rational model. The conservative mixing model used DOC and TDLP9 concentrations measured in San Jacinto river water discharged to the head of the bay during the first week of sampling. A graphical approach is presented in Figure 7 and a detailed description is provided in Kaiser et al. (2017a). Fitted TDLP9-C concentrations at fR = 1 were compared to the river endmember, and first-order decay constants were calculated as follows:
where TDLP9-Csample is the fitted concentration at fR = 1, TDLP9-Criver is the concentration of the river endmember, and t is the water residence time in years. The fraction of river water was calculated assuming a salinity of 0 for river water and a salinity of 35.4 for the oceanic endmember. The unit years was used to allow comparison of decay constants published by Kaiser et al. (2017a). Error for calculations of decay constants was evaluated by considering the variability of TDLP9-C concentrations and fitting. Random noise limited by uncertainties of input variables was added to input variables and repeated >1000 times. Uncertainties are reported with decay constants and shown in Figure 8.
During the storm period, the San Jacinto River contributed 73% of the total freshwater discharge. The Trinity River, surface runoff and groundwater contributed the remaining freshwater input. Freshwater release during the entire storm period was 14–17 × 109 m3 (∼4 times of the bay volume) and export peaked at over 2 × 10⁴ m3 s−1 immediately following the heaviest precipitation period of August 26–30th (Du et al., 2019a, b).
The salinity range across the bay was 0–7 immediately following the main precipitation event and as sampling was initiated on September 4th (Table 1 and Figure 2A). Water transit times in the bay were on the order of 1–2 day on August 27th, adjusting to 60–90 day after September 3rd (Du et al., 2019c). The salinity in the bay eventually recovered to 8–20 after 4 weeks (Table 1 and Figure 2A). Complete recovery of salinity after the storm took ∼2 month (Du et al., 2019a, b).
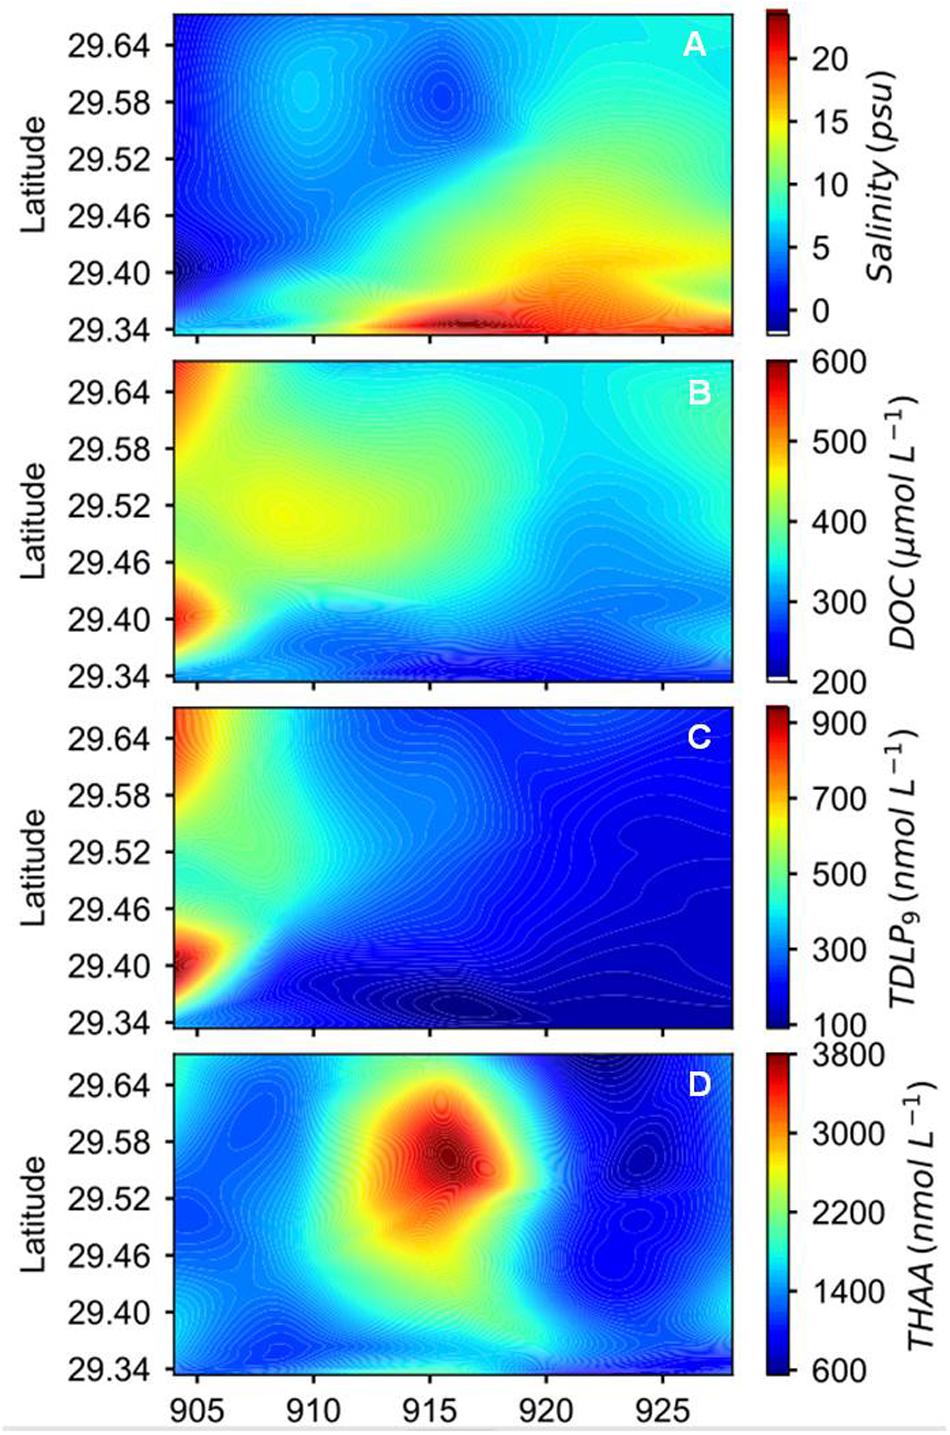
Figure 2. Spatial and temporal variations of (A) salinity, (B) DOC, (C) sum of nine dissolved p-hydroxyl, vanillyl, and syringyl phenols (TDLP9), and (D) total hydrolyzable amino acids (THAA) concentrations during the sampling period after Hurricane Harvey.
Temporal and spatial distribution patterns of DOC concentrations showed an inverse relationship to salinity (Figure 2B, Supplementary Figure S1, and Table 1). Concentrations of DOC were highest (566 μmol L−1) in freshwater entering the bay and gradually decreased toward the mouth of the estuary and over the four-week sampling period (Figure 2B). Changes in DOC concentrations were most pronounced in the first 2 weeks of sampling. Locally elevated concentrations were found at mid-bay stations 6 to 8 during the first sampling cruise, and stations 4 and 6 during the second and third cruises.
Concentrations of TDLP9 ranged from 109 to 832 nmol L−1 (Figure 2C, Supplementary Figure S1, and Table 1). Highest TDLP9 concentrations were observed during lowest salinity and highest discharge demonstrating the input of terrigenous DOM to the bay. Like concentrations, SUVA254, which is representative of aromatic moieties in DOM molecules, and carbon-normalized yields of TDLP9 were highest at the mouth of the bay at the start of the sampling program and declined profoundly over the following month (Table 1, Figure 3, and Supplementary Figure S1).
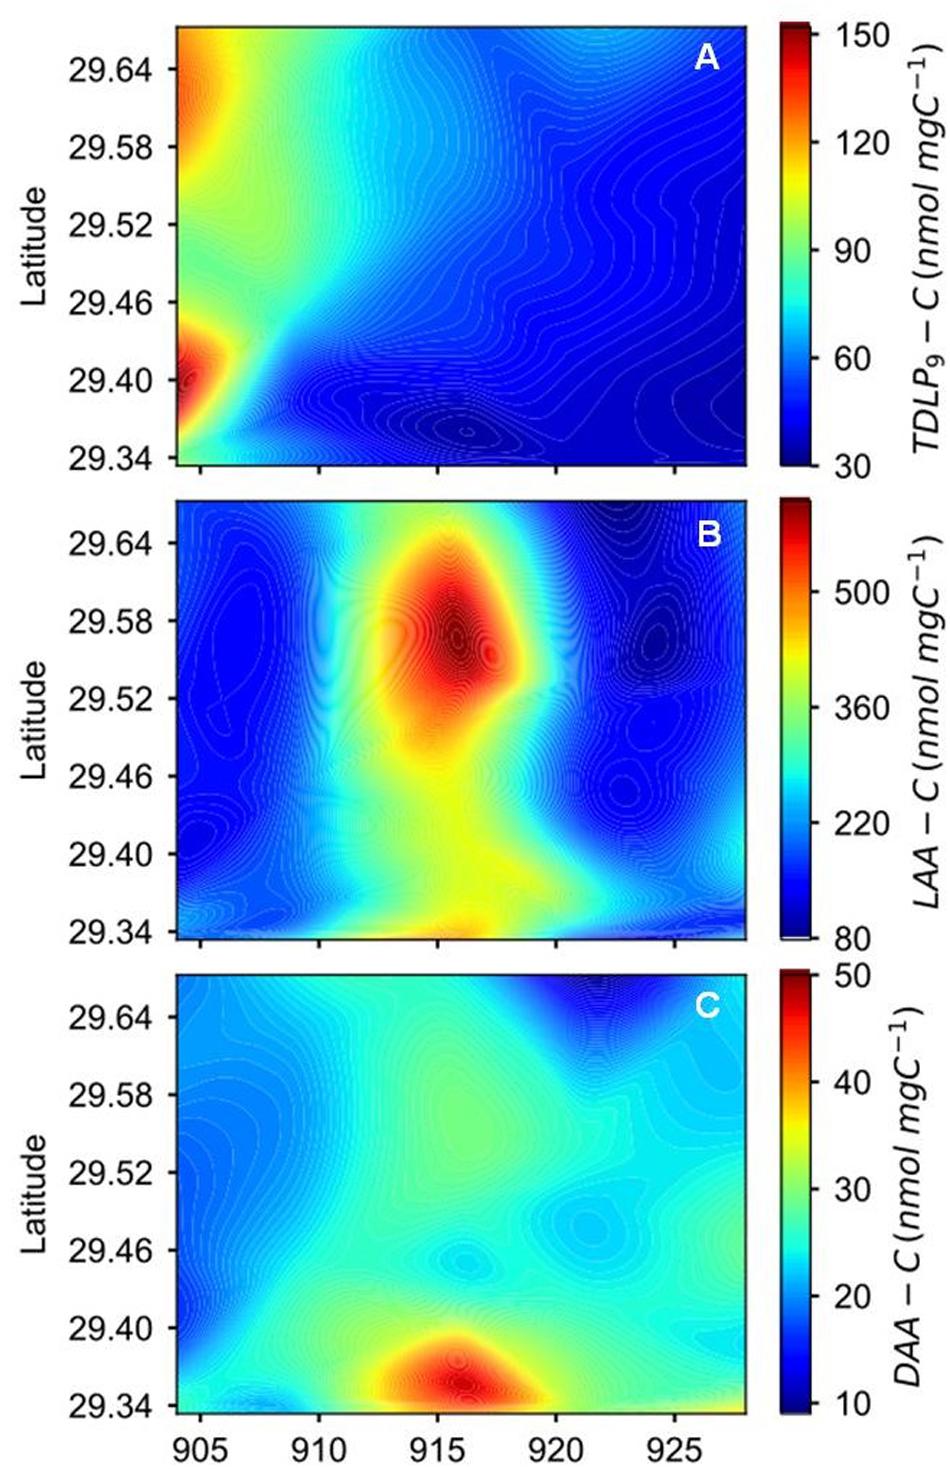
Figure 3. Spatial and temporal variations of (A) carbon-normalized concentrations of p-hydroxyl, vanillyl, and syringyl phenols (TDLP9-C), (B) carbon-normalized concentrations of dissolved L-amino acids (LAA-C), and (C) carbon-normalized concentrations of dissolved D-amino acids (DAA-C) during the sampling period after Hurricane Harvey.
Amino acid concentrations varied from 619 to 3605 nmol L−1 and increased as water clarity improved after 2 weeks (Table 1, Figure 2D, and Supplementary Figure S1). Both, D-amino acid concentrations (DAA) and carbon-normalized yields of amino acids followed the same trend as observed for concentration. Amino acid degradation index values calculated from amino acid compositions (Dauwe et al., 1999; Kaiser and Benner, 2009) showed relatively large variations (from 0.17 to 2.93), with distinctly higher values during the third sampling trip. High carbon-normalized yields of amino acids and degradation index values during the third cruise were indicative of bioreactive DOC.
The compositional lignin phenol parameters S/V, and C/V ranged from 0.32 to 0.48, and 0.06 to 0.13, respectively, and did not exhibit substantial changes with locations and time (Table 1 and Figure 4). S/V and C/V are generally employed to explore sources of tDOC (i.e., angiosperm versus gymnosperm and woody versus nonwoody) (Hedges and Mann, 1979; Goñi and Hedges, 1995; Godin et al., 2017). Representative tissues and their leachates were integrated in Figure 4 to aid with identification of tDOC sources (Supplementary Table S1). Leaching and sorptive processes can skew diagnostic ratios (Hernes et al., 2007; Spencer et al., 2008), but the dominance of DOC leached from nonwoody angiosperm tissues was clearly evident.
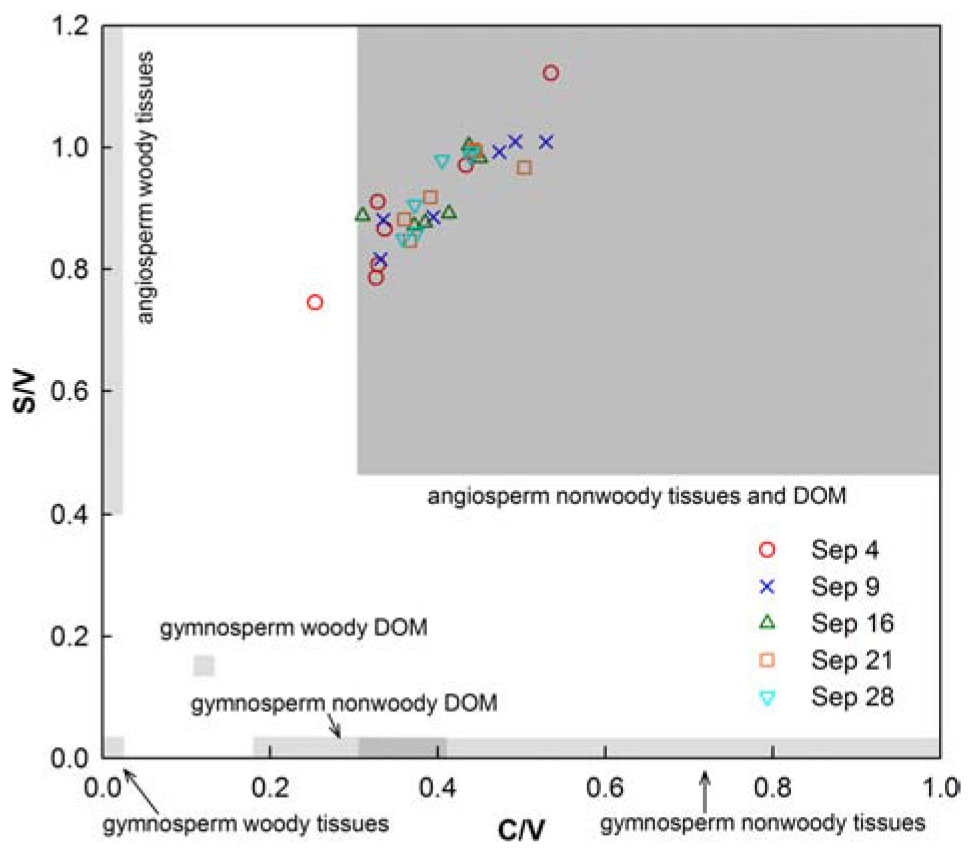
Figure 4. Ratios of syringyl/vanillyl (S/V) and cinnamyl/vanillyl (C/V) phenols in water samples collected in Galveston Bay after Hurricane Harvey. The shaded boxes denote ranges of phenol ratios in representative source vegetation materials and their leachates (see Supplementary Table S1). Phenols were analyzed with a new method, and phenol ratios were corrected for comparison with literature values (Yan and Kaiser, 2018b).
P/V ratios significantly increased (t-test, p < 0.001) temporally and spatially exhibiting consistently lower values in the upper bay compared to the lower bay. The increase in P/V was negatively correlated (R2 = 0.73, p < 0.001) to carbon-normalized TDLP9 (TDLP9-C) concentrations (Figure 5). Average (Ad/Al)V gradually decreased from 0.88–0.64 (Table 1 and Figure 6) over the sampling period, whereas the average spectral slope (S275–295) increased. Both parameters were significantly lower than values observed for the coastal Gulf of Mexico (Fichot et al., 2014).
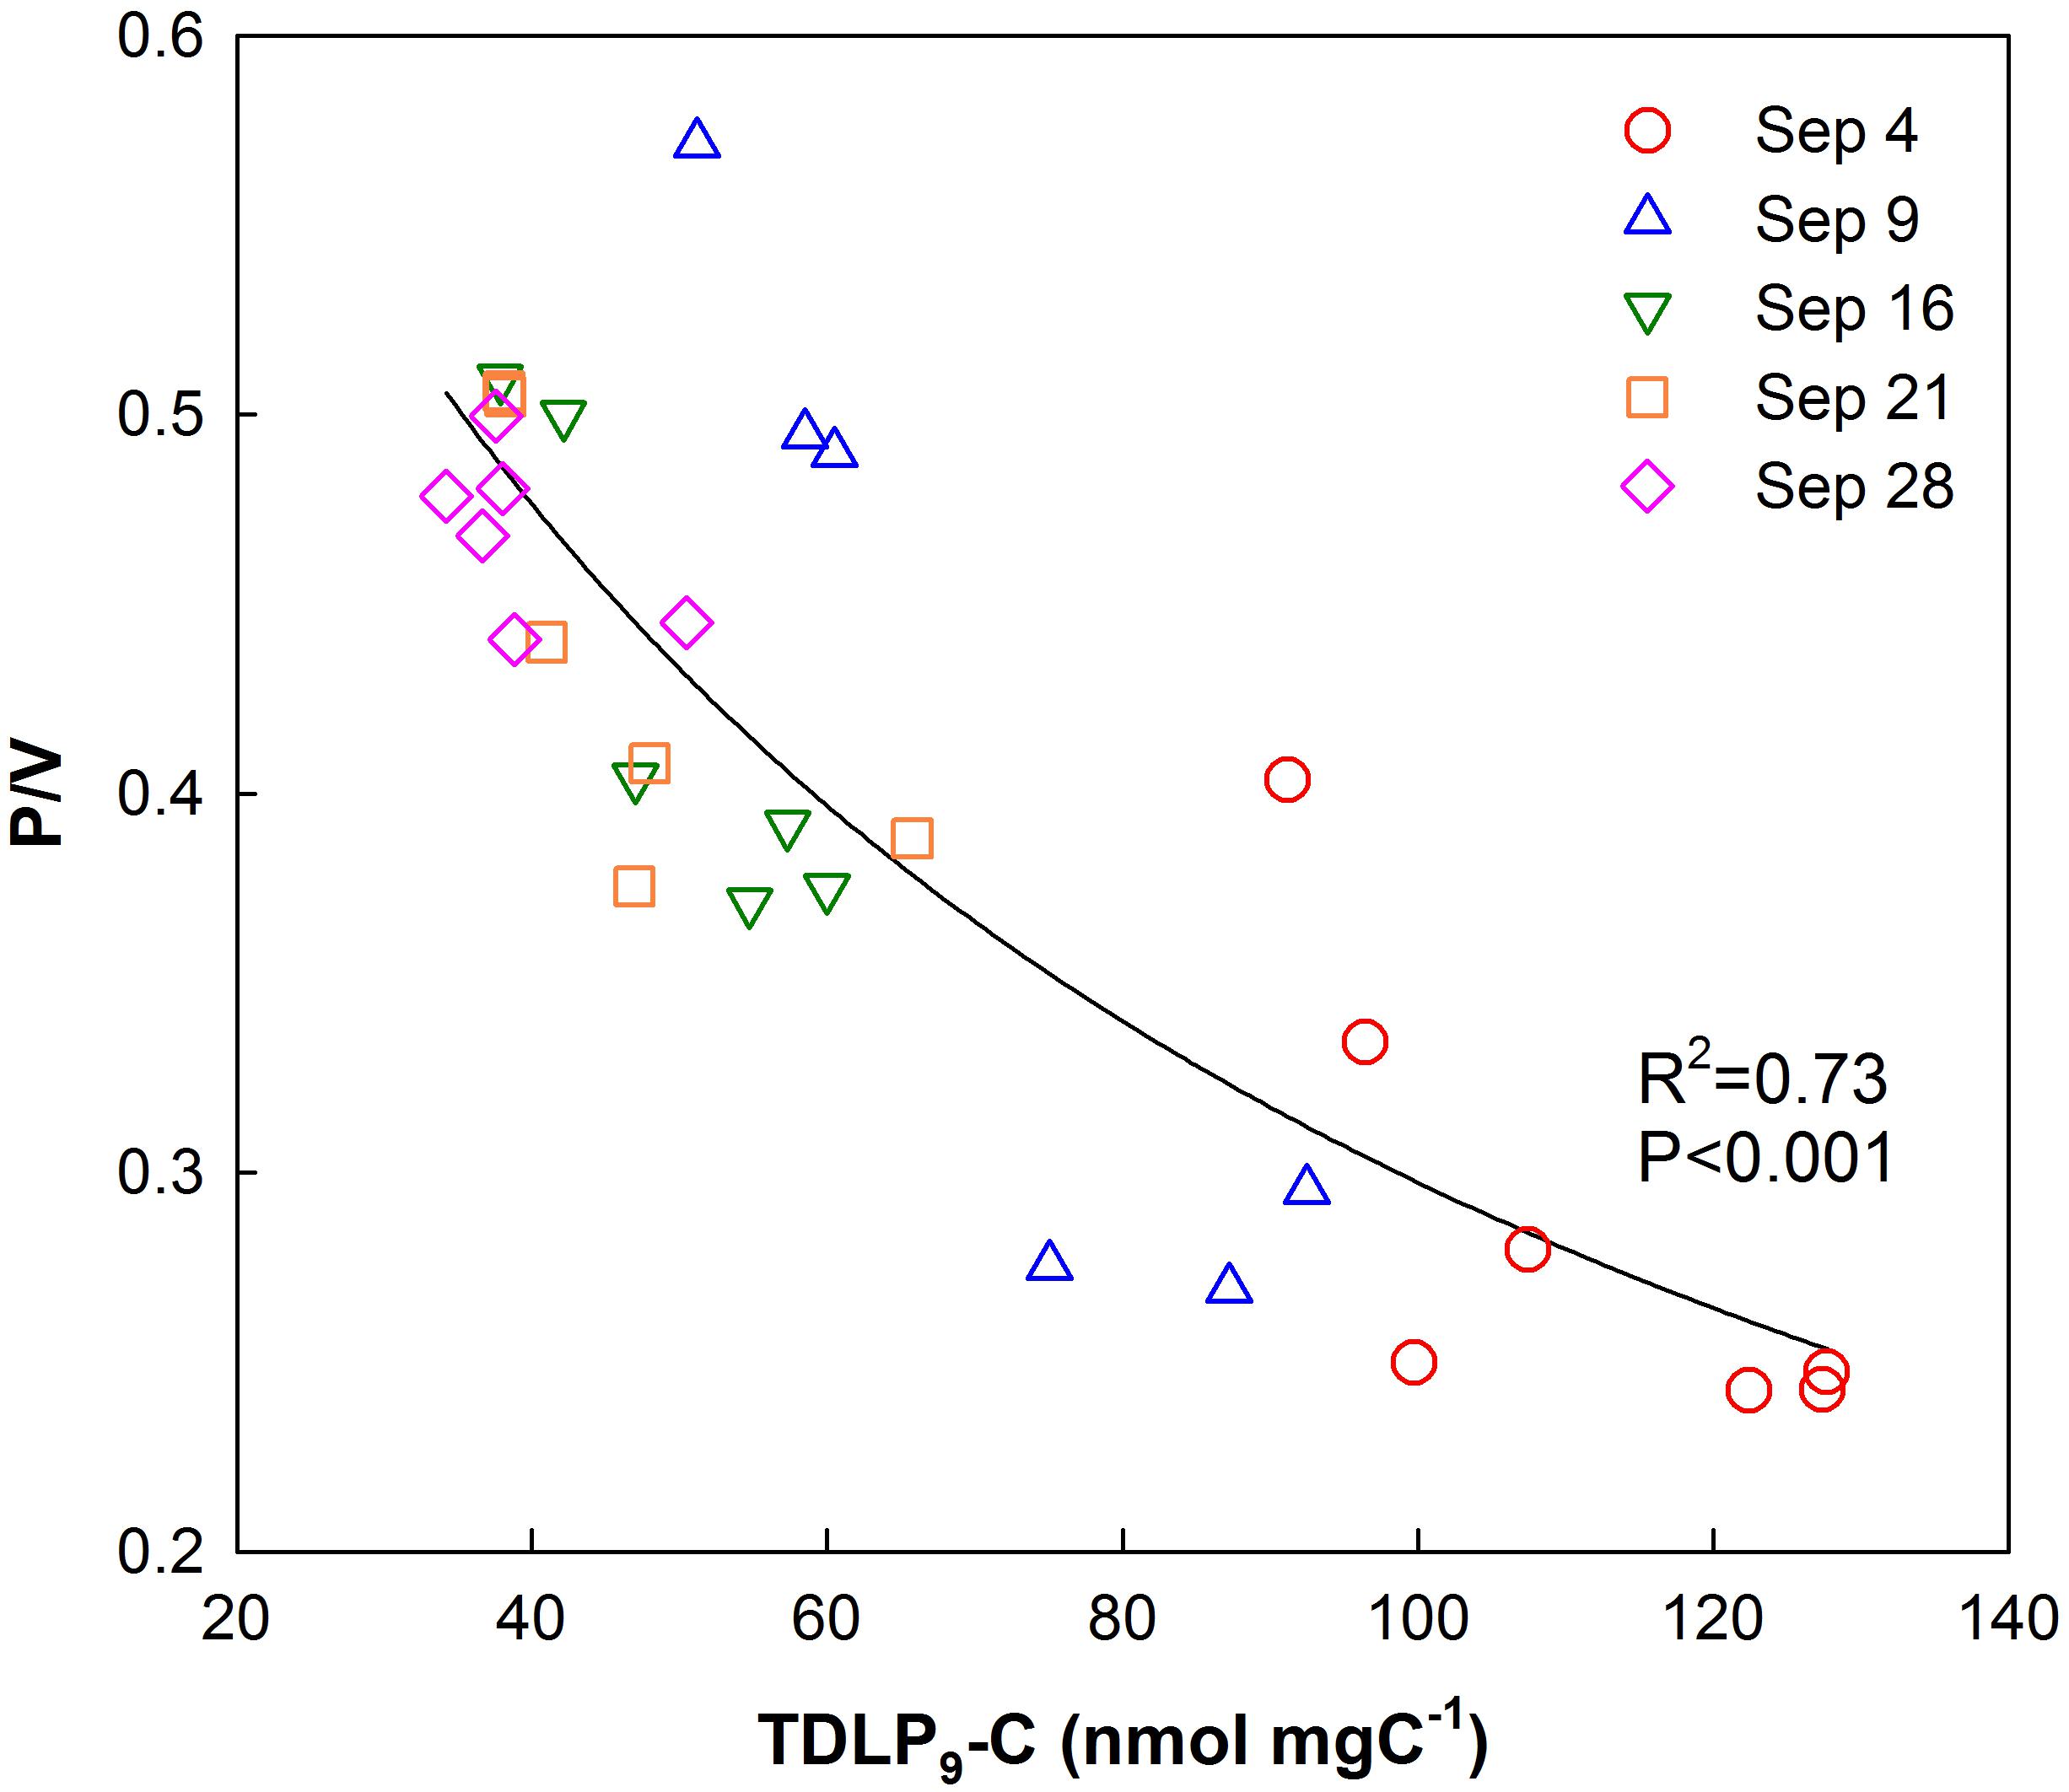
Figure 5. Relationship of p-hydroxyl phenol/vanillyl phenol (P/V) ratios with TDLP9-C (nmol mg C–1) for all water samples collected in Galveston Bay after Hurricane Harvey.
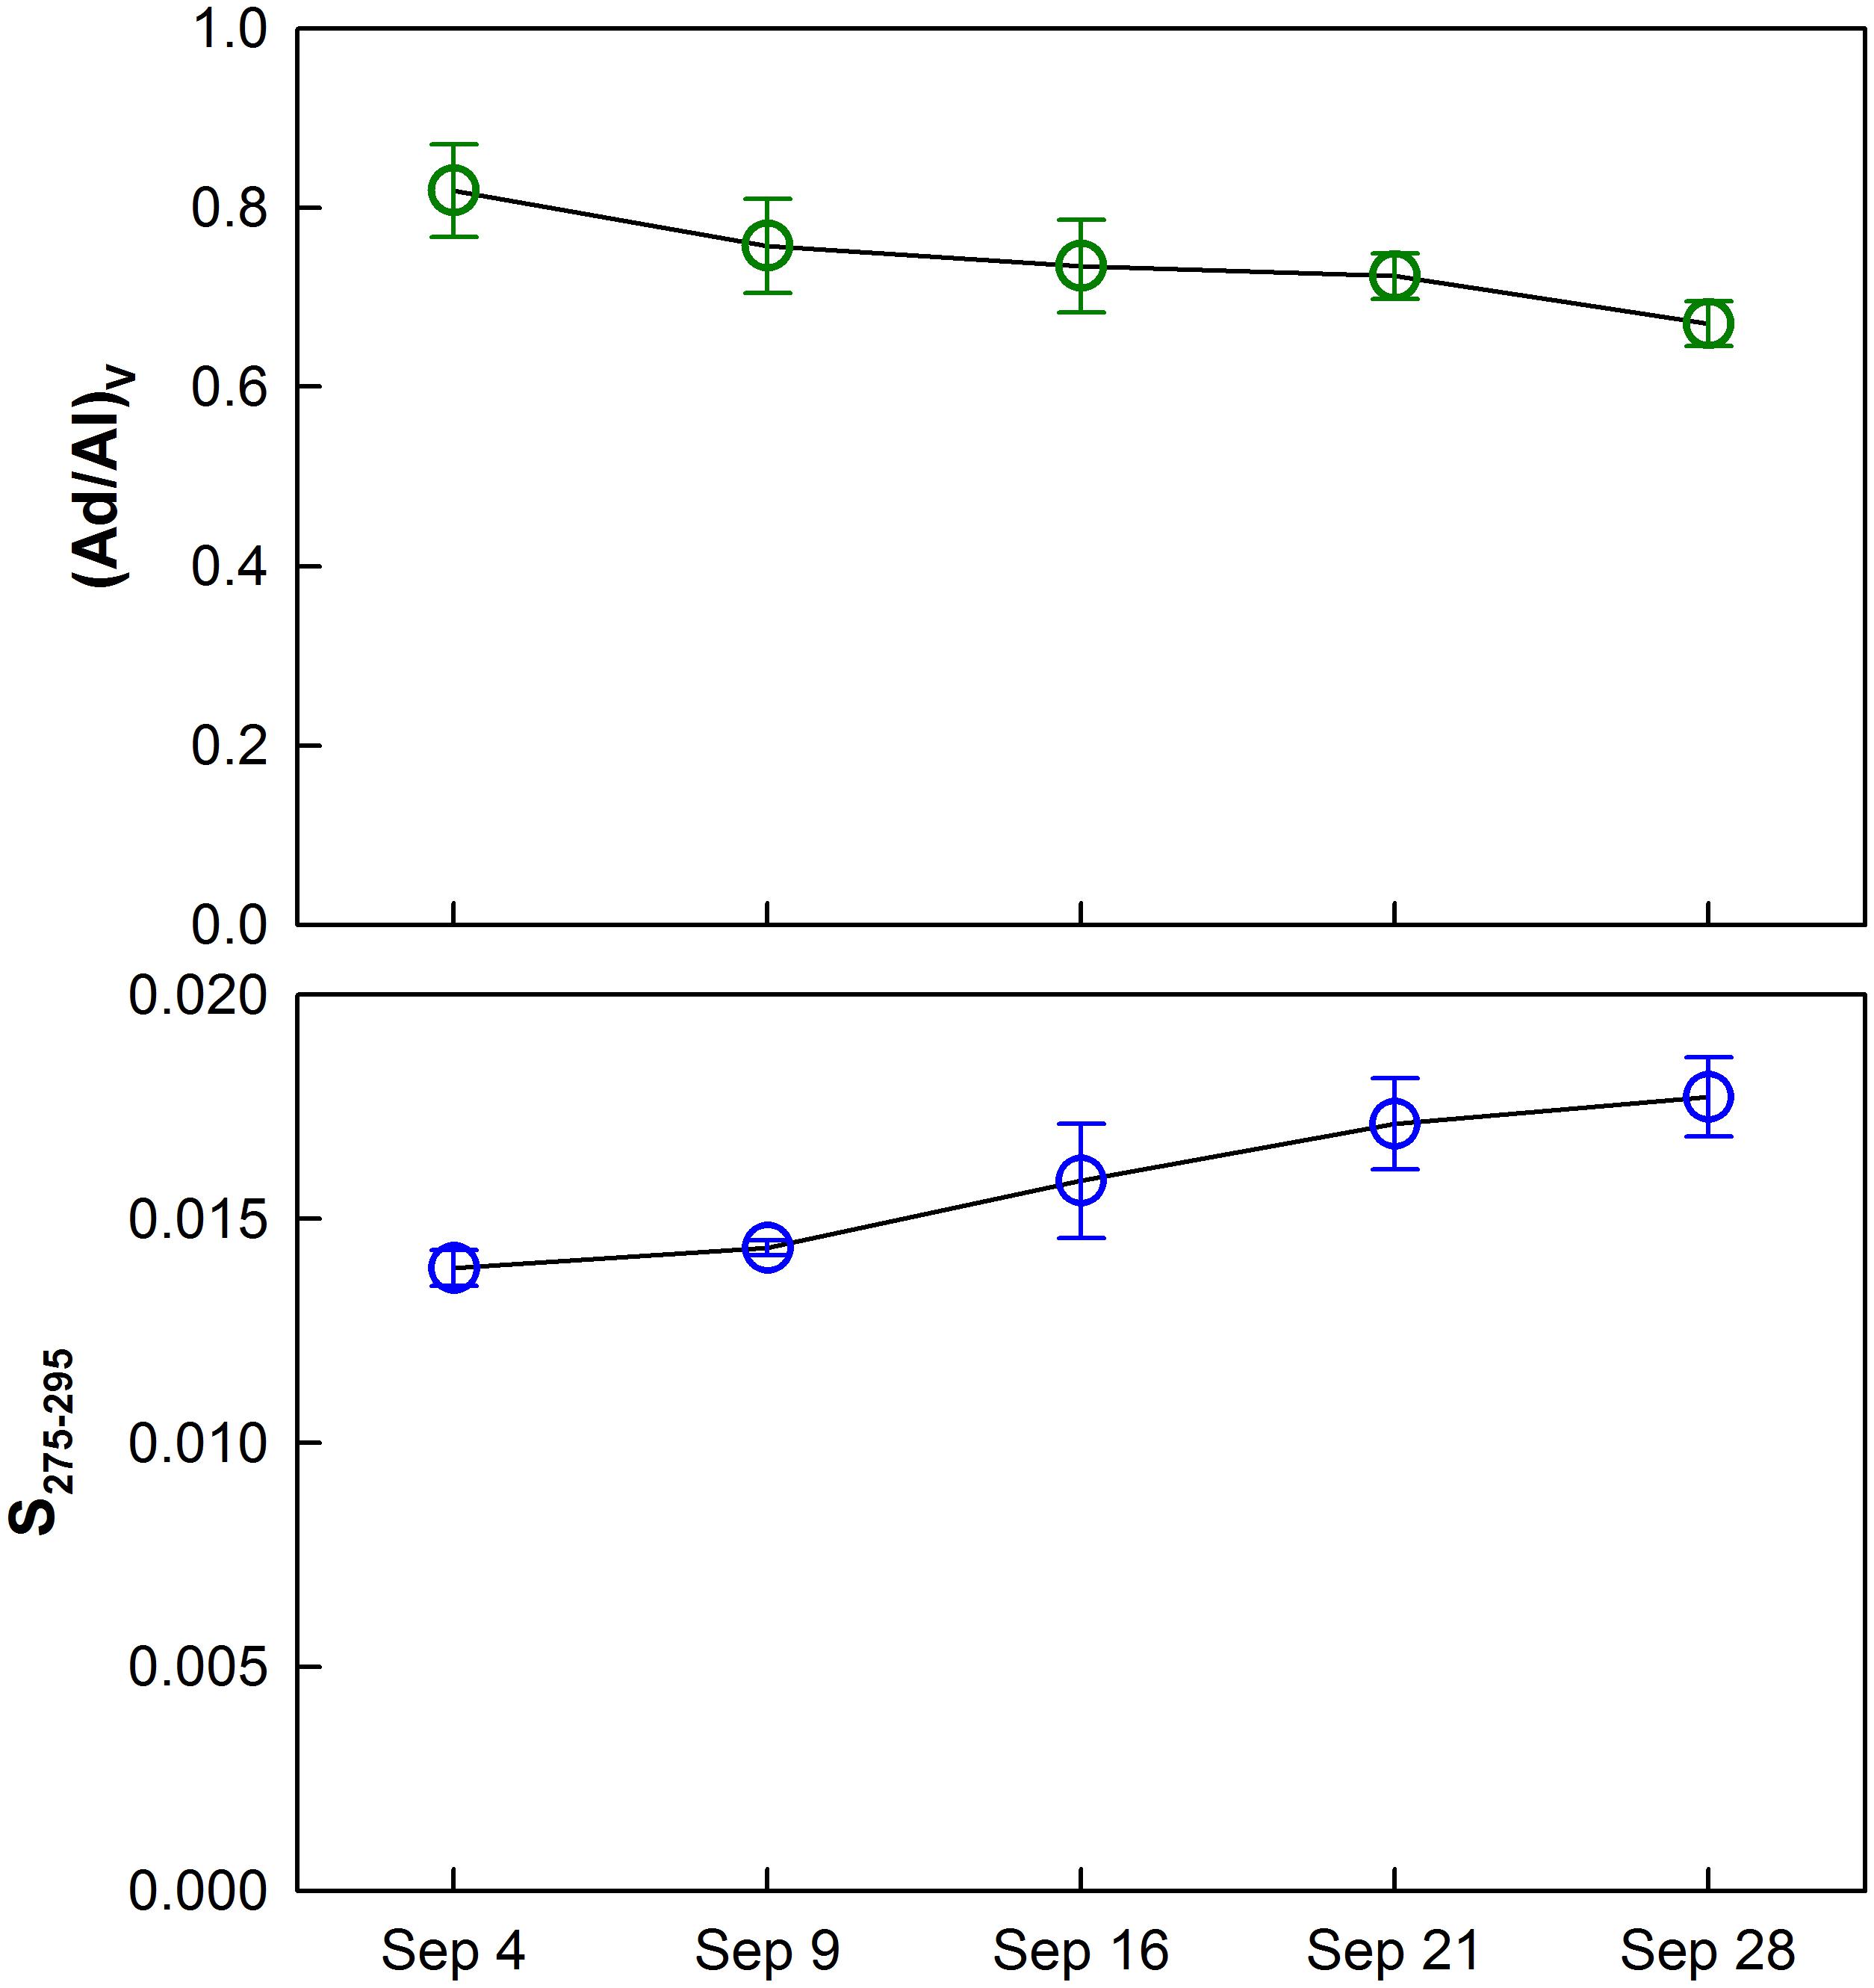
Figure 6. Temporal trends of average vanillic acid/vanillin (Ad/Al)V ratios and the spectral slope (S275–295) for water samples collected during each cruise. Error bars show standard deviations.
The approach to calculate tDOC removal is shown in Figure 7. It was assumed the loss of dissolved lignin phenols reflected the loss of bulk tDOC (Hernes and Benner, 2003). TDLP9-C for river water was 124.8 nmol/mg C−1 and likely presented a conservative endmember for river input. The exponential decay constant for mineralization of tDOC was 25.99 ± 4.31 year−1 for the first 2 weeks, and decreased to 9.80 ± 4.96 year−1 for the remainder of the sampling period. The decay constant for tDOC observed during the first 2 weeks was about 3 times higher than decay constants observed among tDOC from high and low latitudes (Figure 8, Kaiser et al., 2017a). The compilation of decay constants represented in-situ observation and experimental assays, and included tDOC from Arctic rivers, from rivers within the Gulf of Mexico watershed, and from rivers along the Southeastern seaboard. Decay constants were compared in consideration of the time dependence of decay kinetics that recognized compositional changes during decomposition (Kaiser et al., 2017a). After the second week, the tDOC decay constant conformed to globally observed tDOC decay constants.
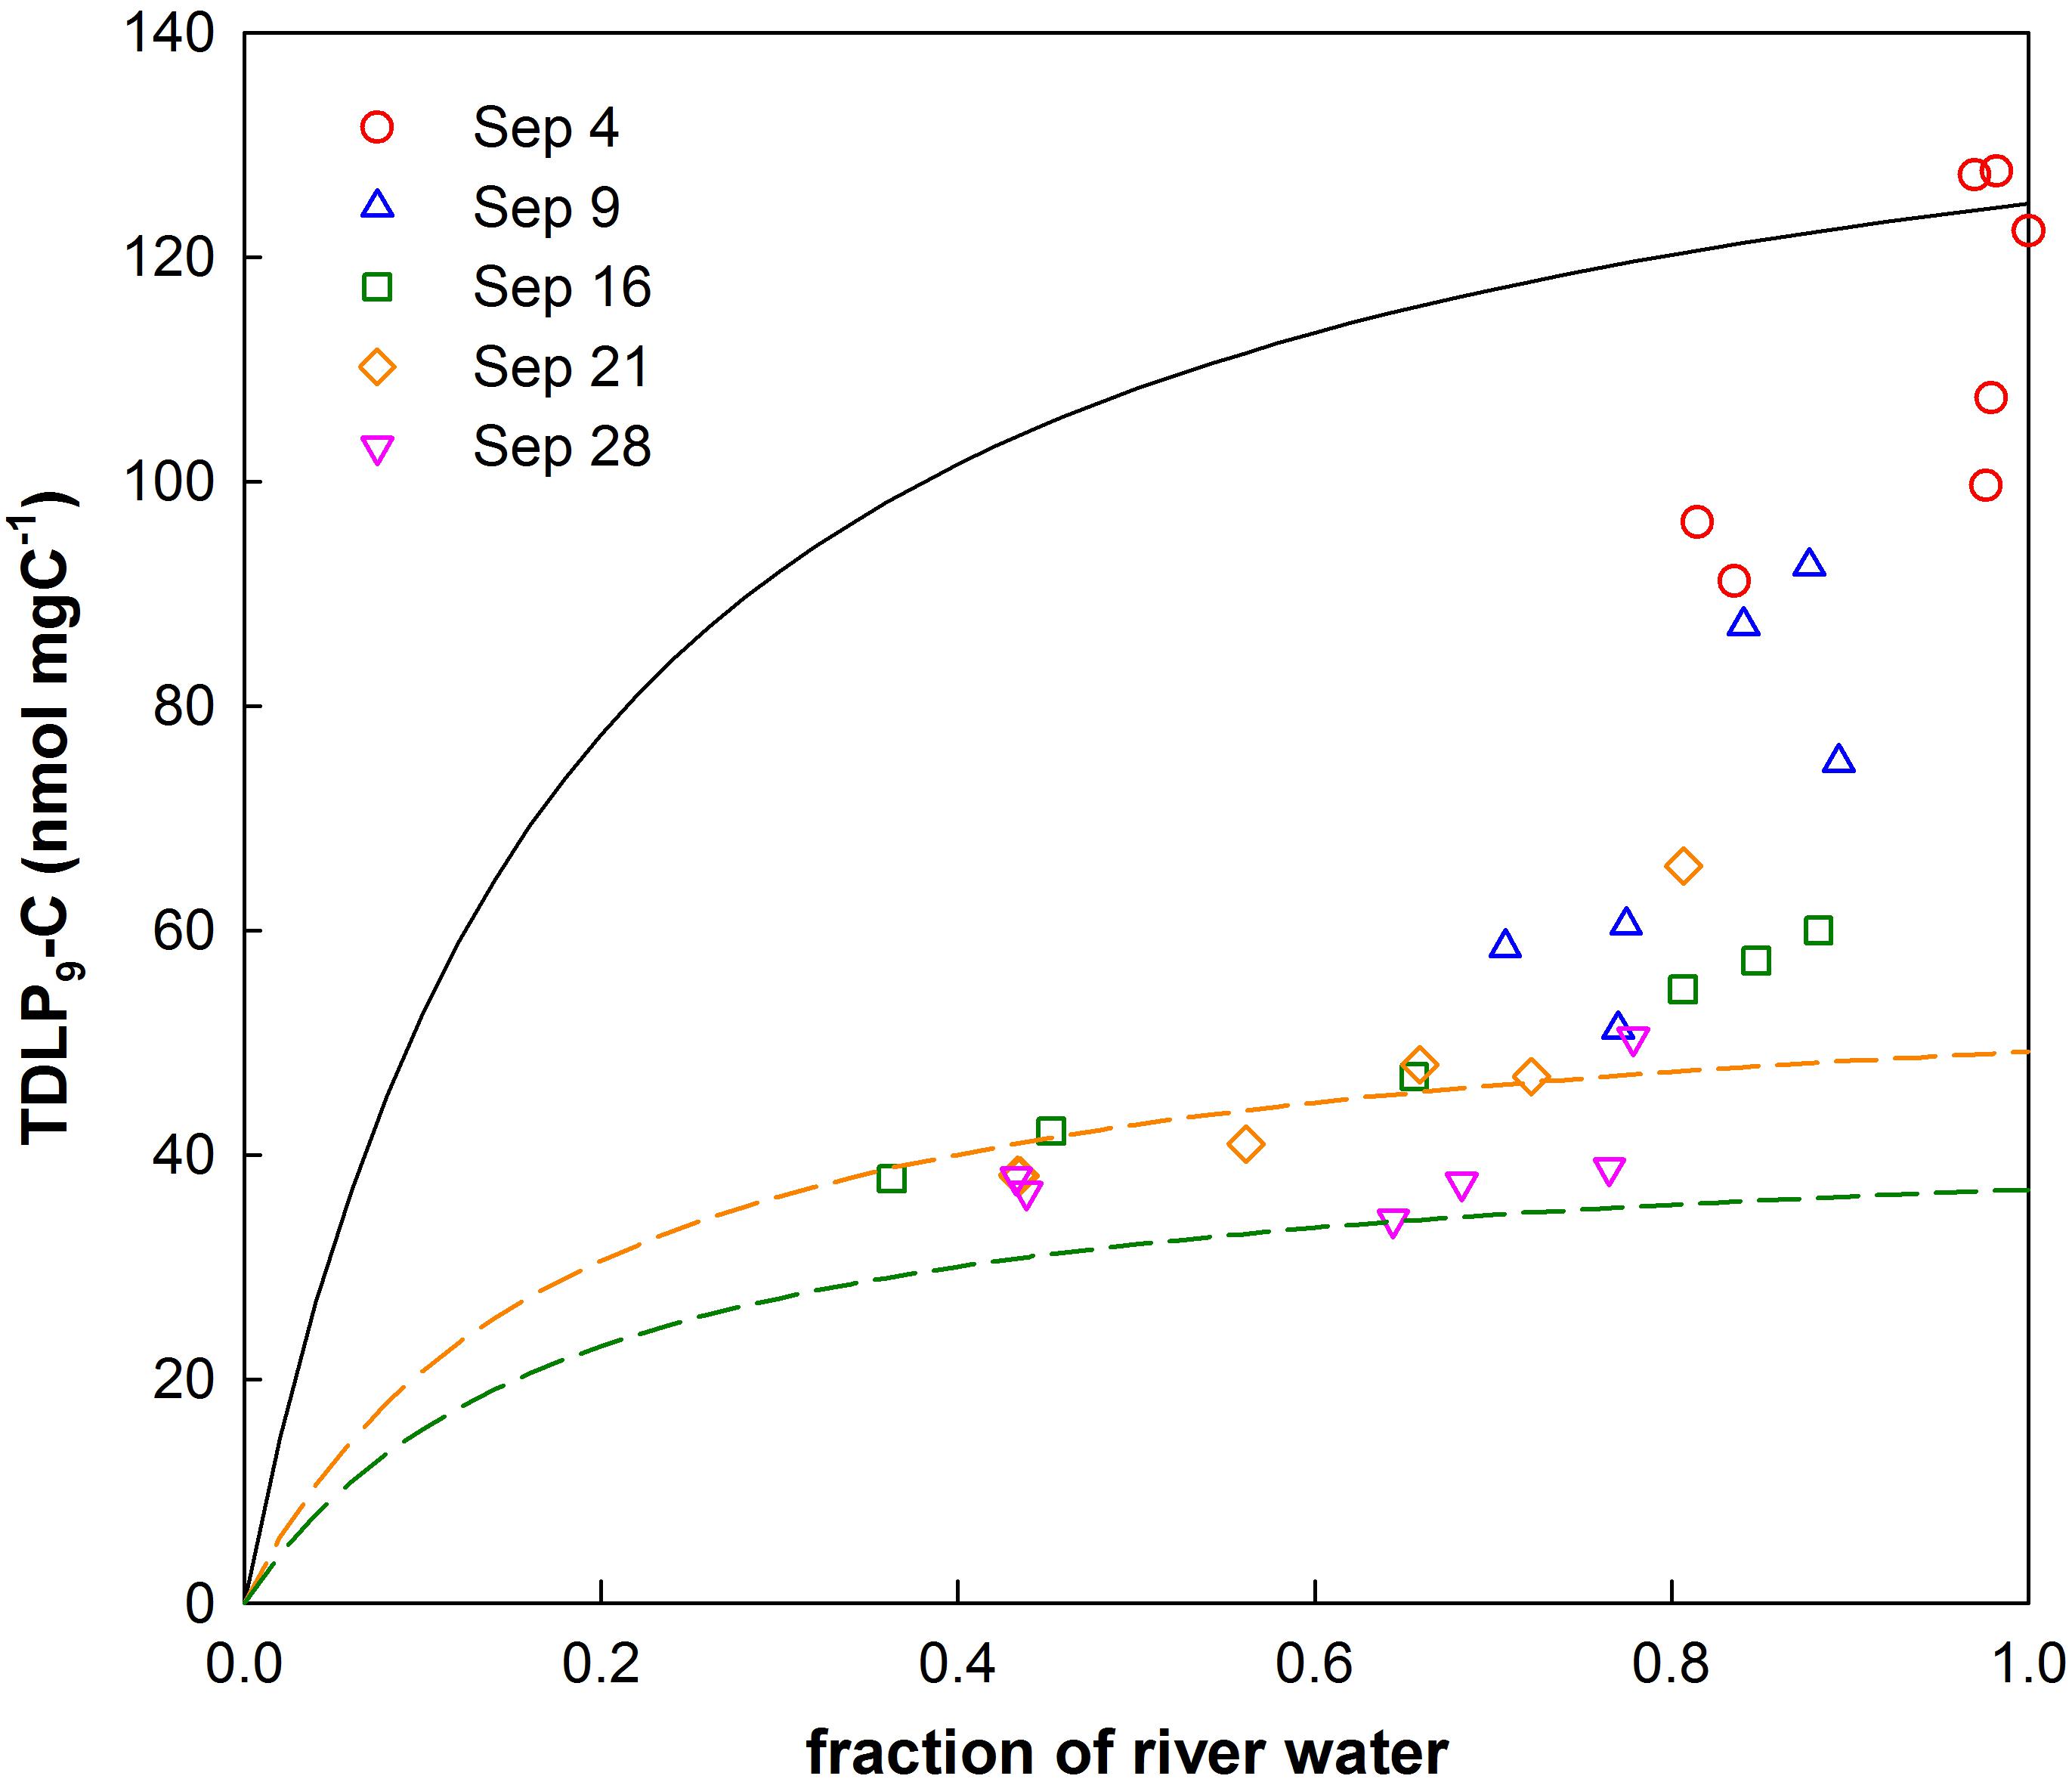
Figure 7. Relationship of river water fractions with carbon-normalized concentrations of dissolved lignin phenols (TDLP9-C). Conservative mixing of bay waters with shelf water follows a rational model. The solid black line represents the conservative mixing curve for river water with shelf water. The dashed colored lines show mixing curves for samples collected during the third (9/16) and fifth (9/28) cruise according to the rational model.
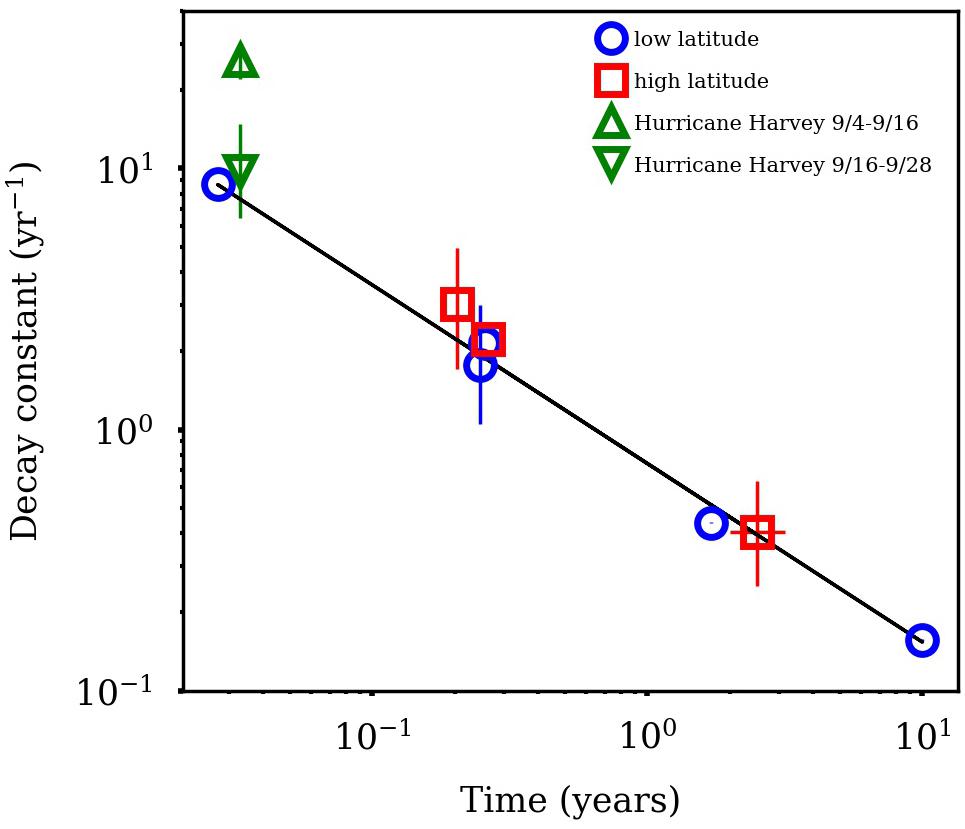
Figure 8. Comparison of terrigenous dissolved organic carbon (tDOC) decay constants in this study with those from high and low latitude watersheds Kaiser et al. (2017a). Decay constants are plotted relative to decomposition time. The abnormally high decay constant for hurricane tDOC was observed during the first 2 weeks of sampling.
Removal of tDOC was calculated according to:
Of tDOC 57 ± 10% was lost in the bay within 2 weeks of discharge, and additional 11 ± 5% was lost over the remaining sampling period.
The major bacterial classes identified in Galveston Bay included Betaproteobacteria, Alphaproteobacteria, Gammaproteobacteria, Actinobacteria, Flavobacteriia, Sphingobacteriia, Cyanobacteria, Deltaproteobacteria, Acidimicrobiia, Planctomycetacia, Opitutae, and OPB35_soil_group, and Chloroflexia (Figure 9). Floodwaters strongly modified water characteristics in the bay (e.g., salinity and temperature) and introduced soil (e.g., Opitutae and OPB35_soil_group), freshwater (e.g., Betaproteobacteria), and sedimentary (e.g., Actinobacteria) microorganisms, replacing the previously dominant marine species.
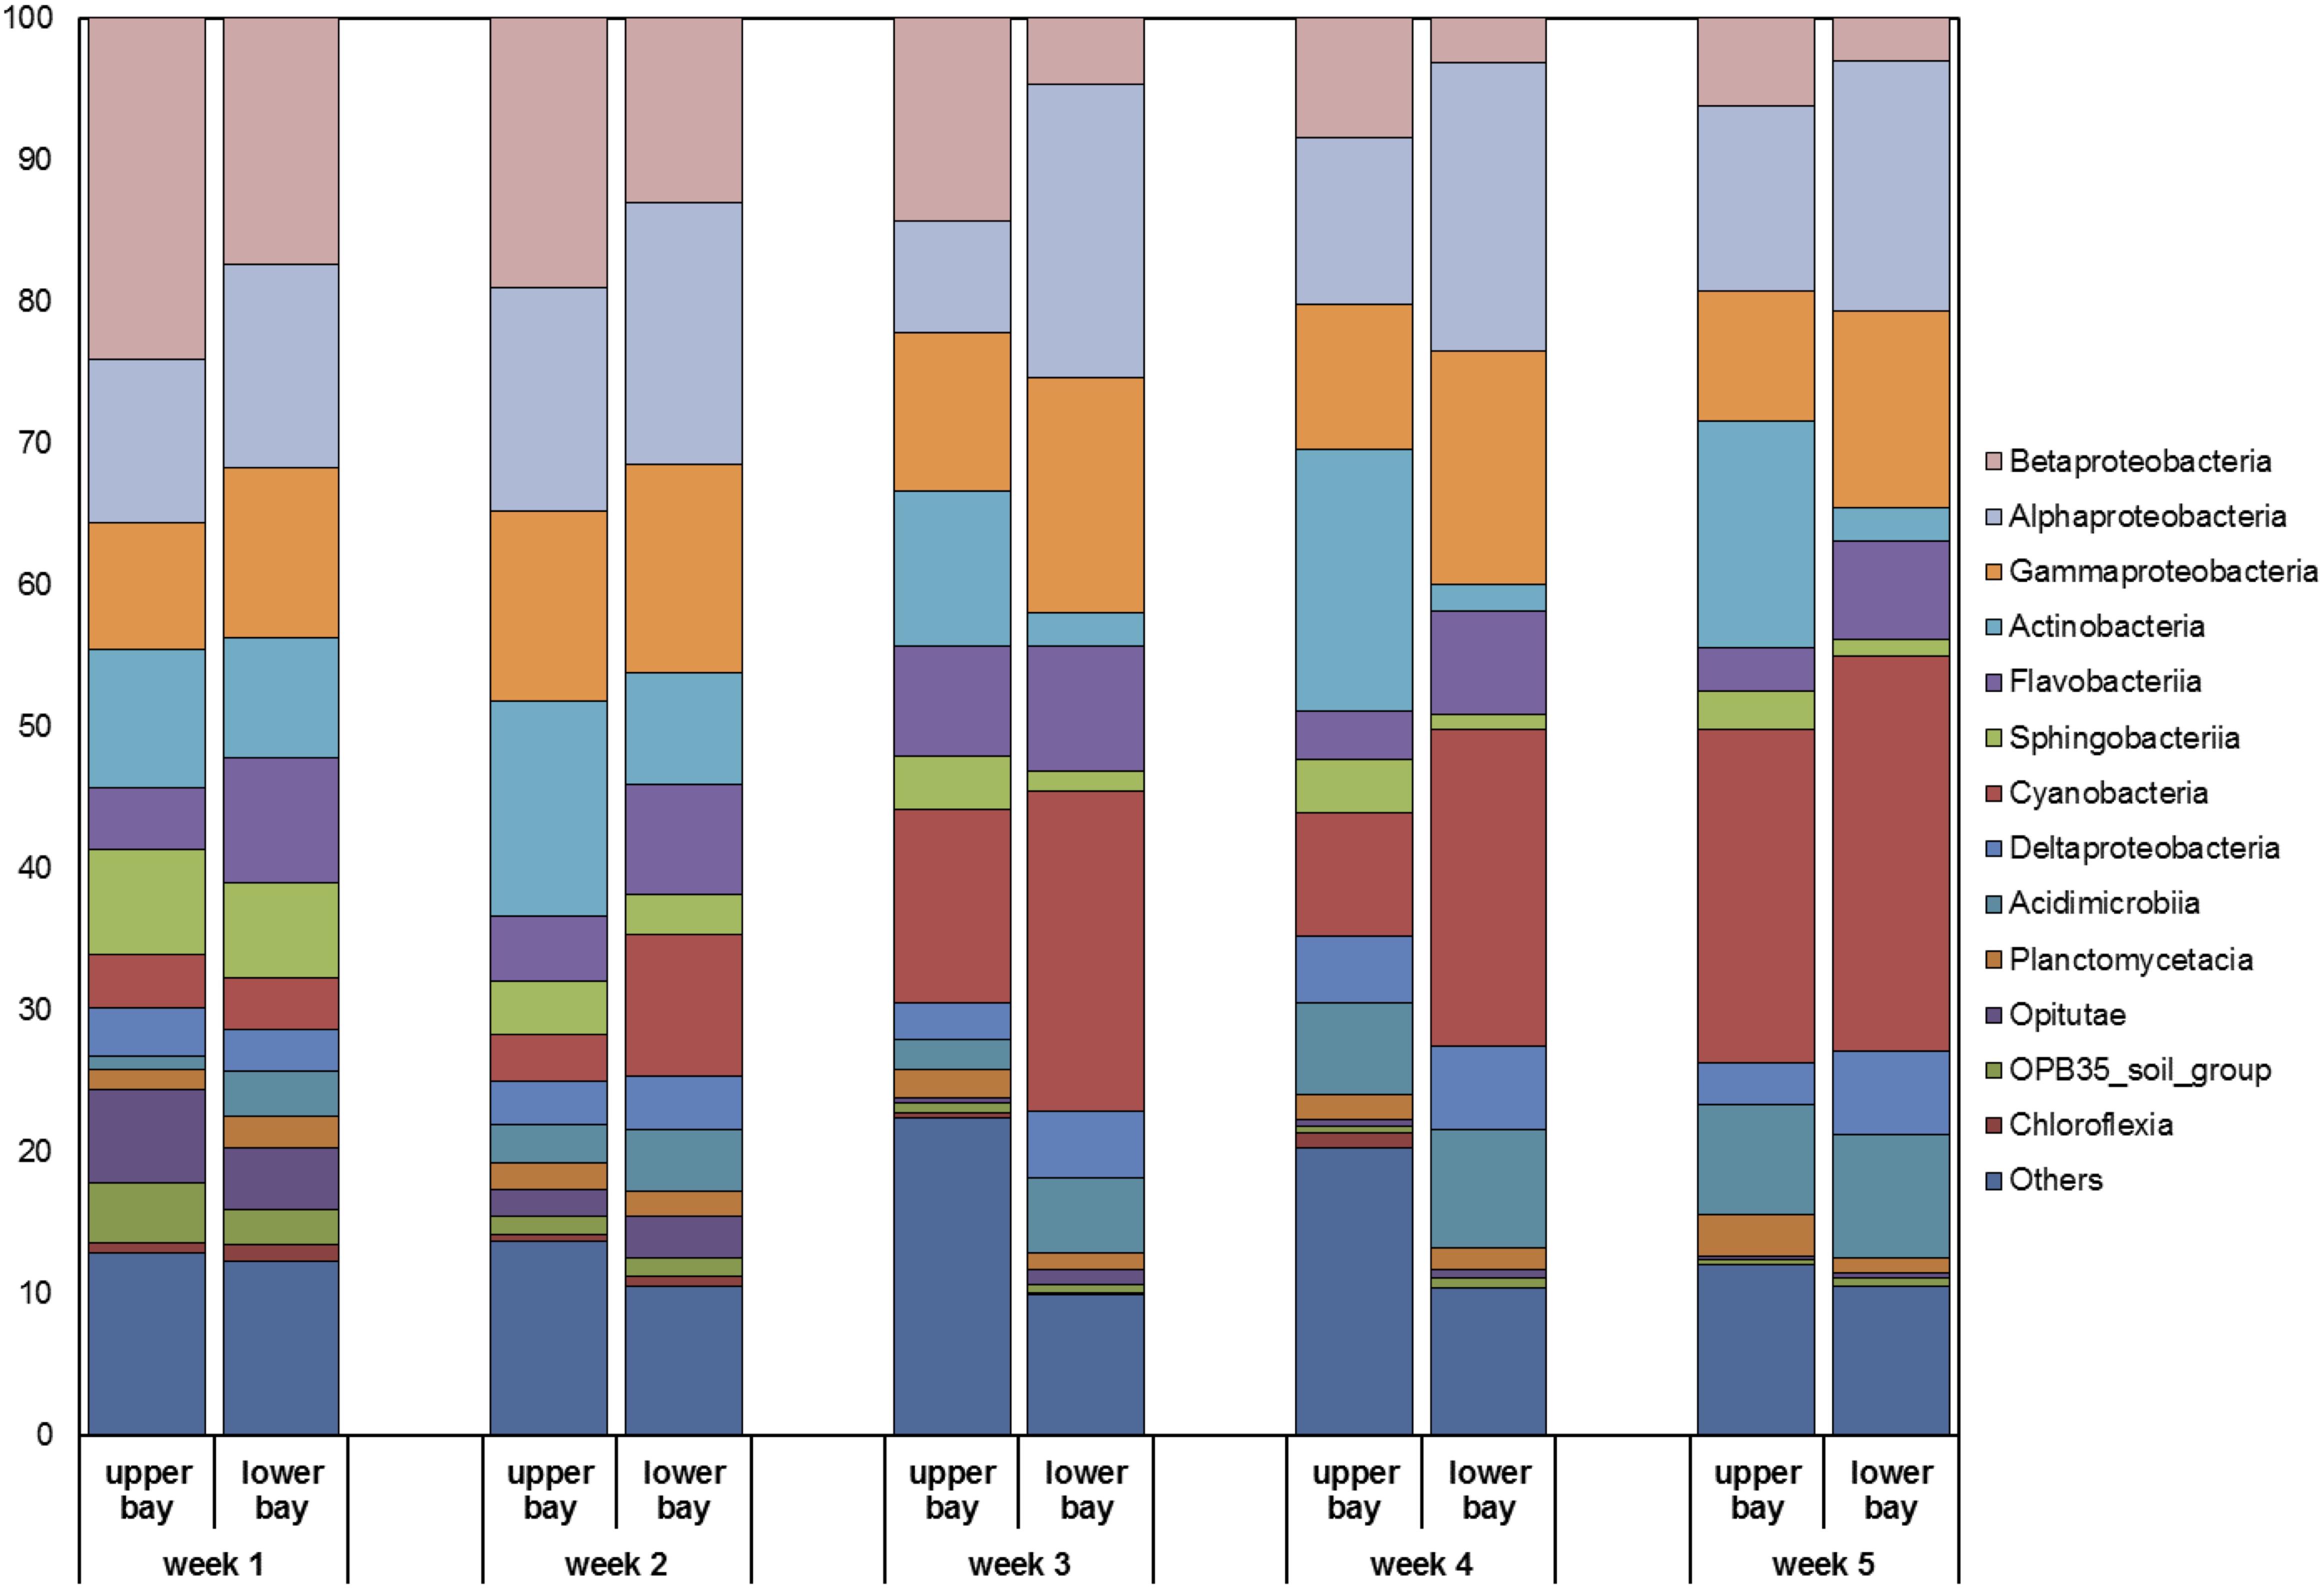
Figure 9. Relative compositions of major bacterial classes identified in water samples collected in Galveston Bay after Hurricane Harvey.
During the high discharge stage the microbial community composition was similar between the upper and lower bay. Over the following month, the microbial community composition slowly changed from bacteria inhabiting terrestrial environment (e.g., Betaproteobacteria) to those in marine environment (e.g., Cyanobacteria; Figure 9) and reverted to pre-hurricane conditions, where freshwater microbes were dominant in upper bay region and marine species prevalent in the lower bay. In particular, Cyanobacteria exhibited the most prominent transition pattern, as they accounted for less than 5% of the total bacterial community initially and then increased over time to reach 20–30% at the end of sampling campaign. The recovery time for the microbial community to pre-storm conditions was ∼5 weeks.
Changes in microbial community composition were also reflected in the distribution of D-amino acids (D-Ala, D-Glx, and D-Asx) (Figures 10B,C). D-amino acids were characteristic of specific bacterial biopolymers including peptidoglycan, teichoic acids, siderophores, and other cell membrane-derived sources (Kaiser and Benner, 2008). A diversity measure of the microbial community expressed through the Simpson index showed that species richness and evenness declined as the bay adjusted to a normal salinity regime (Figures 10A,D). It is known that the Simpson index is more sensitive to species evenness than richness (DeJong, 1975).
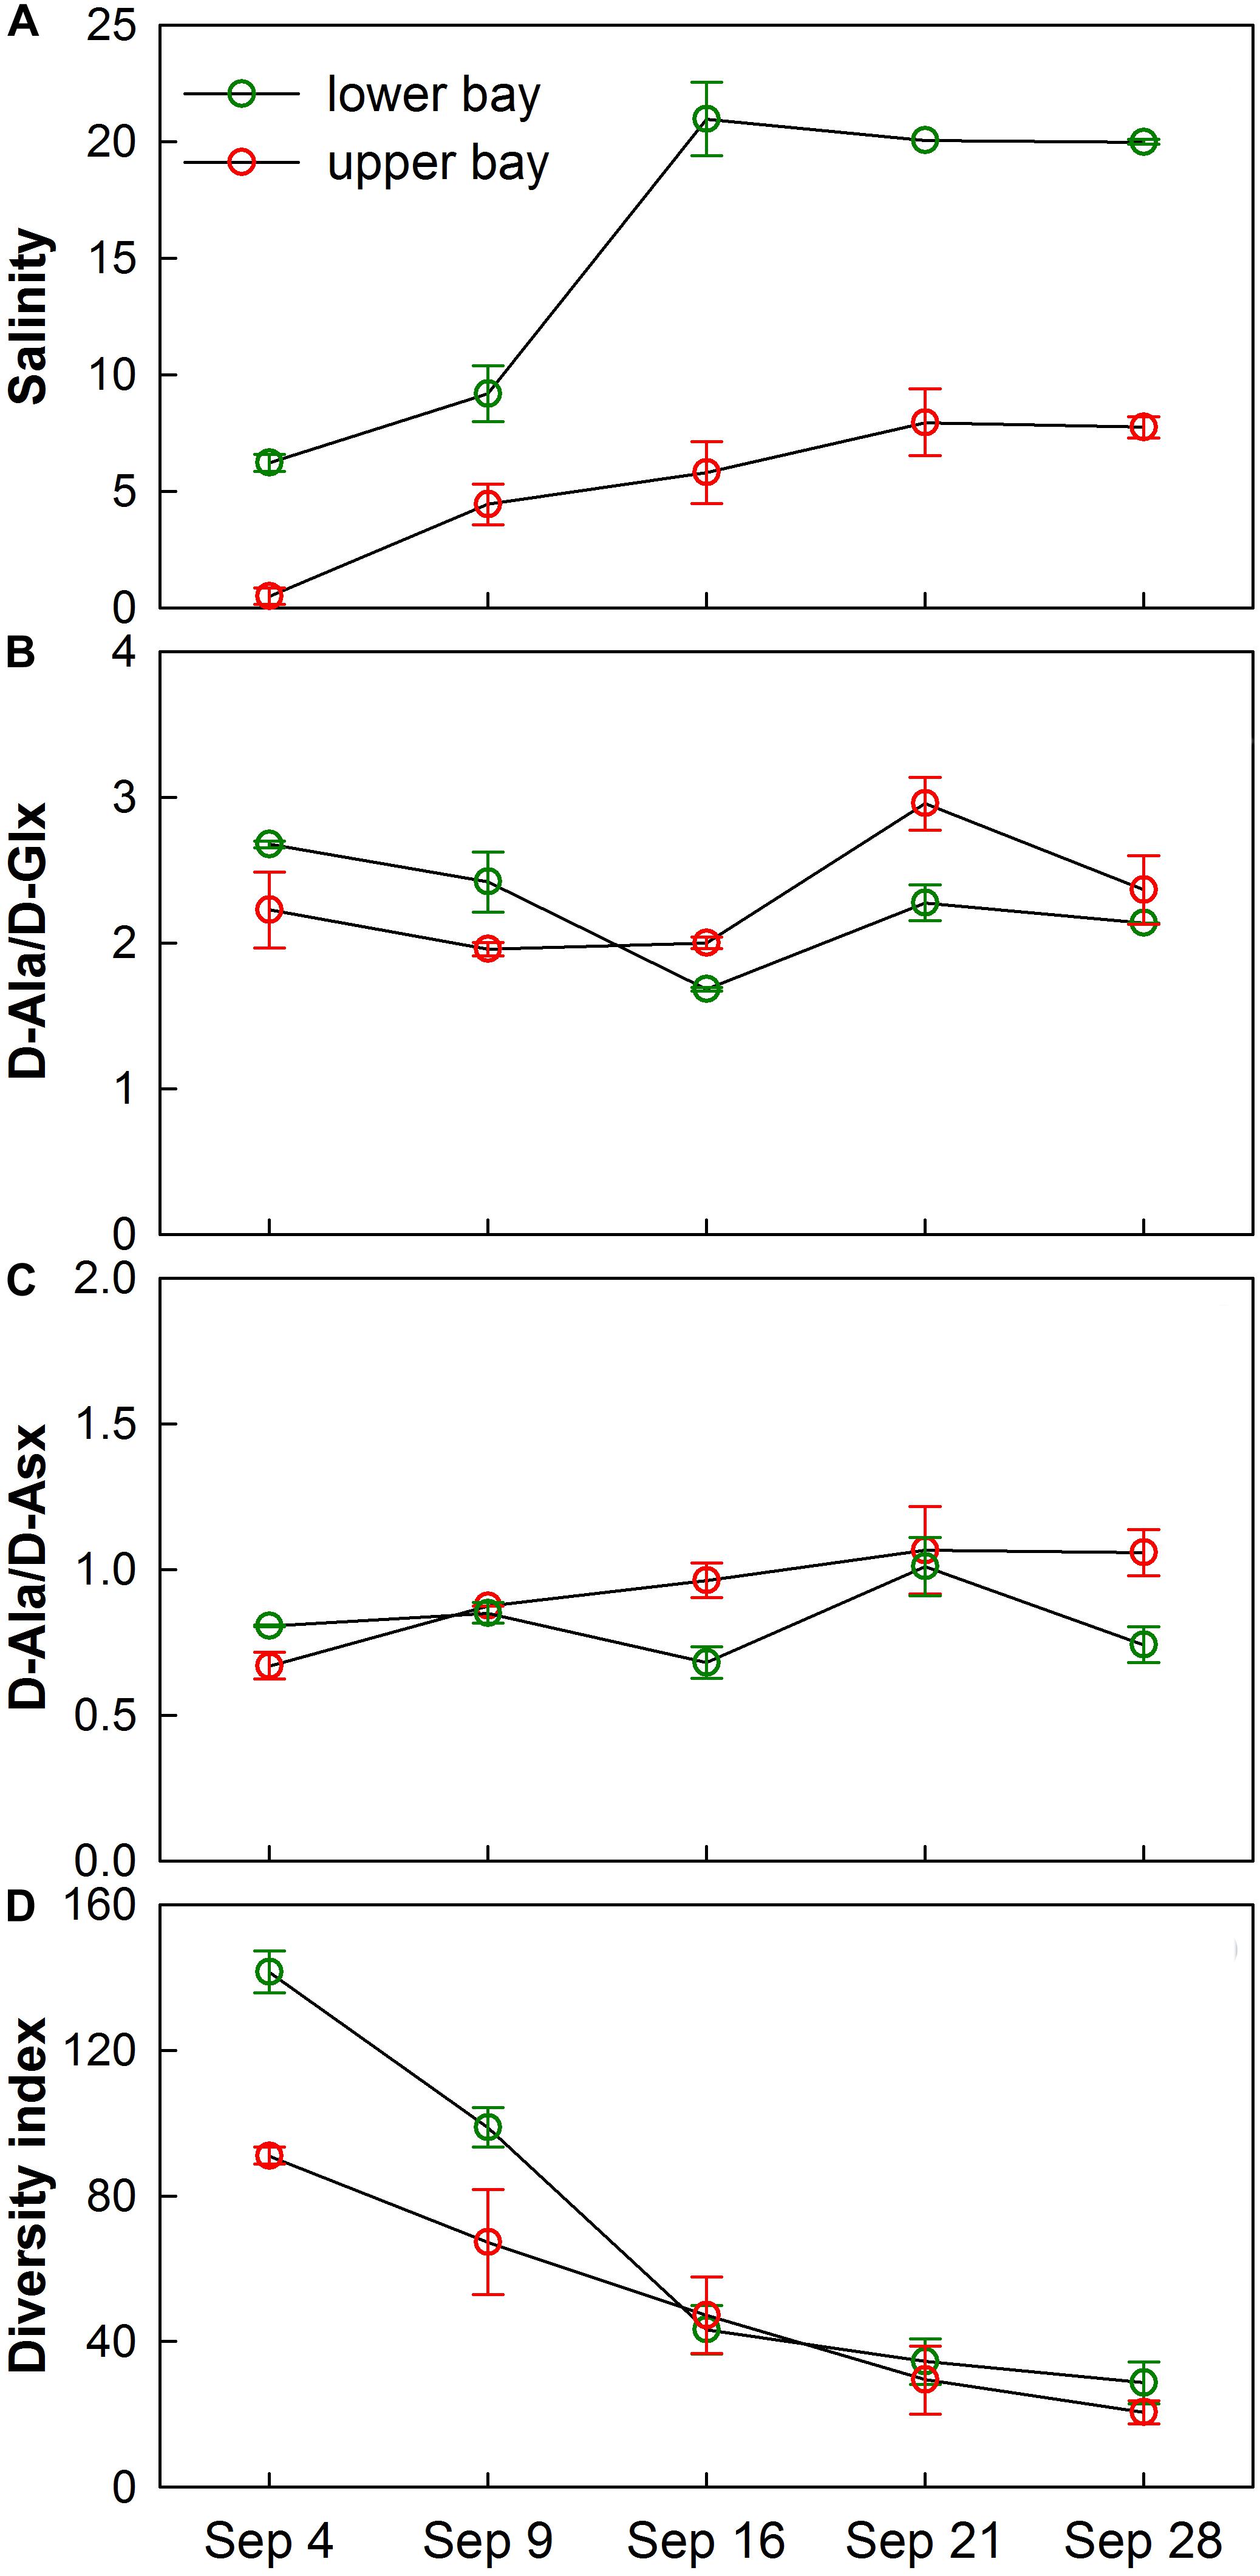
Figure 10. Temporal trends of average (A) salinity, (B) D-Ala/D-Glx, (C) D-Ala/D-Asx, and (D) Simpson’s Diversity Index for water samples collected in upper bay and lower bay during each cruise. Error bars show standard deviations.
Sampling of the microbial community identified gene content and prevalent metabolic pathway components by comparison against the SEED subsystem (Figure 11). Specific identified genes and metabolic traits showed large differences between the first 2 weeks compared to the last 2 weeks. During the first 2 weeks, enrichment in heterotrophic metabolisms such as degradation of aromatic, nitrogen and sulfur compounds were prevalent. In the last 2 weeks, metabolic traits were associated with photosynthesis and paralleled the high abundance of cyanobacteria.
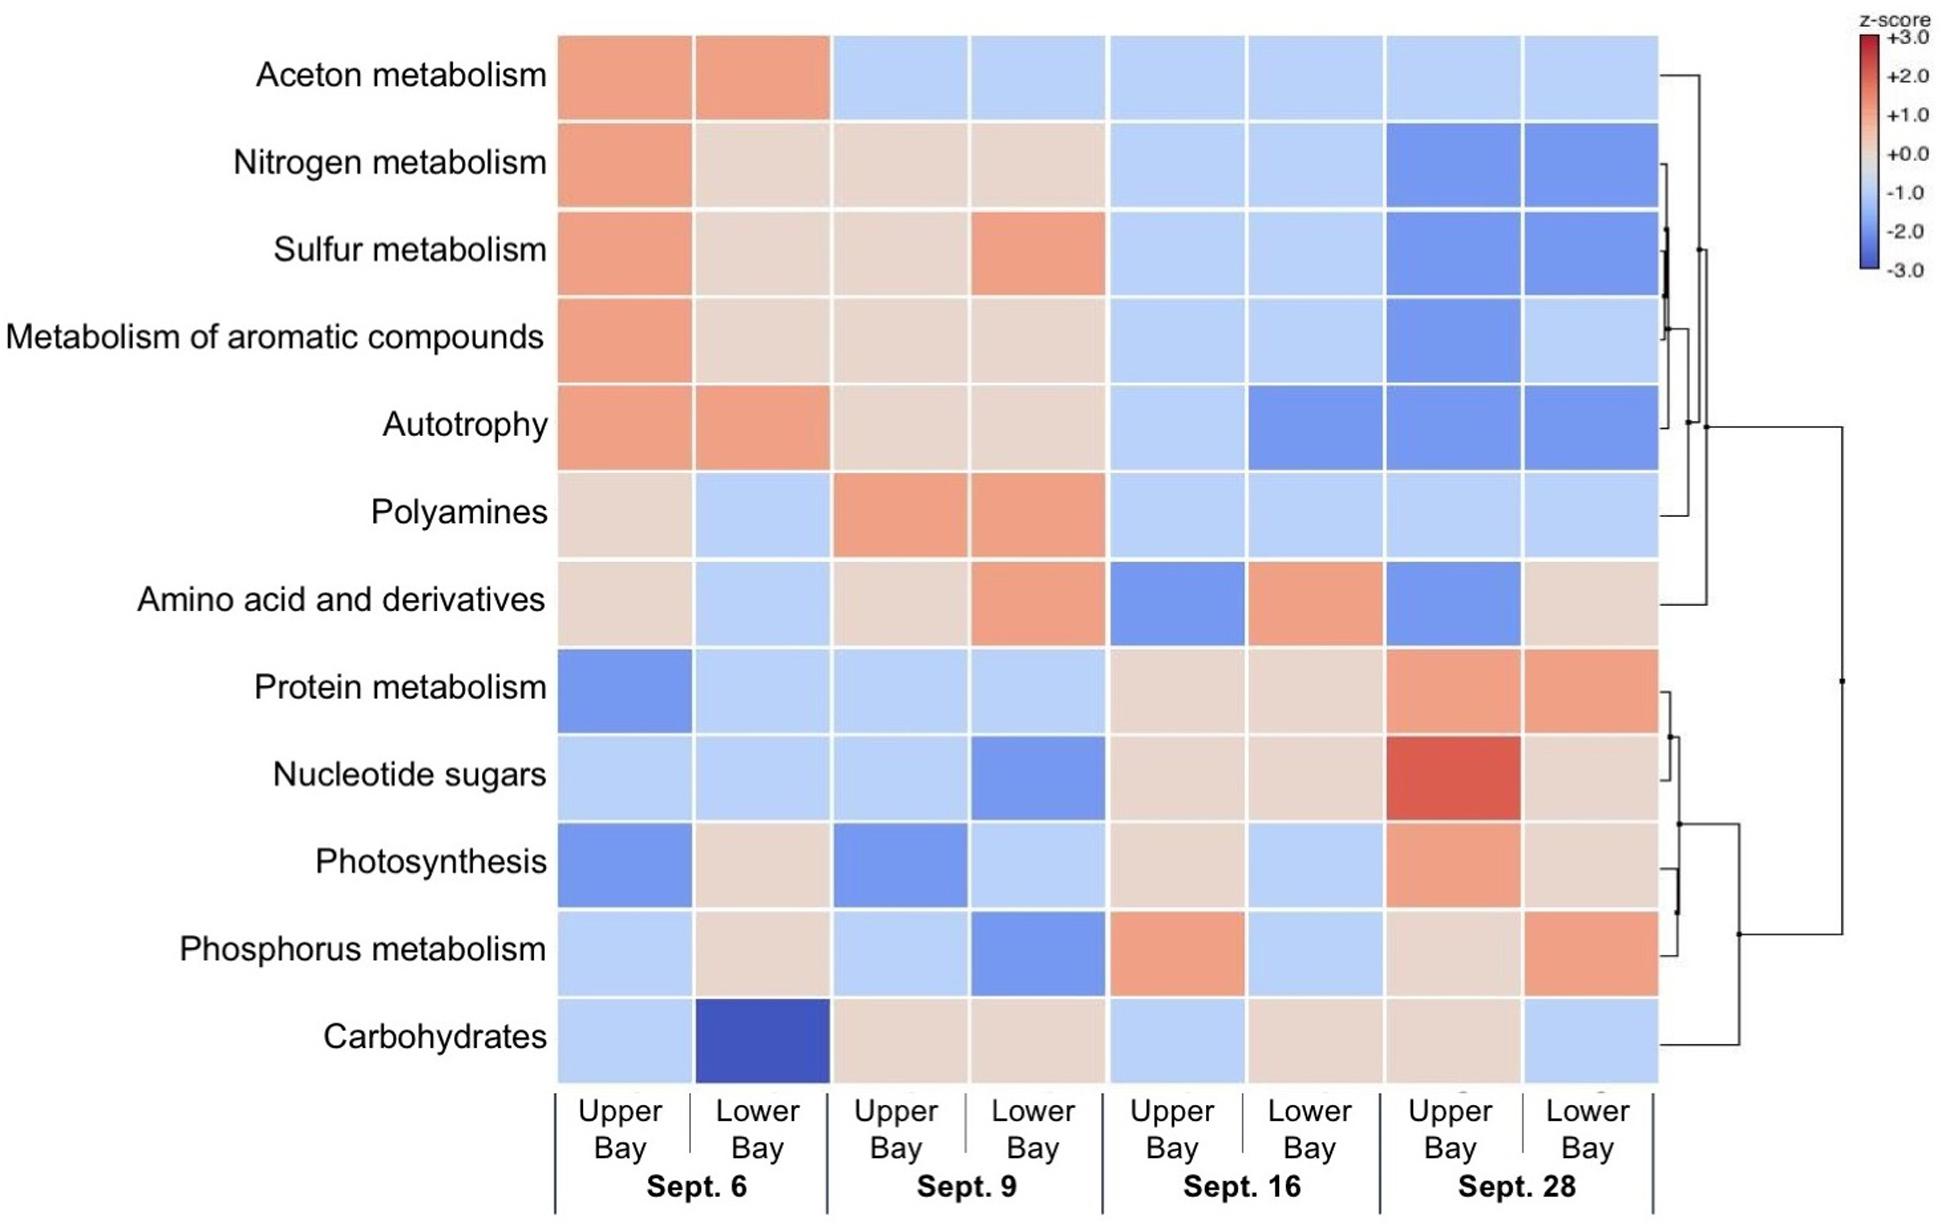
Figure 11. Heat map showing scores of gene expressions of the bacterial community in Galveston Bay after Hurricane Harvey.
Tropical cyclones are regular events that threaten coastal ecosystems and inland environments. Such environmental disturbances harm or benefit natural systems and biological life by profoundly altering biogeochemical processes, sediment distributions, and biological diversity (Sousa, 1984; Du et al., 2019b; Osburn et al., 2019; Steichen et al., 2020). As affected regions are home to almost ∼40% of the global population, cyclone activity, and impact are invariably linked to financial losses, loss of ecosystem services, dispersal of harmful chemicals from industries, or human fatalities and require proper preparation and analysis.
There is much debate on how climate change and human perturbations affect future storm activity and impact (Sobel et al., 2016). Physical considerations and model simulations predict an increase in storm severity and wetness as more heat and moisture is available (Trenberth et al., 2005, 2018). Observational records indicate hurricane-related flooding events have increased in severity and magnitude (Freeman et al., 2019; Paerl et al., 2019). Historic geological storm records linked increased hurricane intensity in the western North Atlantic to climate variability or the strength of the North Atlantic Meridional Overturning Circulation (Toomey et al., 2017). Fingerprints of a weakening circulation have been reported (Caesar et al., 2018), serving as a bellwether for these changes.
Hurricane Harvey described a realistic scenario of storm evolution in a warmer climate affecting an extremely urbanized and industrialized coastal environment. Hurricane Harvey’s path was erratic, reversing its course and making landfall twice, and producing record rain fall in less than a week. Major flooding was the main issue for the Houston/Galveston coastal region where the hurricane made the second landfall inundating low-lying urban and industrialized areas and briefly converting Galveston Bay into a freshwater system (see also Steichen et al., 2020). The following discussion sheds light on carbon cycling issues during such a unique hurricane event that may be representative of storms in the near future.
The input of tDOC to Galveston Bay for the entire storm event was 87 ± 18 Gg of DOC derived from terrigenous sources, of which the large majority (95%) was delivered within the first week. Error in the estimated DOC input resulted from the assumed DOC concentration of run-off (see methods) and variability in freshwater load estimates (Du et al., 2019a, b). The amount of tDOC input during the storm period represented the average annual tDOC load to Galveston Bay (Warnken and Santschi, 2004) and exceeded estimates of tDOC fluxes during previous hurricanes hitting the East Coast by up to 6 times (Avery et al., 2004; Osburn et al., 2019). For comparison, the tDOC flux for the storm event was equivalent to ∼3% of average annual tDOC export from the Mississippi-Atchafalaya River System (Shen et al., 2012), which supplies more than 80% of freshwater input to the northern Gulf of Mexico (Dunn, 1996).
Source ratios of syringyl (S), vanillyl (V), and cinnamyl (C) phenols in flood-derived tDOC were typical of leached organic matter from non-woody tissues (e.g., leaves and grasses) of angiosperm vegetation. Remarkably, source composition of tDOC did not change substantially post-flood as indicated by relatively invariant S/V and C/V ratios. The remaining variability among lignin phenol source ratios could be attributed to diagenetic alterations of terrestrial macromolecules that was supported by increasing P/V ratios (Hernes et al., 2007). For comparison, similar S/V ratios were measured in adjacent rivers such as the Brazos River and Mississippi River (0.78–0.90), but C/V ratios were elevated compared to both of these rivers emphasizing the dominance of non-woody tissues in flood-derived tDOC (Shen et al., 2012; Yan and Kaiser, 2018b).
Polluted storm runoff from urbanized and industrialized areas contributes an additional source of DOM to estuaries (McGrane et al., 2016; Freeman et al., 2019; Steichen et al., 2020). Floodwaters quickly overwhelmed wastewater infrastructure and released an estimated 30 million gallons of untreated sewage (Environment Texas Research and Policy Center, 2017). In addition, spills of gasoline and crude oil among other industrial chemicals occurred from numerous chemical and tank facilities that were swept along with flood waters. The quantity of these inputs was poorly resolved as only few measurements were performed. Microbial community analysis showed elevated levels of Escherichia coli, a fecal indicator, in Houston bayou waters and flooded residential areas immediately after the storm (Yu et al., 2018). Bay floodwaters sampled at the head of the bay during the first cruise had higher contributions of Sphingobacteria, which are common in activated sludge, but gut-associated bacteria (i.e., Enterobacteria and Firmicutes) were not elevated (Figure 9). At the same time, only low levels of common pharmaceuticals and polycyclic aromatic hydrocarbons (PAHs) were detected (Steichen et al., 2020). Sampling was initiated 4 day after overflowing wastewater treatment plants were reported by local news outlets suggesting the peak of untreated sewage release was not captured with this sample set.
While tDOC dominated the DOC pool during the first 2 weeks of sampling, a bloom event of diatoms, chlorophytes, and dinoflagellates fed by ample supply of nutrients and clearer surface waters during the third cruise (Steichen et al., 2020) lead to input of biolabile planktonic DOM and marked a transition to a DOM pool with variable contributions from terrestrial and in-situ derived DOM sources. The transition to a mixed DOM pool in the bay was indicated by higher amino acid yields and degradation index values, both robust indicators of biolabile DOM from phytoplankton exudation (Davis et al., 2009; Kaiser and Benner, 2009).
Yields of D-amino acids quickly increased as tDOC loss and input of DOC from a planktonic source was observed, demonstrating the enrichment of bacterial macromolecules and a close link between removal processes and microbial mineralization. Bacterially-derived DOC contributed 26 ± 4% of DOC within the first 2 weeks, and 37 ± 9% of DOC over remaining 2 weeks of sampling in the bay. The biological reactivity of this newly produced bacterial DOC included labile and refractory biomolecules (Kaiser and Benner, 2008). Although the majority of DOC from flooding and planktonic sources was presumably mineralized to CO2, the production of refractory DOC suggested that storm events can also contribute to the long-term storage of carbon and associated bioelements in the ocean.
Estimated decay constants indicated the rapid removal of storm-derived tDOC in the bay. In particular, the decay constant estimated for tDOC immediately after the storm was ∼3 times higher than decay constants observed for tDOC across high and low latitude environments (Figure 8; Kaiser et al., 2017a). Following the initial high loss of tDOC, the decay constant for tDOC over the latter 2 weeks quickly adjusted to the range of global tDOC decay constants. The rapid and presumed extensive mineralization of tDOC was likely linked to its high biolability, efficient removal processes, or both. The presence of some sewage-derived DOM may have contributed to the high removal efficiency of storm-derived DOC, although fresh plant leachates, and flood-derived DOM also exhibit high biolability (Holmes et al., 2008; Wickland et al., 2012; Harfmann et al., 2019).
Mechanisms of tDOC removal in ocean margins include sorption or flocculation, and mineralization by microbial and photochemical processes. Relatively low spectral slope values (S275–295, 0.0134–0.0187 nm−1) indicated minor exposure to solar radiation (Helms et al., 2008; Fichot and Benner, 2012). Likewise, (Ad/Al)V ratios were low (0.71–0.86) confirming microbial oxidation was the dominant mode of mineralization of tDOC. In the Northern Gulf of Mexico, where photochemical processes play an important role in the mineralization of DOM, (Ad/Al)V ratios were typically >2 (Hernes and Benner, 2003). Sorption was found to be of minor significance in the Mississippi River plume, but flocculation could have led to some loss of hydrophobic macromolecules (Benner and Opsahl, 2001; Hernes and Benner, 2003; Fichot and Benner, 2014).
As the microbial community played a dominant role in the mineralization of storm-derived DOC, the diversity of microbial taxa and their metabolic capabilities were investigated to gain insights on controls of mineralization efficiency. River and estuarine systems show distinct shifts in bacterial communities driven by flow regime and the composition of organic matter to benefit from pulses of biolabile DOM (Crump et al., 2009; Kaiser et al., 2017b). Driven by floodwaters, the microbial community completely changed after the hurricane and resembled communities typical for rivers and soil environments (Figure 9; Steichen et al., 2020). Synchronous to the shift in microbial communities and the massive tDOC input, heterotrophic metabolisms dominated during the first 2 weeks of sampling. In particular, the enrichment of genes for the decomposition of aromatic compounds was evident immediately after the storm when mineralization was highest. This suggested the enzymatic capabilities of the microbial community were well tuned to the chemical composition of the existing DOM pool that was dominated by aromatic moieties in lignin and tannin-type structures. At the same time, high microbial diversity potentially promoted metabolic efficiency and energy harvesting through microbial cooperation (Coyte et al., 2015).
With the transition of the DOM pool to a mixture of tDOC and planktonic DOM, enrichment in protein, nucleotide and nucleoside, RNA, DNA, and carbohydrate metabolisms demonstrated a domain shift in the functional gene repertoire and metabolic potential. In addition, gene sequences for aromatic compound metabolism were vastly reduced or absent as microbial communities adjusted to changing chemical composition of the DOM pool and took advantage of biolabile planktonic DOM sources. Remaining terrigenous macromolecules were diagenetically altered as indicated by elevated P/V ratios. Together with the absence of genes for aromatic compound metabolism, this may explain the lower removal efficiency of tDOC as time progressed.
Given the large export of tDOC during the storm event, the presumed mineralization of tDOC potentially resulted in a large flux of CO2 from Galveston Bay and adjacent coastal shelf. High freshwater discharge during the flood event quickly delivered tDOC to the bay and shelf areas. For calculation of total CO2 from the presumed mineralization of tDOC it was assumed mineralization efficiencies were similar in the bay and on the coastal shelf. In the bay microbial processes dominated the mineralization of tDOC. Higher light availability in the shelf mixed layer could have could have led to enhanced biomineralization from photochemical processes (Fichot and Benner, 2014).
Within 1 month, 68 ± 15% of tDOC or 65 ± 15 Gg was mineralized, of which 57 ± 10% occurred within the first 2 weeks, and 11 ± 5% over the remaining 2 weeks. The extent of tDOC removal substantially exceeded removal efficiencies of tDOC observed in ocean margins (∼50% per year) (Fichot et al., 2014; Kaiser et al., 2017a) or spring flood-derived DOC of Arctic rivers (17–53% over 1–3 month) (Holmes et al., 2008; Wickland et al., 2012). This suggested hurricanes impose unique conditions on biogeochemical cycles in the coastal zones and affect the connectivity between terrestrial and aquatic ecosystems.
Recent hurricanes have carried a climatic fingerprint and had a profound impact on human infrastructure and coastal ecosystems. Observations made during heavy flooding by Hurricane Harvey in the Houston/Galveston watershed showed the majority (68 ± 15%) of flood plain-derived DOC was removed in bay and shelf waters within 1 month. The high biolability of this mobilized DOC was mainly linked to freshly-leached plant-derived organic matter and an active microbial community with functional gene repertoires. Intense microbial processing of flood-derived DOC contributed to both mineralization and production of biorefractory DOM, affecting feedback mechanisms within the coastal and ocean carbon cycle. The efficient mineralization of flood-derived DOC suggests hurricane-induced flood events alter net CO2 exchange and nutrient budgets in estuarine watersheds and coastal seas.
rRNA sequences can be found in the GenBank Sequence Read Archive under the accession number PRJNA558756. Metagenomic data are available through the BCO-DMO portal at https://www.bco-dmo.org/project/750430. Data are publicly available through the Gulf of Mexico Research Initiative Information and Data Cooperative (GRIIDC) at http://data.gulfresearchinitative.org (doi: 10.7266/PGC99C7D).
GY, KK, and JL collected the samples onboard RV Trident. GY conducted DOC, lignin, amino acids, and UV-Vis absorbance analysis. JL performed rRNA gene and metagenomic sequencing analysis. KK and GY wrote the manuscript with comments and inputs from AQ and JL.
This work was supported by NSF grant 1333633 to KK, a NSF grant 1801367 to JL, and by a grant from The Gulf of Mexico Research Initiative to support consortium research entitled ADDOMEx (Aggregation and Degradation of Dispersants and Oil by Microbial Exopolymers), SA15-22 to AQ. Funds from the Hundred Talent Program of the Chinese Academy of Sciences (Y990030101, GY) supported part of the publication charges.
The authors declare that the research was conducted in the absence of any commercial or financial relationships that could be construed as a potential conflict of interest.
We thank Amanda Sterne, Laura Leonard, Jamie Steichen, and Rachel Windham and the captain and crew of the R/V Trident for assistance with sample collection.
The Supplementary Material for this article can be found online at: https://www.frontiersin.org/articles/10.3389/fmars.2020.00248/full#supplementary-material
Avery, G. B., Kieber, R. J., Willey, J. D., Shank, G. C., and Whitehead, R. F. (2004). Impact of hurricanes on the flux of rainwater and Cape Fear river water dissolved organic carbon to Long Bay, southeastern United States. Glob. Biogeochem. Cycles 18:GB3085. doi: 10.1029/2004GB002229
Balmonte, J. P., Arnosti, C., Underwood, S., McKee, B. A., and Teske, A. (2016). Riverine bacterial communities reveal environmental disturbance signatures within the Betaproteobacteria and Verrucomicrobia. Front. Microbiol. 7:1441. doi: 10.3389/fmicb.2016.01441
Bauer, J. E., Cai, W., Raymond, P. A., Bianchi, T. S., Hopkinson, C. S., and Regnier, P. A. G. (2013). The changing carbon cycle of the coastal ocean. Nature 504, 61–70. doi: 10.1038/nature12857
Bender, M. A., Knutson, T. R., Tuleya, R. E., Sirutis, J. J., Vecchi, G. A., Garner, S. T., et al. (2010). Modeled impact of anthropogenic warming on the frequency of intense Atlantic hurricanes. Science 327, 454–458. doi: 10.1126/science.1180568
Benner, R., and Opsahl, S. (2001). Molecular indicators of the sources and transformations of dissolved organic matter in the Mississippi River plume. Org. Geochem. 32, 597–611. doi: 10.1016/s0146-6380(00)00197-2
Bianchi, T. S., Garcia-Tigreros, F., Yvon-Lewis, S. A., Shields, M., Mills, H. J., Butman, D., et al. (2013). Enhanced transfer of terrestrially derived carbon to the atmosphere in a flooding event. Geophys. Res. Lett. 40, 116–122. doi: 10.1029/2012GL054145
Buchfink, B., Xie, C., and Huson, D. H. (2015). Fast and sensitive protein alignment using DIAMOND. Nat. Methods 12, 59–60. doi: 10.1038/nmeth.3176
Caesar, L., Rahmstorf, S., Robinson, A., Feulner, G., and Saba, V. (2018). Observed fingerprint of a weakening Atlantic ocean overturning circulation. Nature 556:191. doi: 10.1038/s41586-018-0006-5
Cai, W.-J., Dai, M., Wang, Y., Zhai, W., Huang, T., Chen, S., et al. (2004). The biogeochemistry of inorganic carbon and nutrients in the Pearl river estuary and the adjacent Northern South China sea. Cont. Shelf Res. 24, 1301–1319. doi: 10.1016/j.csr.2004.04.005
Coyte, K. Z., Schluter, J., and Foster, K. R. (2015). The ecology of the microbiome: networks, competition, and stability. Science 350, 663–666. doi: 10.1126/science.aad2602
Crosswell, J. R., Wetz, M. S., Hales, B., and Paerl, H. W. (2014). Extensive CO2 emissions from shallow coastal waters during passage of Hurricane Irene (August 2011) over the mid-Atlantic Coast of the U.S.A. Limnol. Oceanogr. 59, 1651–1665. doi: 10.4319/lo.2014.59.5.1651
Crump, B. C., Peterson, B. J., Raymond, P. A., Amon, R. M. W., Rinehart, A., McClelland, J. W., et al. (2009). Circumpolar synchrony in big river bacterioplankton. Proc. Natl. Acad. Sci. U.S.A. 106, 21208–21212. doi: 10.1073/pnas.0906149106
Dauwe, B., Middelburg, J. J., Herman, P. M. J., and Heip, C. H. R. (1999). Linking diagenetic alteration of amino acids and bulk organic matter reactivity. Limnol. Oceanogr. 44, 1809–1814. doi: 10.4319/lo.1999.44.7.1809
Davis, J., Kaiser, K., and Benner, R. (2009). Amino acid and amino sugar yields and compositions as indicators of dissolved organic matter diagenesis. Org. Geochem 40, 343–352. doi: 10.1016/j.orggeochem.2008.12.003
DeJong, T. M. (1975). A comparison of three diversity indices based on their components of richness and evenness. Oikos 26, 222–227. doi: 10.2307/3543712
Du, J., Park, K., Dellapenna, T. M., and Clay, J. M. (2019a). Corrigendum to “dramatic hydrodynamic and sedimentary responses in Galveston Bay and adjacent inner shelf to hurricane Harvey” [Sci. Total Environ. 653, 554–564]. Sci. Total Environ. 697:134219. doi: 10.1016/j.scitotenv.2019.134219
Du, J., Park, K., Dellapenna, T. M., and Clay, J. M. (2019b). Dramatic hydrodynamic and sedimentary responses in Galveston Bay and adjacent inner shelf to Hurricane Harvey. Sci. Total Environ. 653, 554–564. doi: 10.1016/j.scitotenv.2018.10.403
Du, J., Park, K., Yu, X., Zhang, Y. J., and Ye, F. (2019c). Massive pollutants released to Galveston Bay during Hurricane Harvey: understanding their retention and pathway using Lagrangian numerical simulations. Sci. Total Environ. 704:135364. doi: 10.1016/j.scitotenv.2019.135364
Duarte, C., Middleburg, J., and Caraco, N. (2005). Major role of marine vegetation on the ocean carbon cycle. Biogeosciences 2, 1–8. doi: 10.5194/bg-2-1-2005
Dunn, D. D. (1996). Trends in Nutrient Inflows to the Gulf of Mexico from Streams Draining the Conterminous United States, 1972–1993. Water-Resources Investigations Report 96-4113. Austin, TX: USGS.
Emanuel, K. (2017). Assessing the present and future probability of Hurricane Harvey’s rainfall. Proc. Natl. Acad. Sci. U.S.A. 114, 12681–12684. doi: 10.1073/pnas.1716222114
Environment Texas Research and Policy Center (2017). Raw SewageReleased by Hurricane Harvey. Available online at: https://environmenttexascenter.org/ (accessed May, 2019).
Fichot, C. G., and Benner, R. (2012). The spectral slope coefficient of chromophoric dissolved organic matter (S275–295) as a tracer of terrigenous dissolved organic carbon in river-influenced ocean margins. Limnol. Oceanogr. 57, 1453–1466. doi: 10.4319/lo.2012.57.5.1453
Fichot, C. G., and Benner, R. (2014). The fate of terrigenous dissolved organic carbon in a river-influenced ocean margin. Global Biogeochem. Cycles 28, 300–318. doi: 10.1002/2013GB004670
Fichot, C. G., Lohrenz, S. E., and Benner, R. (2014). Pulsed, cross-shelf export of terrigenous dissolved organic carbon to the Gulf of Mexico. J. Geophys. Res. Ocean. 119, 1176–1194. doi: 10.1002/2013JC009424
Freeman, L. A., Corbett, D. R., Fitzgerald, A., Lemley, D. A., Quigg, A., and Steppe, C. (2019). Impacts of urbanization on estuarine ecosystems and water quality. Estuaries Coast. 42, 1821–1838. doi: 10.1007/s12237-019-00597-z
Galveston Bay National Estuary Program (1994). “The state of the Bay: a characterization of the Galveston Bay ecosystem,” in Proceedings of the Galveston Bay National Estuary Program GBNEP-44, (Austin, TX: University of Texas).
Godin, P., Macdonald, R. W., Kuzyk, Z. Z. A., Goñi, M. A., and Stern, G. A. (2017). Organic matter compositions of rivers draining into Hudson Bay: present-day trends and potential as recorders of future climate change. J. Geophys. Res. Biogeosci. 122, 1848–1869. doi: 10.1002/2016JG003569
Goñi, M. A., and Hedges, J. I. (1995). Sources and reactivities of marine-derived organic matter in coastal sediments as determined by alkaline CuO oxidation. Geochim. Cosmochim. Acta 59, 2965–2981. doi: 10.1016/0016-7037(95)00188-3
Green, M. R., and Sambrook, J. (2017). Isolation of high-molecular-weight DNA using organic solvents. Cold Spring Harb. Protoc. 2017, 356–359. doi: 10.1101/pdb.prot093450
Harfmann, J. L., Guillemette, F., Kaiser, K., Spencer, R., Chuang, C.-Y., and Hernes, P. (2019). Convergence of terrestrial dissolved organic matter composition and the role of microbial buffering in aquatic ecosystems. J. Geophys. Res. Biogeosci. 124, 3125–3142. doi: 10.1029/2018jg004997
He, B., Dai, M., Zhai, W., Wang, L., Wang, K., Chen, J., et al. (2010). Distribution, degradation and dynamics of dissolved organic carbon and its major compound classes in the Pearl River estuary, China. Mar. Chem. 119, 52–64. doi: 10.1016/j.marchem.2009.12.006
Hedges, J. I., and Mann, D. C. (1979). The characterization of plant tissues by their lignin oxidation products. Geochim. Cosmochim. Acta 43, 1803–1807. doi: 10.1016/0016-7037(79)90028-0
Helms, J. R., Stubbins, A., Ritchie, J. D., Minor, E. C., Kieber, D. J., and Mopper, K. (2008). Absorption spectral slopes and slope ratios as indicators of molecular weight, source, and photobleaching of chromophoric dissolved organic matter. Limnol. Oceanogr. 53, 955–969. doi: 10.4319/lo.2008.53.3.0955
Hernes, P., and Benner, R. (2003). Photochemical and microbial degradation of dissolved lignin phenols: implications for the fate of terrigenous dissolved organic matter in marine environments. J. Geophys. Res. 108:3291. doi: 10.1029/2002JC001421
Hernes, P. J., Robinson, A. C., and Aufdenkampe, A. K. (2007). Fractionation of lignin during leaching and sorption and implications for organic matter “freshness”. Geophys. Res. Lett. 34:L17401. doi: 10.1029/2007GL031017
Holmes, R. M., McClelland, J. W., Raymond, P. A., Frazer, B. B., Peterson, B. J., and Stieglitz, M. (2008). Lability of DOC transported by Alaskan rivers to the Arctic Ocean. Geophys. Res. Lett. 35:L03402. doi: 10.1029/2007GL032837
Hounshell, A. G., Rudolph, J. C., Van Dam, B. R., Hall, N. S., Osburn, C. L., and Paerl, H. W. (2019). Extreme weather events modulate processing and export of dissolved organic carbon in the Neuse River Estuary, NC. Estuar. Coast. Shelf Sci. 219, 189–200. doi: 10.1016/j.ecss.2019.01.020
Huson, D., Mitra, S., and Ruscheweyh, H. (2011). Integrative analysis of environmental sequences using MEGAN4. Genome Res. 21, 1552–1560. doi: 10.1101/gr.120618.111.Freely
Hyatt, D., Chen, G. L., Locascio, P. F., Land, M. L., Larimer, F. W., and Hauser, L. J. (2010). Prodigal: prokaryotic gene recognition and translation initiation site identification. BMC Bioinform. 11:119. doi: 10.1186/1471-2105-11-119
Kaiser, K., and Benner, R. (2005). Hydrolysis-induced racemization of amino acids. Limnol. Oceanogr. 3, 318–325. doi: 10.4319/lom.2005.3.318
Kaiser, K., and Benner, R. (2008). Major bacterial contribution to the ocean reservoir of detrital organic carbon and nitrogen. Limnol. Oceanogr. 53, 99–112. doi: 10.4319/lo.2008.53.1.0099
Kaiser, K., and Benner, R. (2009). Biochemical composition and size distribution of organic matter at the Pacific and Atlantic time-series stations. Mar. Chem. 113, 63–77. doi: 10.1016/j.marchem.2008.12.004
Kaiser, K., Benner, R., and Amon, R. M. W. (2017a). The fate of terrigenous dissolved organic carbon on the Eurasian shelves and export to the North Atlantic. J. Geophys. Res. Oceans 122, 4–22. doi: 10.1002/2016JC012380
Kaiser, K., Canedo-Oropeza, M., McMahon, R., and Amon, R. M. W. (2017b). Origins and transformations of dissolved organic matter in large Arctic rivers. Sci. Rep. 7:13064. doi: 10.1038/s41598-017-12729-1
Kozich, J. J., Westcott, S. L., Baxter, N. T., Highlander, S. K., and Schloss, P. D. (2013). Development of a dual-index sequencing strategy and curation pipeline for analyzing amplicon sequence data on the MiSeq illumina sequencing platform. Appl. Environ. Microbiol. 79, 5112–5120. doi: 10.1128/AEM.01043-13
Lehmann, J., Coumou, D., and Frieler, K. (2015). Increased record-breaking precipitation events under global warming. Clim. Chang. 132, 501–515. doi: 10.1007/s10584-015-1434-y
Li, D., Liu, C. M., Luo, R., Sadakane, K., and Lam, T. W. (2015). MEGAHIT: an ultra-fast single-node solution for large and complex metagenomics assembly via succinct de Bruijn Graph. Bioinformatics 31, 1674–1676. doi: 10.1093/bioinformatics/btv033
McGrane, S. J., Hutchins, M. G., Miller, J. D., Bussi, G., Kjeldsen, T. R., and Loewenthal, M. (2016). During a winter of storms in a small UK catchment, hydrology and water quality responses follow a clear rural-urban gradient. J. Hydr. 545, 463–477. doi: 10.1016/j.jhydrol.2016.12.037
Najjar, R. G., Herrmann, M., Alexander, R., Boyer, E. W., Burdige, D. J., Butman, D., et al. (2018). Carbon budget of tidal wetlands, estuaries, and shelf waters of eastern North America. Glob. Biogeochem. Cycles 32, 389–416. doi: 10.1002/2017GB005790
Neumann, B., Vafeidis, A. T., Zimmermann, J., and Nicholls, R. J. (2015). Future coastal population growth and exposure to sea-level rise and coastal flooding – a global assessment. PLoS One 10:e0118571. doi: 10.1371/journal.pone.0118571
Officer, C. B. (1979). Discussion of the behaviour of nonconservative dissolved constituents in estuaries. Estuar. Coast. Mar. Sci. 9, 91–94. doi: 10.1016/0302-3524(79)90009-4
Osburn, C. L., Handsel, L. T., Mikan, M. P., Paerl, H. W., and Montgomery, M. T. (2012). Fluorescence tracking of dissolved and particulate organic matter quality in a river-dominated estuary. Environ. Sci. Technol. 46, 8628–8636. doi: 10.1021/es3007723
Osburn, C. L., Rudolph, J. C., Paerl, H. W., Hounshell, A. G., and Van Dam, B. R. (2019). Lingering carbon cycle effects of Hurricane Matthew in North Carolina’s coastal waters. Geophys. Res. Lett. 46, 2654–2661. doi: 10.1029/2019GL082014
Paerl, H. W., Hall, N. S., Hounshell, A. G., Luettich, R. A., Roddignol, K. L., Osburn, C. L., et al. (2019). Recent increase in catastrophic tropical cyclone flooding in coastal North Carolina, USA: long-term observations suggest a regime shift. Sci. Rep. 9:10620. doi: 10.1038/s41598-019-46928-9
Parada, A. E., Needham, D. M., and Fuhrman, J. A. (2016). Every base matters: assessing small subunit RRNA primers for marine microbiomes with mock communities, time series and global field samples. Environ. Microbiol. 18, 1403–1414. doi: 10.1111/1462-2920.13023
Rayson, M. D., Gross, E. S., Hetland, R. D., and Fringer, O. B. (2016). Time scales in Galveston Bay: an unsteady estuary. J. Geophys. Res. Oceans 121, 2268–2285. doi: 10.1002/2015JC011181
Regnier, P., Friedlingstein, P., Clais, P., Mackenzie, F. T., Gruber, N., Janssens, A. I., et al. (2013). Anthropogenic perturbation of the carbon fluxes from land to ocean. Nat. Geosci. 6, 597–607. doi: 10.1038/ngeo1830
Schloss, P. D., Westcott, S. L., Ryabin, T., Hall, J. R., Hartmann, M., Hollister, E. B., et al. (2009). Introducing Mothur: open-source, platform-independent, community-supported software for describing and comparing microbial communities. Appl. Environ. Microbiol. 75, 7537–7541. doi: 10.1128/AEM.01541-09
Shen, Y., Fichot, C. G., and Benner, R. (2012). Floodplain influence on dissolved organic matter export from the low Mississippi-Atchafalaya river system to the Gulf of Mexico. Limnol. Oceanogr. 57, 1149–1160. doi: 10.4319/lo.2012.57.4.1149
Sobel, A. H., Camargo, S. J., Hall, T. M., Lee, C.-Y., Tippett, M. K., and Wing, A. A. (2016). Human influence on tropical cyclone intensity. Science 353, 242–246. doi: 10.1126/science.aaf6574
Sousa, W. P. (1984). The role of disturbance in natural communities. Ann. Rev. Ecol. Syst. 15, 353–391. doi: 10.1146/annurev.es.15.110184.002033
Spencer, R. G. M., Aiken, G. R., Wickland, K. P., Striegl, R. G., and Hernes, P. J. (2008). Seasonal and spatial variability in dissolved organic matter quantity and composition from the Yukon river basin, Alaska. Glob. Biogeochem. Cycles 22:GB4002. doi: 10.1029/2008GB003231
Steichen, J. L., Labonté, J. M., Windham, R., Hala, D., Kaiser, K., Setta, S., et al. (2020). Microbial, physical, and chemical changes in Galveston Bay following an extreme flooding event, Hurricane Harvey. Front. Mar. Sci. 7:186. doi: 10.3389/fmars.2020.00186
Toomey, M. R., Korty, R. L., Donnelly, J. P., van Hengstum, P. J., and Curry, W. B. (2017). Increased hurricane frequency near Florida during Younger Dryas Atlantic meridional overturning circulation slowdown. Geology 45, 1047–1050. doi: 10.1130/G39270.1
Trenberth, K. E., Fasullo, J., and Smith, L. (2005). Trends and variability in column-integrated atmospheric water vapor. Clim. Dyn. 24, 741–758. doi: 10.1007/s00382-005-0017-4
Trenberth, K. E., Cheng, L., Jacobs, P., Zhang, Y., and Fasullo, J. (2018). Hurricane Harvey links to ocean heat content and climate change adaptation. Earths Future 6, 730–744. doi: 10.1029/2018EF000825
Walters, W., Hyde, E. R., Berg-Lyons, D., Ackermann, G., Humphrey, G., Parada, A., et al. (2016). Improved bacterial 16S rRNA gene (V4 and V4-5) and fungal internal transcribed spacer marker gene primers for microbial community surveys. Msystems 1:e00009–15. doi: 10.1128/mSystems.00009-15
Warnken, K. W., and Santschi, P. H. (2004). Biogeochemical behavior of organic carbon in the Trinity river downstream of a large reservoir lake in Texas, USA. Sci. Total Environ. 329, 131–144. doi: 10.1016/j.scitotenv.2004.02.017
Wickland, K. P., Aiken, G. R., Butler, K., Dornblaser, M. M., Spencer, R. G. M., and Striegl, R. G. (2012). Biodegradability of dissolved organic carbon in the Yukon River and its tributaries: Seasonality and importance of inorganic nitrogen. Glob. Biogeochem. Cycles 26:GB0E03. doi: 10.1029/2012GB004342
Yan, G., and Kaiser, K. (2018a). A rapid and sensitive method for the analysis of lignin phenols in environmental samples using ultra-high performance liquid chromatography-electrospray ionization-tandem mass spectrometry with multiple reaction monitoring. Anal. Chim. Acta 1023, 74–80. doi: 10.1016/j.aca.2018.03.054
Yan, G., and Kaiser, K. (2018b). Ultra-low sample volume cupric sulfate oxidation method for the analysis of dissolved lignin. Anal. Chem. 90, 9289–9295. doi: 10.1021/acs.analchem.8b01867
Yoon, B., and Raymond, P. A. (2012). Dissolved organic matter export from a forested watershed during Hurricane Irene. Geophys. Res. Lett. 39, 1–6. doi: 10.1029/2012GL052785
Keywords: terrigenous dissolved organic carbon, Hurricane Harvey, Galveston Bay, lignin phenols, mineralization, coastal carbon cycle, estuary
Citation: Yan G, Labonté JM, Quigg A and Kaiser K (2020) Hurricanes Accelerate Dissolved Organic Carbon Cycling in Coastal Ecosystems. Front. Mar. Sci. 7:248. doi: 10.3389/fmars.2020.00248
Received: 05 August 2019; Accepted: 30 March 2020;
Published: 22 April 2020.
Edited by:
Christopher Osburn, North Carolina State University, United StatesCopyright © 2020 Yan, Labonté, Quigg and Kaiser. This is an open-access article distributed under the terms of the Creative Commons Attribution License (CC BY). The use, distribution or reproduction in other forums is permitted, provided the original author(s) and the copyright owner(s) are credited and that the original publication in this journal is cited, in accordance with accepted academic practice. No use, distribution or reproduction is permitted which does not comply with these terms.
*Correspondence: Ge Yan, eWFuZ2UwMDU0NEBnbWFpbC5jb20=; Karl Kaiser, a2Fpc2Vya0B0YW11LmVkdQ==; a2Fpc2Vya0B0YW11Zy5lZHU=
Disclaimer: All claims expressed in this article are solely those of the authors and do not necessarily represent those of their affiliated organizations, or those of the publisher, the editors and the reviewers. Any product that may be evaluated in this article or claim that may be made by its manufacturer is not guaranteed or endorsed by the publisher.
Research integrity at Frontiers

Learn more about the work of our research integrity team to safeguard the quality of each article we publish.