 Fanny Girard
 Jozée Sarrazin
 Karine Olu
- Ifremer, EEP, F-29280, Plouzané, France
Cold seeps are widespread in the deep sea and, like other chemosynthesis-based ecosystems, often host high faunal biomass. Temporal changes at seeps have been inferred by comparing communities at different successional stages; nonetheless, temporal studies in seep ecosystems are rare. Using data collected as part of a benthic observatory, we characterized intra-annual microbial and faunal dynamics in a microbial mat habitat on the Håkon Mosby mud volcano (1256 m depth; Barents Sea), and evaluated the effects of a mud eruption on the biota. Video sequences recorded twice daily for 4.5 months with an autonomous imaging module were analyzed to quantify changes in microbial mat cover and megafaunal density and behavior. In addition, time series data for pressure, bottom currents, and seabed temperature were analyzed to characterize environmental changes. Of the five taxa observed on the video footage, the zoarcid Lycodes squamiventer, the pycnogonid Nymphon macronyx, and the skate Amblyraja hyperborea were the most common. Zoarcids made frequent incursions on microbial mats, but were more often documented on the adjacent sediments. The cyclic behavior of common trends identified between microbial mat cover, zoarcid densities, and abiotic variables using dynamic factor analysis suggested that seep ecosystem dynamics at the Håkon Mosby mud volcano may be modulated by tides and the activity of the volcano. Moreover, the eruption that occurred about 2 months after the start of the study had a significant impact on faunal densities, microbial activity, and environmental variables. The eruption was preceded by a steady increase in seabed temperatures, density of small holes (indicative of gas emissions), and microbial mat cover. It was followed by 3- and 5-fold increase in zoarcid and pycnogonid densities, respectively. To our knowledge, this study is the first to analyze intra-annual temporal data in a cold-seep ecosystem and to present data on the effects of a mud eruption on seep microbial and faunal dynamics. Overall, our results provide the first insight into ecosystem dynamics at a high-latitude cold seep and highlight the need to collect high-resolution temporal data to evaluate seep communities’ response to a warming Arctic and their potential role in mitigating methane emissions.
Introduction
The collection of temporal ecological data through monitoring has long been recognized as essential for science, policy and decision making, especially in the context of climate change and the overall increase in anthropogenic pressures (Goldsmith, 1991; Lovett et al., 2007; Costello et al., 2017). Likewise, the importance of temporal studies in the deep sea has been acknowledged since it has become clear that deep-sea environments are not as stable as initially thought (Smith, 1994; Glover et al., 2010). However, due to the challenges associated with working in the deep sea, the vast majority of temporal studies have focused on annual or multi-annual time scales (Glover et al., 2010). With the advent of open-ocean observatories, data on intra-annual changes in the deep sea are now becoming available, shedding light on the role of seasonality and tidal regimes on deep-sea ecosystems (Juniper et al., 2013; Cuvelier et al., 2014; Lelièvre et al., 2017; Chauvet et al., 2018). Despite progress made, some ecosystems such as cold-seep environments, remain largely underrepresented when it comes to high-resolution temporal studies.
Cold seeps occur worldwide along both active and passive margins (Sibuet and Olu, 1998). While they can form in a wide variety of geological settings, cold-seep ecosystems are generally fueled by the presence of sub-seafloor hydrocarbons, often in the form of methane. As methane migrates through the sediments, it is generally oxidized anaerobically by microbial consortia able to simultaneously reduce sulfate, resulting in the formation of hydrogen sulfide (Boetius et al., 2000; Niemann et al., 2006). In addition to producing reduced compounds, the activity of these microbial consortia often contributes to carbonate precipitation, providing hard substrata for the settlement of various species (Fisher et al., 2007). Therefore, cold seeps often host rich and abundant communities that rely on chemosynthetic primary production, and enhance biodiversity by increasing habitat heterogeneity (Sibuet and Roy, 2002; Levin, 2005; Cordes et al., 2010). Moreover, several studies have shown that seeps can be utilized by background (non-seep) fauna as a source of food (MacAvoy et al., 2002; Olu et al., 2009; Niemann et al., 2013; Seabrook et al., 2019), nursery grounds (Sen et al., 2019) or habitat for coral communities (Cordes et al., 2008), suggesting a large-scale influence of seep ecosystems in the deep sea (Levin et al., 2016).
Due to generally steady fluid emissions and the extremely high longevity estimated for several seep-associated species, cold seeps are often viewed as relatively stable environments (Bergquist et al., 2000; Smith et al., 2000; Durkin et al., 2017). As a result, most studies have characterized changes in seep communities by comparing communities hypothesized to represent different successional stages (e.g., based on the age of foundation species or authigenic carbonates) rather than analyzing temporal data (Bergquist et al., 2003; Cordes et al., 2005, 2006; Bowden et al., 2013). These chrono-sequencing studies have shown that successional trends at seeps are driven by fluid flow intensity and that a decrease in seepage rates generally results in a shift in community composition from domination by endemic primary consumers to non-endemic higher-order predators.
Overall, the few multi-annual temporal studies carried out at seeps showed little change in benthic communities over time, supporting the idea of cold seeps being stable environments (Lessard-Pilon et al., 2010; Marcon et al., 2014). However, despite the lack of significant changes in the total area covered by benthic organisms, these studies did note small to significant changes in the distributions of mussel beds between consecutive years (Lessard-Pilon et al., 2010) or of vesicomyid clam beds at the decadal scale (Marcon et al., 2014), suggesting variations in environmental conditions over the study periods. Moreover, another study has shown that chemosynthetic taxa can be significantly affected by natural disturbances such as phytodetritus deposition events or earthquakes (Nakajima et al., 2019). In fact, geological data suggest that cold seeps may not always be as stable as generally thought and that seep communities can be affected by episodic disturbing events including eruptions at mud volcanoes (Feseker et al., 2008; Foucher et al., 2010) or gas venting triggered by hydrate dissociation (MacDonald et al., 1994). Nevertheless, despite the evidence of significant temporal variability within seep ecosystems, no high-resolution data on intra-annual variations are available to date. Such data would be highly valuable, not only to evaluate seep community resilience to natural or anthropogenic disturbances, but also to better understand the links between seep communities and their geochemical environment. To fill this knowledge gap, the “Long-term Observations On Mud-volcano Eruptions” (LOOME) observatory was deployed in 2009 on the Håkon Mosby mud volcano (HMMV), representing the very first observatory operating in a deep cold-seep environment. The goals of the LOOME observatory were to understand the mechanisms of mud eruptions at HMMV, identify and describe warning signs, estimate the amount of gases (e.g., methane) emitted, and characterize the effects of these eruptions on geochemistry, faunal communities, and seabed morphology (Feseker et al., 2014b).
Håkon Mosby mud volcano is a 1 km wide active mud volcano located in the Barents Sea at 1256 m depth (Vogt et al., 1997). It is characterized by strong thermal and geochemical gradients from its center to its periphery resulting in a strict zonation of microbial activity and chemosynthetic habitats (Gebruk et al., 2003; De Beer et al., 2006; Niemann et al., 2006; Jerosch et al., 2007). Temperature gradients of up to 40°C/m below the surface and flow rates as high as 4 m/year have been documented within the active center of the volcano (Feseker et al., 2008). This active center hosts aerobic methanotrophic bacteria abundant in surface sediments and is characterized by the absence of anaerobic oxidation of methane (AOM), and thus of detectable sulfides (Niemann et al., 2006). The rim of the central habitat, directly surrounding the active center, is dominated by the presence of thick microbial mats (Jerosch et al., 2007). These mats, dominated by large filamentous Beggiatoa spp., are sustained by sulfide produced through AOM within the first 2–3 cm of the sediment (Niemann et al., 2006). Finally, the periphery of the volcano, where flow rates are the lowest, is dominated by two species of symbiont-bearing polychaetes of the genus siboglinidae identified as Oligobrachia haakonmosbiensis (Smirnov, 2000) and Sclerolinum contortum (Smirnov, 2000; Gebruk et al., 2003).
Overall, taxonomic diversity has been shown to decrease from the periphery to the center of HMMV, which is visibly devoid of epifauna. In particular, microbial mat habitats are characterized by a low diversity of both macro- and meiofauna (Van Gaever et al., 2006; Decker et al., 2012). With the exception of meiofauna, for which the highest densities have been measured in the microbial mat habitats, spatial patterns for faunal densities were similar to those for diversity, with a decrease in densities from the periphery to the center of the volcano (Gebruk et al., 2003; Van Gaever et al., 2006; Decker et al., 2012; Rybakova et al., 2013). Although the spatial distribution of faunal communities on HMMV is well-documented, no data on their temporal variability or response to the episodic mud eruptions suggested by several studies (Feseker et al., 2008; Foucher et al., 2010) have been published.
In this study, we used video footage recorded twice daily with an autonomous imaging module (AIM) designed at Ifremer and deployed as part of the LOOME observatory to characterize intra-annual variations in microbial mat cover and megafaunal density and behavior. A mud eruption occurred about 2 months after the deployment of the AIM (Feseker et al., 2014b), making it possible to record and analyze video footage before and after the eruption. The goals of this study were thus to both characterize temporal dynamics at HMMV and assess the impacts of an erupting event on seep communities and their environment.
Materials and Methods
Study Site and Data Acquisition
An autonomous imaging module (AIM) was deployed on July 25, 2009 during the ARKXXIV/2 expedition (RV Polarstern, ROV Quest) at a depth of 1256 m on HMMV (72° 0.312′ N, 14° 43.626′ E). It was positioned 60 m from the observatory frame, at the edge of the active center, in an area dominated by white microbial mats (Figure 1). The AIM consisted of a 4000 m rated video camera and two 35 W LED lights programmed to function while the camera was recording. Due to battery autonomy limitations, the camera was programmed to record two video sequences of 2 min each per day for a year. All video sequences were compressed in MPEG2 format and stored in the AIM. The AIM was then recovered on September 28, 2010 during the MSM16/2 expedition (RV Maria S. Merian, ROV Cherokee).
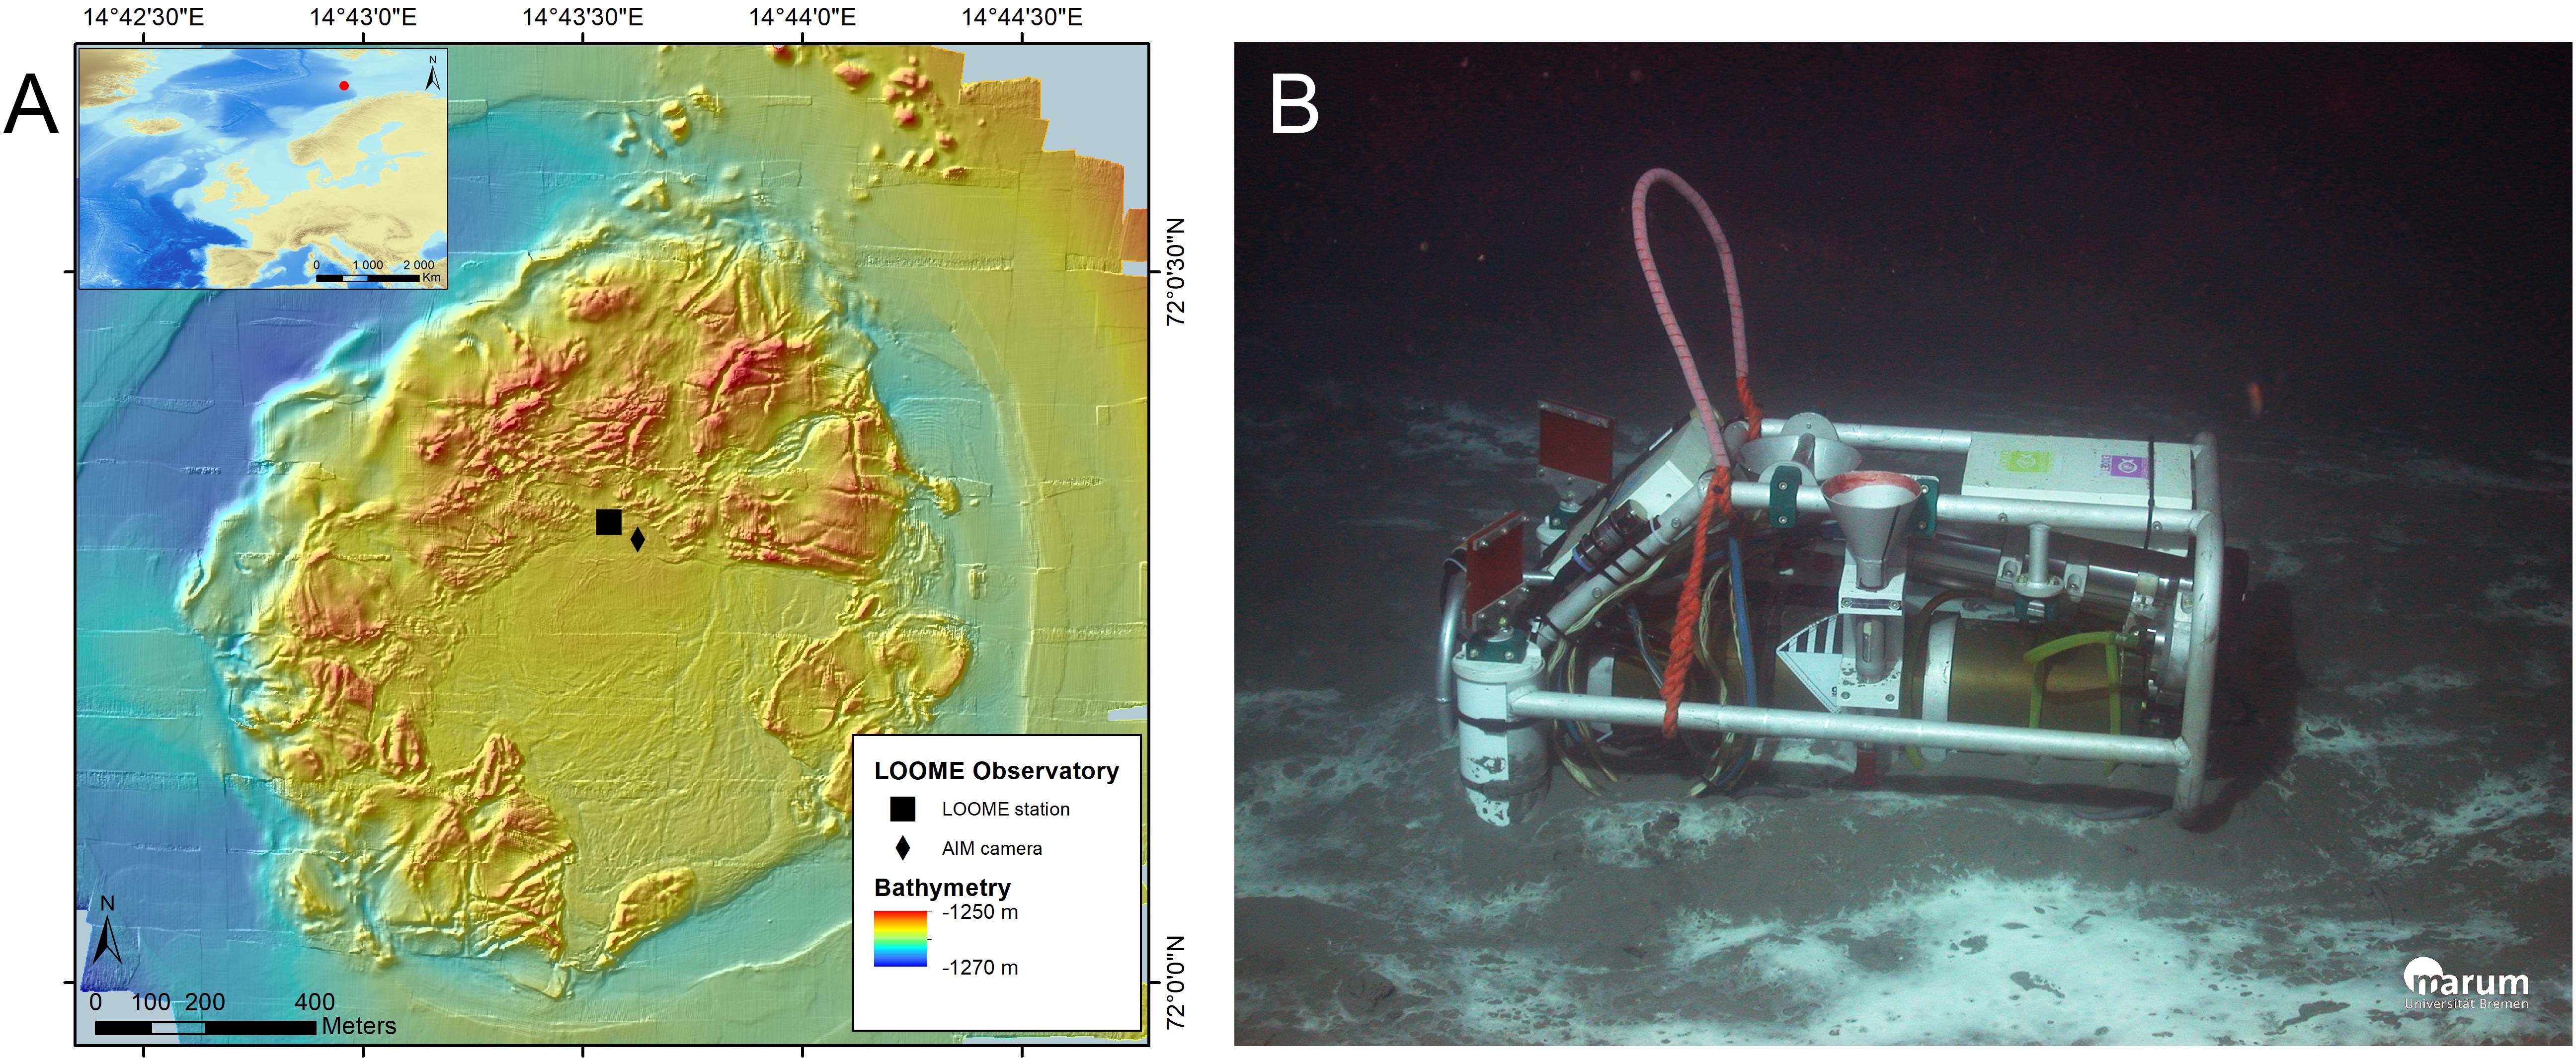
Figure 1. Study site overview. (A) Map showing the LOOME observatory frame (pressure sensor, current meter and thermistor 23) and autonomous imaging module (AIM) locations on the Håkon Mosby mud volcano. (B) Photo of the AIM on the seafloor just after its deployment in 2009.
Study Area
A total of 273 video sequences, corresponding to two sequences of 2 min each per day (one at 8:58 and a second at 20:58; Supplementary Videos 1–3) were recorded by the AIM for 4.5 months (until the battery ran out in December 2009). Video footage from the last month (October 22 to December 12, 2009) could not be analyzed because the AIM was displaced in the aftermath of the eruption and the camera ended up buried in the sediments. The first 120 video sequences were recorded prior to the mud eruption (before September 27, 2009) and the field of view was identical in all sequences (Figure 2A).
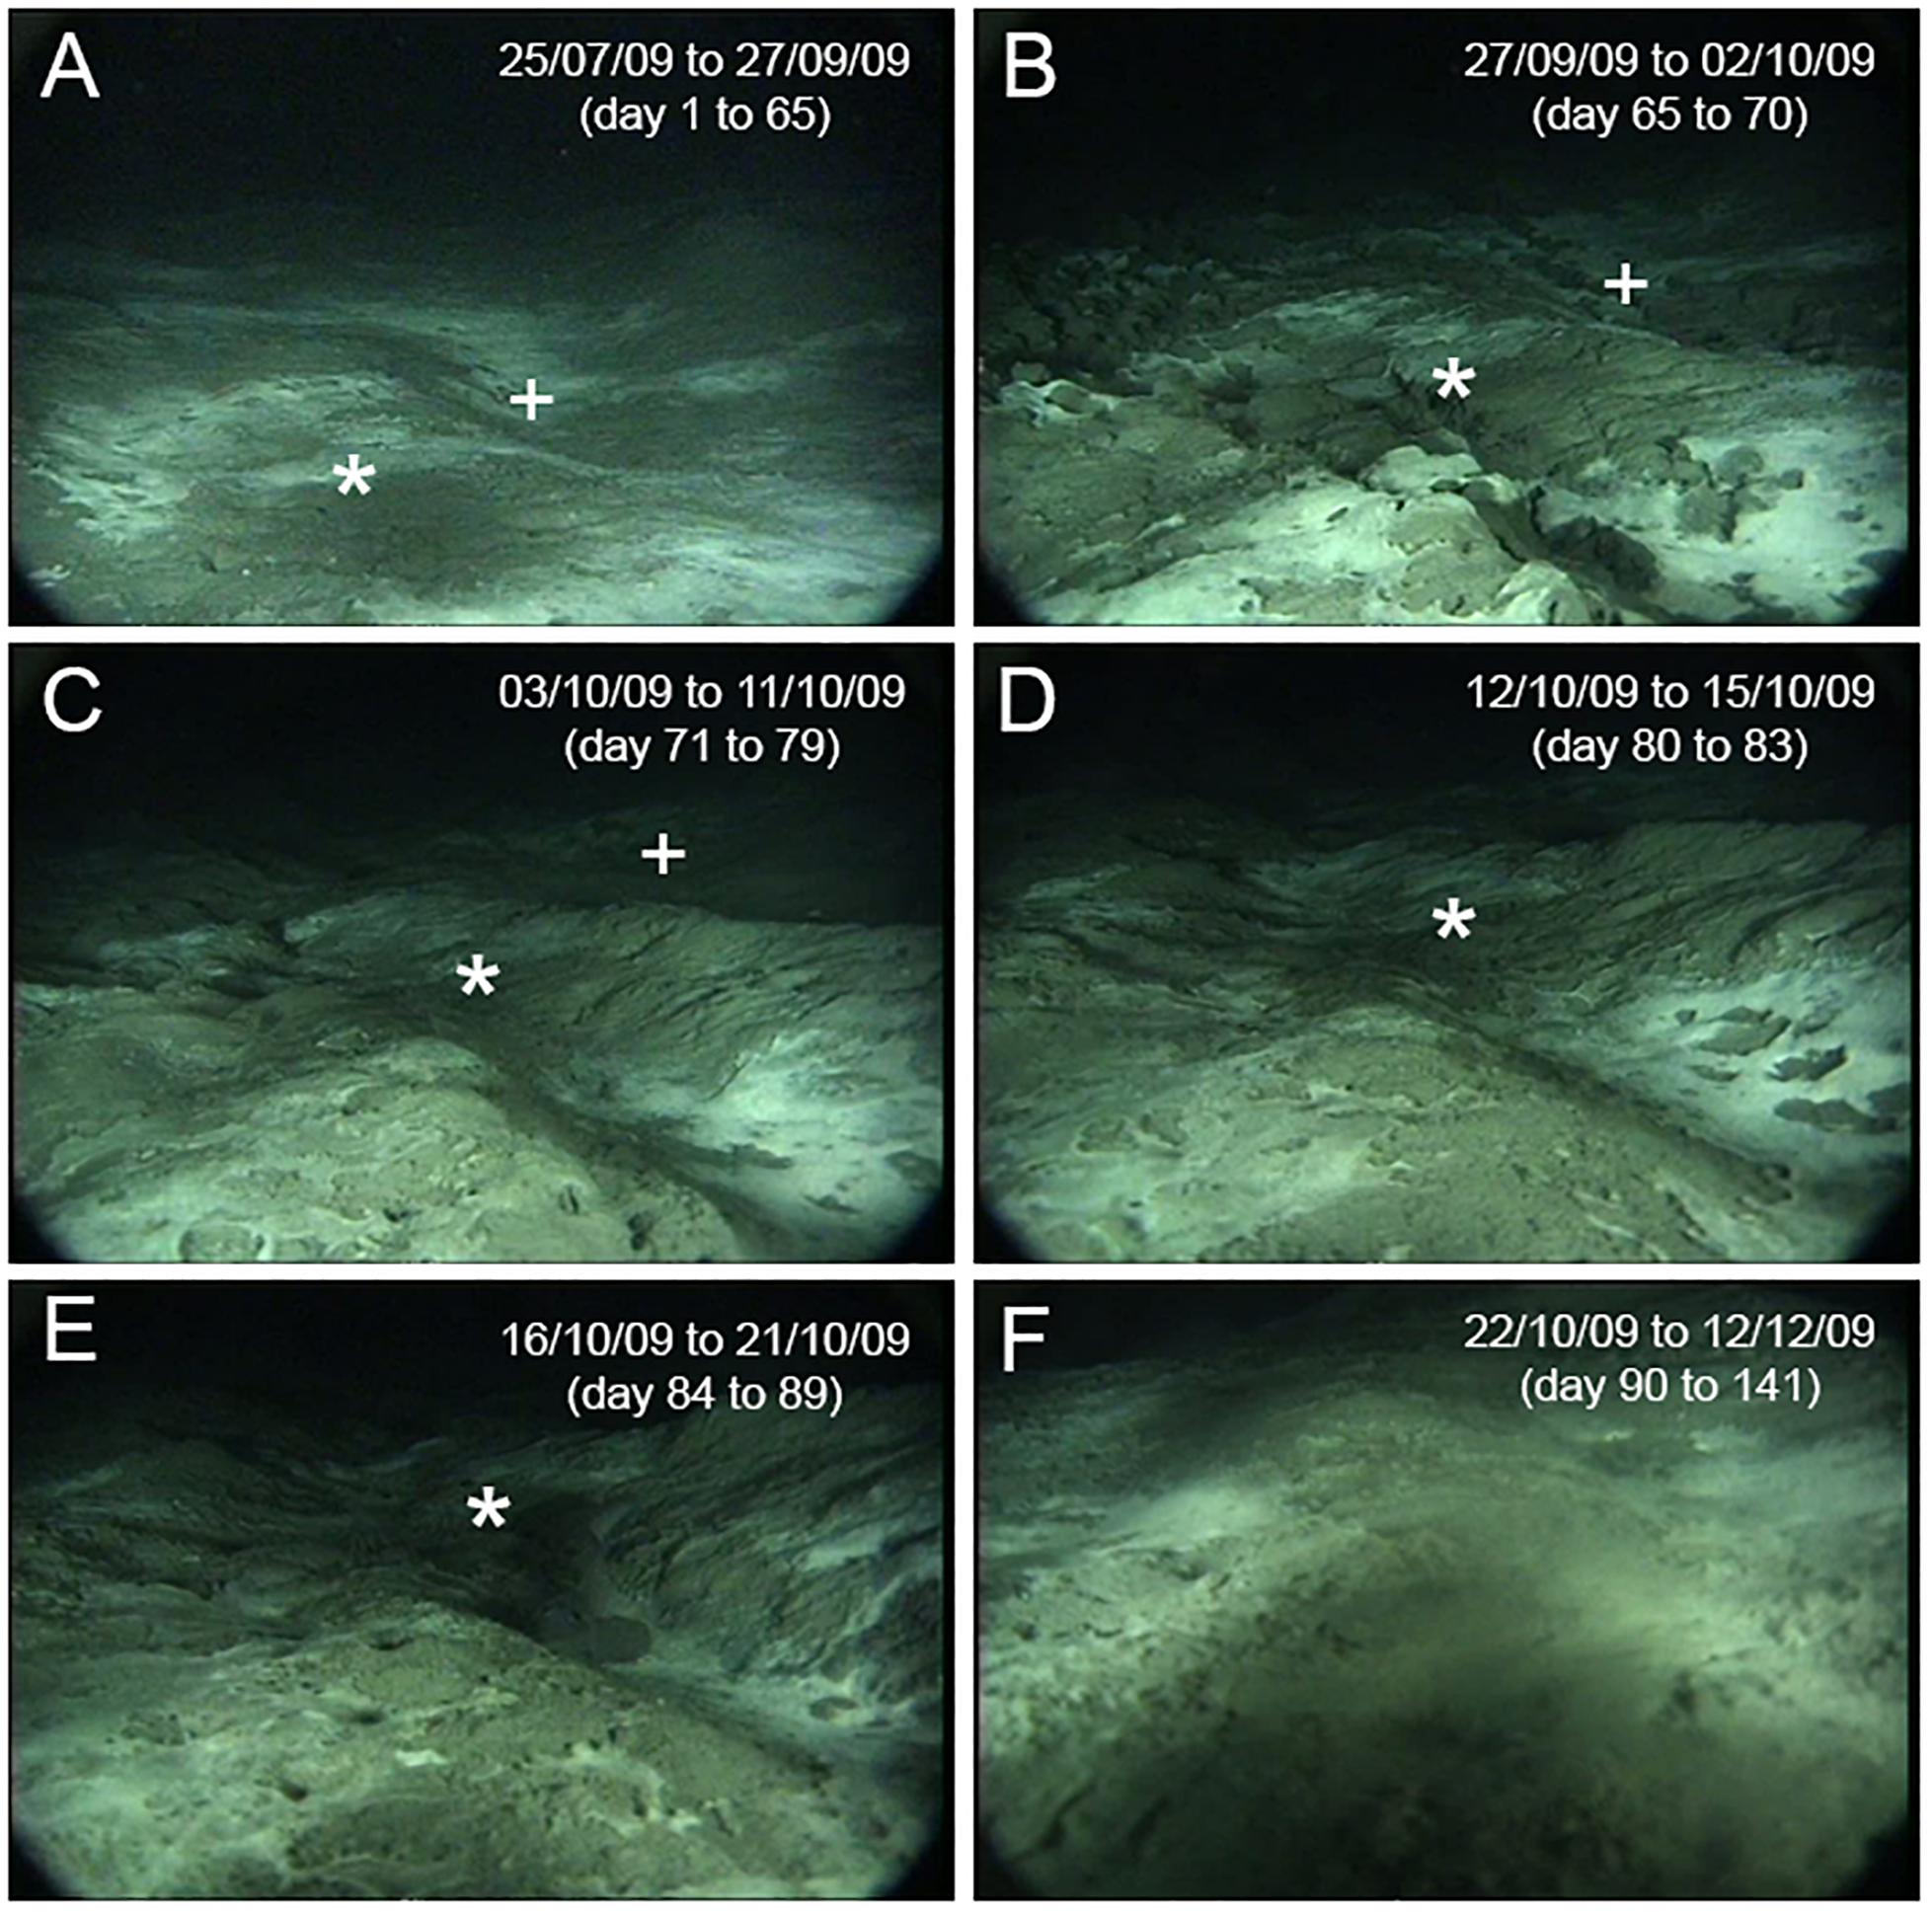
Figure 2. Field of view of the autonomous imaging module (A) before and (B–F) after the mud eruption. The effect of the eruption on the AIM position is clearly visible. Five different field of view categories were identified after the eruption (B–F) with (F) representing the last video recorded by the AIM. Seabed surfaces visible within the field of view: (A) 2.6 m2, (B) 1.6 m2, (C) 1.3 m2, (D) 0.6 m2, (E) 0.3 m2 and (F) ≤ 0.2 m2. Common features between images are indicated (* or +).
To estimate the surface visible in the field of view before the eruption, a grid, with a spacing of 10 cm, was overlaid on video frame grabs using Autodesk Inventor Professional© (Supplementary Figure 1). The total surface of the field of view was considered as the area of a trapezoid and was then calculated with the following equation:
Using this method, a total surface of 2.6 m2 was estimated for video footage recorded before the mud eruption.
Changes in seabed topography and displacement of the AIM following the eruption resulted in modifications of the field of view in the last 153 video sequences (Figures 2B–F). The camera effectively appeared to be slowly sinking into the sediments, resulting in a reduction of the field of view. Therefore, the 153 video sequences recorded after the mud eruption were divided into five categories representing different camera fields of view (type 1: 11 sequences; type 2: 18 sequences; type 3: 8 sequences; type 4: 12 sequences; type 5: 104 sequences; Figures 2B–F and Table 1). These categories were defined subjectively to be as representative as possible of visible changes in the field of view. Despite these major changes, it was still possible to identify common features (microbial mats) between video sequences recorded before and after the eruption.
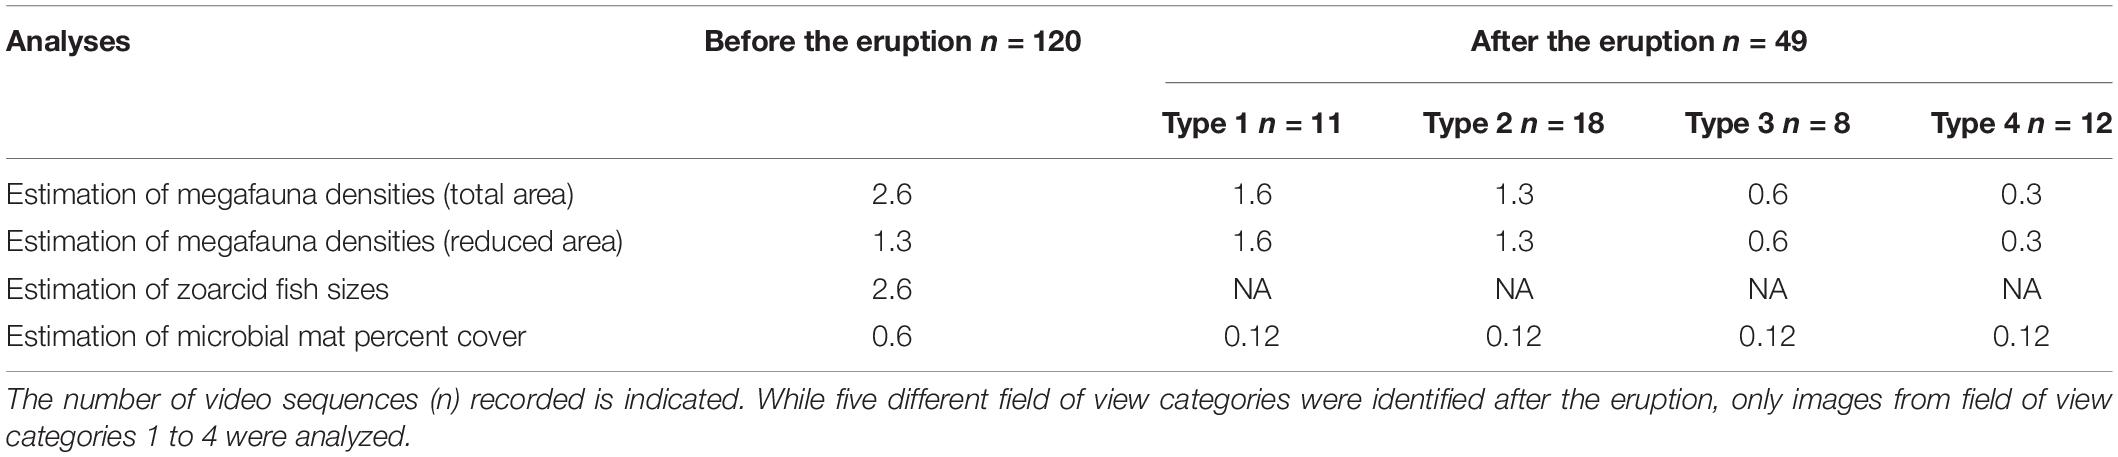
Table 1. Total surface area (m2) considered in megafauna and microbial mat cover analyses before and after the eruption.
Due to displacement, the camera tilt and height above the seafloor could not be estimated, and it was thus not possible to overlay a grid on video frame grabs to calculate the total surface visible after the eruption. However, the total surface of the field of view could be approximated using common features between video sequences. Distances between two features in the foreground, two in the background, and between a feature located in the foreground and another in the background were measured before the eruption using the 10 × 10 cm grid (Supplementary Figure 1). Considering a constant distance between these features, surfaces visible in the five field of view categories defined after the eruption were approximated (type 1: 1.6 m2; type 2: 1.3 m2; type 3: 0.6 m2; type 4: 0.3 m2; type 5: 0.2 m2; Table 1). Type 5 images were not included in the following analyses because of the very limited field of view. As a result, only 49 video sequences were analyzed following the eruption.
Megafauna Analyses
All megafauna visible on the video footage were counted and identified to the lowest taxonomic level possible. Only organisms visible within the grid boundary (Supplementary Figure 1) were enumerated as they were sufficiently close (<2 m away from the camera) to be accurately identified. Each video sequence was viewed twice to ensure that no megafauna were missed. Organisms were identified based on faunal samples collected during the VICKING (2006) expedition (Decker and Olu, 2010). Additionally, video footage was sent to specialists to confirm identifications.
Densities of the most abundant species (the zoarcid fish Lycodes squamiventer Jensen, 1904 and the pycnogonid Nymphon macronyx Sars, 1877) were estimated before and after the mud eruption. Two different methods were used to estimate densities before the eruption (Table 1). In the first analysis, all organisms identified within the area covered by the grid (surface area considered: 2.6 m2) were included in density calculations. In order to limit potential biases due to differences in the surfaces covered by the camera fields of view before and after the eruption, a reduced area was also used for density estimations before the mud eruption. The surface area considered in this second analysis corresponded to the field of view visible in post-eruption type 2 images (surface of 1.3 m2 – the most common field of view category after the eruption) and was defined using common features identified on images (Figures 2A,C).
Zoarcid fish sizes were estimated before the eruption using the 10 cm × 10 cm grid (Supplementary Figure 1). In addition, the position of every observed fish in relation to microbial mats was recorded.
Microbial Mat Cover Estimation
Before the Mud Eruption
Only one 2-min video sequence per day was used for this analysis. Because the camera occasionally failed to record at 20:58, the 8:58 video sequences were chosen. After making sure that there was no change in microbial mat cover over the course of a single video sequence, a frame grab was taken at the beginning of each daily sequence and then used for analyses. To limit perspective-related errors, only the section of the images where microbial mats were the most visible and distortion was minimal was analyzed (Figure 3A). Based on the 10 cm × 10 cm grid, the defined study area had a surface of 0.6 m2 (Table 1). Microbial mats within the study area were first selected using the magic wand tool in Adobe Photoshop®, filled in black, and then saved on a white background to maximize contrast (Figure 3A). Due to camera tilt, microbial mats in the background were likely to be distorted, even within the reduced study area. Therefore, a MATLAB® program, which took camera settings into account, was used to correct the distortion on all digitized images. The proportion of black compared to white pixels, corresponding to the percentage of the study area covered by microbial mats was then estimated in IP Lab Spectrum based on the method developed by Sarrazin et al. (1997).
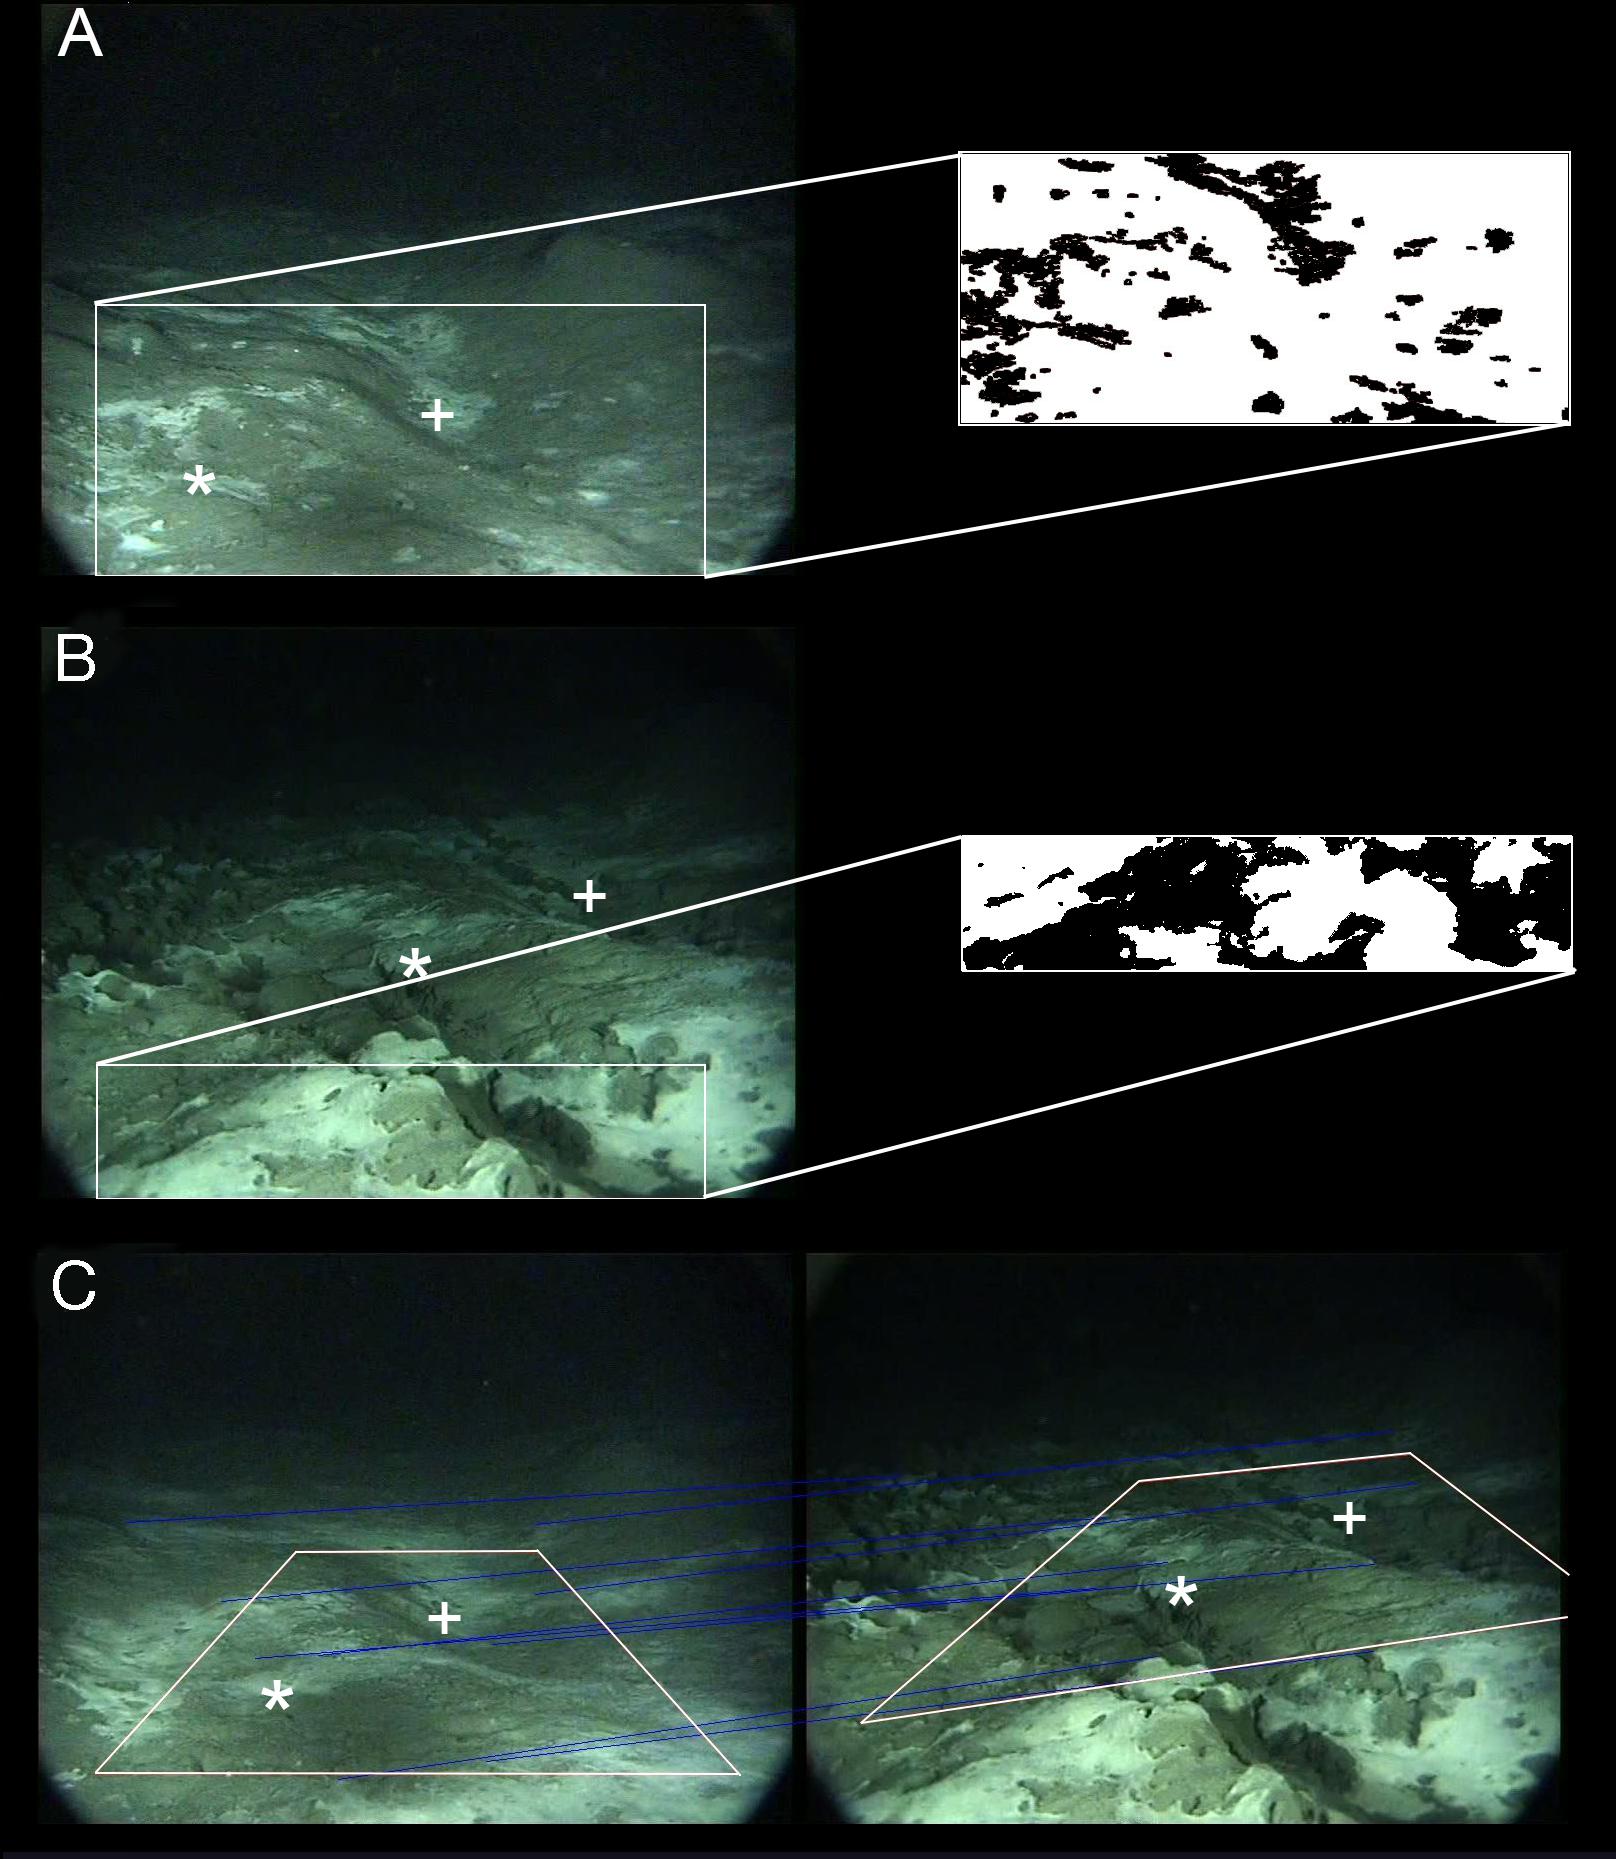
Figure 3. Methods employed to estimate the cover of microbial mats before and after the mud eruption. (A) Area (0.6 m2) analyzed for changes in microbial mat cover before the eruption. (B) Area (0.12 m2) analyzed for changes in microbial mat cover after the eruption. (C) Area selected to compare microbial mat cover immediately before and after the eruption. Microbial mats were digitized in Photoshop® (A,B) and percent covers were computed in IP Lab Spectrum. Common features between images are indicated (* or +).
To test whether the presence of zoarcids on microbial mats affected the estimation of microbial mat percentage cover, frame grabs were re-digitized to include zoarcids lying on mats. Estimated cover percentages, with or without zoarcids, were then compared.
After the Mud Eruption
Due to the AIM sinking into the sediments and changes in the camera tilt and height above the seafloor, frame grabs of video sequences recorded after the mud eruption could not be analyzed in the same way. The proportion of microbial mat cover within the study area used before the eruption could not be accurately estimated after the eruption as image distortion could no longer be corrected. As a result, a different study area, including different microbial mats, had to be considered after the eruption (Figures 3A,B), preventing a direct comparison of the proportion of microbial mat cover before and after the eruption.
To characterize changes in microbial mat cover after the eruption, only mats in the foreground of the images were digitized and measured (Figure 3B). The selected study area included mats that were visible on all post-eruption field of view categories. Moreover, because it was located in the foreground and covered a small surface area, distortion within the selected study area could be considered negligible (distortion increases with distance from the camera). Based on distances measured between common features, a surface of about 0.12 m2 was estimated for this study area (Table 1). Percentage microbial mat cover was estimated using the method described above, but without the distortion-correction step (Figure 3B).
To evaluate whether the eruption had an immediate impact on microbial cover, surfaces covered by microbial mats estimated from images immediately before (September 27, 2009 at 8:58) and after (September 27, 2009 at 20:58) the eruption were compared. To do so, common features between images were used to identify an area visible in both the last pre-eruption and the first post-eruption images (Figure 3C). Using the method described previously, microbial mats within this area before and after the eruption were digitized, distortion was corrected and the percentage of microbial mat cover was estimated.
Environmental Measurements
Raw environmental data analyzed in this study were downloaded from the PANGAEA data repository, where they are publicly available (Feseker et al., 2014a). Bottom pressure (Blandin, 2009), seabed temperature (Feseker, 2009) and current velocity (Wenzhöfer, 2009) were measured by sensors deployed as part of the LOOME observatory (see Feseker et al., 2014b for details). Bottom pressure and current velocity were respectively measured by a pressure sensor and current meter mounted on the observatory frame. Seabed temperatures were measured by 24 thermistors spaced 4 m apart along a 100 m long chain that extended southward from the observatory frame. Except for the three thermistors closest to the frame (thermistors 22, 23, and 24), all temperature sensors were located in the active center of the volcano. After ensuring that temperature variations recorded by most thermistors before the eruption were correlated (with the exception of thermistors 5, 12, 16 and 17, there was a strong correlation between temperature time series recorded by all thermistors; Supplementary Figure 2 and Supplementary Table 1), one of the three thermistors located outside the active center of the volcano (thermistor 23) was chosen for our analyses (Figure 1A). Data collected by this thermistor were used as a proxy for seabed temperature variations within the AIM deployment zone. Temperatures recorded after the mud eruption were not analyzed because lateral transport of warm mud led to significant temperature anomalies and a desynchronization between thermistors (Feseker et al., 2014b). For all sensors, only data recorded between July 25 and December 12, 2009 at 8:58 were included.
Additionally, several environmental variables could be estimated from the AIM video sequences. Particle densities in the water column were approximated using indices ranging from 0 (no particles) to 4 (large number of particles). This variable was estimated based on entire video sequences. Small circular holes were visible on the seabed. These holes were likely shaped by gas release and were thus used as a proxy for gas emissions. The number of holes visible on each frame grab used to measure microbial mat cover (one image per day) was quantified. Because holes could be difficult to detect in the images’ background, only holes present within the study areas defined for microbial mat cover analyses were counted. Hole densities were then calculated.
Statistical Analyses
Differences in the density of zoarcid fish, pycnogonids and small holes before and after the mud eruption and in fish and pycnogonid densities between daytime and nighttime video sequences were tested using non-parametric Mann–Whitney Wilcoxon tests. Differences in the proportion of zoarcids observed on microbial mats and on adjacent sediments were tested using two-proportion Z-tests.
Autocorrelation analyses were performed to detect potential periodicities in zoarcid fish densities, microbial mat cover, and environmental variables. In addition, linear regression models were fitted to all time series to detect trends. When significant trends were detected (slope estimate significantly different from 0), data were detrended prior to autocorrelation analysis.
Finally, dynamic factor analysis (DFA) was performed to investigate the relationship between the different times series. DFA is a dimension-reduction technique used to estimate underlying patterns in a set of time series. The complex mathematics behind DFA are detailed in Zuur et al. (2003). In short, a DFA model with no explanatory variable can be formulated as follows:
Where yt is a N x 1 vector containing the values of the N time series at time t. xt represents the values of the m common trends (also called states) at time t, which follow random walks governed by process errors wt. wt was set as a m x m identity matrix. Z is the N x m matrix containing the factor loadings and determining the form of the linear combination of the common trends. Overall, trends that explain a large proportion of the temporal variance of a given time series will receive large weights (positive or negative). Finally, e is a N x 1 noise component assumed to be normally distributed with a mean of zero and error covariance matrix R.
In this analysis, we included the seven (N = 7) times series as response variables in the model, and did not include any explanatory variables. Each response variable was standardized prior to analysis by subtracting its mean and then dividing it by its standard deviation. Only data collected before the eruption were included.
To identify underlying common patterns between time series, four different DFA models, based on different R matrices were applied. The following covariance matrix structures were tested: equal variance and no covariance (diagonal and equal), unequal variance and no covariance (diagonal and unequal), equal variance and covariance (equalvarcov) and unconstrained variance and covariance (unconstrained). Each time, one to five (m = 1 to 5) common trends were tested. Model parameters and states were estimated using the MARSS (version 3.10.10) package (Holmes et al., 2012) in R (R Core Team, 2014). The best-fitted model was then selected based on Akaike’s information criterion (model with the lowest AICc value).
After inspecting model fits and potential residual issues, state values were extracted from the selected model, and autocorrelation analysis was performed to identify potential cycles. Factor loadings were determined using the varimax methods described by Harvey (1989). Factor loading were then represented for each common trend as in previous studies (Zuur et al., 2003).
All statistical analyses were conducted in the programming environment R.
Results
Megafauna Density and Behavior
Five different taxa were observed on the video sequences (Table 2). The zoarcid fish Lycodes squamiventer and pycnogonid Nymphon macronyx were, by far, the most common taxa both before and after the mud eruption. Skates of the species Amblyraja hyperborea (Colett, 1879) were occasionally seen swimming through the field of view. Although rare, the other taxa observed included a fish identified as Lophius piscatorius Linnaeus, 1758 and two non-identified squids (Table 2). While only megafaunal species were enumerated in this study, several suprabenthic crustacean species, likely amphipods and copepods, were also observed in the water column.
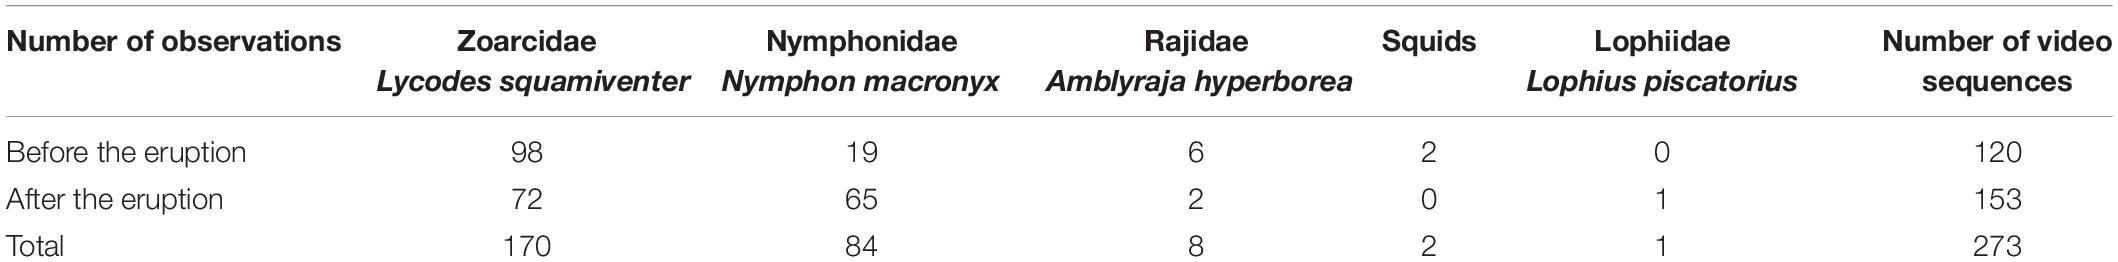
Table 2. Occurrence of the megafaunal taxa observed before and after the mud eruption.
Densities of both zoarcids and pycnogonids were estimated from the seabed surface area within the field of view. Overall, there were no significant differences in zoarcid and pycnogonid densities between daytime (8:58) and nighttime (20:58) video sequences (Mann–Whitney Wilcoxon: p-values = 0.249 and 0.373 for zoarcids and pycnogonids, respectively). The densities of zoarcid fish were significantly higher after the eruption, regardless of the method used to estimate density (Table 3). Similarly, the densities of pycnogonid were higher after the mud eruption, although differences were only significant when a reduced area was used to calculate densities before the eruption (Table 3). Based on autocorrelation analyses, zoarcid densities did not exhibit any significant cycles during the study period (Supplementary Figure 3).
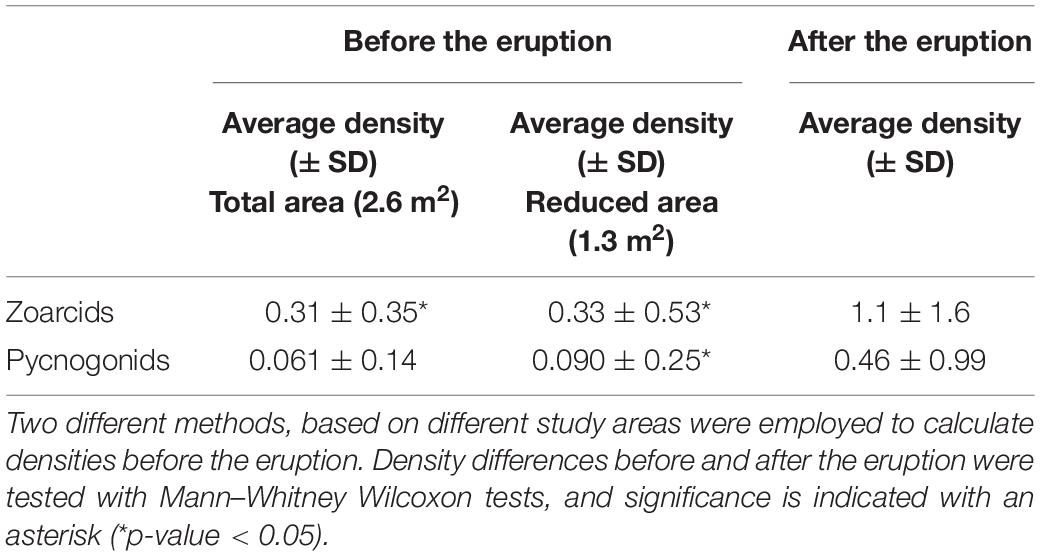
Table 3. Average (± SD) densities (number of individuals per m2) of zoarcids (Lycodes squamiventer) and pycnogonids (Nymphon macronyx) before and after the mud eruption.
The size distribution of zoarcids was skewed to the right with the majority (>60%) of fishes measuring between 6 and 20 cm (Supplementary Figure 4). The largest individual measured was 45 cm long and no fish smaller than 6 cm was observed on the video footage.
Zoarcid fishes were observed significantly more often on the sediments adjacent to microbial mats than on the mats themselves both before and after the mud eruption (two-proportion Z-test: p-values = 0.013 and 0.001 before and after, respectively).
Microbial Mat Cover Dynamics
Percentage microbial mat cover estimated with and without removing the zoarcids lying on mats only differed by 0.78% on average. Because the influence of zoarcids on microbial mat cover estimates was negligible, percent cover values used in the analyses were estimated without removing zoarcids.
Microbial mat cover was variable throughout the study period (Figure 4). Before the eruption, microbial mats covered, on average, 26.2% (± 4.84% SD) of the seabed within the field of view of the camera. Although results were not significant, the autocorrelation analysis suggested that microbial mat cover exhibited cycles with a period of about 27 days (Supplementary Figure 3). Moreover, there was a general trend for an increase in microbial mat cover through the eruption (Supplementary Table 2 and Figure 4A). Percentages of microbial mat cover estimated immediately before (September 27, 2009 at 8:58) and after (September 27, 2009 at 20:58) the eruption within the selected study area were of the same order of magnitude (35 and 30%, respectively), indicating the absence of an immediate impact of the mud eruption on microbial cover.
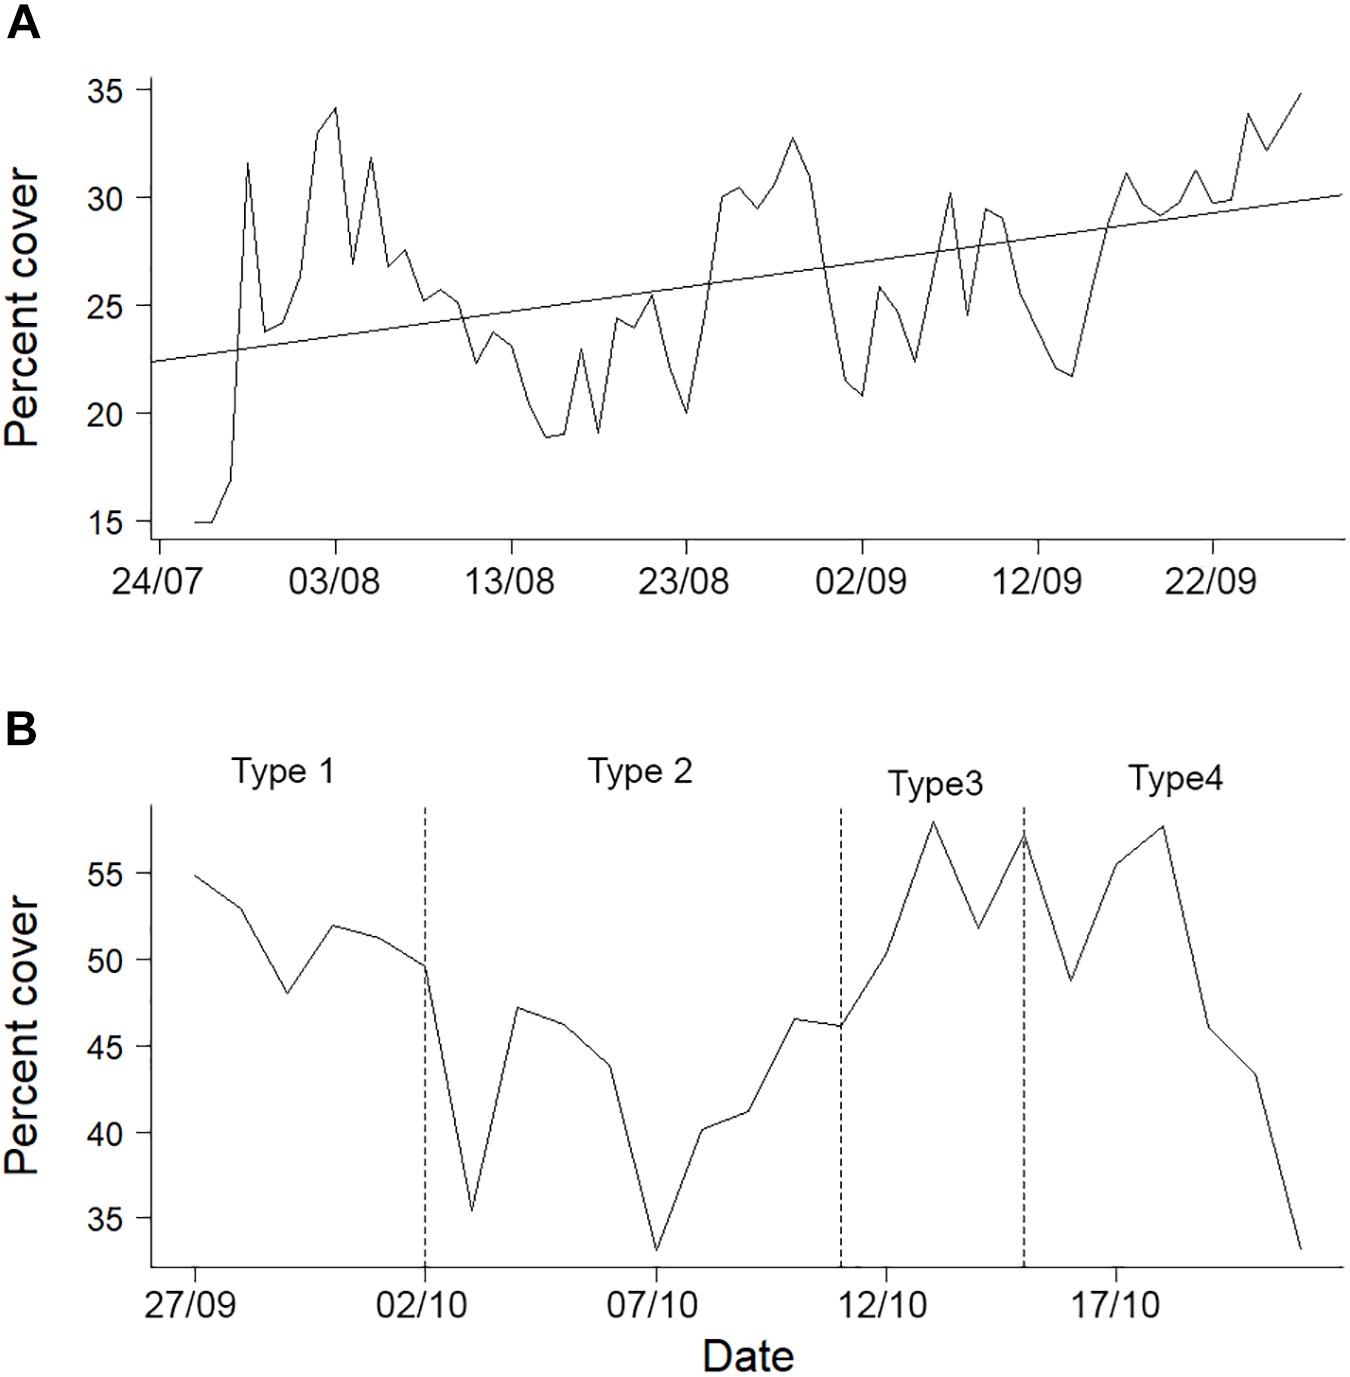
Figure 4. Changes in the percentage of microbial mat cover (A) before and (B) after the mud eruption. While five different field of view categories were identified after the eruption, only images from field of view categories 1 to 4 were analyzed (type 5 images were not analyzed because of the very limited field of view: ≤ 0.2 m2).
No general trend for an increase or decrease in microbial mat percent cover was detected after the mud eruption (Supplementary Table 2 and Figure 4B). Although weak oscillations with a period of about 14 days were visible after the eruption, no significant cycles were identified (Supplementary Figure 3).
Environmental Variable Dynamics
Bottom pressure had a clear cyclic behavior throughout the study period (Figure 5A). The autocorrelation analysis identified significant cycles with a period of 14 days (Supplementary Figure 3). Overall, there was no trend for an increase or decrease in bottom pressure before or after the mud eruption (Supplementary Table 2).
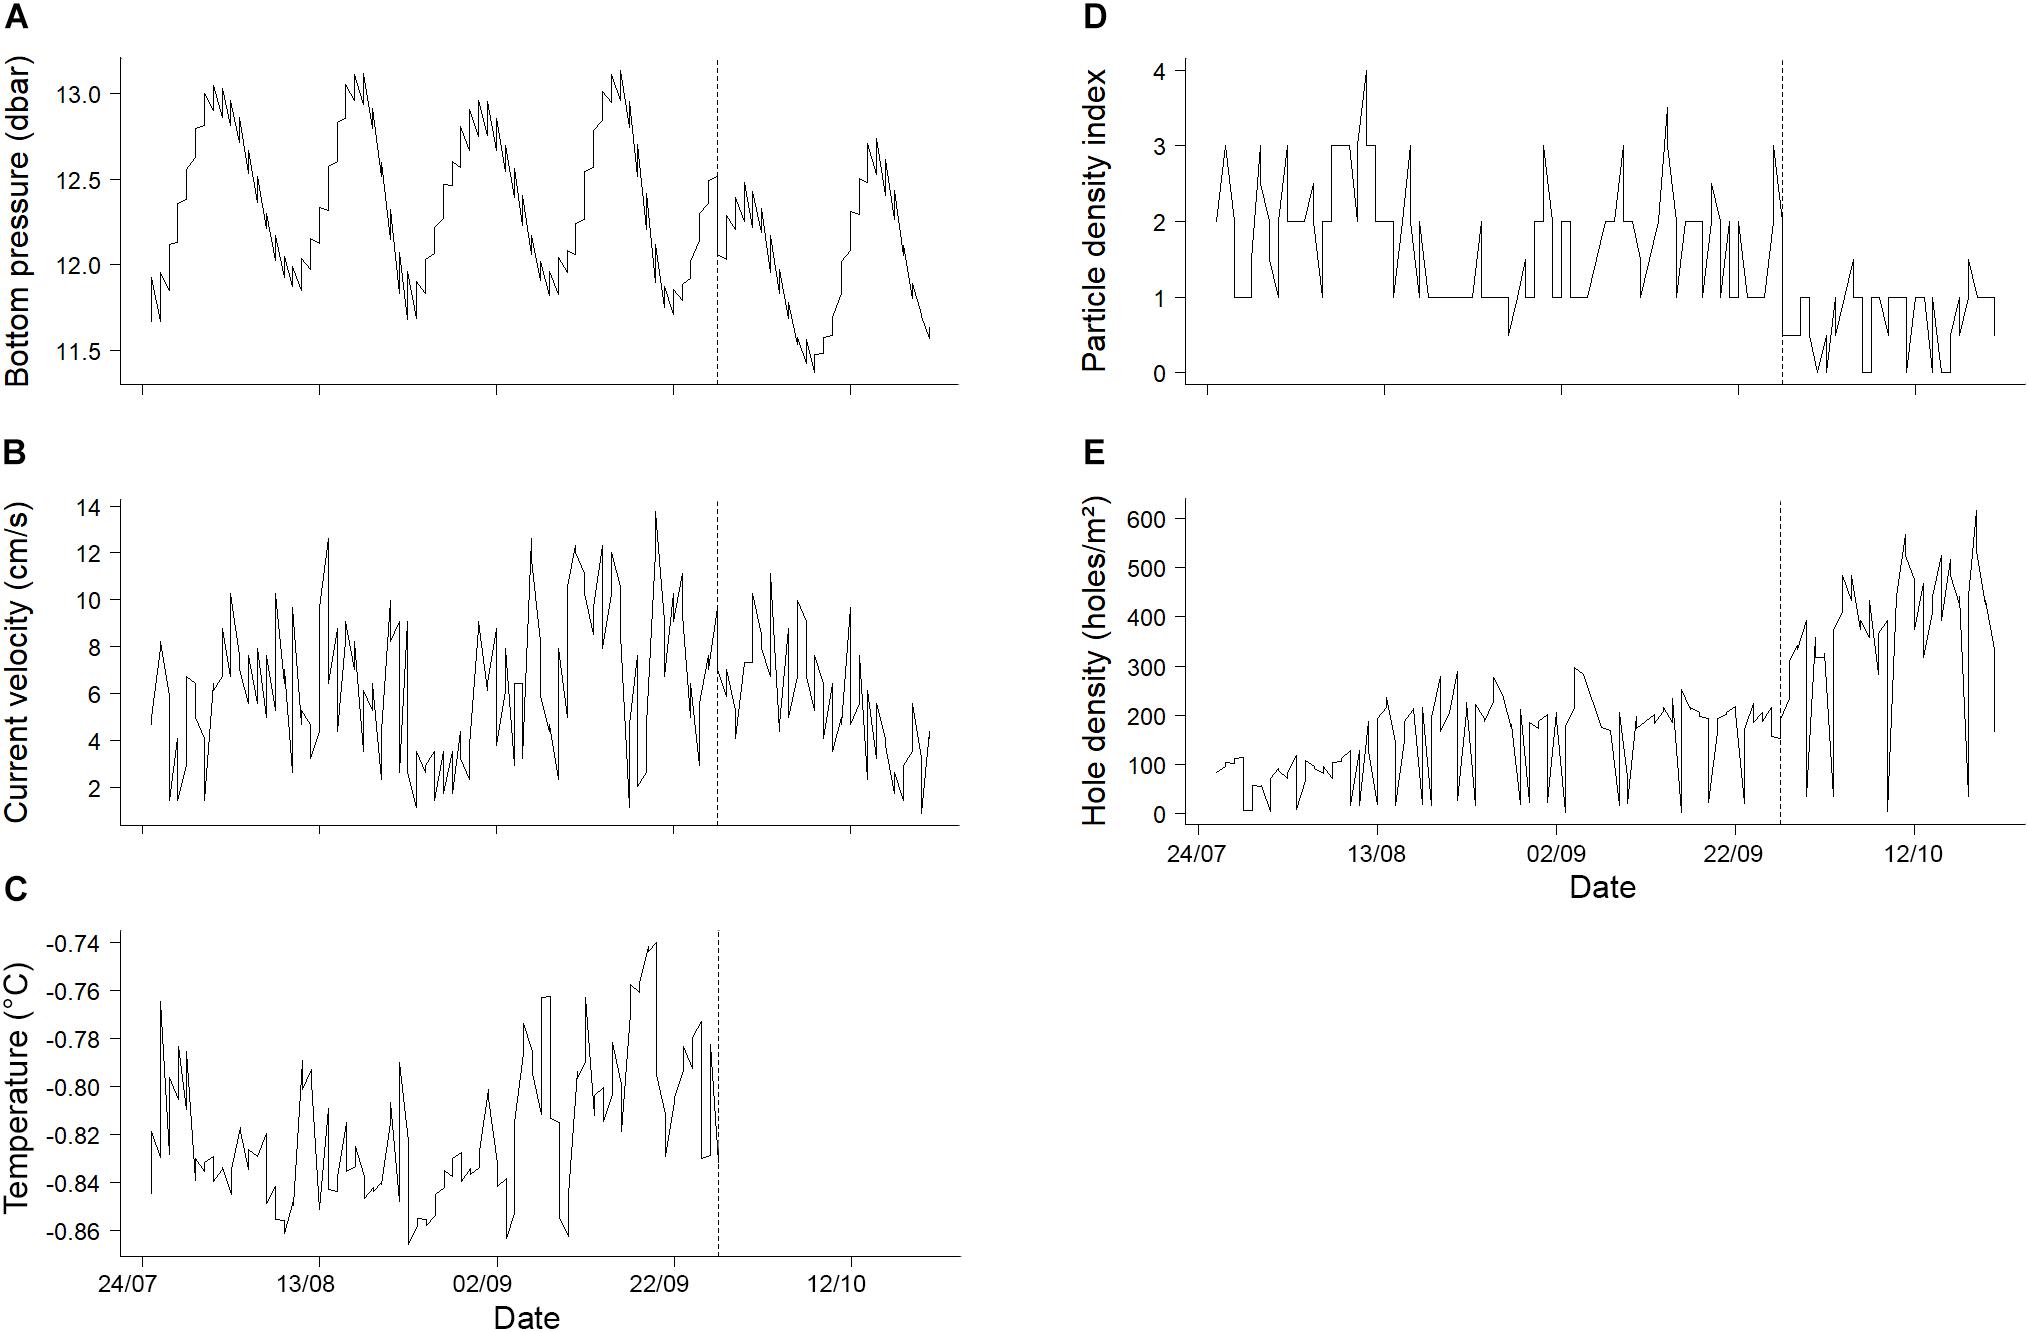
Figure 5. Time series of environmental variables before and after the mud eruption. (A) Bottom pressure (Blandin, 2009), (B) current velocity (Wenzhöfer, 2009) and (C) seabed temperature (Feseker, 2009) were measured by sensors deployed as part of the LOOME observatory. (D) Particle index and (E) hole density were estimated from imagery. The vertical dotted lines indicate the day of the mud eruption. Temperature data collected after the eruption are not shown as they were not considered representative of seabed temperatures at the AIM deployment site (see section “Materials and Methods”).
No significant cycles were identified for the other environmental variables (Supplementary Figure 3). However, significant trends were detected (Figure 5 and Supplementary Table 2). The temperatures measured by thermistor 23 (considered representative of seabed temperatures before the mud eruption) varied between −0.87 and −0.74°C and tended to increase until the mud eruption (Supplementary Table 2 and Figure 5C). Despite the absence of significant cycles, damped oscillations in seabed temperature were visible.
A significant increase in hole densities was also detected both before and after the mud eruption (Supplementary Table 2 and Figure 5E). Before and after the eruption, the average densities of holes per m2 were 144 (± 80 SD) and 367 (± 138 SD), respectively, and this difference was significant (Mann–Whitney Wilcoxon: p-value < 0.001). Finally, current velocity tended to increase before the eruption and decrease afterward (Supplementary Table 2 and Figure 5B).
No significant upward or downward trends were observed for particle densities estimated from video footage (Supplementary Table 2), even if they appeared to be lower after than before the mud eruption (Figure 5D). Although not quantified, other changes in the environment were visible on the video footage. Bubbles escaping from the seabed were regularly observed, especially following the mud eruption. In addition, tremors (shaky field of view), which were detected for the first time on August 24, 2009 (33 days prior to the eruption), were frequently detected both before and after the mud eruption.
Common Trends Between Time Series
The DFA model containing three common trends and a diagonal and unequal covariance matrix (different variance and no covariance between response variables) had the most support from the data (Supplementary Table 3 and Supplementary Figure 5 for model fits). The first trend identified was characterized by significant cycles with a period of 14 days (Figure 6 and Supplementary Figure 6). This trend was related to zoarcid densities and microbial mat cover with positive loadings and to current velocity and bottom pressure with negative loadings. The second trend also oscillated with a period of 14 days, although these cycles were not significant. This trend displayed a peak on August 23, 2009 and was related to hole densities and current velocity with positive loadings and to microbial mat cover and bottom pressure with negative loadings (Figure 6). Finally, the third trend exhibited significant oscillations that suggested a possible, although non-significant, 40-day periodicity (Supplementary Figure 6). The third common trend was related to particle densities, seabed temperature and current velocity with positive loadings and to microbial mat cover with negative loadings (Figure 6).
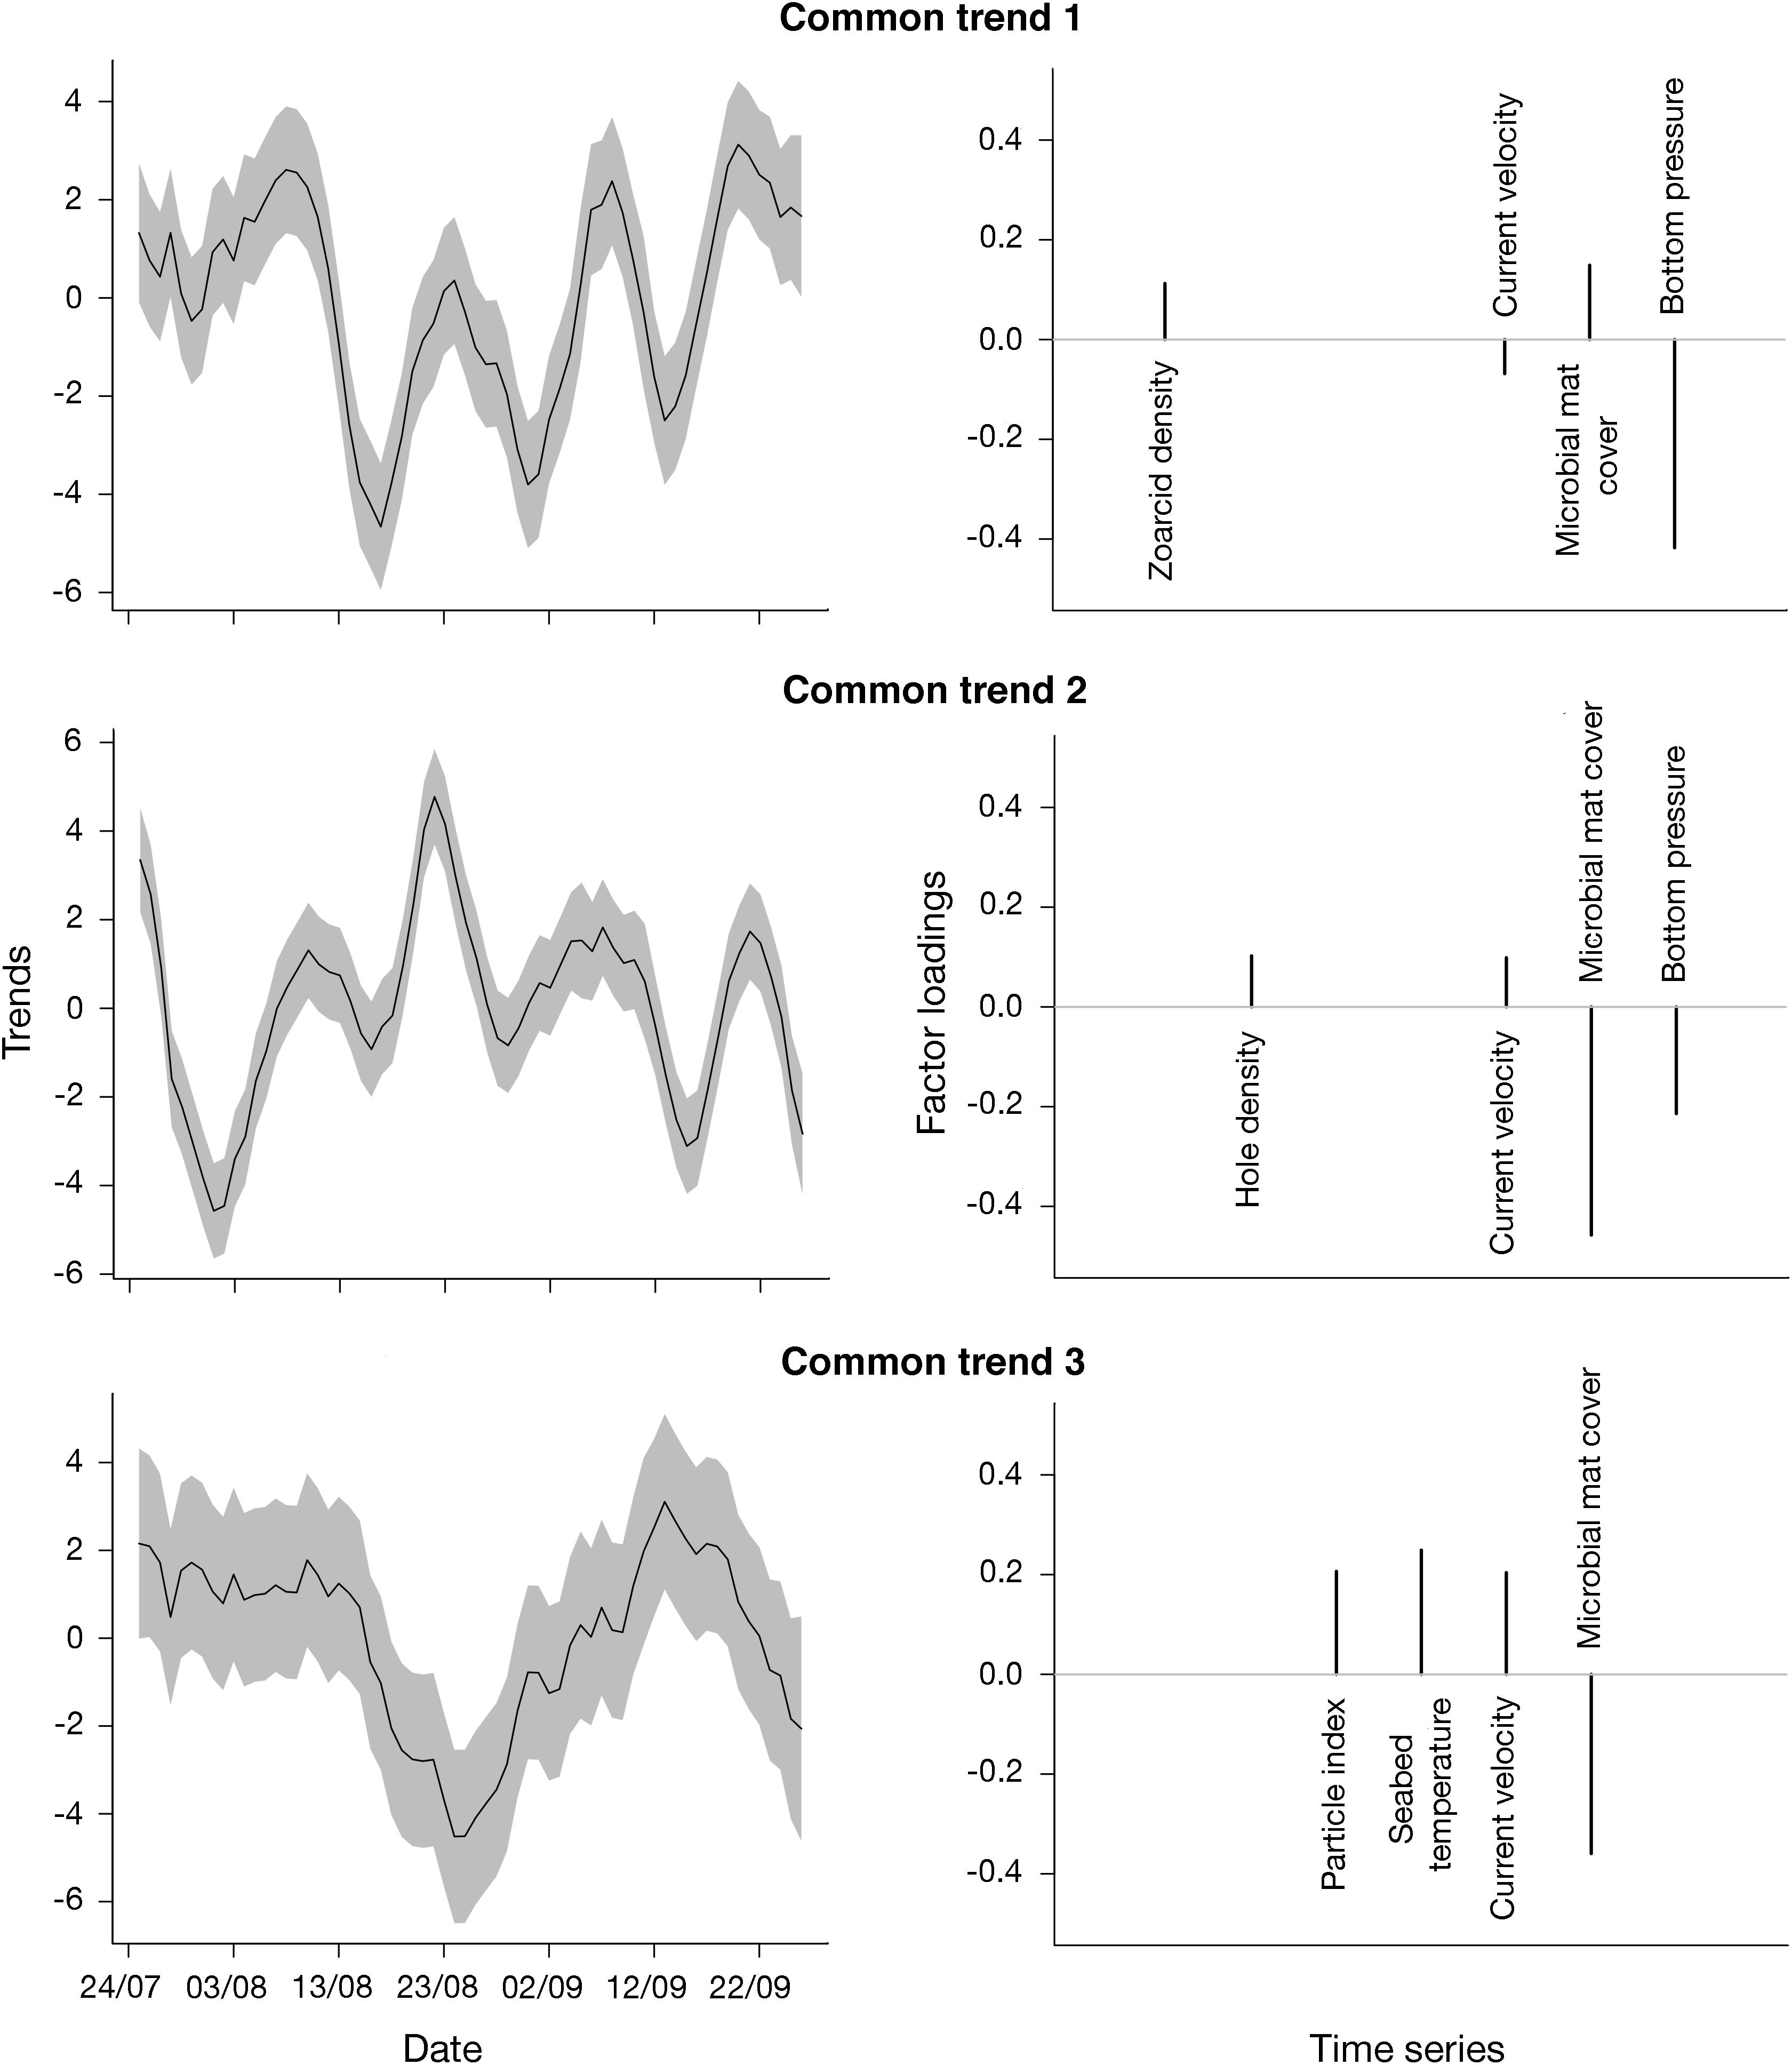
Figure 6. Common trends and factor loadings per trend estimated from a dynamic factor analysis (DFA) model with three common trends and a diagonal and unequal covariance matrix R. Shading around trend values indicate 95% confidence intervals.
Discussion
HMMV Microbial Mat Habitat Use by Megafauna
Five different taxa were observed during this study. The three most common taxa (the zoarcid Lycodes squamiventer, pycnogonid Nymphon macronyx, and skate Amblyraja hyperborea) have all been previously documented on HMMV (Gebruk et al., 2003; Rybakova et al., 2013). Overall, we found that zoarcids spent more time on the adjacent sediments than on the microbial mats themselves, suggesting a potential avoidance of the toxic sulfidic conditions associated with mats. Nevertheless, our temporal analysis revealed common dynamics between zoarcid densities and microbial mat cover (Figure 6), indicating a positive link between them. Such positive relationships between zoarcids and microbial mats have been documented in previous studies. In particular, Rybakova et al. (2013) showed that, although zoarcids occur throughout the mud volcano, they are most abundant in areas of high microbial mat cover. Moreover, stable isotope analyses suggested that zoarcids feed on macrofaunal communities associated with mats and adjacent sediments, which appear to mostly rely on methanotrophically derived carbon (Decker and Olu, 2012). The relationship between zoarcids and microbial mats could thus be of a nutritional nature. Similarly, pycnogonids are frequently observed in mat habitats (Gebruk et al., 2003; Rybakova et al., 2013). They are surface deposit feeders and, like zoarcids, likely depend on methane-derived carbon (Decker and Olu, 2012).
Unlike zoarcids and pycnogonids, the contribution of chemoautotrophy in Amblyraja hyperborea’s diet has never been evaluated. However, in a recent study, Sen et al. (2019) documented high densities of A. hyperborea egg cases at an active seep site off Norway, and suggested that these Arctic skates could be using seeps as nursery grounds, possibly taking advantage of positive temperature anomalies in surface sediments to shorten incubation times. In light of this study, the observation of several A. hyperborea skates on HMMV is thus particularly interesting. Although no egg cases have been documented so far at HMMV, recorded temperature anomalies (Feseker et al., 2008) as well as the relatively frequent observation of A. hyperborea adults suggest that this mud volcano may also serve as a nursery grounds for these skates.
Overall, none of the taxa documented in this study were endemic to seeps. This pattern is commonly observed at high-latitude cold seeps where communities are generally dominated by background fauna while seep-endemic species are rare to inexistent (Åström et al., 2018; Sen et al., 2018, 2019). At high latitudes, surface production is generally limited by the extended periods of darkness and cold temperatures. Seeps thus constitute biomass hotspots where background fauna can take advantage of the high productivity associated with active seepage (Åström et al., 2018). In this study, we identified a positive relationship between zoarcid fish densities and microbial mat cover and found that the mud eruption had a positive impact on both pycnogonid and zoarcid densities. These results, combined with the outcome of isotope analyses (Decker and Olu, 2012), and the higher growth rates measured for Lycodes squamiventer on HMMV compared with background sites (Hildebrandt et al., 2011), support the idea that background fauna present at HMMV directly benefit from seep productivity.
Relationship Between Faunal, Microbial, and Environmental Temporal Dynamics Before the Eruption
Through the analysis of high-resolution time series before the eruption, we were able to shed light on the complex interactions between faunal dynamics, microbial activity and environmental variables. Different groups of time series, related to three different common trends, could be identified using DFA analysis. Although the interpretation of these results is not straightforward, and further studies will be necessary to confirm the observed trends, several mechanisms can be inferred (Figure 7A).
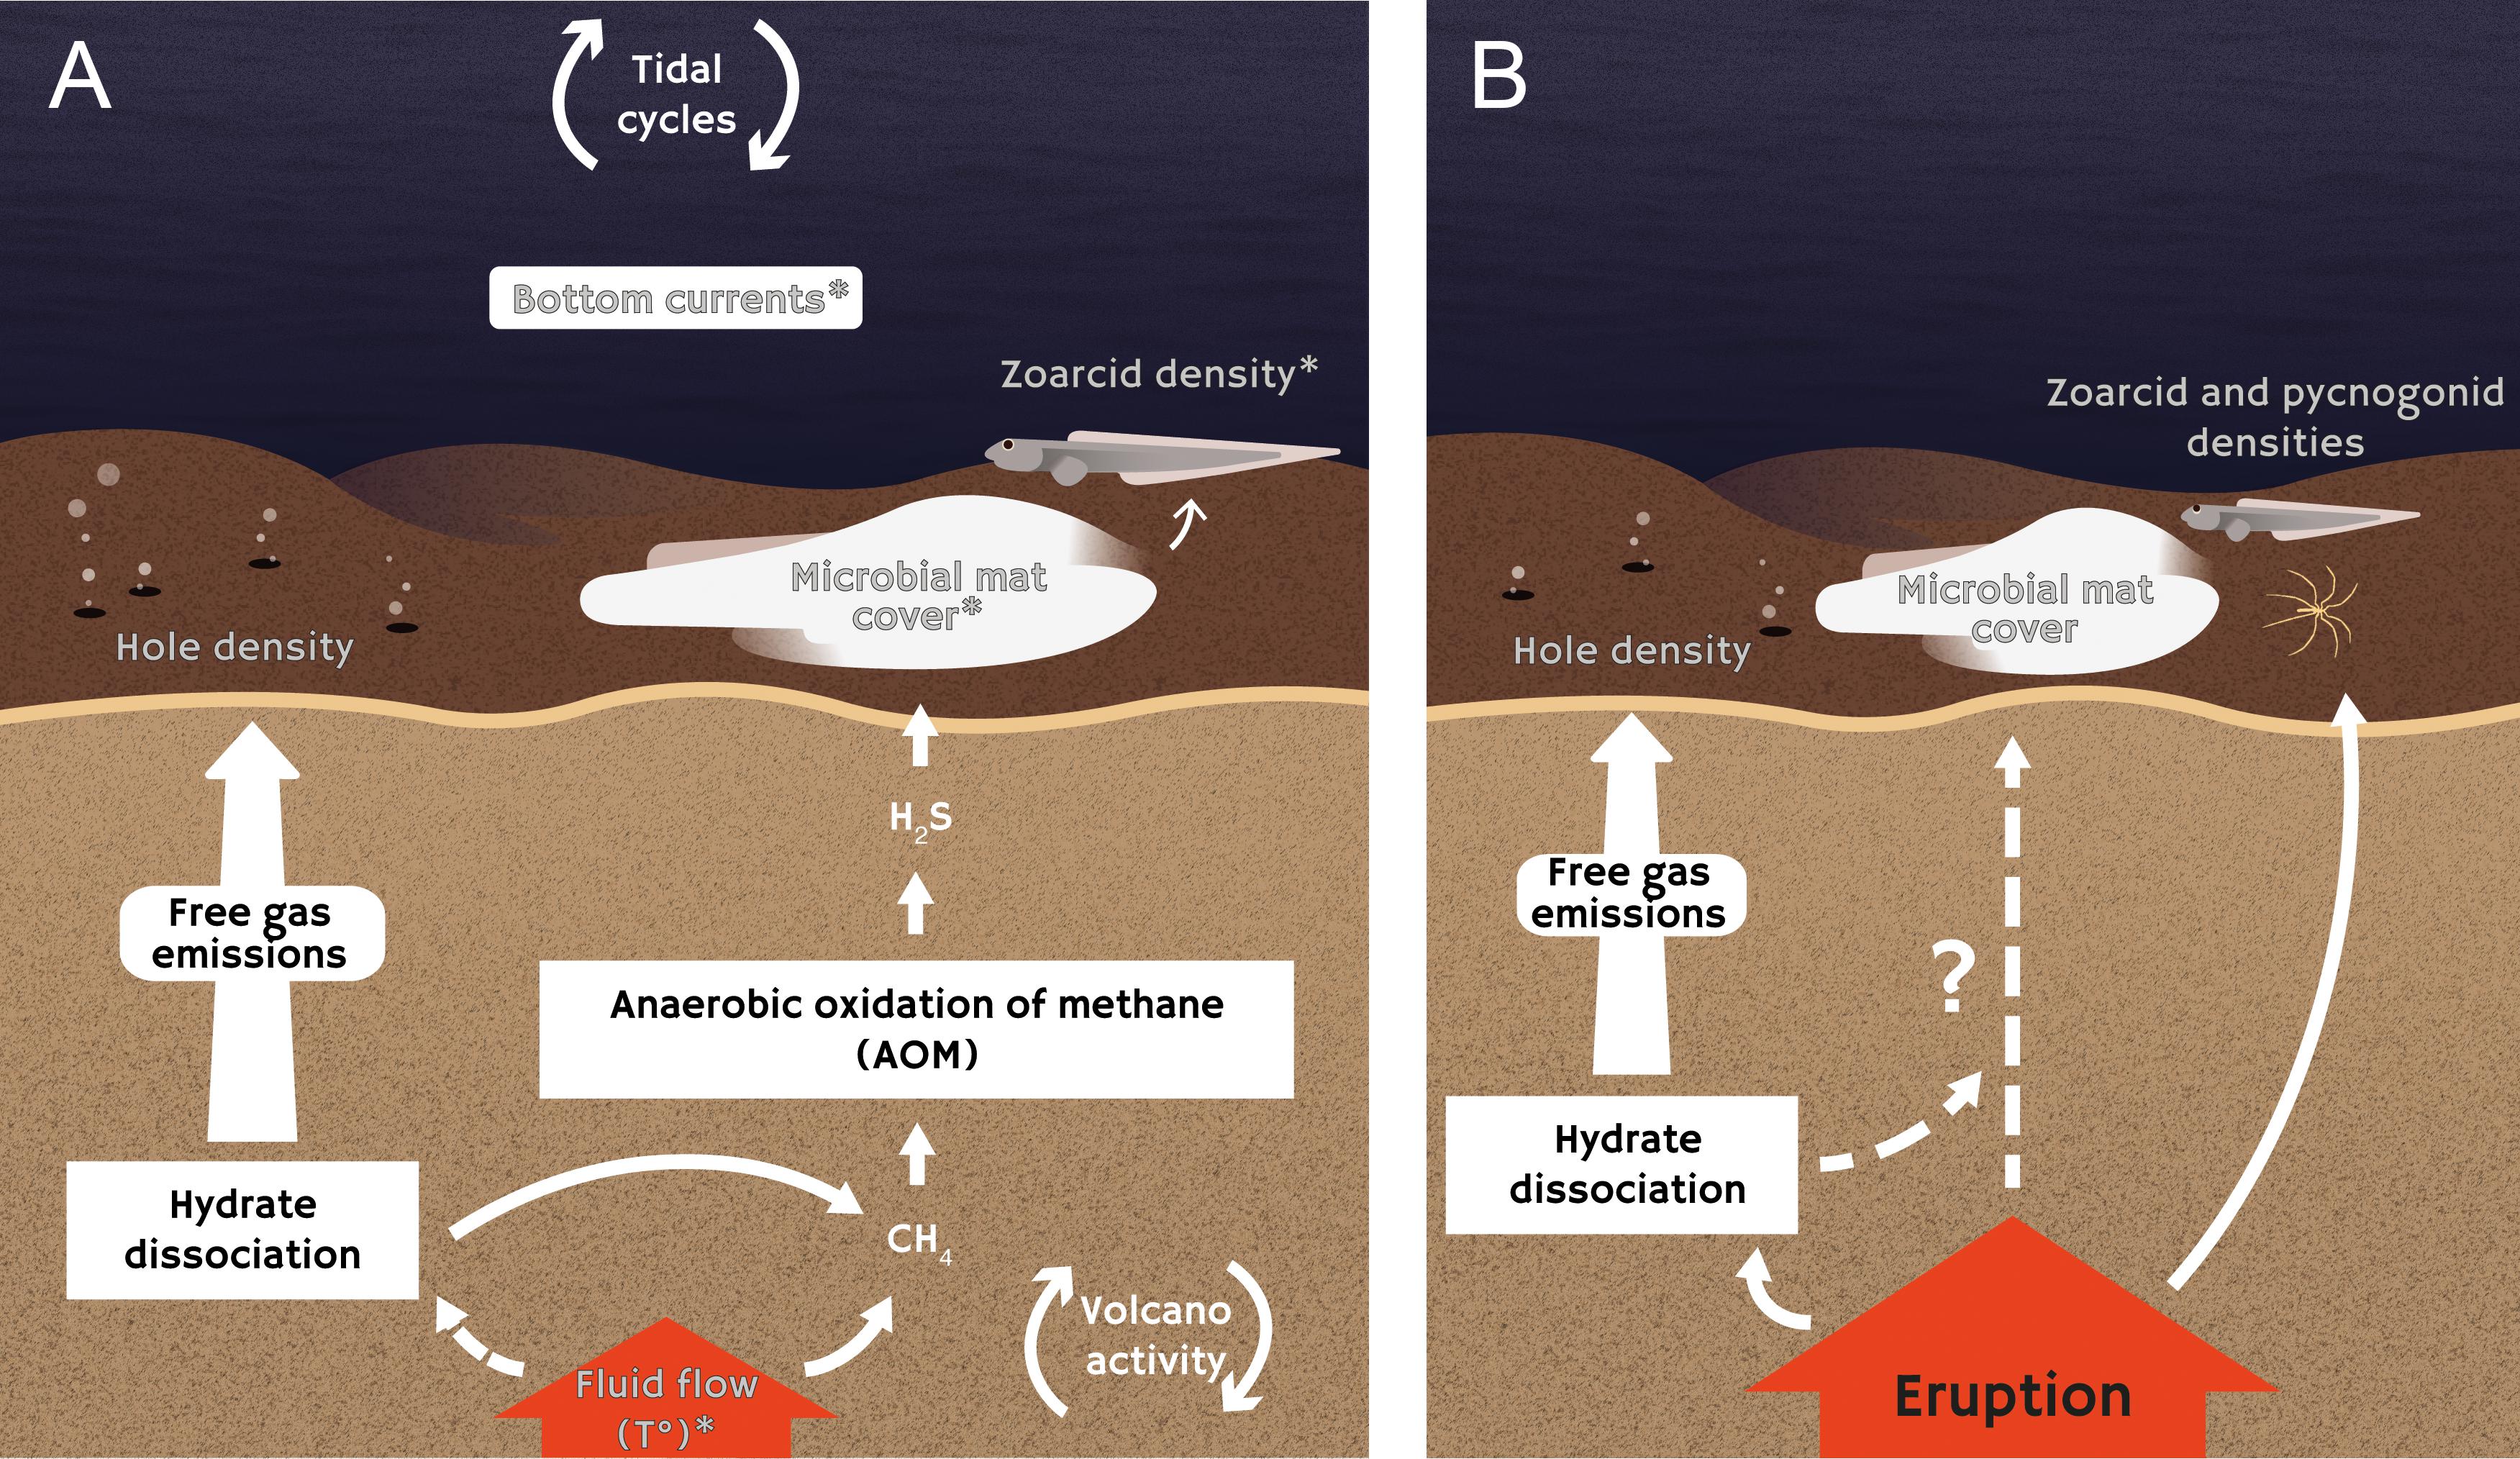
Figure 7. Schematic representation of inferred interactions between fauna, microbial activity, porewater biogeochemistry, and fluid flows at Håkon Mosby mud volcano microbial mat habitats. (A) Interactions inferred from of the analysis of time series of data collected before the eruption and (B) the impacts of the mud eruption on faunal density, microbial activity, and environmental variables are represented separately. White arrows represent positive relationships, and variables analyzed in this study are shown in gray. Variables related to cyclic common trends are indicated by an asterisk (∗).
Microbial mat cover, zoarcid densities, current velocity and bottom pressure were all related to the first common trend characterized by a spring-neap tidal periodicity (14 days). Even though the influence of tides has been characterized in non-reducing and hydrothermal vent environments (Wagner et al., 2007; Barreyre et al., 2014; Doya et al., 2014; Lelièvre et al., 2017), this is the first time that such an effect has been detected in a cold-seep ecosystem. Although additional studies are needed to confirm the effect of tides and investigate the mechanisms involved, assumptions can be made based on what is known for hydrothermal vents. Tides have been shown to affect bottom currents at vents (Tivey et al., 2002), which in turn, can affect the behavior of vent fauna by driving changes in temperature and oxygen saturation levels (Lelièvre et al., 2017). It is thus possible that tidal variations in bottom currents at HMMV indirectly affected microbial mat cover by changing local environmental conditions (e.g., oxygen levels) above the mats.
In addition, tidal loading, due to increased bottom pressure, may modulate vertical flow rates at HMMV by increasing sea water diffusion through the sediments, creating pressure gradients below the seafloor (Crone and Wilcock, 2005). Bottom pressure and microbial mat cover were related to trend 1 with opposite factor loadings (Figure 6). This result suggests that low pressures could be associated with higher flow rates, increasing the amount of methane available for anaerobic methane oxidation, and thus sulfide production in subsurface sediments. In this case, microbial growth would be facilitated, increasing the surface covered by mats, consequently attracting more zoarcids (Rybakova et al., 2013). Moreover, vertical migration of microbial filaments may also affect microbial mat cover. It has been shown that Beggiatoa filaments have the ability to migrate through sediments to remain at the optimal oxygen-sulfide interface (Møller et al., 1985). Therefore, higher flow rates and lower downward diffusion of oxygen into the sediments would decrease the depth of the oxygen-sulfide interface, and potentially lead to an upward migration of microbial filaments (De Beer et al., 2006). While, temporal variations in seabed temperatures, used as a proxy for fluid flow rates in this study (Feseker et al., 2014b), were not related to trend 1, it is possible that changes in flow rates were not significant enough to translate into temperature anomalies at the sediment surface.
Seabed temperature, along with particle densities, current velocity and microbial mat cover, were all related to trend 3, which exhibited cycles with a non-significant period of about 40 days (Figure 6). These oscillations could reflect temporal variations in the activity of the volcano. Mud volcanoes are highly dynamic geological structures with cyclic phases of eruption followed by periods of quiescence (Deville and Guerlais, 2009). Even during the quiescent phase, fluid flows have been shown to vary according to cycles related to gas and mud migrations through the volcano conduits (Deville and Guerlais, 2009). In some terrestrial mud volcanoes, cycles in mud expulsions have been linked to the lunar phase (29.53 days; Aliyev et al., 2002). At HMMV, Feseker et al. (2014b) have observed that mud displacements occurred roughly on a monthly basis. The detected temporal variations in seabed temperature may thus be driven by these mud flows. Similarly, cyclic mud displacements may have a negative impact on microbial mat cover and lead to sediment re-suspension, increasing water turbidity.
Finally, common trend 2, which was related to sediment hole densities, current velocity, microbial mat cover and bottom pressure, appeared to oscillate with a period of 14 days but did not exhibit any significant cycles (Figure 6). This trend was characterized by a peak on August, 23 2009, 34 days before the eruption. Tremors were detected for the first time in video sequences from around the same time (August, 24, 2009), and were then frequently detected until the eruption. This time period may thus mark the onset of the increase in the mud volcano’s activity that eventually led to the eruption. In particular, this increase in activity may have destabilized gas hydrates in subsurface sediments. Hydrates are ice-like crystalline minerals containing hydrocarbon (e.g., methane, carbon dioxide) and non-hydrocarbon gases trapped within a water molecule lattice (Sassen et al., 2001). These structures generally form, and remain at equilibrium, under high pressure and low temperature conditions (Sloan and Koh, 2007). Gas hydrate accumulation has been documented at HMMV, with the highest hydrate contents estimated on the rim of the active center, where microbial mats are located (Ginsburg et al., 1999). It is thus possible that the destabilization of hydrates led to the release of gaseous methane resulting in the formation of holes on the seabed as gas bubbles escape (Figure 7A). Although, microbial mats could have been negatively affected by gas emission, the relation between times series related to trend 2 is unclear.
Variables not measured in this study, as well as various events, may have blurred the trends visible in the different time series. Although not included here, atmospheric forcing may have affected our results. Surface storms have been shown to have an effect on the deep-sea benthos through changes in bottom currents (Cannon et al., 1991; Matabos et al., 2014; Lelièvre et al., 2017; Chauvet et al., 2018). Moreover, time series may have been affected by stochastic events such as microbial mat resuspension triggered by currents or fish activity. In particular, mat resuspension by zoarcids was observed on several video sequences and may have affected microbial mat cover or particle density. Finally, the mud eruption, that occurred 65 days after the start of this study, had a significant impact on the time series. Changes in seabed morphology and AIM displacement following the eruption led to significant changes in the AIM camera field of view. As a result, time series of data collected after the eruption were too short to be analyzed separately, and only data collected before the eruption were included in the DFA, limiting the robustness of the results. Moreover, the estimation of variables from video footage following the eruption (i.e., zoarcid and hole densities, particle index) may have been affected by changes in the field of view.
Impacts of the Mud Eruption on Fauna, Microbial Mats and Their Environment
The increase in gas and fluid emissions associated with the mud eruption had a significant impact on faunal density, microbial activity, and environmental variables. A steady increase in microbial mat cover and seabed temperature was measured until the eruption. Additionally, the densities of small holes on the seabed, indicative of gas emissions, continuously increased throughout the study period, even after the eruption. Analyses of environmental data time series collected as part of the LOOME observatory corroborated our observations (Feseker et al., 2014b). These analyses showed that the eruption was accompanied by changes in seafloor bathymetry, upward flows of hot fluids and gas flares. Based on our results, it appears that the ascent of hot fluid associated with the eruption may have enhanced anaerobic methane oxidation as well as microbial mat growth by supplying methane, and increased gas emission directly and indirectly by destabilizing gas hydrates (Figure 7B).
Although we did not directly compare microbial mat cover proportions before and after the eruption, the increase in fluid emissions likely resulted in higher microbial mat cover following the eruption, possibly explaining the observed increase in zoarcid fish densities (Figure 7B). Another notable effect of the mud eruption was the increase in pycnogonid densities following the event. Part of the effect may be due to the AIM sinking and getting closer to the sediments, making pycnogonids easier to detect after the eruption. However, it is also possible that the increase in porewater methane concentrations associated with the eruption boosted the production of methane-derived carbon. Pycnogonids, whose isotope signatures suggest reliance on methanotrophic carbon (Decker and Olu, 2012), may thus have been attracted to this fortuitous food input.
Conclusion
In summary, this study is the first to describe intra-annual dynamics in a cold-seep ecosystem and to characterize the impacts of a mud eruption before and after it occurred. Based on a unique data set, we were able to link variations in fluid flow rates to changes in microbial mat cover and faunal densities and to determine how the mud eruption affected seep communities and their biogeochemical environment. Because mud eruptions appear to be relatively frequent at HMMV (Feseker et al., 2008; Foucher et al., 2010), they likely play an important role in structuring seep communities on this mud volcano. Moreover, our results suggest that flow rates and community dynamics in HMMV microbial mat habitats may be modulated by tides, and call for long-term monitoring studies in seep environments to explore the complex interactions occurring in these chemosynthetic ecosystems. Cold seeps, and mud volcanoes in particular, have been granted a lot of attention because they represent important sources of greenhouse gas (e.g., methane) emissions (Milkov et al., 2003; Levin et al., 2016). In particular, there is a serious concern that increasing ocean temperatures due to climate change will lead to the massive release of the methane currently stored in the form of solid gas hydrates at seeps (Wallmann et al., 2012). Methane-oxidizing microorganisms and metazoan-microbe symbioses have the ability to partially remove methane from subsurface sediments, thus limiting its release into the water column (Niemann et al., 2006; Boetius and Wenzhöfer, 2013). Therefore, a better understanding of seep ecosystem dynamics is paramount for evaluating the effectiveness of this microbial filter and for taking appropriate management decisions to limit anthropogenic impact on cold-seep environments.
Data Availability Statement
Raw data collected by the pressure sensor, current meter and thermistor chain are available in the PANGAEA data repository (https://doi.org/10.1594/PANGAEA.830324, Feseker et al., 2014a). Individual datasets can be found under the following DOIs: https://doi.org/10.1594/PANGAEA.757577 (Blandin, 2009; pressure data), https://doi.org/10.1594/PANGAEA.757573 (Wenzhöfer, 2009; current velocity data), https://doi.org/10.1594/PANGAEA.757662 (Feseker, 2009; temperature data).
Author Contributions
KO conceived and designed the study. JS and KO conceived the analytical methods. FG analyzed the data and performed the statistical analyses and wrote the first draft of the manuscript. All authors contributed to manuscript revision, read, and approved the submitted version.
Funding
This work was supported by the LOOME demonstration project of the EU Sixth Framework Programme ESONET (EC No. 036851) and the EU Seventh Framework Programme HERMIONE (EC No. 226354).
Conflict of Interest
The authors declare that the research was conducted in the absence of any commercial or financial relationships that could be construed as a potential conflict of interest.
Acknowledgments
We would like to thank the crews of the RVs Polarstern and Maria S. Merian, as well as the Quest and Cherokee ROV teams for contributing to the successful deployment of the observatory and for their invaluable help with data collection. We are particularly grateful to the chief scientists of the ARKXX1V/2 (M. Klages) and MSM16/2 (A. Boetius) expeditions. We also thank Ifremer’s technical and engineering teams. More specifically, we are grateful to S. Dentrecolas for designing the AIM, J. Blandin for deploying it and L. Dussud for recovering it. We would like to thank the specialists who helped us with faunal identification: S. Iglesias for chondrichthyans, and N. Chernova who initially identified the zoarcid species from HMMV. Finally, we are grateful to M. Aron for developing the MATLAB® programs that allowed us to analyze microbial mat cover and to P. Rodier for his help with surface measurements. This work was supported by the LOOME demonstration project of the EU Sixth Framework Programme ESONET (EC No. 036851) and the EU Seventh Framework Programme HERMIONE (EC No. 226354). We thank the LOOME project principal investigators (D. de Beer for the project and J. Blandin for Ifremer). This manuscript was professionally edited by C. Engel-Gautier.
Supplementary Material
The Supplementary Material for this article can be found online at: https://www.frontiersin.org/articles/10.3389/fmars.2020.00241/full#supplementary-material
References
Aliyev, A. A., Guliyev, I. S., and Boelov, I. S. (2002). Catalogue of Recorded Eruptions of Mud Volcanoes in Azerbaijan (for Period of Years 810–2001). Baku: Nafta Press.
Åström, E. K. L., Carroll, M. L., Ambrose, W. G. Jr., Sen, A., Silyakova, A., and Carroll, J. (2018). Methane cold seeps as biological oases in the high-Arctic deep sea. Limnol. Oceanogr. 63, S209–S231. doi: 10.1002/lno.10732
Barreyre, T., Escartín, J., Sohn, R. A., Cannat, M., Ballu, V., and Crawford, W. C. (2014). Temporal variability and tidal modulation of hydrothermal exit-fluid temperatures at the Lucky Strike deep-sea vent field, Mid-Atlantic Ridge. J. Geophys. Res. Solid Earth 119, 2543–2566. doi: 10.1002/2013JB010478
Bergquist, D. C., Andras, J. P., McNelis, T., Howlett, S., Van Horn, M. J., and Fisher, C. R. (2003). Succession in Gulf of Mexico cold seep vestimentiferan aggregations: the importance of spatial variability. Mar. Ecol. 24, 31–44. doi: 10.1046/j.1439-0485.2003.03800.x
Bergquist, D. C., Williams, F. M., and Fisher, C. R. (2000). Longevity record for deep-sea invertebrate. Nature 403:499. doi: 10.1038/35000647
Blandin, J. (2009). Physical oceanography measurements at the Håkon Mosby mud volcano (LOOME). PANGAEA. doi: 10.1594/PANGAEA.757577
Boetius, A., Ravenschlag, K., Schubert, C. J., Rickert, D., Widdel, F., Gieseke, A., et al. (2000). A marine microbial consortium apparently mediating anaerobic oxidation of methane. Nature 407:623. doi: 10.1038/35036572
Boetius, A., and Wenzhöfer, F. (2013). Seafloor oxygen consumption fuelled by methane from cold seeps. Nat. Geosci. 6:725. doi: 10.1038/ngeo1926
Bowden, D., Rowden, A., Thurber, A., Baco, A., Levin, L., and Smith, C. (2013). Cold seep epifaunal communities on the hikurangi margin, New Zealand: composition, succession, and vulnerability to human activities. PLoS One 8:e76869. doi: 10.1371/journal.pone.0076869
Cannon, G. A., Pashinski, D. J., and Lemon, M. R. (1991). Middepth flow near hydrothermal venting sites on the southern Juan de Fuca Ridge. J. Geophys. Res. Oceans 96, 12815–12831. doi: 10.1029/91jc01023
Chauvet, P., Metaxas, A., Hay, A. E., and Matabos, M. (2018). Annual and seasonal dynamics of deep-sea megafaunal epibenthic communities in Barkley Canyon (British Columbia, Canada): a response to climatology, surface productivity and benthic boundary layer variation. Prog. Oceanogr. 169, 89–105. doi: 10.1016/j.pocean.2018.04.002
Colett, R. (1879). Fiske fra nordhavs-expeditionens sidste Togt, Sommeren 1878. Forh Vidensk Selsk Christiania 14, 1–64.
Cordes, E. E., Bergquist, D. C., Predmore, B. L., Jones, C., Deines, P., Telesnicki, G., et al. (2006). Alternate unstable states: convergent paths of succession in hydrocarbon-seep tubeworm-associated communities. J. Exp. Mar. Biol. Ecol. 339, 159–176. doi: 10.1016/j.jembe.2006.07.017
Cordes, E. E., Cunha, M. R., Galéron, J., Mora, C., Olu-Le Roy, K., Sibuet, M., et al. (2010). The influence of geological, geochemical, and biogenic habitat heterogeneity on seep biodiversity. Mar. Ecol. 31, 51–65. doi: 10.1111/j.1439-0485.2009.00334.x
Cordes, E. E., Hourdez, S., Predmore, B. L., Redding, M. L., and Fisher, C. R. (2005). Succession of hydrocarbon seep communities associated with the long-lived foundation species Lamellibrachia luymesi. Mar. Ecol. Prog. Ser. 305, 17–29. doi: 10.3354/meps305017
Cordes, E. E., McGinley, M. P., Podowski, E. L., Becker, E. L., Lessard-Pilon, S., Viada, S. T., et al. (2008). Coral communities of the deep Gulf of Mexico. Deep Sea Res.Part I Oceanogr. Res. Pap. 55, 777–787. doi: 10.1016/j.dsr.2008.03.005
Costello, M. J., Basher, Z., Mcleod, L., et al. (2017). “Methods for the study of marine biodiversity,” in The GEO Handbook on Biodiversity Observation Networks, eds M. Walters and R. J. Scholes (Cham: Springer), 129–163. doi: 10.1007/978-3-319-27288-7_6
Crone, T. J., and Wilcock, W. S. D. (2005). Modeling the effects of tidal loading on mid-ocean ridge hydrothermal systems. Geochem. Geophys. Geosyst. 6, 1–25. doi: 10.1029/2004GC000905
Cuvelier, D., Legendre, P., Laes, A., Sarradin, P.-M., and Sarrazin, J. (2014). Rhythms and community dynamics of a hydrothermal tubeworm assemblage at main endeavour field – a multidisciplinary deep-sea observatory approach. PLoS One 9:e0096924. doi: 10.1371/journal.pone.0096924
De Beer, D., Sauter, E., Niemann, H., Kaul, N., Foucher, J.-P., Witte, U., et al. (2006). In situ fluxes and zonation of microbial activity in surface sediments of the Håkon Mosby Mud Volcano. Limnol. Oceanogr. 51, 1315–1331. doi: 10.4319/lo.2006.51.3.1315
Decker, C., Morineaux, M., Van Gaever, S., Caprais, J.-C., Lichtschlag, A., Gauthier, O., et al. (2012). Habitat heterogeneity influences cold-seep macrofaunal communities within and among seeps along the Norwegian margin. Part 1: macrofaunal community structure. Mar. Ecol. 33, 205–230. doi: 10.1111/j.1439-0485.2011.00503.x
Decker, C., and Olu, K. (2010). Does macrofaunal nutrition vary among habitats at the Hakon Mosby mud volcano? Cahiers De Biol. Mar. 51, 361–367.
Decker, C., and Olu, K. (2012). Habitat heterogeneity influences cold-seep macrofaunal communities within and among seeps along the Norwegian margin – Part 2: contribution of chemosynthesis and nutritional patterns. Mar. Ecol. 33, 231–245. doi: 10.1111/j.1439-0485.2011.00486.x
Deville, E., and Guerlais, S. H. (2009). Cyclic activity of mud volcanoes: evidences from Trinidad (SE Caribbean). Mar. Petrol. Geol. 26, 1681–1691. doi: 10.1016/j.marpetgeo.2009.03.002
Doya, C., Aguzzi, J., Pardo, M., Matabos, M., Company, J. B., Costa, C., et al. (2014). Diel behavioral rhythms in sablefish (Anoplopoma fimbria) and other benthic species, as recorded by the Deep-sea cabled observatories in Barkley canyon (NEPTUNE-Canada). J. Mar. Syst. 130, 69–78. doi: 10.1016/j.jmarsys.2013.04.003
Durkin, A., Fisher, C. R., and Cordes, E. E. (2017). Extreme longevity in a deep-sea vestimentiferan tubeworm and its implications for the evolution of life history strategies. Sci. Nat. 104:63. doi: 10.1007/s00114-017-1479-z
Feseker, T. (2009). Temperatures at the sediment surface of the Håkon Mosby mud volcano measured continuously with a thermistor string (LOOME). PANGAEA. doi: 10.1594/PANGAEA.757662
Feseker, T., Boetius, A., Wenzhöfer, F., Blandin, J., Olu, K., Yoerger, D., et al. (2014a). “Eruption of the Håkon Mosby mud volcano recorded by the long-term observatory on mud-volcano eruptions (LOOME) between 2009 and 2010”, in: supplement to: Feseker, T et al. (2014): eruption of a deep-sea mud volcano triggers rapid sediment movement. Nat. Commun. 5:5385.
Feseker, T., Boetius, A., Wenzhöfer, F., Blandin, J., Olu, K., Yoerger, D. R., et al. (2014b). Eruption of a deep-sea mud volcano triggers rapid sediment movement. Nat. Commun. 5:5385. doi: 10.1038/ncomms6385
Feseker, T., Foucher, J. P., and Harmegnies, F. (2008). Fluid flow or mud eruptions? Sediment temperature distributions on Håkon Mosby mud volcano, SW Barents Sea slope. Mar. Geol. 247, 194–207. doi: 10.1016/j.margeo.2007.09.005
Fisher, C., Roberts, H., Cordes, E., and Bernard, B. (2007). Cold seeps and associated communities of the Gulf of Mexico. Oceanography 20, 118–129. doi: 10.5670/oceanog.2007.12
Foucher, J.-P., Dupré, S., Scalabrin, C., Feseker, T., Harmegnies, F., and Nouzé, H. (2010). Changes in seabed morphology, mud temperature and free gas venting at the Håkon Mosby mud volcano, offshore northern Norway, over the time period 2003–2006. Geo Mar. Lett. 30, 157–167. doi: 10.1007/s00367-010-0193-z
Gebruk, A., Krylova, E. M., Lein, A. Y., Vinogradov, G. M., Anderson, E., Pimenov, N. V., et al. (2003). Methane seep community of the Håkon Mosby mud volcano (the Norwegian Sea): composition and trophic aspects. Sarsia 88, 394–403. doi: 10.1080/00364820310003190
Ginsburg, G. D., Milkov, A. V., Soloviev, V. A., Egorov, A. V., Cherkashev, G. A., Vogt, P. R., et al. (1999). Gas hydrate accumulation at the Håkon Mosby Mud Volcano. Geo Mar. Lett. 19, 57–67. doi: 10.1007/s003670050093
Glover, A. G., Gooday, A. J., Bailey, D. M., Billett, D. S. M., Chevaldonné, P., Colaço, A., et al. (2010). Temporal change in deep-sea benthic ecosystems. a review of the evidence from recent time-series studies. Adv. Mar. Biol. 58, 1–95. doi: 10.1016/B978-0-12-381015-1.00001-0
Harvey, A. C. (1989). Forecasting, structural time series models and the Kalman filter. Cambridge, MA: Cambridge University Press.
Hildebrandt, N., Bergmann, M., and Knust, R. (2011). Longevity and growth efficiency of two deep-dwelling Arctic zoarcids and comparison with eight other zoarcid species from different climatic regions. Polar Biol. 34:1523. doi: 10.1007/s00300-011-1011-4
Holmes, E. E., Ward, E. J., and Wills, K. (2012). MARSS: multivariate autoregressive state-space models for analyzing time-series data. R J. 4, 11–19.
Jerosch, K., Schlüter, M., Foucher, J.-P., Allais, A.-G., Klages, M., and Edy, C. (2007). Spatial distribution of mud flows, chemoautotrophic communities, and biogeochemical habitats at Håkon Mosby Mud Volcano. Mar. Geol. 243, 1–17. doi: 10.1016/j.margeo.2007.03.010
Juniper, S. K., Matabos, M., Mihály, S., Ajayamohan, R. S., Gervais, F., and Bui, A. O. V. (2013). A year in Barkley Canyon: a time-series observatory study of mid-slope benthos and habitat dynamics using the NEPTUNE Canada network. Deep Sea Res. II Top. Stud. Oceanogr. 92, 114–123. doi: 10.1016/j.dsr2.2013.03.038
Lelièvre, Y., Legendre, P., Matabos, M., Mihály, S., Lee Raymond, W., Sarradin, P. M., et al. (2017). Astronomical and atmospheric impacts on deep-sea hydrothermal vent invertebrates. Proc. R. Soc. B Biol. Sci. 284:20162123. doi: 10.1098/rspb.2016.2123
Lessard-Pilon, S., Porter, M. D., Cordes, E. E., MacDonald, I., and Fisher, C. R. (2010). Community composition and temporal change at deep Gulf of Mexico cold seeps. Deep Sea Res. II Top. Stud. Oceanogr. 57, 1891–1903. doi: 10.1016/j.dsr2.2010.05.012
Levin, L. A. (2005). “Ecology of cold seep sediments: interactions of fauna with flow, chemistry and microbes,” in Oceanography and Marine Biology: Annual Review, eds R. N. Gibson, R. J. A. Atkinson, and J. D. M. Gordon (Milton Park: Taylor & Francis), 1–46. doi: 10.1201/9781420037449.ch1
Levin, L. A., Baco, A. R., Bowden, D. A., Colaco, A., Cordes, E. E., Cunha, M. R., et al. (2016). Hydrothermal vents and methane seeps: rethinking the sphere of influence. Front. Mar. Sci. 3:72. doi: 10.3389/fmars.2016.00072
Linnaeus, C. (1758). Systema Naturae Per Regna Tria Naturae, Secundum Classes, Ordines, Genera, Species, Cum Characteribus, Differentiis, Synonymis, Locis. Holmiae: Impensis Direct. Laurentii Salvii.
Lovett, G. M., Burns, D. A., Driscoll, C. T., Jenkins, J. C., Mitchell, M. J., Rustad, L., et al. (2007). Who needs environmental monitoring? Front. Ecol. Environ. 5, 253–260. doi: 10.1890/1540-929520075[253:WNEM]2.0.CO;2
MacAvoy, S. E., Carney, R. S., Fisher, C. R., and Macko, S. A. (2002). Use of chemosynthetic biomass by large, mobile, benthic predators in the Gulf of Mexico. Mar. Ecol. Prog. Ser. 225, 65–78. doi: 10.3354/meps225065
MacDonald, I. R., Brooks, J. M., Lee, L., Guinasso, N. L. Jr., Sassen, R., and Scott, K. T. (1994). Gas hydrate that breaches the sea floor on the continental slope of the Gulf of Mexico. Geology 22, 699–702.
Marcon, Y., Sahling, H., Allais, A. G., Bohrmann, G., and Olu, K. (2014). Distribution and temporal variation of mega-fauna at the Regab pockmark (Northern Congo Fan), based on a comparison of videomosaics and geographic information systems analyses. Mar. Ecol. 35, 77–95. doi: 10.1111/maec.12056
Matabos, M., Bui, A. O. V., Mihály, S., Aguzzi, J., Juniper, S. K., and Ajayamohan, R. S. (2014). High-frequency study of epibenthic megafaunal community dynamics in Barkley Canyon: a multi-disciplinary approach using the NEPTUNE Canada network. J. Mar. Syst. 130, 56–68. doi: 10.1016/j.jmarsys.2013.05.002
Milkov, A. V., Sassen, R., Apanasovich, T. V., and Dadashev, F. G. (2003). Global gas flux from mud volcanoes: a significant source of fossil methane in the atmosphere and the ocean. Geophys. Res. Lett. 30, 1–4. doi: 10.1029/2002gl016358
Møller, M. M., Nielsen, L. P., and Jørgensen, B. B. (1985). Oxygen responses and mat formation by Beggiatoa spp. Appl. Environ. Microbiol. 50, 373–382. doi: 10.1128/aem.50.2.373-382.1985
Nakajima, R., Chen, C., Iwase, R., Yamamoto, H., and Fujikura, K. (2019). Clams after storms: the impact of multiple disturbances on seep vesicomyid clams revealed by long-term monitoring. Mar. Biol. 166:35. doi: 10.1007/s00227-019-3484-6
Niemann, H., Linke, P., Knittel, K., MacPherson, E., Boetius, A., Brückmann, W., et al. (2013). Methane-carbon flow into the benthic food web at cold seeps – a case study from the costa rica subduction zone. PLoS One 8:e74894. doi: 10.1371/journal.pone.0074894
Niemann, H., Lösekann, T., de Beer, D., Elvert, M., Nadalig, T., Knittel, K., et al. (2006). Novel microbial communities of the Haakon Mosby mud volcano and their role as a methane sink. Nature 443:854. doi: 10.1038/nature05227
Olu, K., Caprais, J. C., Galéron, J., Causse, R., von Cosel, R., Budzinski, H., et al. (2009). Influence of seep emission on the non-symbiont-bearing fauna and vagrant species at an active giant pockmark in the Gulf of Guinea (Congo–Angola margin). Deep Sea Res. Part II Top. Stud. Oceanogr. 56, 2380–2393. doi: 10.1016/j.dsr2.2009.04.017
R Core Team (2014). A Language and Environment for Statistical Computing. Vienna: R Foundation for Statistical Computing.
Rybakova, E., Galkin, S., Bergmann, M., Soltwedel, T., and Gebruk, A. (2013). Density and distribution of megafauna at the Håkon Mosby Mud Volcano (the Barents Sea) based on image analysis. Biogeosciences 10, 3359–3374. doi: 10.5194/bg-10-3359-2013
Sarrazin, J., Robigou, V., Juniper, S. K., and Delaney, J. R. (1997). Biological and geological dynamics over four years on a high-temperature sulfide structure at the Juan de Fuca Ridge hydrothermal observatory. Mar. Ecol. Prog. Ser. 153, 5–24. doi: 10.3354/meps153005
Sars, G. (1877). Prodromus descriptionis crustaceorum et pycnogonidarum, qvae in Expeditione Norvegica anno 1876 observavit. Arch. Math. Nat. 2, 337–371.
Sassen, R., Losh, S. L., Cathles, L., Roberts, H. H., Whelan, J. K., Milkov, A. V., et al. (2001). Massive vein-filling gas hydrate: relation to ongoing gas migration from the deep subsurface in the Gulf of Mexico. Mar. Petrol. Geol. 18, 551–560. doi: 10.1016/S0264-8172(01)00014-9
Seabrook, S., De Leo, F. C., and Thurber, A. R. (2019). Flipping for food: the use of a methane seep by tanner crabs (Chionoecetes tanneri). Front. Mar. Sci. 6:43. doi: 10.3389/fmars.2019.00043
Sen, A., Åström, E. K. L., Hong, W. L., Portnov, A., Waage, M., Serov, P., et al. (2018). Geophysical and geochemical controls on the megafaunal community of a high Arctic cold seep. Biogeosciences 15, 4533–4559. doi: 10.5194/bg-15-4533-2018
Sen, A., Himmler, T., Hong, W. L., Chitkara, C., Lee, R. W., Ferré, B., et al. (2019). Atypical biological features of a new cold seep site on the Lofoten-Vesterålen continental margin (northern Norway). Sci. Rep. 9:1762. doi: 10.1038/s41598-018-38070-9
Sibuet, M., and Olu, K. (1998). Biogeography, biodiversity and fluid dependence of deep-sea cold-seep communities at active and passive margins. Deep Sea Res. Part II Top. Stud. Oceanogr. 45, 517–567. doi: 10.1016/S0967-0645(97)00074-X
Sibuet, M., and Roy, K. O.-L. (2002). “Cold seep communities on continental margins: structure and quantitative distribution relative to geological and fluid venting patterns,” in Ocean Margin Systems, eds G. Wefer, D. Billett, D. Hebbeln, B. B. Jørgensen, M. Schlüter, and T. C. E. van Weering (Berlin: Springer), 235–251. doi: 10.1007/978-3-662-05127-6_15
Smirnov, R. V. (2000). Two new species of Pogonophora from the arctic mud volcano off northwestern Norway. Sarsia 85, 141–150. doi: 10.1080/00364827.2000.10414563
Smith, C. R. (1994). Tempo and Mode in Deep-Sea benthic ecology: punctuated equilibrium revisited. PALAIOS 9, 3–13. doi: 10.2307/3515074
Smith, E. B., Scott, K. M., Nix, E. R., Korte, C., and Fisher, C. R. (2000). Growth and condition of seep mussels (Bathymodiolus childressi) at a Gulf of Mexico brine pool. Ecology 81, 2392–2403. doi: 10.1890/0012-9658(2000)081
Tivey, M. K., Bradley, A. M., Joyce, T. M., and Kadko, D. (2002). Insights into tide-related variability at seafloor hydrothermal vents from time-series temperature measurements. Earth Planet. Sci. Lett. 202, 693–707. doi: 10.1016/S0012-821X(02)00801-4
Van Gaever, S., Moodley, L., De Beer, D., and Vanreusel, A. (2006). Meiobenthos at the Arctic Håkon Mosby Mud Volcano, with a parental-caring nematode thriving in sulphide-rich sediments. Mar. Ecol. Prog. Ser. 321, 143–155. doi: 10.3354/meps321143
Vogt, P. R., Cherkashev, G., Ginsburg, G., Ivanov, G., Milkov, A., Crane, K., et al. (1997). Haakon Mosby Mud Volcano provides unusual example of venting. Eos Trans. Am. Geophys. Union 78, 549–557. doi: 10.1029/97EO00326
Wagner, H. J., Kemp, K., Mattheus, U., and Priede, I. G. (2007). Rhythms at the bottom of the deep sea: Cyclic current flow changes and melatonin patterns in two species of demersal fish. Deep Sea Res. Part I Oceanogr. Res. Pap. 54, 1944–1956. doi: 10.1016/j.dsr.2007.08.005
Wallmann, K., Pinero, E., Burwicz, E., Haeckel, M., Hensen, C., Dale, A., et al. (2012). The global inventory of methane hydrate in marine sediments: a theoretical approach. Energies 5, 2449–2498. doi: 10.3390/en5072449
Wenzhöfer, F. (2009). Autonomous recording current meter measurements at the Håkon Mosby mud volcano (LOOME). PANGAEA. doi: 10.1594/PANGAEA.757573
Keywords: Håkon Mosby Mud Volcano, LOOME, Arctic, Beggiatoa, deep-sea observatories, time series, megafauna
Citation: Girard F, Sarrazin J and Olu K (2020) Impacts of an Eruption on Cold-Seep Microbial and Faunal Dynamics at a Mud Volcano. Front. Mar. Sci. 7:241. doi: 10.3389/fmars.2020.00241
Received: 13 May 2019; Accepted: 27 March 2020;
Published: 21 April 2020.
Edited by:
Stefán Áki Ragnarsson, Marine and Freshwater Research Institute, IcelandReviewed by:
Paulo Yukio Gomes Sumida, University of São Paulo, BrazilJulian Mariano Burgos, Marine and Freshwater Research Institute, Iceland
Copyright © 2020 Girard, Sarrazin and Olu. This is an open-access article distributed under the terms of the Creative Commons Attribution License (CC BY). The use, distribution or reproduction in other forums is permitted, provided the original author(s) and the copyright owner(s) are credited and that the original publication in this journal is cited, in accordance with accepted academic practice. No use, distribution or reproduction is permitted which does not comply with these terms.
*Correspondence: Fanny Girard, ZmFubnkuZ2lyYXJkMTNAZ21haWwuY29t