 Miriam I. Brandt1*
 Blandine Trouche2
 Nicolas Henry3,4
 Cathy Liautard-Haag1
 Lois Maignien2
 Colomban de Vargas3,4Patrick Wincker4,5
 Julie Poulain4,5
 Daniela Zeppilli6
 Sophie Arnaud-Haond1*
- 1MARBEC, Univ Montpellier, Ifremer, IRD, CNRS, Sète, France
- 2Laboratoire de Microbiologie des Environnements Extrêmes (LM2E), Univ Brest, CNRS, Ifremer, Plouzané, France
- 3Sorbonne Université, CNRS, Station Biologique de Roscoff, AD2M, UMR 7144, Roscoff, France
- 4Research Federation for the Study of Global Ocean Systems Ecology and Evolution, FR2022/Tara Oceans GOSEE, Paris, France
- 5Génomique Métabolique, Genoscope, Institut François Jacob, CEA, CNRS, Univ. Evry, Université Paris-Saclay, Evry, France
- 6Ifremer, Centre Brest, REM/EEP/LEP, ZI de la Pointe du Diable, CS10070, Plouzané, France
The abyssal seafloor covers more than 50% of planet Earth and is a large reservoir of still mostly undescribed biodiversity. It is increasingly targeted by resource-extraction industries and yet is drastically understudied. In such remote and hard-to-access ecosystems, environmental DNA (eDNA) metabarcoding is a useful and efficient tool for studying biodiversity and implementing environmental impact assessments. Yet, eDNA analysis outcomes may be biased toward describing past rather than present communities as sediments contain both contemporary and ancient DNA. Using commercially available kits, we investigated the impacts of five molecular processing methods on eDNA metabarcoding biodiversity inventories targeting prokaryotes (16S), unicellular eukaryotes (18S-V4), and metazoans (18S-V1, COI). As the size distribution of ancient DNA is skewed toward small fragments, we evaluated the effect of removing short DNA fragments via size selection and ethanol reconcentration using eDNA extracted from 10 g of sediment at five deep-sea sites. We also compare communities revealed by eDNA and environmental RNA (eRNA) co-extracted from ∼2 g of sediment at the same sites. Results show that removing short DNA fragments does not affect alpha and beta diversity estimates in any of the biological compartments investigated. Results also confirm doubts regarding the possibility to better describe live communities using eRNA. With ribosomal loci, eRNA, while resolving similar spatial patterns than co-extracted eDNA, resulted in significantly higher richness estimates, supporting hypotheses of increased persistence of ribosomal RNA (rRNA) in the environment and unmeasured bias due to overabundance of rRNA and RNA release. With the mitochondrial locus, eRNA detected lower metazoan richness and resolved fewer spatial patterns than co-extracted eDNA, reflecting high messenger RNA lability. Results also highlight the importance of using large amounts of sediment (≥10 g) for accurately surveying eukaryotic diversity. We conclude that eDNA should be favored over eRNA for logistically realistic, repeatable, and reliable surveys and confirm that large sediment samples (≥10 g) deliver more complete and accurate assessments of benthic eukaryotic biodiversity and that increasing the number of biological rather than technical replicates is important to infer robust ecological patterns.
Introduction
Environmental DNA (eDNA) metabarcoding is an increasingly used tool for biodiversity inventories and ecological surveys. Using high-throughput sequencing (HTS) and bioinformatic processing, it allows the detection or the inventory of target organisms using their DNA directly extracted from soil, water, or air samples (Taberlet et al., 2012a). As it does not require specimen isolation, it represents a practical and efficient tool in large and hard-to-access ecosystems, such as the marine realm. Besides allowing studying various biological compartments simultaneously, metabarcoding is also very effective for detecting diversity of small organisms (microorganisms, meiofauna) largely disregarded in visual biodiversity inventories due to the difficulty of their identification based on morphological features (Carugati et al., 2015).
The deep sea, covering more than 50% of Planet Earth, remains critically understudied, despite being increasingly impacted by anthropogenic activities and targeted by resource-extraction industries (Ramirez-Llodra et al., 2011). The abyssal seafloor is mostly composed of sedimentary habitats containing high numbers of small (< 1 mm) organisms, and characterized by high local and regional diversity (Grassle and Maciolek, 1992; Smith and Snelgrove, 2002). Given the increased time efficiency offered by eDNA metabarcoding and its wide taxonomic applicability, this tool is a good candidate for large-scale biodiversity surveys and environmental impact assessments (EIAs) in the deep-sea biome.
eDNA is a complex mixture of genomic DNA present in living cells, extra-organismal DNA, and extracellular DNA originating from the degradation of organic material and biological secretions (Torti et al., 2015). Extracellular DNA has been shown to be very abundant in marine sediments, representing 50–90% of the total DNA pool (Dell’Anno and Danovaro, 2005; Corinaldesi et al., 2018). However, this extracellular DNA compartment may not only contain DNA from contemporary communities. Indeed, nucleic acids can persist in marine sediments as their degradation rate decreases due to adsorption onto the sediment matrix (Corinaldesi et al., 2008; Torti et al., 2015). Low temperatures, high salt concentrations, and the absence of UV light are additional factors enhancing long-term archiving of DNA in deep-sea sediments (Torti et al., 2015; Nagler et al., 2018). Decreased rates of abiotic DNA decay can thus allow DNA persistence over millennial timescales. Indeed, up to 125,000-year-old ancient DNA (aDNA) has been reported in oxic and anoxic marine sediments at various depths (Boere et al., 2011; Coolen et al., 2013; Lejzerowicz et al., 2013a). As extracellular DNA fragment size depends on its state of degradation (Nagler et al., 2018 report overall size ranges from 80 to over 20,000 bp), aDNA fragments have generally been reported to be <1,000 bp long (Boere et al., 2011; Coolen et al., 2013; Lejzerowicz et al., 2013a; Lennon et al., 2018). Restricting molecular biodiversity assessments to large DNA fragments may thus allow avoiding the bias of aDNA in biodiversity assessments aiming at describing contemporary communities using eDNA metabarcoding.
Environmental RNA (eRNA) has been viewed as a way to avoid the problem of aDNA in eDNA biodiversity inventories because RNA is only produced by living organisms and quickly degrades when released in the environment due to spontaneous hydrolysis and the abundance of RNases (Torti et al., 2015). Few studies have investigated this in the deep-sea, with contrasting results. Investigating foraminiferal assemblages, Lejzerowicz et al. (2013b) found similar taxonomic compositions with DNA and RNA, although highlighting that RNA is more appropriate for targeting the active community component. Contrastingly, Guardiola et al. (2016) detected marked differences between RNA and DNA inventories for most eukaryotic groups but found that both biomolecules detected similar patterns of ecological differentiation, concluding that “dead” DNA did not blur patterns of community structure. Laroche et al. (2018, 2017) found stronger responses to environmental impact in alpha diversity measured with eRNA, while eDNA was better at detecting effects on community composition. Finally, long-term archived and even fossil RNA were also reported in sediment and soil (Orsi et al., 2013; Cristescu, 2019), casting doubts as to its advantage over DNA to inventory contemporary biodiversity.
The design of a sound environmental metabarcoding protocol to inventory biodiversity on the deep seafloor relies on a better understanding of the potential influence of aDNA on the different taxonomic compartments targeted. Using commercially available kits based on 2 and 10 g of sediment, we studied samples from five deep-sea sites encompassing three different habitats and spanning wide geographic ranges in order to select an optimal protocol to survey contemporary benthic deep-sea communities spanning the tree of life. We analyze eDNA and eRNA extracts via metabarcoding, targeting the V4–V5 regions of the 16S ribosomal RNA (rRNA) barcode (Parada et al., 2016) for prokaryotes, the 18S-V4 rRNA barcode region for micro-eukaryotes (Stoeck et al., 2010), and the 18S-V1V2 rRNA (thereafter 18S-V1) and Cytochrome c Oxidase I (COI) barcode markers for metazoans (Leray et al., 2013; Sinniger et al., 2016).
Our objectives were threefold:
(1) Evaluate the effect of removing short DNA fragments from DNA extracts obtained using a 10-g extraction kit,
(2) Compare eDNA and eRNA inventories resulting from the same samples via a 2-g joint extraction kit, and
(3) Assess the aforementioned kits in terms of repeatability and suitability for different taxonomic compartments.
Materials and Methods
Collection of Samples
Sediment cores were collected from five deep-sea sites from various habitats (mud volcano, seamounts, and an area close to hydrothermal vents; Supplementary Table S1). Triplicate tube cores were collected with a multicorer or with a remotely operated vehicle at each sampling site. The sediment cores were sliced into layers, which were transferred into zip-lock bags, homogenized, and frozen at −80°C onboard before being shipped on dry ice to the laboratory. The first layer (0–1 cm) was used for the present analysis. In each sampling series, an empty bag was kept as a field control processed through DNA extraction and sequencing.
Nucleic Acid Extractions and Molecular Treatments
eDNA With the 10-g PowerMax Kit
DNA extractions were performed using ∼10 g of sediment with the PowerMax Soil DNA Isolation Kit (MO BIO Laboratories, Inc., Qiagen, Hilden, Germany). To increase the DNA yield, the elution buffer was left on the spin filter membrane for 10 min at room temperature before centrifugation. For field controls, the first solution of the kit was poured into the control zip lock before following the usual extraction steps. DNA extracts were stored at −80°C.
Size Selection of eDNA Extracts
Size selection of total eDNA extracted as detailed above from ∼10 g of sediment was carried out to remove small DNA fragments. NucleoMag NGS Clean-up and Size Select beads (Macherey-Nagel, Düren, Germany) were used at a ratio of 0.5 × for removing DNA fragments <1,000 bp from 500 μl of extracted eDNA. The target fragments were eluted from the beads with 100 μl elution buffer, and successful size selection was verified by electrophoresis on an Agilent TapeStation using the Genomic DNA High ScreenTape kit (Agilent Technologies, Santa Clara, CA, United States).
Ethanol Reconcentration of eDNA Extracts
A 3.5 ml aliquot of eDNA extracted from ∼10 g of sediment was reconcentrated with 7 ml of 96% ethanol (EtOH) and 200 μl of 5 M sodium chloride (NaCl), according to the guidelines in the Hints and Troubleshooting Guide of the PowerMax Soil DNA Isolation Kit. As this protocol does not include any incubation time, it favors large DNA fragments. The DNA pellet was washed with 1 ml 70% EtOH, centrifuged again for 15 min at 2,500 × g, and air-dried before being resuspended in 450 μl elution buffer.
Joint Environmental DNA/RNA With the 2-g RNeasy PowerSoil Kit
Joint RNA/DNA extractions were performed with the RNA PowerSoil Total RNA Isolation Kit combined with the RNeasy PowerSoil DNA elution kit (MO BIO Laboratories, Inc., Qiagen, Hilden, Germany). Between 3 and 5 g of wet and frozen sediment were used, following the manufacturer’s suggestions for marine sediments (Supplementary Table S2). Extraction controls were performed alongside sample extractions. The RNA pellet was resuspended in 60 μl of RNase/DNase-free water. Extracted RNA was then transcribed to first-strand complementary DNA (cDNA) using the iScript Select cDNA synthesis kit (Bio-Rad Laboratories, CA, United States) with its proprietary random primer mix. Quality control 16S-V4V5, 18S-V1, and COI PCRs were performed on the RNA extracts to test for potential DNA contamination.
PCR Amplification and Sequencing
Nucleic acid extracts were normalized to 0.25 ng/μl, and 10 μl of standardized samples were used in PCR. Four primer pairs were used to amplify one mitochondrial and three rRNA barcode loci targeting metazoans (COI, 18S-V1), micro-eukaryotes (18S-V4), and prokaryotes (16S-V4V5 for homogeneity; Supplementary Table S3). Two metazoan mock communities (detailed in Brandt et al., 2020) were included for 18S-V1 and COI. For each sample and marker, triplicate amplicon libraries (see Supporting Information for amplification details) were prepared by ligation of Illumina adapters on 100 ng of amplicons following the Kapa Hifi HotStart NGS Library Amplification Kit (Kapa Biosystems, Wilmington, MA, United States). After quantification and quality control, library concentrations were normalized to 10 nM, and 8–9 pM of each library containing a 20% PhiX spike-in were sequenced on a HiSeq2500 (System User Guide Part #15035786) instruments in a 250 bp paired-end mode.
Bioinformatic Analyses
All bioinformatic analyses were performed using a Unix shell script (Brandt et al., 2020), available on Gitlab1, on a home-based cluster (DATARMOR, Ifremer). The details of the pipeline, along with specific parameters used for all metabarcoding markers, are given in Supplementary Table S4 and in Brandt et al. (2020). Pairs of Illumina reads were corrected with DADA2 v.1.10 (Callahan et al., 2016) following the online tutorial for paired-end data2 and delivered inventories of amplicon sequence variants (ASVs). Metazoan data were further clustered into operational taxonomic units (OTUs) with swarm v2, a single-linkage clustering algorithm (Mahé et al., 2015) that aggregates sequences iteratively and locally around seed sequences based on d, the number of nucleotide differences, to determine coherent groups of sequences, independent of amplicon input order, allowing highly scalable and fine-scale clustering. ASVs were swarm clustered at d-values of 4 for 18S-V1 and 6 for COI, using the FROGS pipeline (Escudié et al., 2018).
We chose to evaluate micro-eukaryote and prokaryote diversity at the ASV level due to its increasing use in the literature (Callahan et al., 2017). Although the use of OTUs may also be justified for microbial diversity depending on study objectives (Brandt et al., 2020), we did not expect an alteration of alpha and beta diversity patterns between ASV and OTU levels for the different molecular treatments investigated. ASVs and OTUs were taxonomically assigned via BLAST + (v2.6.0) based on minimum similarity and minimum coverage (-perc_identity 70 and –qcov_hsp 80). For ASVs, sequences obtained with DADA2 were subsequently assigned with blastn. For OTUs, BLAST assignment in FROGS was performed using the affiliation_OTU.py command. It is not uncommon for deep-sea taxa to have closest relatives in databases (even congenerics) exhibiting nucleotide divergence exceeding 20% (Shank et al., 1999; Herrera et al., 2015). Considering our interest in diverse and poorly characterized communities, more stringent BLAST thresholds were thus not implemented at this stage. However, additional filters were performed during downstream bioinformatic processing described below, and taxonomic information was used at phylum level, only when the assignment was deemed reliable at this taxonomic level. The Silva132 reference database was used for taxonomic assignment of rRNA marker genes (Quast et al., 2012), and MIDORI-UNIQUE (Machida et al., 2017) was used for COI.
Molecular inventories were refined in R v.3.5.1 (R Core Team, 2018). A blank correction was made using the decontam package v.1.2.1 (Davis et al., 2018), removing all clusters that were more prevalent in negative control samples than in true or mock samples. Unassigned and non-target clusters were removed. Additionally, for metazoan loci, all clusters with a terrestrial assignment (groups known to be terrestrial-only) were removed. Samples with fewer than 10,000 target reads were discarded. We performed an abundance renormalization to remove spurious ASVs/OTUs due to random tag switching (Wangensteen and Turon, 2016). The COI OTU table was further curated with LULU v.0.1 (Frøslev et al., 2017) to limit the bias due to pseudogenes, using a minimum co-occurrence of 0.93 and a minimum similarity threshold of 84%.
Statistical Analyses
Sequence tables were analyzed using R with the packages phyloseq v1.22.3 (McMurdie and Holmes, 2013), following guidelines in online tutorials3, and vegan v2.5.2 (Oksanen et al., 2018). Alpha diversity between molecular processing methods was estimated with the number of observed target clusters in rarefied datasets. Cluster abundances were compared via analyses of deviances (ANODEV) on generalized linear mixed models using negative binomial distributions, as the data were overdispersed. Pairwise post hoc comparisons were performed via Tukey honestly significant difference (HSD) tests using the emmeans package.
Homogeneity of multivariate dispersions was evaluated with the betapart package v.1.5.1 (Baselga and Orme, 2012), and statistical tests performed on balanced datasets for COI as dispersions were different between 2- and 10-g datasets (Supplementary Table S5). Data were rarefied for metazoans and Hellinger-normalized for microbial data.
Differences in community compositions resulting from molecular processing were evaluated with Mantel tests (Jaccard and Bray-Curtis dissimilarities for metazoan and microbial taxa, respectively; Pearson’s product–moment correlation; 1,000 permutations). Permutational multivariate analysis of variance (PERMANOVA) was performed on normalized datasets to evaluate the effect of molecular processing and site on community compositions using the function adonis2 (vegan) with Jaccard dissimilarities (presence/absence) for metazoan and Bray–Curtis dissimilarities for prokaryotes and micro-eukaryotes. The rationale behind this choice is that metazoans are multicellular organisms of extremely varying numbers of cells, organelles, or ribosomal repeats in their genomes, and can also be detected through a diversity of remains. The number of reads can thus not be expected to reflect the abundance of detected OTUs. Significance was evaluated via marginal effects of terms using 10,000 permutations with site as a blocking factor. Pairwise post hoc comparisons were performed via the pairwiseAdonis package, with site as a blocking factor. Differences between samples were visualized via principal coordinates analysis (PCoA) based on the abovementioned dissimilarities.
Finally, taxonomic compositions in terms of cluster and read abundance were compared between molecular processing methods. In order to compare accurately phylum-level taxonomic compositions, datasets were subsampled to clusters having a minimum hit identity of 86% for rRNA loci and 80% for COI. These values were chosen as they represent approximate minimum identity for reliable phylum assignment (Stefanni et al., 2018).
Results
High-Throughput Sequencing Results
A total of 70 million 18S-V1 reads, 61 million COI reads, 30 million 18S-V4 reads, and 45 million 16S-V4V5 reads were obtained from four Illumina HiSeq runs of pooled amplicon libraries built from triplicate PCR replicates of 75 sediment samples, two mock communities (for 18S-V1 and COI), three extraction blanks, and two to four PCR negative controls (Supplementary Table S6). One to seven sediment samples failed amplification in each dataset. These were always coming from the same sampling sites (MDW-ST117 and MDW-ST38) and predominantly comprised RNA samples (Supplementary Table S6). After bioinformatic processing, read numbers were reduced to 44 million for 18S-V1, 45 million for COI, 16 million for 18S-V4, and 24 million for 16S-V4V5 (Supplementary Table S6). For eukaryote markers, fewer reads were retained in negative controls (2–64%) than in true or mock samples (49–83%), while the opposite was observed for prokaryotes with 16S-V4V5 (62% of reads retained in control samples against 49–57% in true samples). Negative control samples (extraction and PCR blanks) contained 0.001–0.6% of total processed reads compared to 1.3–1.5% in true samples.
DNA extracts obtained from the joint DNA/RNA protocol based on the 2-g kit produced fewer eukaryotic reads than DNA extracts from the 10-g kit, while similar yields were obtained for prokaryotes. RNA extracts produced more reads than DNA extracts with the ribosomal loci, while they produced fewer reads with the mitochondrial COI locus (Supplementary Table S6).
After data refining, abundance renormalization (Wangensteen and Turon, 2016), and LULU curation for COI, the final datasets comprised between 8.6 and 16.2 million target reads for eukaryotes and 21.7 million prokaryote reads. Target reads delivered 4,333 and 6,031 metazoan OTUs for COI and 18S-V1 respectively, 40,868 micro-eukaryote 18S-V4 ASVs, and 138,478 prokaryote 16S-V4V5 ASVs (Supplementary Table S6).
Alpha Diversity Between Processing Methods
Rarefaction curves showed that a plateau was reached for all samples, suggesting an overall sequencing depth adequate to capture the diversity present (Supplementary Figure S1). Processing methods significantly affected the number of recovered eukaryote and prokaryote clusters, and significant variability among sites was detected for 18S-V1 for homogeneity and 18S-V4 (Table 1 and Supplementary Figure S2).
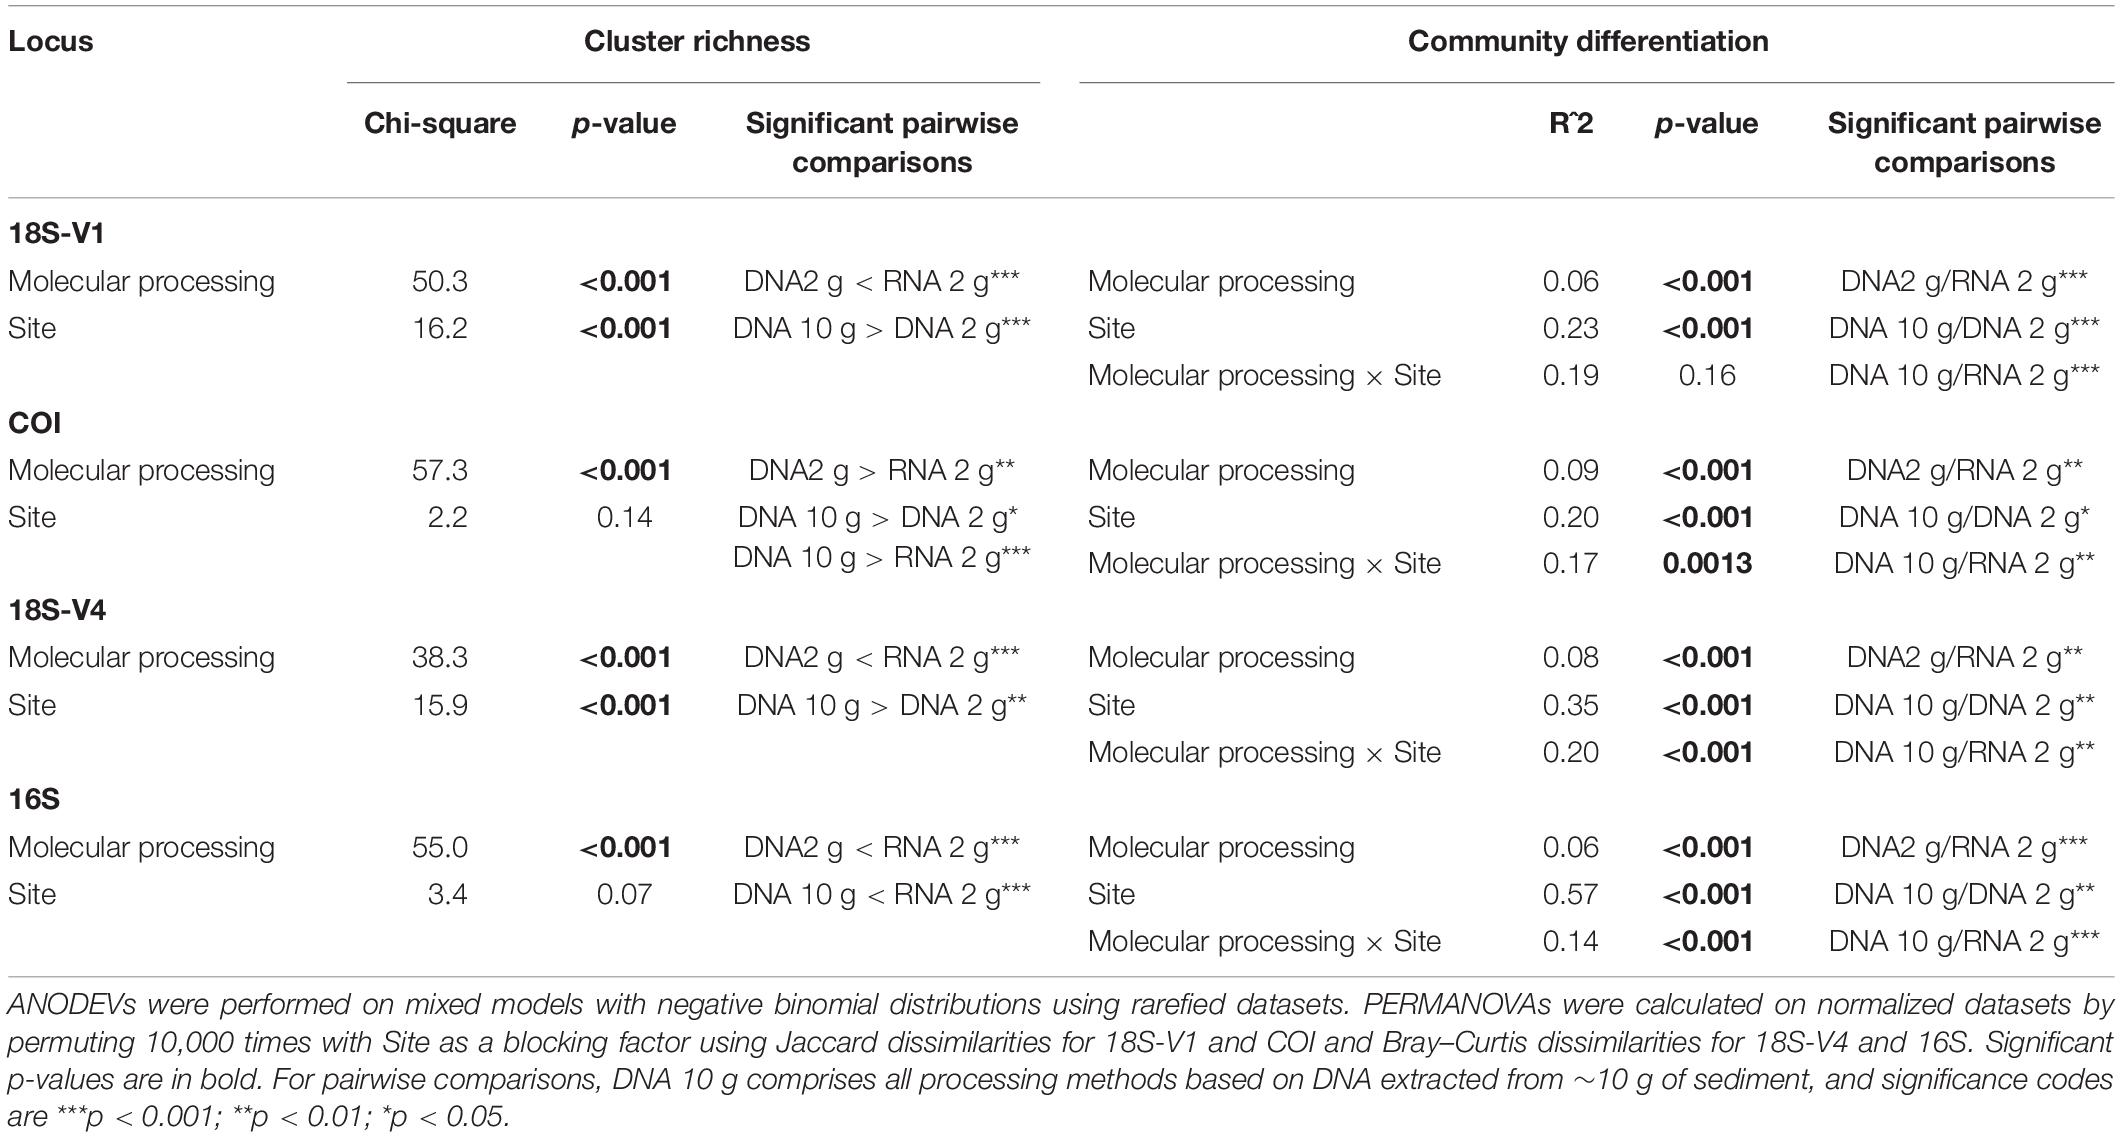
Table 1. Changes in cluster richness and community structures with molecular processing method (DNA 10 g: DNA extracts from ∼10 g of sediment with the PowerMax Soil kit; DNA/RNA 2 g: DNA/RNA extracts from ∼2 g of sediment with the RNeasy PowerSoil kit) and site for the four studied genes.
Molecular processing designed to remove small DNA fragments (i.e., size selection of DNA to remove fragment <1,000 bp and EtOH reconcentration) did not significantly affect recovered cluster numbers obtained from eDNA extracted from 10 g of sediment for any of the loci investigated (Figure 1 and Table 1; Tukey’s HSD multiple comparisons tests, p > 0.9).
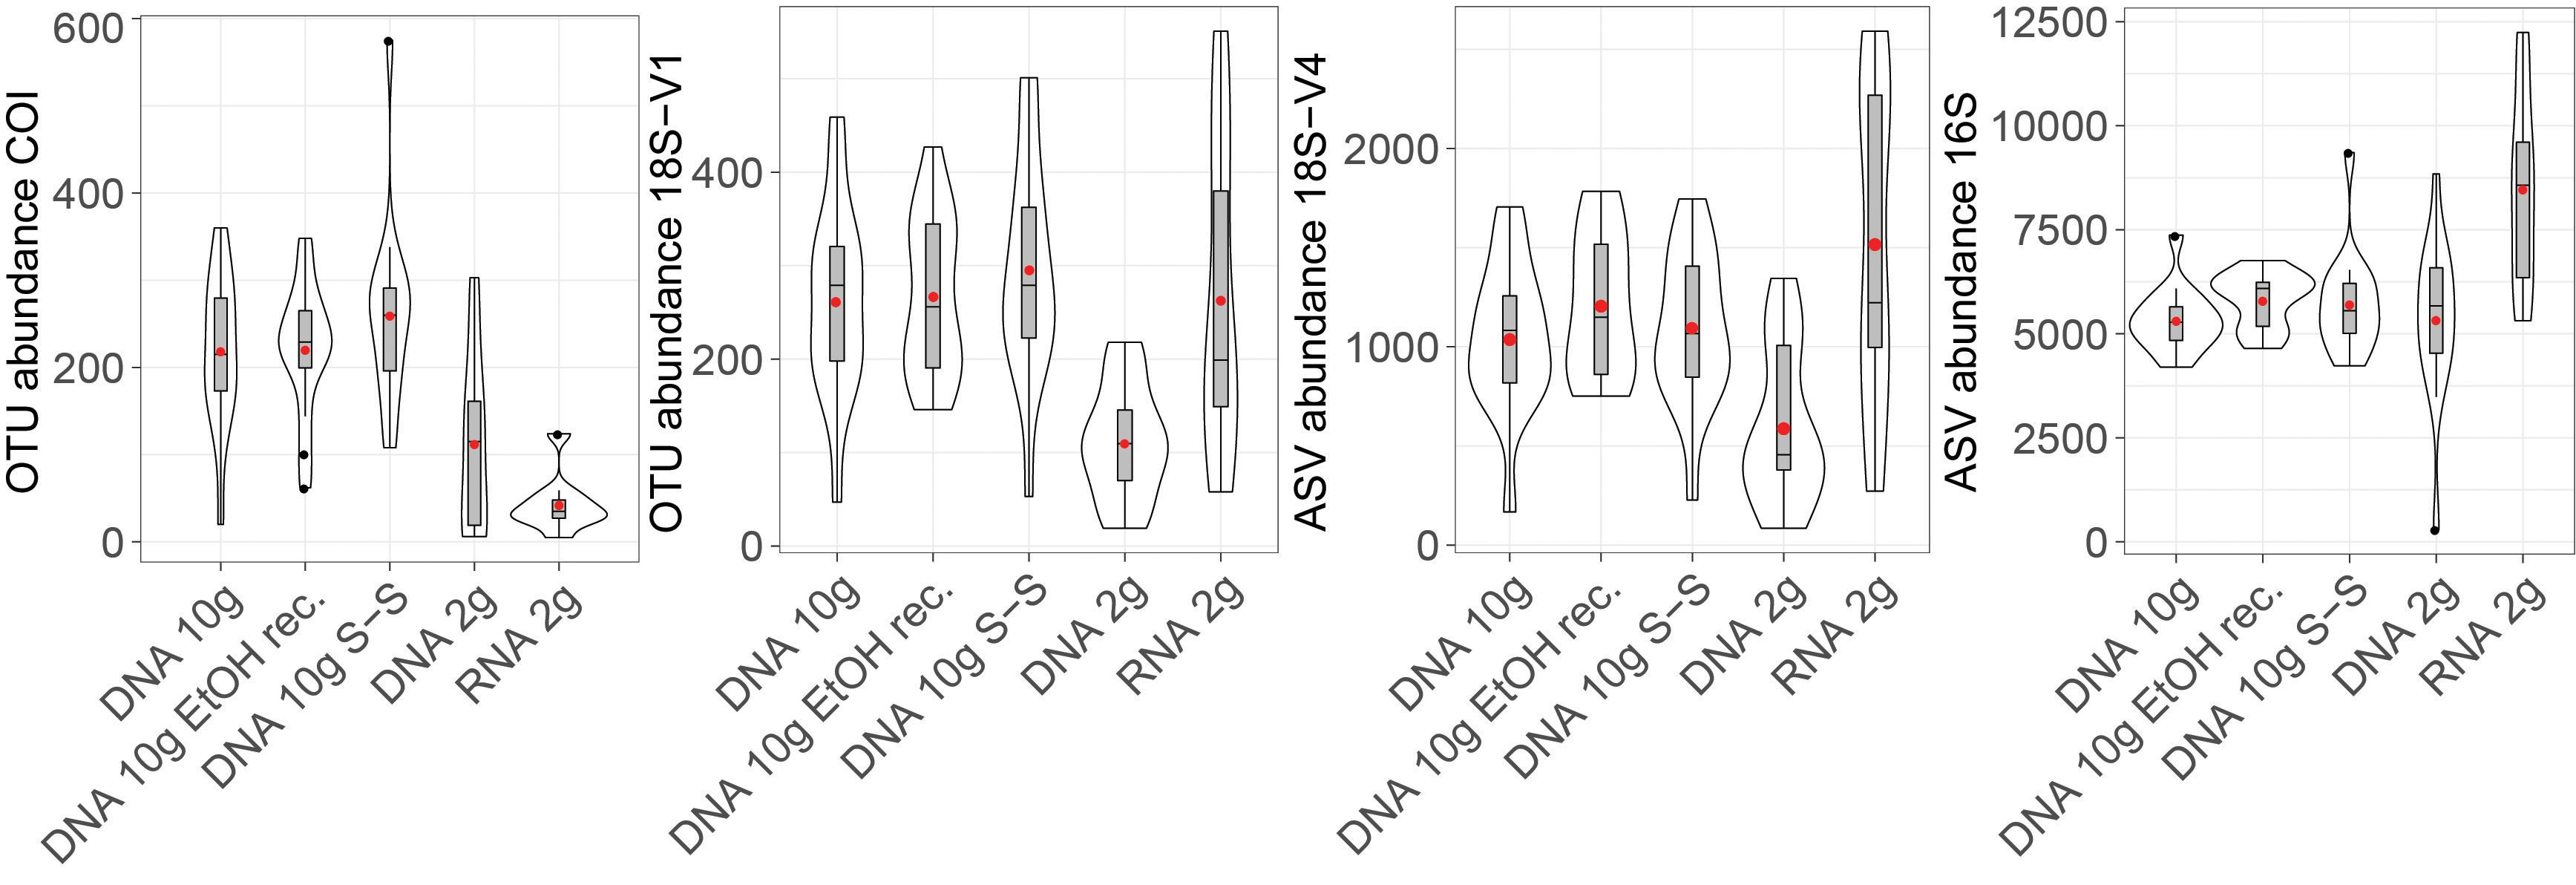
Figure 1. Violin plot showing detected numbers of metazoan operational taxonomic units (OTUs) (COI, 18S-V1), micro-eukaryote (18S-V4) amplicon sequence variants (ASVs), and prokaryote (16S) ASVs recovered by the five molecular processing methods evaluated in this study (DNA 10 g: crude DNA extracts from ∼10 g of sediment with the PowerMax Soil kit; DNA 10 g EtOH rec EtOH reconcentrated 10 g DNA extracts; DNA 10 g S-S: size-selected 10 g DNA extracts; DNA/RNA 2 g: crude DNA/RNA extracts from ∼2 g of sediment with the RNeasy PowerSoil kit). Cluster abundances were calculated on rarefied datasets. Boxplots show medians with interquartile ranges. Red dots indicate mean values.
Extracts based on the 2-g kit resulted in more variability, reflected by greater standard errors in mean recovered cluster numbers (15–26% of the mean for eukaryotes, 7–9% for prokaryotes) than in DNA extracts based on 10 g of sediment (8–11% for eukaryotes, 3–6% for prokaryotes).
DNA extracted using the 2-g kit recovered significantly fewer eukaryotic clusters than extracts based on ∼10 g of sediment (Figure 1 and Table 1), a trend consistent across most taxa (Figure 2). DNA 2-g extracts recovered an average of 110 ± 16 18S-V1 and 113 ± 27 COI metazoan OTUs per sample compared to 264 ± 26 (18S-V1) and 222 ± 23 (COI) in the DNA 10-g extracts. Similarly, DNA 10-g extracts recovered on average 1,117 ± 100 protistan 18S-V4 ASVs per sample compared to 595 ± 109 detected in DNA from the 2-g kit. Contrastingly to eukaryotes, all DNA methods, whether based on ∼2 or ∼10 g of sediment, resulted in comparable prokaryote ASV numbers detected (Figures 1, 2 and Table 1; p > 0.8), ranging from 5,330 ± 199 to 5,810 ± 170 per sample on average.
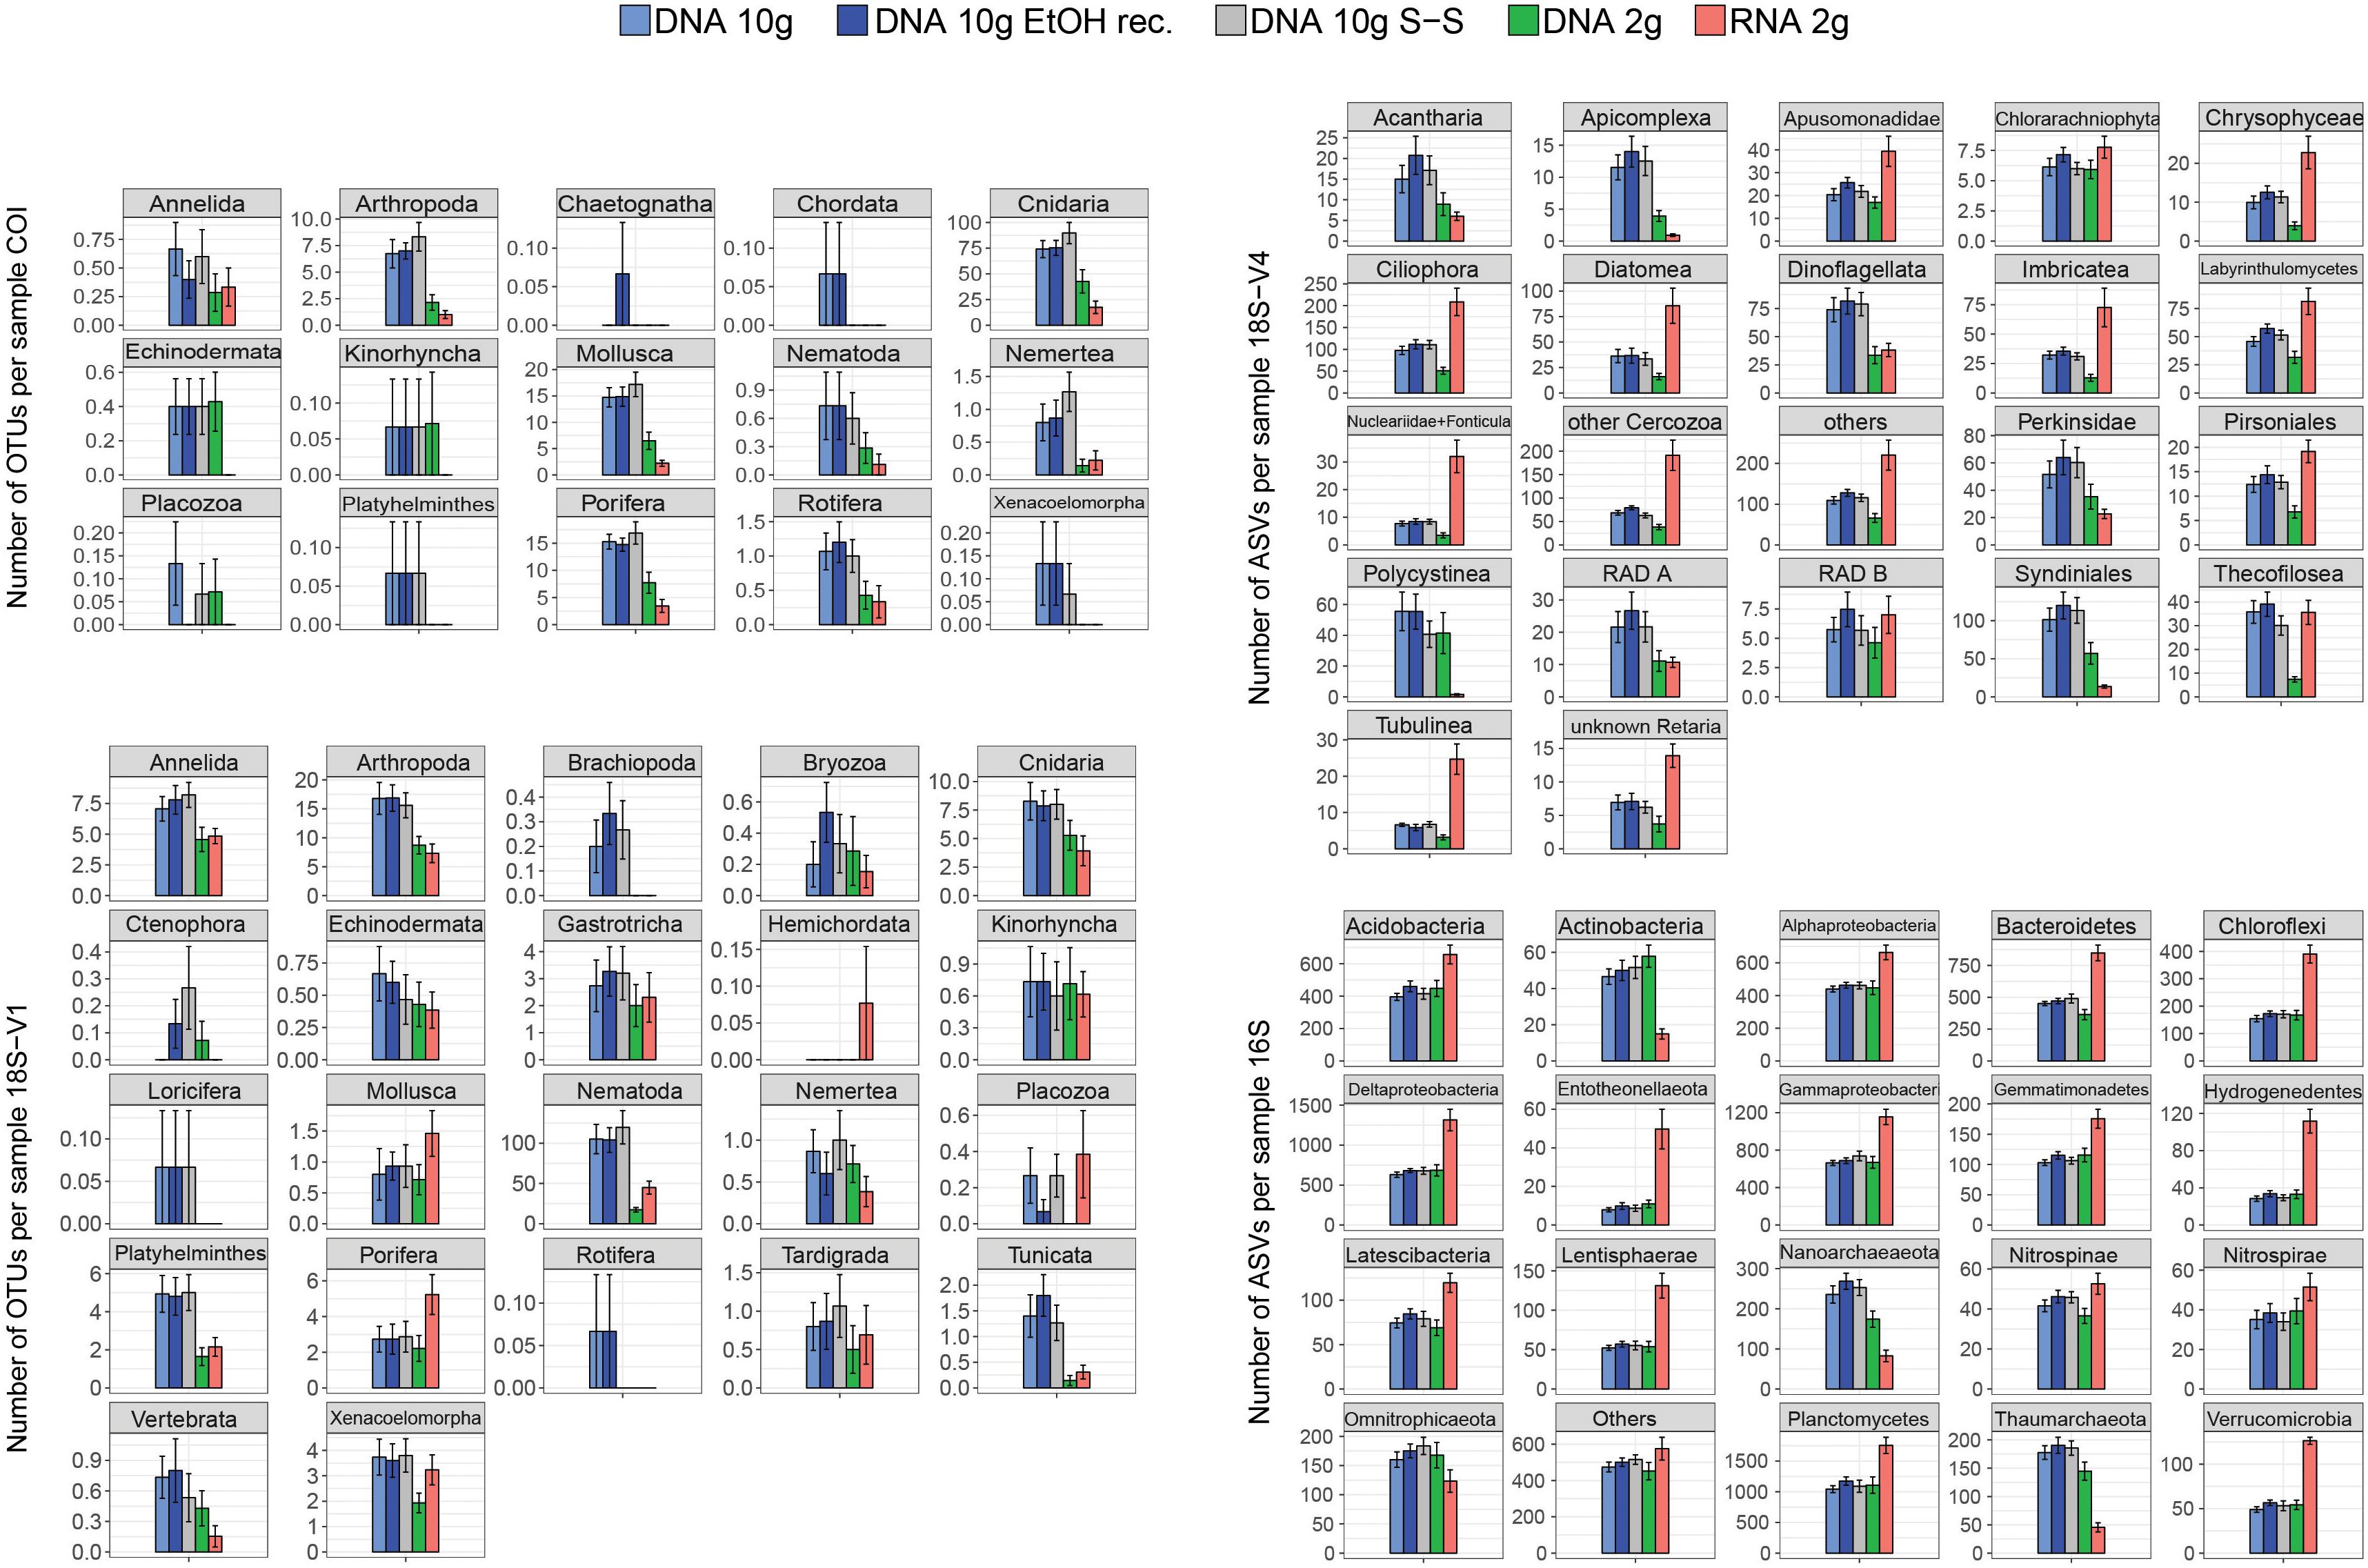
Figure 2. Mean number of metazoan operational taxonomic units (OTUs) (COI, 18S-V1), protist amplicon sequence variants (ASVs) (18S-V4), and prokaryote ASVs (16S) detected per sample for each of the five processing methods (DNA 10 g: crude DNA extracts from ∼10 g of sediment with the PowerMax Soil kit; DNA 10 g EtOH rec. EtOH reconcentrated 10 g DNA extracts; DNA 10 g S-S: size-selected 10 g DNA extracts; DNA/RNA 2 g: crude DNA/RNA extracts from ∼2 g of sediment with the RNeasy PowerSoil kit). Cluster numbers were calculated on rarefied datasets. Error bars represent standard errors.
The joint RNA/DNA extracts shared 15% (COI) to 25% (18S-V1) of metazoan OTUs, 14% of protistan 18S-V4 ASVs, and 25% of prokaryotic 16S ASVs (Supplementary Figure S3). With COI, most unique OTUs were present in DNA extracts (74%) and RNA detected significantly fewer metazoan OTUs than co-extracted DNA (Figure 1, 44 ± 12 versus 113 ± 27 respectively), a trend observed in most detected metazoan phyla (Figure 2). Contrastingly, with ribosomal loci, most clusters were unique to RNA (56% for 18S-V1, 63% for 18S-V4, 45% for 16S; Supplementary Figure S3), which recovered significantly more clusters than co-extracted DNA (Figure 1 and Table 1). For prokaryotes, RNA extracts even detected significantly more ASVs than DNA extracts based on 10 g of sediment (Table 1 and Figure 1), a pattern observed in most prokaryotic clades, except for the Actinobacteria, Nanoarchaeaeota, Omnitrophicaeota, and Thaumarchaeota (Figure 2). For 18S-V4 and 18S-V1, RNA detected a cluster richness comparable to DNA 10-g extracts (Tukey’s HSD multiple comparisons tests, p > 0.16), yet, average cluster numbers per sample were higher in RNA than in DNA 10-g extracts in numerous groups (Figure 2).
Effect of Molecular Processing Methods on Beta-Diversity Patterns
PERMANOVA showed that although site was the main source of variation among samples (accounting for 20–57% of variability), significant differences existed among molecular methods in terms of community structure for all loci investigated over and above any variation due to site (Table 1). Pairwise comparisons indicated no significant effect of small DNA fragment removal on revealed community composition (Table 1), and high and significant correlations in Mantel tests (r: 0.92–1.0, p = 0.001) confirmed the minor effect of size selection and EtOH reconcentration. Based on these results, the size-selected and EtOH-reconcentrated DNA data were removed from further analyses, and community structures of the DNA 10-g extracts were compared with those derived from co-extracted DNA/RNA using the 2-g kit.
Pairwise comparisons showed significant differences in community structures between RNA and DNA for all markers analyzed (Table 1). Ordinations confirmed the predominant effect of site as the first two PCoA axes mostly resolved spatial effects (Supplementary Figure S4) but also revealed that communities detected by RNA differed from those detected by DNA (co-extracted DNA and DNA 10-g), the level of differentiation varying among sites (Figure 3).
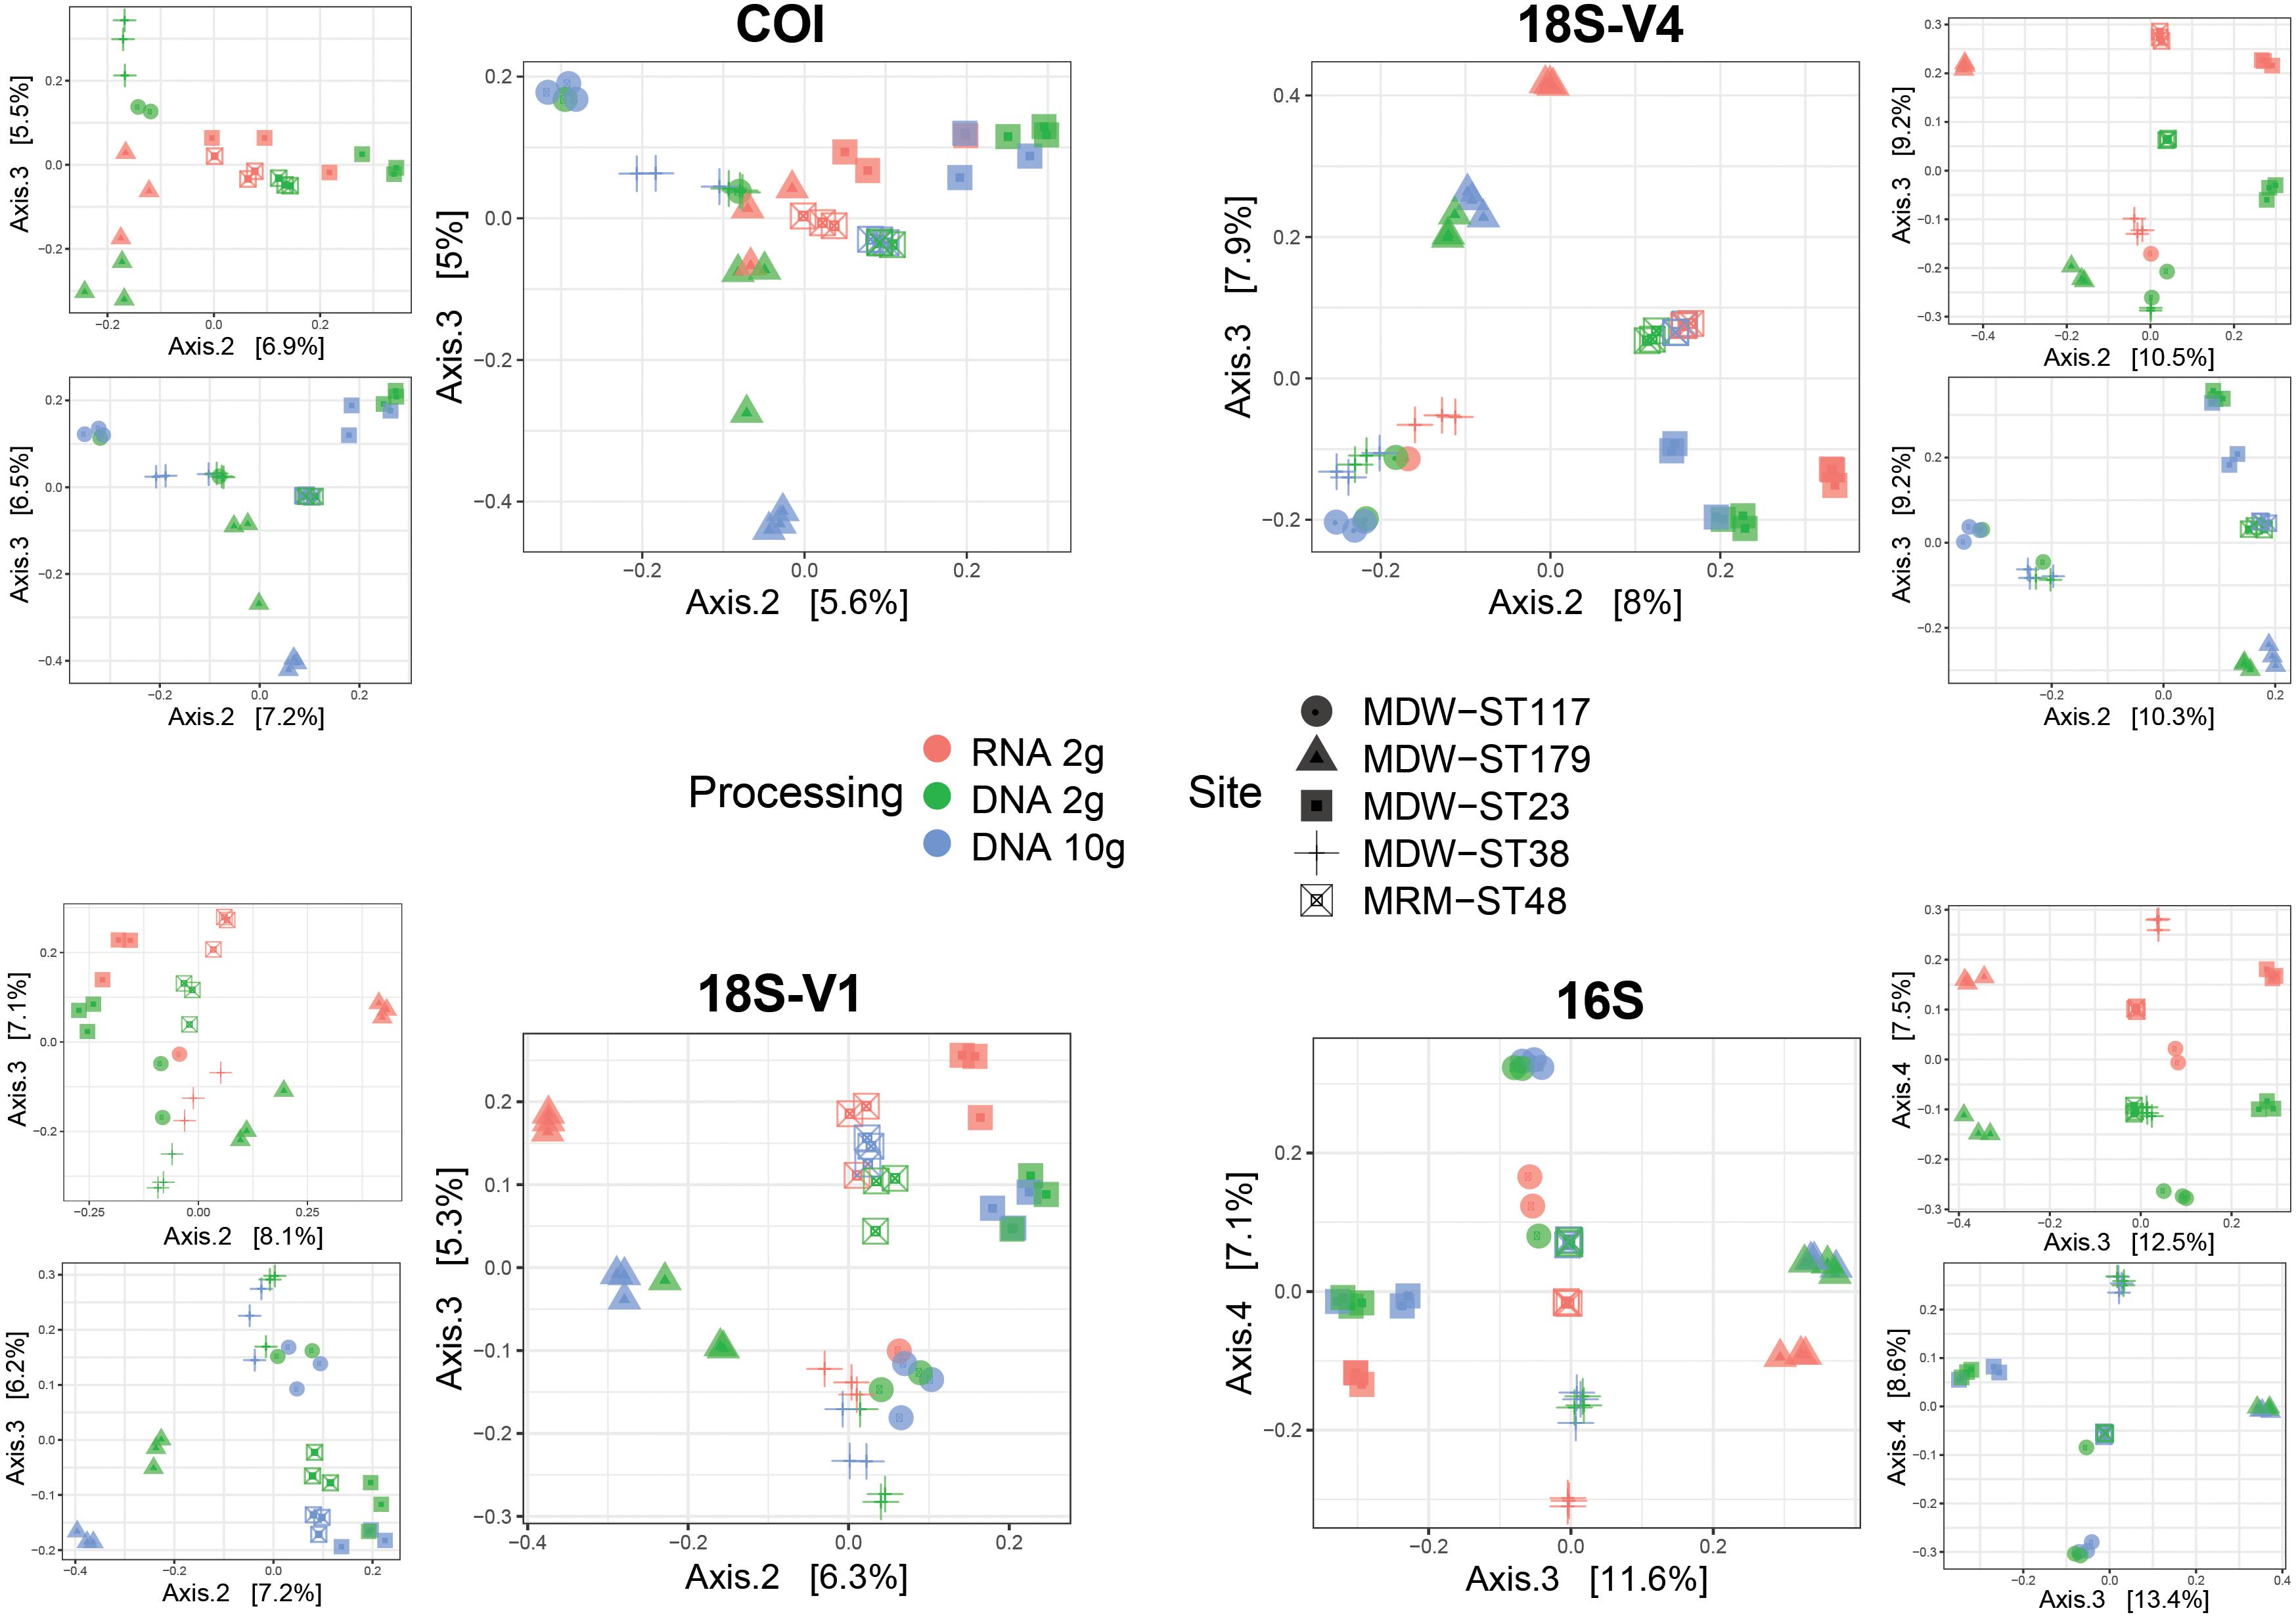
Figure 3. Principal coordinates analysis (PCoA) ordinations showing community differences between RNA and DNA molecular processing methods using either RNA/DNA extracted jointly from ∼2 g of sediment (RNA 2 g/DNA 2 g) or DNA extracted from ∼10 g of sediment (DNA 10 g) in five deep-sea sites using four barcode markers targeting metazoans (COI, 18S-V1), micro-eukaryotes (18S-V4), and prokaryotes (16S). PCoAs were calculated using Jaccard dissimilarities for metazoans and Bray–Curtis dissimilarities for unicellular organisms. Inserts show pairwise PCoAs.
Pairwise comparisons also indicated significant differences in community structure between DNA extracts from the 2-g and 10-g kits (Table 1) possibly due to higher variability among replicate cores in the DNA 2-g method as seen in ordinations (Figure 3).
Extraction Kit Versus Nature of Nucleic Acid
PERMANOVA of the dataset containing DNA 10-g, DNA 2-g, and RNA 2-g extracts confirmed that site was the predominant effect, explaining ∼20% of variation for metazoans, 33% of variation for micro-eukaryotes, and 54% of variation for prokaryotes. The analysis also indicated that the differences observed between processing methods were predominantly due to the type of nucleic acid rather than the kit used for extraction. Nucleic acid nature (DNA versus RNA) led to significant differences among assemblages for all loci, while DNA extraction kit resulted in significant differences only for 18S-V1 and 18S-V4 (Supplementary Table S7).
This supported observations in relative taxonomic compositions, which were more similar between samples based on DNA (Figure 4), a pattern consistent across cores within each site (Supplementary Figure S5). Expectedly, when looking at read numbers, resolved taxonomic structures were also more similar among DNA-based methods (Supplementary Figure S6). Comparing read and cluster abundances revealed that relative taxonomic compositions based on read numbers (Supplementary Figure S6) were comparable to those based on cluster numbers (Figure 4) for micro-eukaryotes and prokaryotes and confirmed that this was not the case for metazoans.
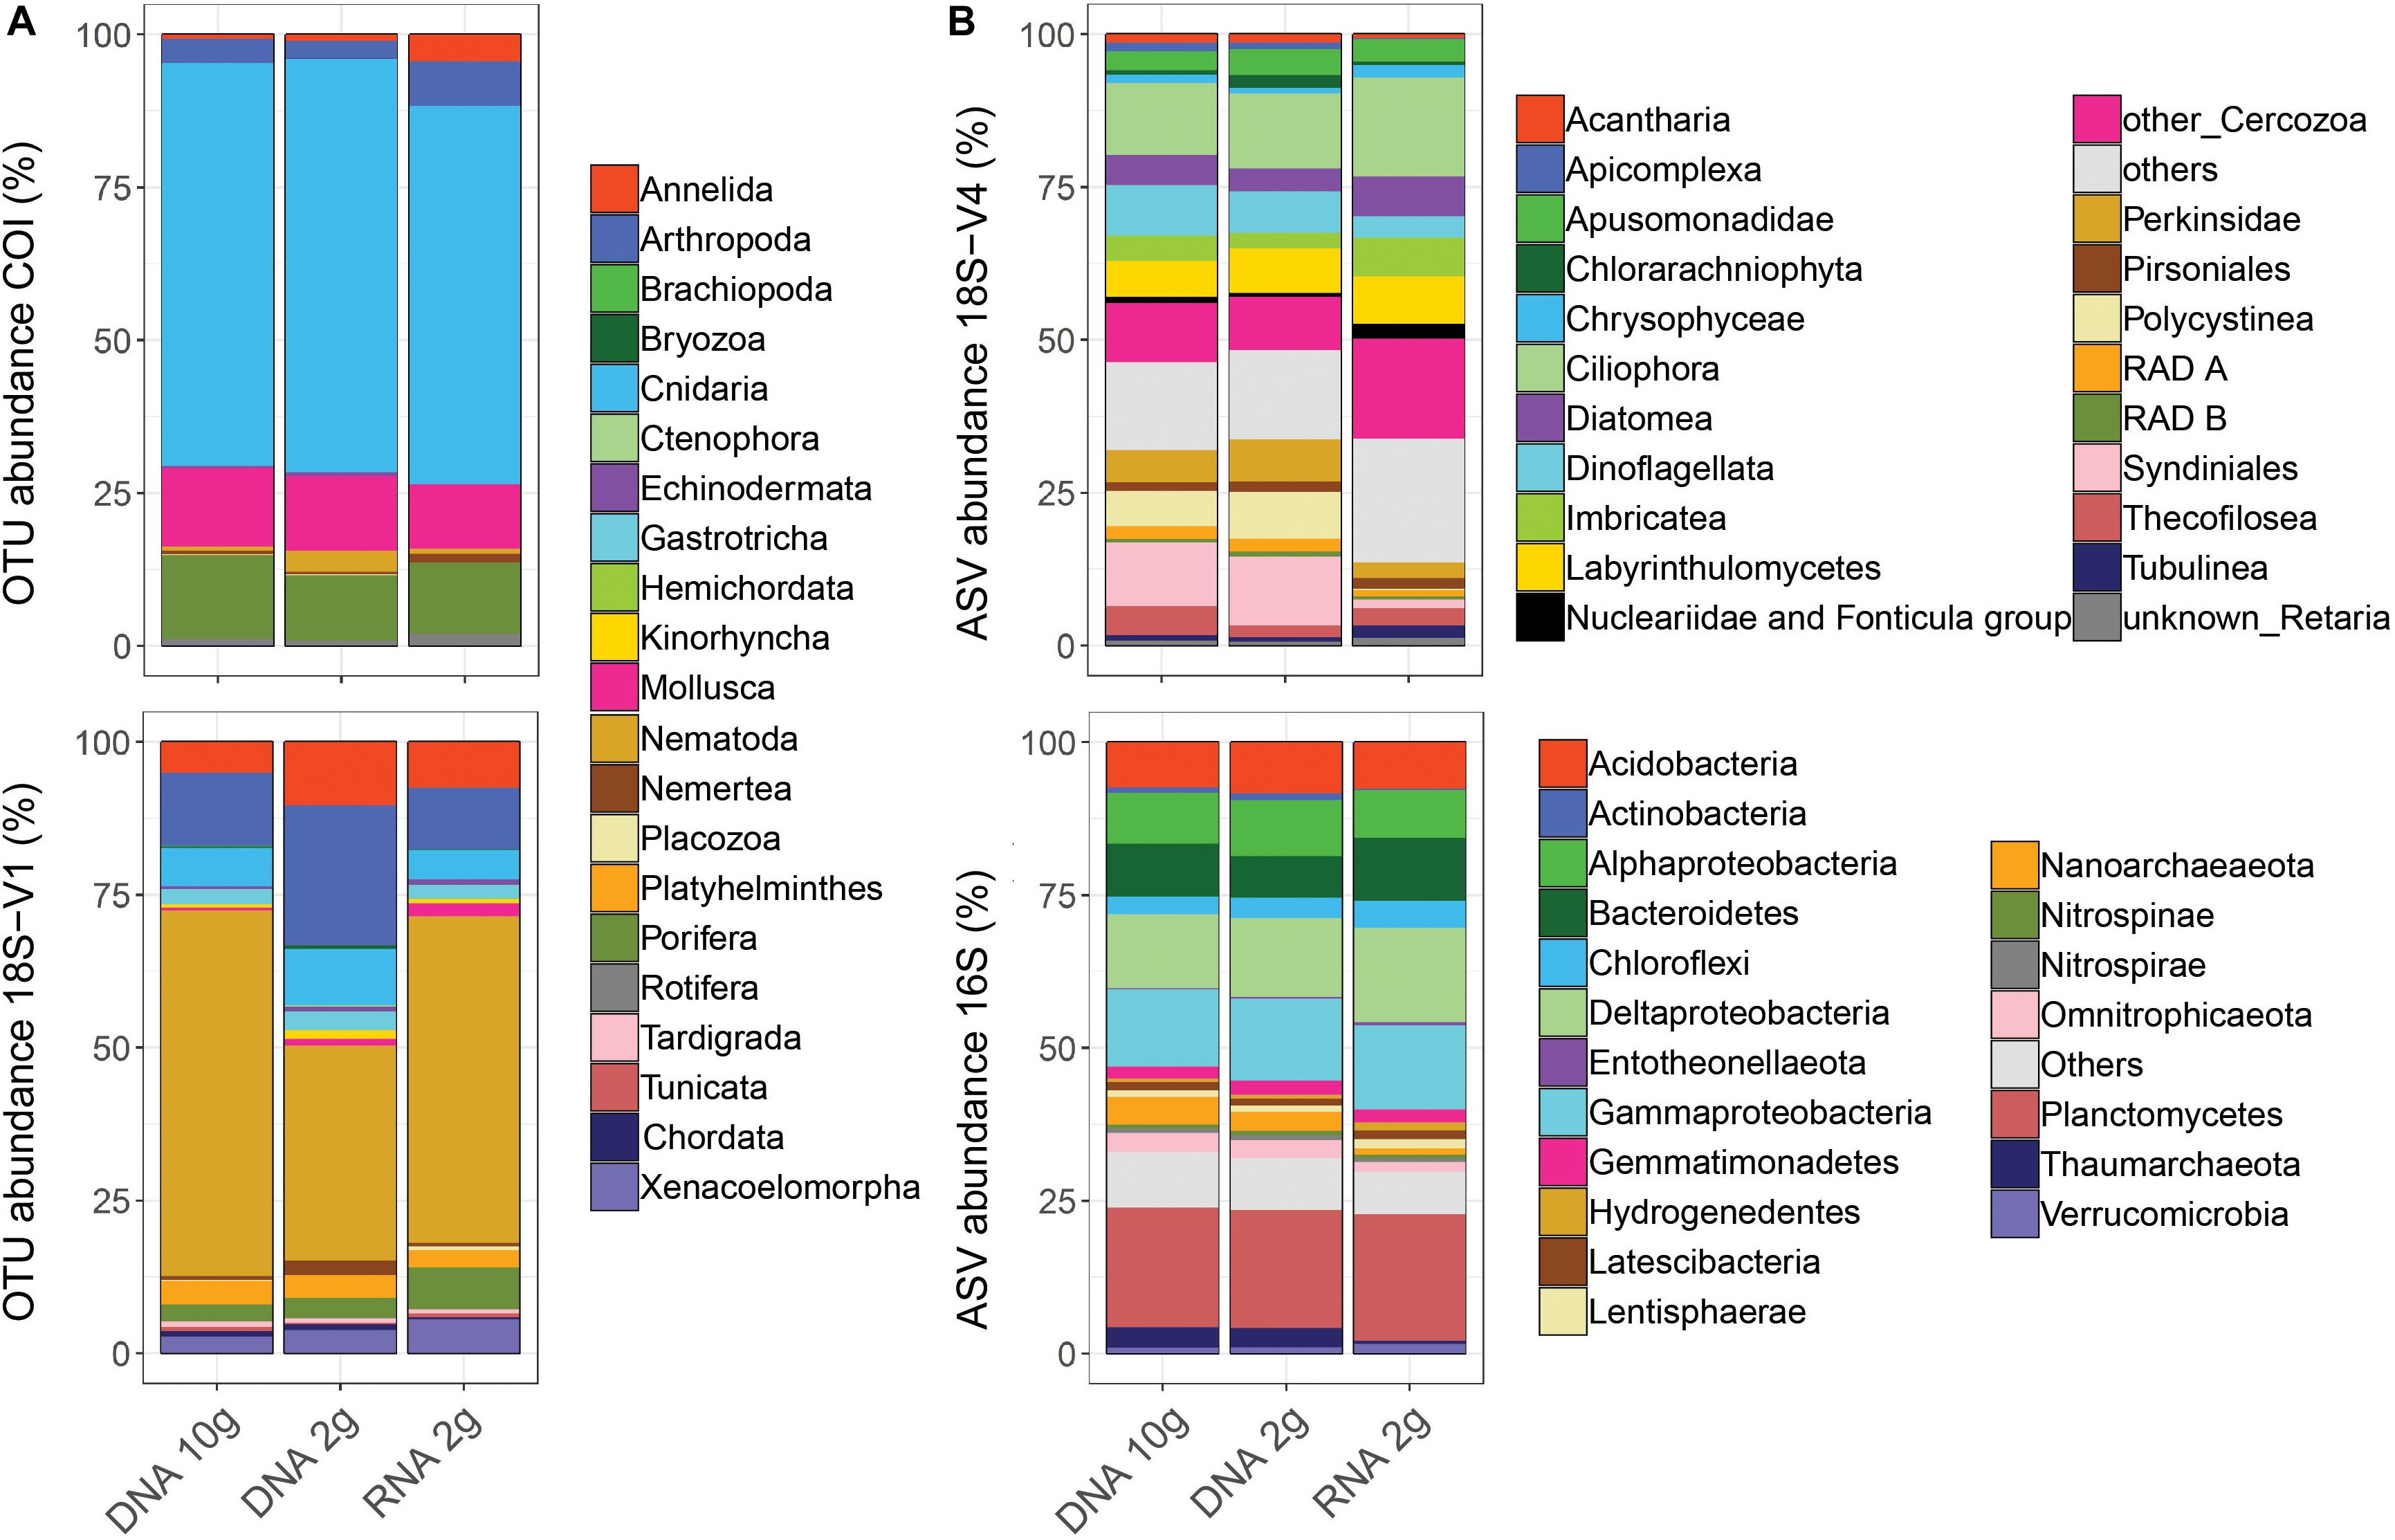
Figure 4. Patterns of relative cluster abundance resolved by metabarcoding of sediment RNA and DNA from five deep-sea sites using either RNA/DNA extracted jointly from ∼2 g of sediment (RNA 2 g/DNA 2 g) or DNA extracted from ∼10 g of sediment (DNA 10 g) and using four barcode markers targeting metazoans (A: COI, 18S-V1), micro-eukaryotes (B: 18S-V4), and prokaryotes (B: 16S). Values were calculated on balanced datasets.
Discussion
The aim of this study was to evaluate different molecular methods in order to select the most appropriate eDNA metabarcoding protocol to inventory contemporary deep-sea communities, with the lowest possible bias due to aDNA.
Using RNA rather than DNA to inventory contemporaneous communities has been suggested as a means of avoiding the bias due to long-term persistence of DNA in marine sediments. Indeed, RNA is only produced by living organisms and is thought to quickly degrade when released in the environment due to spontaneous hydrolysis and the abundance of RNases (Torti et al., 2015). Expectedly, in our COI dataset, RNA resulted in fewer OTUs (Figure 1) and detected fewer phyla (Figure 2) than co-extracted DNA. Contrastingly, for ribosomal loci, RNA detected higher cluster numbers than co-extracted DNA (Figure 1), resulting in more clusters per sample for most of the taxonomic groups detected (Figure 2). In these joint datasets, 45–63% of clusters were unique to RNA (Supplementary Figure S2). These unique clusters were not singleton clusters as only up to 2.2% of them had fewer than three reads, even if 5–28% had fewer than 10 reads (data not shown). Although proportions vary strongly among investigations, other studies using ribosomal loci have also reported increased recovery of OTUs in RNA datasets as well as considerable amounts of unshared OTUs between joint RNA and DNA data (Guardiola et al., 2016; Laroche et al., 2017, and references therein).
This difference observed here between COI and ribosomal loci is likely related to the nature of the targeted RNA molecule. The rapid hydrolysis of RNA mostly applies to random coils (like messenger RNA), while helical conformations (including most types of RNA, such as ribosomal RNA, transfer RNA, viral genomic RNA, or ribozymes) are less prone to hydrolysis by water molecules (Torti et al., 2015). The degradation of rRNA is thus likely to be much slower than that of messenger RNA (mRNA), which, combined with decreased digestion by RNases due to adsorption onto sediment particles (Torti et al., 2015), makes long-term persistence of rRNA possible and observed in sediments and even in fossils (Orsi et al., 2013; Cristescu, 2019). Finally, the great abundance of RNA over DNA in living organisms (e.g., 20.5% versus 3.1% in Escherichia coli) may also favor its persistence in the environment. This is especially true for rRNA, which is represented in a cell’s RNA pool as many times as there are ribosomes, while only being present in a few copies (10–150) in the genome (Torti et al., 2015).
While RNA has been reported as an effective way to depict the active community compartment (Baldrian et al., 2012; Lejzerowicz et al., 2013b; Pawlowski et al., 2014), variation in activity levels between taxonomic groups as well as differences in life histories, life strategies, and non-growth activities may confound this interpretation and generate taxonomic bias (Blazewicz et al., 2013). Instead, DNA/RNA ratios might reflect different genomic architectures (variation in rDNA copy number) among taxonomic groups rather than different relative activities (Massana et al., 2015). Thus, eRNA data need to be interpreted with caution, as some molecular clusters could be overrepresented due to increased cellular activities (Pochon et al., 2017). This could explain the higher cluster numbers detected here for ribosomal loci with eRNA compared to eDNA for several taxa (Figure 2).
Moreover, many of the unique RNA ASVs/OTUs may be artifacts from the reverse transcription of RNA to cDNA, a process known to generate errors that are difficult to measure and detect in bioinformatic analyses (Laroche et al., 2017) but highlighted by the greater amounts of chimeras detected in RNA extracts with ribosomal loci (Supplementary Table S6). This overestimation of RNA-based data will affect non-clustered data more than clustered datasets, in line with the results observed here for microbial ASVs and metazoan OTUs.
In terms of beta diversity patterns, although RNA and DNA detected significantly different communities (Table 1), DNA and RNA samples resolved similar spatial configurations, with samples clustering by site (Figure 3). This is consistent with Guardiola et al. (2016), who also reported similar patterns of ecological differentiation between DNA and RNA in deep-sea sites, although both datasets resolved different communities. Although the comparative study performed here targeted only the first 1 cm layer of sediment, the comparable results obtained by Guardiola et al. (2016) on 5 cm suggest that these findings may be expanded to deeper layers of sediments. However, spatial variation was more pronounced with DNA samples for eukaryotes, which is congruent with Laroche et al. (2017), who suggested that eDNA may be more reliable for assessing differences in community composition.
Thus, due to its suspected persistence in the environment and the unknown but potentially additional sources of bias suspected here, using eRNA for metabarcoding of deep-sea sediments does not seem to effectively address the problem of aDNA, and even less so for ribosomal loci. Other studies suggested that a more efficient way to deal with aDNA may be to use joint RNA and DNA datasets and trim for shared OTUs (Laroche et al., 2017; Pochon et al., 2017). This is however particularly stringent (given the low shared OTU proportions observed in this and other studies) and may result in a substantial number of false negatives. With COI, while mRNA may be more effectively targeting living organisms, the approach remains confronted with the taxonomic bias mentioned above, combined with higher in vitro lability of mRNA, making it more challenging to work with (highlighted by the increased failure of RNA extracts in this study; Supplementary Table S6).
Removing small DNA fragments via size selection (removing fragments < 1,000 bp) or EtOH reconcentration did not affect recovered cluster numbers in any of the biological compartments investigated (Figure 1). The methods also did not result in any significant difference in community structures (Table 1), suggesting that small, likely ancient, DNA fragments have a negligible impact on biodiversity inventories produced through eDNA metabarcoding. This finding is in line with results from the deep-sea (Guardiola et al., 2016; Ramírez et al., 2018) and various other habitats (Lennon et al., 2018), which showed no evidence that spatial patterns were blurred by “dead” DNA persistence, and suggested a minimal effect of extracellular DNA on estimates of taxonomic and phylogenetic diversity.
None of the methods evaluated in the present study removes DNA not enclosed in living cells (e.g., DNA in organelles, DNA from dead cells…). It is still unclear how long DNA can remain intracellular after cell death or within organelles. Future research quantifying the rate at which “dead” intracellular DNA becomes extracellular and degraded, and investigation of deeper layers of sediment, will be valuable to estimate the potential bias of archived intracellular DNA in eDNA metabarcoding inventories of extant communities. However, there is increasing evidence that DNA from non-living cells is mostly contemporary (Lennon et al., 2018). This ability to detect extant taxa that were not present in the sample at the time of collection highlights the capacity of eDNA metabarcoding to detect local presence of organisms even from their remains or excretions, and even with a small amount of environmental material.
It remains to be elucidated whether more cost- and time-effective extraction protocols specifically targeting extracellular DNA offer similar ecological resolution as total DNA kits. This is suggested to be the case for terrestrials soils (Taberlet et al., 2012b; Zinger et al., 2016), although authors have highlighted that conclusions from these studies should be interpreted with caution as results might be influenced by actively released and ancient DNA (Nagler et al., 2018). The only available study testing this in the deep-sea showed that richness patterns were strikingly different in several metazoan phyla between extracellular DNA and total DNA. The authors suggested this to be the result of activity bias: sponges and cnidarians were overrepresented in the extracellular DNA pool because they continuously expel DNA, while nematodes were underrepresented as their cuticles shield DNA (Guardiola et al., 2016). As this comparison was performed on samples collected in two consecutive years, differences observed may partly result from temporal variation. However, another study of shallow and mesobenthic macroinvertebrates showed that targeting solely the extracellular eDNA compartment of marine sediments led to the detection of more than 100 taxa fewer than bulk metabarcoding or morphology, suggesting that extracellular DNA may not be adequate for marine sediments (Aylagas et al., 2016).
Larger amounts of sediment (≥10 g) allowed detecting significantly more eukaryotic clusters. This was not true for prokaryotes, for which both ∼2 and ∼10 g of sediment detected similar numbers of ASVs (Table 1 and Figure 1). It may be suggested that in the joint RNA/DNA kit, DNA elution occurring after RNA elution induces partial DNA loss. However, such effect would be expected to equally affect eu- and prokaryotes, which was not the case here, supporting the fact that the quantity of the starting material significantly affects results for eukaryotes. The importance of adjusting the amount of starting material to the biological compartment investigated has already been documented (Creer et al., 2016; Dopheide et al., 2019), and this study confirms that while 2–5 g of deep-sea sediment may be enough to capture prokaryote diversity, microbial eukaryotes and metazoans are more effectively surveyed with larger sediment volumes.
Finally, the ∼2-g protocols were generally associated with higher variability among replicate cores for all loci investigated (Figures 1, 3). This variability increases confidence intervals, reduces statistical power, and increases the risk of not identifying differences among communities, and thus impacts in EIA studies (Type II errors). Small-scale (centimeters to meters) patchiness has often been reported in the deep-sea (Grassle and Maciolek, 1992; Smith and Snelgrove, 2002; Lejzerowicz et al., 2014). While technical (PCR) replicates allow increasing taxon detection probability (decrease false positives), this within-site variability can only be mitigated by collecting more biological replicates per sampling station and using a sufficiently high amount of starting material to extract nucleic acids.
Data Availability Statement
The data for this work has been submitted to the European Nucleotide Archive (ENA) under the following project: PRJEB33873. Please refer to the sample metadata in Supplementary Material to download samples from ENA. Additionally, the full dataset, including raw sequences, databases, ASV/OTU tables, and scripts (Gitlab link) are available through https://doi.org/10.12770/cf00aa7b-67e7-49c4-8939-038c4a9d887f.
Author Contributions
MB, CL-H, and SA-H designed the study. MB, JP, and CL-H carried out the laboratory work. MB and BT performed the bioinformatic analyses. MB, BT, and NH performed the statistical analyses. MB and SA-H wrote the manuscript. All authors contributed to the final manuscript.
Conflict of Interest
The authors declare that the research was conducted in the absence of any commercial or financial relationships that could be construed as a potential conflict of interest.
Funding
This work was part of the “Pourquoi Pas les Abysses?” project funded by Ifremer and the project eDNAbyss (AP2016-228) funded by France Génomique (ANR-10-INBS-09) and Genoscope-CEA. This work also received funding from the European Union’s Horizon 2020 Research and Innovation Program under grant agreement no. 678760 (ATLAS), and the ‘Investissements d’Avenir’ program OCEANOMICS (ANR-11-BTBR-0008; NH and CV). This output reflects only the authors’ view, and the European Union cannot be held responsible for any use that may be made of the information contained therein.
Acknowledgments
We wish to thank Laure Quintric, Patrick Durand, Caroline Belser, and Stéphane Pesant for bioinformatic and archiving support, as well as Jan Pawlowski and Eva Ramirez Llodra for useful advice on this work. We also wish to express our gratitude to the crew, participants, and mission chiefs of the MarMine cruise (Eva Ramirez Llodra, project 247626/O30, funded by the Research Council of Norway and associated industrial partners) and the MEDWAVES cruise supported by the ATLAS project and the Spanish Ministry of Economy, Industry, and Competitivity (Covadonga Orejas and all the crew from the Sarmiento de Gamboa), as well as to all the people who helped collecting samples (Perregrino Cambeiro, Juancho Movilla, Maria Rakka, Joana Boavida, Anna Addamo). This manuscript has been released as a Pre-Print at https://doi.org/10.1101/836080.
Supplementary Material
The Supplementary Material for this article can be found online at: https://www.frontiersin.org/articles/10.3389/fmars.2020.00234/full#supplementary-material
DATA SHEET S1 | Supplementary material tables (S1 to S7) and figures (S1 to S6).
DATA SHEET S2 | Sample metadata.
Footnotes
- ^ https://gitlab.ifremer.fr/abyss-project/
- ^ https://benjjneb.github.io/dada2/tutorial.html
- ^ http://joey711.github.io/phyloseq/tutorials-index.html
References
Aylagas, E., Borja, A., Irigoien, X., and Rodríguez-Ezpeleta, N. (2016). Benchmarking DNA metabarcoding for biodiversity-based monitoring and assessment. Front. Mar. Sci. 3:96. doi: 10.3389/fmars.2016.00096
Baldrian, P., Kolaiřýk, M., Štursová, M., Kopecký, J., Valášková, V., Větrovský, T., et al. (2012). Active and total microbial communities in forest soil are largely different and highly stratified during decomposition. ISME J. 6, 248–258. doi: 10.1038/ismej.2011.95
Baselga, A., and Orme, C. D. L. (2012). Betapart: an R package for the study of beta diversity. Methods Ecol. Evol. 3, 808–812. doi: 10.1111/j.2041-210X.2012.00224.x
Blazewicz, S. J., Barnard, R. L., Daly, R. A., and Firestone, M. K. (2013). Evaluating RRNA as an indicator of microbial activity in environmental communities: limitations and uses. ISME J. 7, 2061–2068. doi: 10.1038/ismej.2013.102
Boere, A. C., Rijpstra, W. I. C., De Lange, G. J., Sinninghe Damsté, J. S., and Coolen, M. J. L. (2011). Preservation potential of ancient plankton DNA in pleistocene marine sediments. Geobiology 9, 377–393. doi: 10.1111/j.1472-4669.2011.00290.x
Brandt, M. I., Trouche, B., Quintric, L., Wincker, P., Poulain, J., and Arnaud-Haond, S. (2020). A flexible pipeline combining clustering and correction tools for prokaryotic and eukaryotic metabarcoding. bioRxiv. [Preprint]. doi: 10.1101/717355
Callahan, B. J., McMurdie, P. J., and Holmes, S. P. (2017). Exact sequence variants should replace operational taxonomic units in marker-gene data analysis. ISME J. 11, 2639–2643. doi: 10.1038/ismej.2017.119
Callahan, B. J., McMurdie, P. J., Rosen, M. J., Han, A. W., Johnson, A. J. A., and Holmes, S. P. (2016). DADA2: high-resolution sample inference from illumina amplicon data. Nat. Methods 13, 581–583. doi: 10.1038/nmeth.3869
Carugati, L., Corinaldesi, C., Dell’Anno, A., and Danovaro, R. (2015). Metagenetic tools for the census of marine meiofaunal biodiversity: an overview. Mar. Genom. 24, 11–20. doi: 10.1016/j.margen.2015.04.010
Coolen, M. J. L., Orsi, W. D., Balkema, C., Quince, C., Harris, K., Sylva, S. P., et al. (2013). Evolution of the plankton paleome in the Black sea from the deglacial to Anthropocene. Proc. Natl. Acad. Sci. U.S.A 110, 8609–8614. doi: 10.1073/pnas.1219283110
Corinaldesi, C., Beolchini, F., and Dell’Anno, A. (2008). Damage and degradation rates of extracellular DNA in marine sediments: implications for the preservation of gene sequences. Mol. Ecol. 17, 3939–3951. doi: 10.1111/j.1365-294X.2008.03880.x
Corinaldesi, C., Tangherlini, M., Manea, E., and Dell’Anno, A. (2018). Extracellular DNA as a genetic recorder of microbial diversity in benthic deep-sea ecosystems. Sci. Rep. 8:1839. doi: 10.1038/s41598-018-20302-7
Creer, S., Deiner, K., Frey, S., Porazinska, D., Taberlet, P., Thomas, W. K., et al. (2016). The Ecologist’s field guide to sequence-based identification of biodiversity.” Edited by Freckleton, R. Methods Ecol. Evol. 7, 1008–1018. doi: 10.1111/2041-210X.12574
Cristescu, M. E. (2019). Can environmental RNA revolutionize biodiversity science? Trends Ecol. Evol. 34, 694–697. doi: 10.1016/j.tree.2019.05.003
Davis, N. M., Proctor, D. M., Holmes, S. P., Relman, D. A., and Callahan, B. J. (2018). Simple statistical identification and removal of contaminant sequences in marker-gene and metagenomics data. Microbiome 6:226. doi: 10.1186/s40168-018-0605-2
Dell’Anno, A., and Danovaro, R. (2005). Ecology: extracellular DNA plays a key role in deep-sea ecosystem functioning. Science 309:2179. doi: 10.1126/science.1117475
Dopheide, A., Xie, D., Buckley, T. R., Drummond, A. J., and Newcomb, R. D. (2019). Impacts of DNA extraction and PCR on DNA metabarcoding estimates of soil biodiversity.” Edited by Bunce, M. Methods Ecol. Evol. 10, 120–133. doi: 10.1111/2041-210X.13086
Escudié, F., Auer, L., Bernard, M., Mariadassou, M., Cauquil, L., Vidal, K., et al. (2018). FROGS: find, rapidly, OTUs with galaxy solution. Edited by Berger, B. Bioinformatics 34, 1287–1294. doi: 10.1093/bioinformatics/btx791
Frøslev, T. G., Kjøller, R., Bruun, H. H., Ejrnaes, R., Brunbjerg, A. K., Pietroni, C., et al. (2017). Algorithm for post-clustering curation of DNA Amplicon data yields reliable biodiversity estimates. Nat. Commun. 8:1188. doi: 10.1038/s41467-017-01312-x
Grassle, J. F., and Maciolek, N. J. (1992). Deep-sea species richness: regional and local diversity estimates from quantitative bottom samples. Am. Nat. 139, 313–341. doi: 10.1086/285329
Guardiola, M., Wangensteen, O. S., Taberlet, P., Coissac, E., Uriz, M. J., and Turon, X. (2016). Spatio-temporal monitoring of deep-sea communities using metabarcoding of Sediment DNA and RNA. PeerJ 4:e2807. doi: 10.7717/peerj.2807
Herrera, S., Watanabe, H., and Shank, T. M. (2015). Evolutionary and biogeographical patterns of barnacles from deep-sea hydrothermal vents. Mol. Ecol. 24, 673–689. doi: 10.1111/mec.13054
Laroche, O., Wood, S. A., Tremblay, L. A., Ellis, J. I., Lear, G., and Pochon, X. (2018). A cross-taxa study using environmental DNA/RNA metabarcoding to measure biological impacts of offshore oil and gas drilling and production operations. Mar. Pollut. Bull. 127, 97–107. doi: 10.1016/j.marpolbul.2017.11.042
Laroche, O., Wood, S. A., Tremblay, L. A., Lear, G., Ellis, J. I., and Pochon, X. (2017). Metabarcoding monitoring analysis: the pros and cons of using co-extracted environmental DNA and RNA data to assess Offshore oil production impacts on benthic communities. PeerJ 2017:e3347. doi: 10.7717/peerj.3347
Lejzerowicz, F., Esling, P., Majewski, W., Szczuciński, W., Decelle, J., Obadia, C., et al. (2013a). Ancient DNA complements microfossil record in deep-sea subsurface sediments. Biol. Lett. 9:20130283. doi: 10.1098/rsbl.2013.0283
Lejzerowicz, F., Voltsky, I., and Pawlowski, J. W. (2013b). Identifying active Foraminifera in the Sea of Japan using metatranscriptomic approach. Deep Sea Res. Part II Top. Stud. Oceanogr. 86–87, 214–220. doi: 10.1016/j.dsr2.2012.08.008
Lejzerowicz, F., Esling, P., and Pawlowski, J. W. (2014). Patchiness of deep-sea benthic foraminifera across the Southern Ocean: insights from high-throughput DNA sequencing. Deep Sea Res. Part II Top. Stud. Oceanogr. 108, 17–26. doi: 10.1016/j.dsr2.2014.07.018
Lennon, J. T., Muscarella, M. E., Placella, S. A., and Lehmkuhl, B. K. (2018). How, when, and where relic DNA affects microbial diversity. mBio 9:e00637-18. doi: 10.1128/mBio.00637-18
Leray, M., Yang, J. Y., Meyer, C. P., Mills, S. C., Agudelo, N., Ranwez, V., et al. (2013). A new versatile primer set targeting a short fragment of the mitochondrial COI region for metabarcoding metazoan diversity: application for characterizing coral reef fish gut contents. Front. Zool. 10:34. doi: 10.1186/1742-9994-10-34
Machida, R. J., Leray, M., Ho, S. L., and Knowlton, N. (2017). Data descriptor: metazoan mitochondrial gene sequence reference datasets for taxonomic assignment of environmental samples. Sci. Data 4:170027. doi: 10.1038/sdata.2017.27
Mahé, F., Rognes, T., Quince, C., de Vargas, C., and Dunthorn, M. (2015). Swarm v2: highly-scalable and high-resolution Amplicon clustering. PeerJ 3:e1420. doi: 10.7717/peerj.1420
Massana, R. R., Gobet, A., Audic, S., Bass, D., Bittner, L., Boutte, C., et al. (2015). Marine protist diversity in European Coastal waters and sediments as revealed by high-throughput sequencing. Environ. Microbiol. 17, 4035–4049. doi: 10.1111/1462-2920.12955
McMurdie, P. J., and Holmes, S. (2013). Phyloseq: an R package for reproducible interactive analysis and graphics of microbiome census data. Edited by Watson, M. PLoS One 8:e61217. doi: 10.1371/journal.pone.0061217
Nagler, M., Insam, H., Pietramellara, G., and Ascher-Jenull, J. (2018). Extracellular DNA in natural environments: features, relevance and applications. Appl. Microbiol. Biotechnol. 102, 6343–6356. doi: 10.1007/s00253-018-9120-4
Oksanen, J., Blanchet, M., Friendly, G. F., Kindt, R., Legendre, P., McGlinn, D., et al. (2018). Vegan: Community Ecology Package.” https://cran.r-project.org/package=vegan.
Orsi, W., Biddle, J. F., and Edgcomb, V. (2013). Deep sequencing of subseafloor eukaryotic RRNA reveals active fungi across marine subsurface provinces. Edited by López-García, P. PLoS One 8:e56335. doi: 10.1371/journal.pone.0056335
Parada, A. E., Needham, D. M., and Fuhrman, J. A. (2016). Every base matters: assessing small subunit RRNA primers for marine microbiomes with Mock communities, time series and global field samples. Environ Microbiol 18, 1403–1414. doi: 10.1111/1462-2920.13023
Pawlowski, J. W., Esling, P., Lejzerowicz, F., Cedhagen, T., and Wilding, T. A. (2014). Environmental monitoring through protist next-generation sequencing metabarcoding: assessing the impact of fish farming on benthic foraminifera communities. Mol. Ecol. Resour. 14, 1129–1140. doi: 10.1111/1755-0998.12261
Pochon, X., Zaiko, A., Fletcher, L. M., Laroche, O., and Wood, S. A. (2017). Wanted dead or alive? Using metabarcoding of environmental DNA and RNA to distinguish living assemblages for biosecurity applications. Edited by Doi, H. PLoS One 12:e0187636. doi: 10.1371/journal.pone.0187636
Quast, C., Pruesse, E., Yilmaz, P., Gerken, J., Schweer, T., Yarza, P., et al. (2012). The SILVA ribosomal RNA gene database project: improved data processing and web-based tools. Nucleic Acids Res. 41, D590–D596. doi: 10.1093/nar/gks1219
R Core Team (2018). R: A Language and Environment for Statistical Computing. Vienna: R Foundation for Statistical Computing.
Ramírez, G. A., Jørgensen, S. L., Zhao, R., and D’Hondt, S. (2018). Minimal influence of extracellular DNA on molecular surveys of marine sedimentary communities. Front. Microbiol. 9:2969. doi: 10.3389/fmicb.2018.02969
Ramirez-Llodra, E., Tyler, P. A., Baker, M. C., Bergstad, O. A., Clark, M. R., Escobar, E., et al. (2011). Man and the last great wilderness: human impact on the Deep sea.” Edited by Roopnarine, P. PLoS One 6:e22588. doi: 10.1371/journal.pone.0022588
Shank, T. M., Black, M. B., Halanych, K. M., Lutz, R. A., and Vrijenhoek, R. C. (1999). Miocene radiation of Deep-Sea hydrothermal vent shrimp (Caridea: Bresiliidae): evidence from Mitochondrial Cytochrome Oxidase Subunit I. Mol. Phylogenet. Evol. 13, 244–254. doi: 10.1006/mpev.1999.0642
Sinniger, F., Pawlowski, J. W., Harii, S., Gooday, A. J., Yamamoto, H., Chevaldonné, P., et al. (2016). Worldwide analysis of sedimentary DNA reveals major gaps in taxonomic knowledge of deep-sea benthos. Front. Mar. Sci. 3:92. doi: 10.3389/FMARS.2016.00092
Smith, C. R., and Snelgrove, P. (2002). A Riot of Species in an Environmental Calm. Boca Raton, FL: CRC Press, 311–342. doi: 10.1201/9780203180594.ch6
Stefanni, S., Stanković, D., Borme, D., de Olazabal, A., Juretić, T., Pallavicini, A., et al. (2018). Multi-Marker Metabarcoding approach to study Mesozooplankton at basin scale. Sci. Rep. 8:12085. doi: 10.1038/s41598-018-30157-7
Stoeck, T., Bass, D., Nebel, M., Christen, R., Jones, M. D. M., Breiner, H. W., et al. (2010). Multiple Marker Parallel tag environmental DNA sequencing reveals a highly complex Eukaryotic community in marine anoxic water. Mol. Ecol. 19(Suppl. 1), 21–31. doi: 10.1111/j.1365-294X.2009.04480.x
Taberlet, P., Coissac, E., Hajibabaei, M., and Rieseberg, L. H. (2012a). Environmental DNA. Mol. Ecol. 21, 1789–1793. doi: 10.1111/j.1365-294X.2012.05542.x
Taberlet, P., Prud’Homme, S. M., Campione, E., Roy, J., Miquel, C., Shehzad, W., et al. (2012b). Soil sampling and isolation of Extracellular DNA from large amount of starting material suitable for metabarcoding studies. Mol. Ecol. 21, 1816–1820. doi: 10.1111/j.1365-294X.2011.05317.x
Torti, A., Lever, M. A., and Jørgensen, B. B. (2015). Origin, dynamics, and implications of extracellular DNA pools in marine sediments. Mar. Genom 24(Pt 3), 185–196. doi: 10.1016/j.margen.2015.08.007
Wangensteen, O. S., and Turon, X. (2016). “Metabarcoding techniques for assessing biodiversity of marine animal forests,” in Marine Animal Forests, eds S. Rossi, L. Bramanti, A. Gori, and C. Orejas Saco del Valle (Cham: Springer International Publishing), 1–29. doi: 10.1007/978-3-319-17001-5_53-1
Keywords: environmental metabarcoding, RNA versus DNA, extracellular DNA, deep-sea biodiversity, benthic ecology, biomonitoring, method testing
Citation: Brandt MI, Trouche B, Henry N, Liautard-Haag C, Maignien L, de Vargas C, Wincker P, Poulain J, Zeppilli D and Arnaud-Haond S (2020) An Assessment of Environmental Metabarcoding Protocols Aiming at Favoring Contemporary Biodiversity in Inventories of Deep-Sea Communities. Front. Mar. Sci. 7:234. doi: 10.3389/fmars.2020.00234
Received: 25 November 2019; Accepted: 25 March 2020;
Published: 08 May 2020.
Edited by:
J. Murray Roberts, University of Edinburgh, United KingdomReviewed by:
Olivier Laroche, University of Hawai‘i at Mānoa, United StatesS. Kim Juniper, University of Victoria, Canada
Copyright © 2020 Brandt, Trouche, Henry, Liautard-Haag, Maignien, de Vargas, Wincker, Poulain, Zeppilli and Arnaud-Haond. This is an open-access article distributed under the terms of the Creative Commons Attribution License (CC BY). The use, distribution or reproduction in other forums is permitted, provided the original author(s) and the copyright owner(s) are credited and that the original publication in this journal is cited, in accordance with accepted academic practice. No use, distribution or reproduction is permitted which does not comply with these terms.
*Correspondence: Miriam I. Brandt, bWlyaWFtLmlzYWJlbGxlLmJyYW5kdEBnbWFpbC5jb20=; Sophie Arnaud-Haond, c29waGllLmFybmF1ZEBpZnJlbWVyLmZy