 Sebastian Overmans
 Susana Agustí
- Red Sea Research Center, King Abdullah University of Science and Technology, Thuwal, Saudi Arabia
Ultraviolet radiation (UV) is a crucial abiotic stressor that can have severe impacts on biota residing in the upper euphotic zone, especially if UV stress coincides with other stressors such as extreme sea surface temperatures (SSTs). Exposure-dependent effects of UV exposure have been described for a broad range of marine taxa and ecosystems such as coral reefs, yet little is known about the magnitude and seasonality of UV exposure in natural waters. In the present study, we determined how daily exposure of UV-B and UV-A varies seasonally along the water column of a reef system in the central Red Sea, and identified periods when damaging UV levels are likely to coincide with episodes of extreme SST, both presently and in the future. Between July 2016 and September 2018, UV spectroradiometer profiles were recorded fortnightly at a pelagic site adjacent to a mid-shore reef off the Saudi Arabian Red Sea coast, while atmospheric UV-B and UV-A irradiances were measured in 10-min intervals. Additionally, we quantified the concentration of chlorophyll-a (Chl-a) and absorption by chromophoric dissolved organic matter (aCDOM) in the reef as well as the surrounding waters. Biologically effective optical depths (Z10%) ranged from 6.3–12.9 m (UV-B) and 14.4–27.3 m (UV-A), with the highest UV transparency being observed in late summer when photodegradation of dissolved organic matter (DOM) was most intense and the concentration and molecular weight of CDOM were at their lowest. Incident UV peaked a few weeks prior to this later summer maximum in UV transparency. Consequently, organisms living close to the water surface experienced their most intense UV exposure in May/June, while the timing of maximum UV exposure for biota below ∼2–4 m coincided with the annual peak in water transparency and water temperature, i.e., in July/August. However, SSTs in the Red Sea are increasing at a rapid rate due to climate change, with the consequence that extreme temperatures are occurring earlier in the year and may eventually coincide with extreme UV radiation in shallower areas of the reef. This development could have potentially detrimental effects on highly sensitive, immotile reef biota such as reef-building corals.
Introduction
Ultraviolet radiation (UV: 200–400 nm) is a crucial constituent of solar radiation that is further subdivided into three spectral bands: UV-A (315–400 nm), UV-B (280–315 nm), and UV-C (200–280 nm). Wavelengths of the most damaging spectrum (i.e., UV-C) are entirely absorbed by stratospheric ozone and consequently do not reach the earth’s surface, whereas UV-A and UV-B are only partially attenuated in the atmosphere and therefore reach the ocean, where they can impact marine organisms in the euphotic zone (Smith and Baker, 1989; Williamson et al., 2014).
Effects of UV exposure on marine biota include direct changes to metabolism, pigmentation, reproductive output, genetic material and survival, as reported for a wide range of taxa (Helbling and Zagarese, 2003; Banaszak and Lesser, 2009; Llabres et al., 2013), including phytoplankton (Llabres et al., 2010; Nahon et al., 2010; Yadav et al., 2016; Shi et al., 2017; Joshi et al., 2018), macroalgae (van de Poll et al., 2001; Schweikert et al., 2011; Ayres-Ostrock and Plastino, 2014; Xiao et al., 2015), seagrasses (Larkum and Wood, 1993), tunicates (Hirabayashi et al., 2006; Hirose et al., 2006), corals (Gleason et al., 2006; Ferrier-Pages et al., 2007; Torregiani and Lesser, 2007; Torres-Perez and Armstrong, 2012), bivalves (Buck et al., 2002), echinoderms (Shick et al., 1992; Karentz et al., 1997), crustaceans (Kim et al., 2015; Zeni et al., 2015; Carreja et al., 2016), and fish (Kaweewat and Hofer, 1997; Zamzow et al., 2013; Carrasco-Malio et al., 2014). Furthermore, UV radiation can cause damage indirectly through the production of reactive oxygen species (ROS) that subsequently disrupt protein synthesis and the integrity of photosynthetic membranes (Lesser et al., 1990; Lesser, 1996), or by enhancing the toxicity of harmful compounds (e.g., petroleum products) present in the water column (Gomes et al., 2009; Barron, 2017; Overmans et al., 2018).
However, the extent of both direct and indirect UV effects depends on the time of day as well as the exposure, i.e., the intensity and duration of solar UV exposure, which in turn are determined by latitude, season and atmospheric conditions such as cloud cover and pollution (Pfeifer et al., 2006). Due to its proximity to the equator and low cloud cover, the Red Sea region receives intense solar and UV radiation (Khogali and Albar, 1992; McKenzie et al., 2007; Acker et al., 2008; Smyth, 2011). However, aerosols in the atmosphere, such as sea salt, mineral dust or sulfuric acid droplets, can severely reduce the amount of UV reaching the Red Sea surface (Dickerson et al., 1997). In the Sahara and Arabian Peninsula, aerosols are primarily composed of mineral dust originating from the desert (Hsu et al., 2004), with dust storms frequently passing over the Red Sea, causing reduced visibility and high attenuation of UV-B radiation in the atmosphere (Kalenderski et al., 2013; Prakash et al., 2015).
Once in the water column, the magnitude of UV exposure is dependent on multiple factors. The penetration of UV in marine environments is partly dependent on the optical properties of saltwater, but it is primarily dependent on the amount and characteristics of dissolved organic matter (DOM) as well as phytoplankton and other suspended particles (Lee et al., 2005). Of these factors, the two most crucial water constituents known to modulate UV attenuation are chlorophyll a (Chl-a) and chromophoric dissolved organic matter (CDOM). Whereas water absorbs mostly in the energetically low, red spectrum (>600 nm), Chl-a found in planktonic primary producers absorbs most strongly in the blue range (450 nm) and also in the UV spectrum. In contrast, CDOM exhibits an absorption spectrum that increases exponentially from the visible light wavelengths into the UV range, and is therefore commonly referred to as the principal modulator of UV attenuation in marine waters (Bricaud et al., 1981; Coble et al., 2004; Tedetti and Sempere, 2006).
Coastal regions tend to have the highest concentrations of nutrients, Chl-a and CDOM, due to riverine inputs of sediments and dissolved nutrients. The Red Sea region, however, is characterized by arid climatic conditions and lacks major river catchments that could transport nutrients of terrigenous origin into the Red Sea. Consequently, the Red Sea is an ultra-oligotrophic sea where concentrations of both Chl-a and CDOM are exceptionally low, with Chl-a of generally <0.8 mg m–3, reaching its annual minimum of <0.1 mg m–3 during the summer when the water column is stratified (Sofianos and Johns, 2002; Raitsos et al., 2013; Kheireddine et al., 2018; López-Sandoval et al., 2019). A study by Overmans and Agusti (2019) reported that this summer minimum coincides with the period when Red Sea waters exhibit their highest transparency to UV radiation, and they concluded that both Chl-a and CDOM explained the observed variability in the downwelling diffuse attenuation coefficient (Kd).
Existing studies suggest that the Red Sea has some of the lowest reported Kd values for UV wavelengths among the global oceans and seas (Stambler, 2005; Dishon et al., 2012; Cao et al., 2014; Overmans and Agusti, 2019). However, we still lack long-term data describing the magnitude and seasonality of ambient and underwater UV exposure, which could help to evaluate UV-induced stress on marine organisms residing in oligotrophic, tropical waters (Banaszak and Lesser, 2009). Moreover, unraveling whether periods of intense UV exposure coincide with those of extreme water temperature is critical, as high temperature has been shown to enhance the damaging effects of intense irradiance, or vice versa, on marine organisms (Buck et al., 2002; Ferrier-Pages et al., 2007; Giordanino et al., 2011; Lionard et al., 2012; Bellworthy and Fine, 2017). For some organisms, such as tropical reef corals, temperature and UV radiation have been identified to act synergistically, resulting in negative impacts of multiplicative magnitude (Drohan et al., 2005; Jin et al., 2019). This finding poses several questions regarding the future health status of highly sensitive marine ecosystems such as coral reefs, as current climate predictions suggest a gradual increase of both temperature and UV radiation until the end of this century (Bais et al., 2011; Williamson et al., 2014; IPCC, 2018). This rising trend is of major relevance for environments that already experience extreme conditions such as the Red Sea. Here, sea surface temperatures (SSTs) during the summer can reach close to 34°C in open waters, and even above 35°C in shallow coastal ecosystems, while at the same time the basin exhibits annual SST warming rates that are above the global average (Raitsos et al., 2011; Fine et al., 2013; Chaidez et al., 2017; Garcias-Bonet and Duarte, 2017; Osman et al., 2018; Genevier et al., 2019; Giomi et al., 2019).
In the present study, we aim to describe the seasonal variability of underwater UV exposure in the rapidly warming Red Sea, and identify the periods when high temperatures and damaging levels of UV radiation co-occur. We quantify the variability in incident UV solar radiation and the attenuation properties of coastal waters in the central Red Sea in order to estimate the daily exposure of UV received by organisms along the water column. Additionally, we analyze time-series data of water temperature, Chl-a and CDOM and evaluate the contribution of the latter two parameters to UV attenuation in the central Red Sea. The presented results provide an insight into the present and projected seasonal variability of UV exposure in the water column that can be used to evaluate UV-induced stress and possible interactions with temperature on marine organisms such as reef-building corals, which constitute important ecosystem engineers in the coastal waters of the Red Sea.
Materials and Methods
Study Sites and Time-Series Measurements
Between July 2016 and September 2018, we recorded time-series measurements at three study sites near King Abdullah University of Science and Technology (KAUST) in Thuwal, Saudi Arabia (see Figure 1 for locations). One location was at the end of the pier located at the Coastal and Marine Resources Core Lab (CMOR) at KAUST (22.304639°N, 39.102167°E), while a further two marine sampling locations were located approximately 7 km offshore from KAUST and included a reef station at a shallow area (<2 m depth) of the mid-shore reef called Al Fahal (22.252833°N, 38.961222°E) and a pelagic station (45–50 m depth) adjacent to the reef (22.309333°N, 38.997389°E).
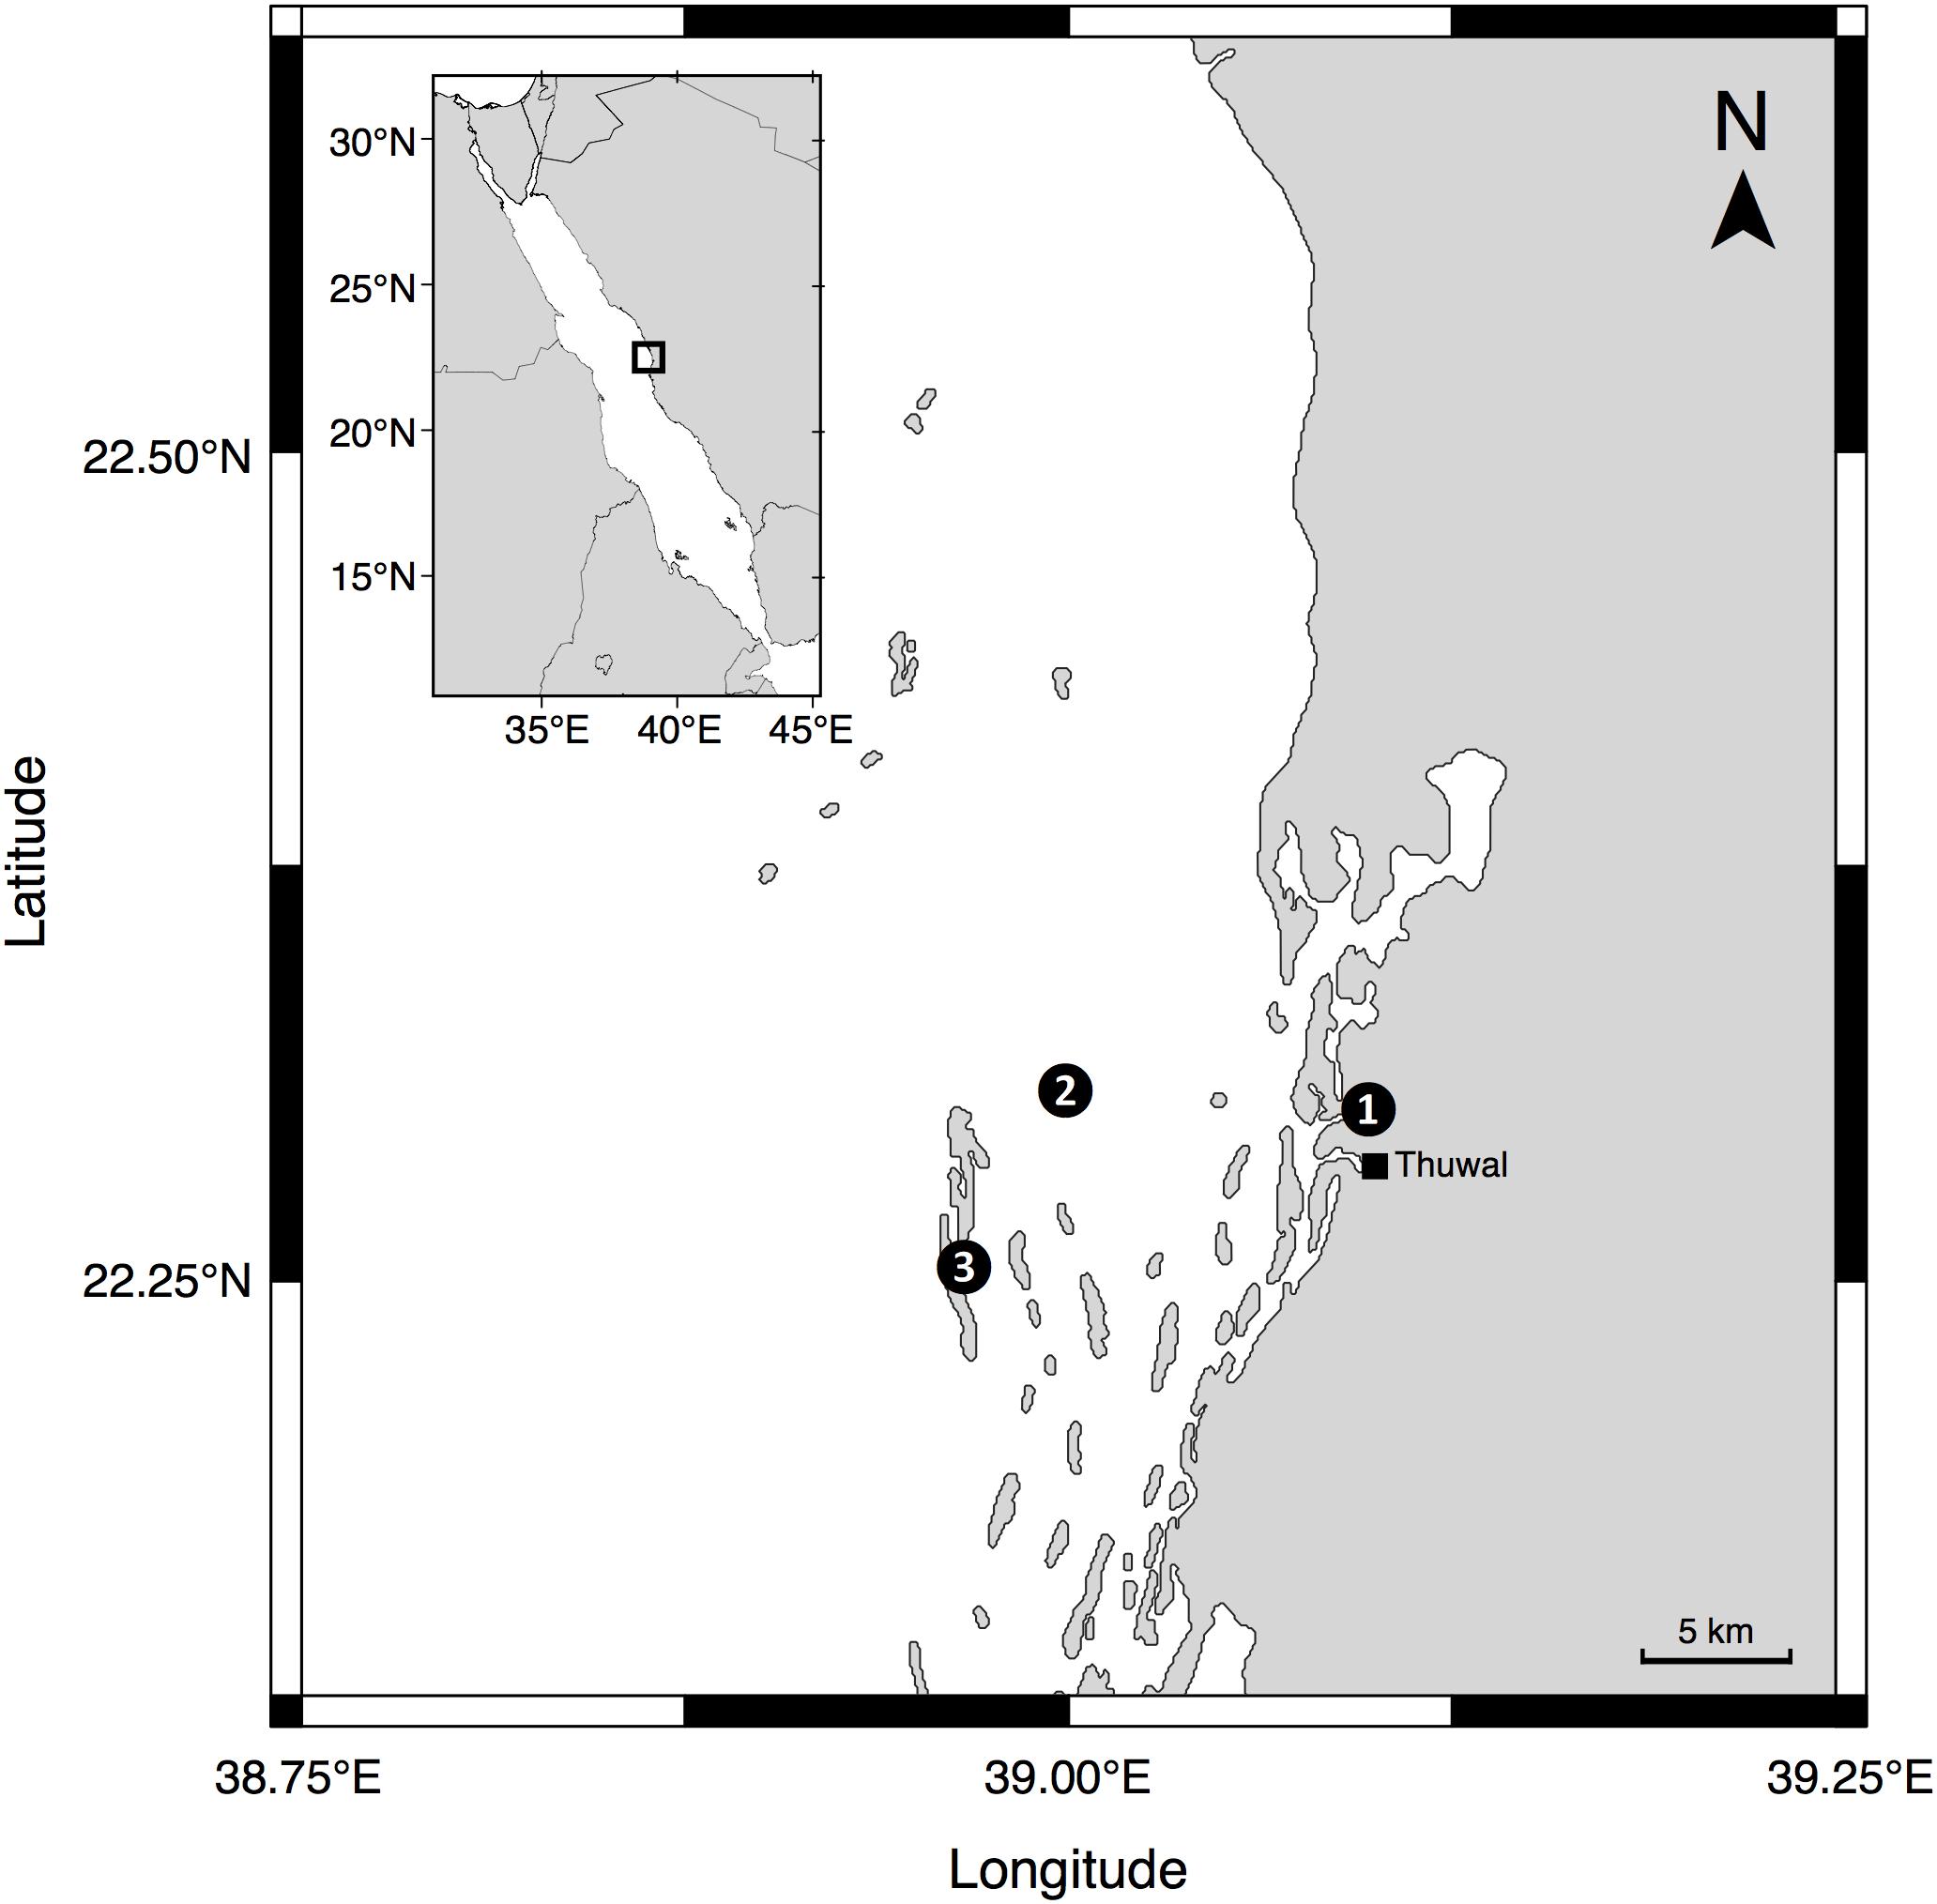
Figure 1. Locations of the sampling sites where time series measurements were taken: (1) The pier of the Coastal and Marine Resources Core Lab (CMOR) at KAUST, (2) the pelagic station, and (3) Al Fahal Reef.
At the CMOR pier, we measured atmospheric UV irradiances with two stationary radiometers (SUV-B UV and SUV-A UV by Kipp & Zonen, Netherlands). Specifically, the radiometers recorded spectrally integrated, unweighted UV-B (280–315 nm) and UV-A (315–400 nm) irradiances in 10-min intervals between February 2017 and September 2018. The sensor lenses were cleaned weekly to minimize dust accumulation. Raw data were downloaded monthly from the stationary radiometers and processed using the software package UVIATOR (Kipp & Zonen, Netherlands). For each UV measurement, the program calculated the solar zenith angle (using location and time) and determined ozone column density using the EPTOMS Ozone plugin (v1.1). This plugin utilizes NASA’s Earth Probe Total Ozone Mapping Spectrometer data set to convert measured voltages into corrected, observed UV-B and UV-A irradiances.
At the reef and pelagic stations, we measured SST with a high precision digital thermometer (Catalog # 89369-138; VWR International, United States) approximately every fortnight between 26th July 2016 and 27th September 2018. Additionally, we took water samples from the first meter of the water column for the quantitative analysis of Chl-a and CDOM in the lab, following the procedures described by Overmans and Agusti (2019). Briefly, the concentration of Chl-a was determined using a Trilogy Fluorometer (Turner Designs, United States) after filtration and pigment extraction. For the CDOM analysis, pre-filtered (0.2 μm) seawater samples were injected into a 2.5 m liquid waveguide capillary cell (LWCC) (Miller et al., 2002), coupled with a miniature fiber-optic spectrometer (USB2000+, preconfigured to 200–850 nm; Ocean Optics Inc.) and dual lamp (tungsten and deuterium) light source (DH-2000, Ocean Optics Inc.). The sample spectrum was compared against that of Milli-Q water after a correction of the refractive index to account for salinity differences, following the method of Babin et al. (2003). CDOM absorption coefficients aCDOM (λ) (in m–1) were calculated as shown in equation (1):
where l is the optical pathlength (m), and 2.303 is the factor to convert base e to base 10 logarithms. We report aCDOM for 305, 313, 320, 340, 380, and 395 nm as a proxy of CDOM abundance. In addition, we calculated the ratio of absorption coefficients at 254 and 365 nm, aCDOM(254/365), the slopes of aCDOM spectra in the regions 275–295 nm [S(275–295)] and 350–400 nm [S(350–400)], and the ratio of these slopes [S(275–295)/S(350–400)], also termed SR, to identify photobleaching processes and the molecular weight of the CDOM (Dahlen et al., 1996; Helms et al., 2008).
Furthermore, at the pelagic study site, we recorded downwelling irradiance (Ed) depth profiles (n = 51) approximately every fortnight between 26th July 2016 and 27th September 2018. From July 2016 to April 2017, we used a BIC radiometer (Biospherical Instruments, San Diego, CA, United States) with three UV wavebands (305, 313, 320 nm) and PAR (400–700 nm) for the data collection, which was subsequently replaced with a C-OPS (Compact-Optical Profiling System) radiometer (Biospherical Instruments, San Diego, CA, United States) with six UV channels (305, 313, 320, 340, 380, 395 nm) and PAR (400–700 nm) for the remaining data collection period (April 2017 to September 2018). We performed an intercomparison of the two instruments for the four shared wavelength channels to ensure the results obtained with the two spectroradiometer models were highly comparable (error < 3%).
On each sampling day, we deployed the radiometer from a small boat in the late morning (09:30 am–11:15 am) during generally cloud-free and calm sea conditions down to a maximum depth of 30–35 m. We performed a dark-correction of the depth and optical channels before each measurement and recorded profiles on the sunny side of the boat to minimize shading. For the BIC radiometer, we used the free-fall technique (Waters et al., 1990), while the C-OPS was maneuvered approximately 5 m away from the boat at the surface before vertical profiling started at a speed of ∼0.4 m s–1. Both radiometers were equipped with pressure sensors so that irradiances could be recorded continuously (5 Hz) during the profiles.
Calculation of Kd, Zn% and UV Exposure
We used irradiance versus depth profiles from the spectroradiometer casts to calculate diffuse attenuation coefficients Kd(λ) and the 10 and 1% percent attenuation depths (Zn%), as previously described by Overmans and Agusti (2019).
We determined daily exposures of unweighted atmospheric UV-B and UV-A (IA; in kJ m–2 d–1) by integrating the incident irradiance values for each day using GraphPad Prism 8.0.2 (GraphPad Software Inc., San Diego, CA, United States). Additionally, we calculated incident, erythemally weighted UV (UV-Ery) doses using the relationship between unweighted integrated UV-B irradiance and erythemally weighted UV, as described by McKenzie et al. (2004). Although this relationship is variable depending on total column ozone (TCO) and solar zenith angles (SZA), the authors found that the following conversion for TCO = 300 DU and SZA = 30° can be applied in the range of 250–400 DU with an error of less than ±10% for solar zenith angles ≤60°:
Unweighted UV exposure immediately beneath the water surface (I0) was calculated using the unweighted atmospheric UV exposure (IA), assuming that downwelling irradiance is attenuated (predominantly reflected) on average by 7% when changing from air to water (Campbell and Aarup, 1989):
To acquire daily exposures of UV-B and UV-A in the water column, we first determined the downwelling attenuation coefficient (Kd) for each day. Specifically, Kd of UV-B and UV-A wavelengths were directly determined on 42 and 36 days, respectively, when radiometer profiles were recorded in situ. For the remaining days when underwater UV attenuation was not directly determined (UV-B: n = 562; UV-A: n = 493), we calculated Kd by linearly extrapolating the Kd values from the preceding and the following sampling event. We calculated the depths (z) at which selected daily UV exposures (Iz) were received, using the sub-surface UV exposure (I0) and downwelling attenuation coefficient (Kd), as shown in equation (4):
We plotted daily UV exposure against date as a contour plot with contour lines smoothed at a level of 0.025 using the software JMP Pro 14.1.0 (SAS Institute Inc., Cary, NC, United States).
Projection of Future SST and UV-B Exposure
To identify periods when extreme SSTs coincide with extreme UV-B exposure at our study site (in 0.5, 1.0, and 2.0 m depth), we used our existing time-series data set for the years 2017/2018, as well as projected future values for the years 2050 and 2100 based on existing future climate models.
Due to the Red Sea’s unusually fast warming rate, which is above the global average, the projected SST values were calculated based on two warming reports of the Red Sea. For example, according to the latest IPCC report, the SST of the ocean is estimated to increase by an additional 0.6–2.0°C before the end of the century (Rhein et al., 2013). In comparison, two recent studies by Chaidez et al. (2017) and Osman et al. (2018) found the SST in the central Red Sea warms at rates of 0.017°C year–1 (+ 1.40°C by 2100) and 0.035°C year–1 (+ 2.87°C by 2100), respectively. For our future projections, we, therefore, used an intermediate rate of 0.026°C (i.e., an increase of 2.13°C by 2100) to determine potential future SSTs. Specifically, we first calculated the mean temperature for each calendar month using our time series data from 2017/2018 and increased the values by 0.832°C (32 years × 0.026°C year–1) for the 2050 projection or by 2.132°C (82 years × 0.026°C year–1) for the 2100 scenario.
We calculated daily exposures of UV-B in the upcoming decades based on the latest future-UV radiation models, which are in agreement that UV-B exposure is expected to remain unchanged in the tropics until 2050 due to the drastic reduction in the emission of ozone-depleting substances (ODS) and the associated recovery of the total column ozone (Bais et al., 2011, 2019; McKenzie et al., 2011; Watanabe et al., 2011; Meul et al., 2016). The same studies found that by 2100, UV-B exposure will likely have increased by up to 3% as a consequence of continued greenhouse gas (GHG) emissions. Therefore, our projected values for 2050 are identical to those of 2017/2018, whereas, for the 2100 projection, we increased our present UV-B exposure that we calculated for each depth and individual day by 3%.
The damaging UV-B exposure threshold was chosen as 20 kJ m–2 d–1, based on a study from southern Taiwan, i.e., at a similar latitude (21°N) to the central Red Sea, where the physiology, development and settlement of the coral Pocillopora damicornis were severely impacted at those UV-B exposure levels (Zhou et al., 2016). For the extreme temperature threshold, we selected the climatological maximum monthly mean of the Jeddah region, which has been identified as 31.1°C in a recent report by Osman et al. (2018).
We smoothed each temperature and UV-B data set in GraphPad Prism 8.0.2 (GraphPad Software Inc., San Diego, CA, United States) using a sixth-order polynomial trendline.
Statistical Analysis
To analyze the CDOM slopes and the CDOM ratios, we first tested if the data were normally distributed and whether the variances were equal using the Shapiro–Wilk test and Levene’s test, respectively. Subsequently, we performed a multi-comparison of each data pair using Student t-tests to identify differences between seasons. Differences were considered to be significant at a level of p < 0.05. Furthermore, we explored the relationship between Kd, CDOM and Chl-a by performing a set of linear regressions. In addition, we fitted a standard least squares multiple linear model to the aCDOM and Chl-a data from the pelagic station in order to predict the Kd of the reef waters. We carried out data analyses and visualizations in either JMP Pro 14.1.0 (SAS Institute Inc., Cary, NC, United States) or GraphPad Prism 8.0.2 (GraphPad Software Inc., San Diego, CA, United States).
Results
Atmospheric UV Exposure and UV-Ery Doses
We recorded atmospheric midday UV-B irradiances as high as 2.59 W m–2 in 2017 (May) and 2.66 W m–2 in 2018 (May), while maximum midday UV-Ery irradiances were 0.34 (May 2017) and 0.35 W m–2 (May 2018) (Table 1). For UV-A, we also recorded the maximum atmospheric midday irradiance of 2017 in May (77.5 W m–2), but the 2018 maximum was recorded much earlier in the year, i.e., in February (72.9 W m–2). Whereas maximum midday UV-B and UV-Ery irradiances were recorded in May in both years, the monthly means peaked in June 2017 (UV-B: 2.24 ± 0.18 W m–2; UV-Ery: 0.30 ± 0.02) and in April the following year (UV-B: 2.2 ± 0.16 W m–2; UV-Ery: 0.30±), which was also the same time when we recorded the highest mean values of midday UV-A irradiances in each year: 64.7 ± 3.8 W m–2 in June 2017 and 65.0 ± 4.0 W m–2 in April 2018 (Table 1).
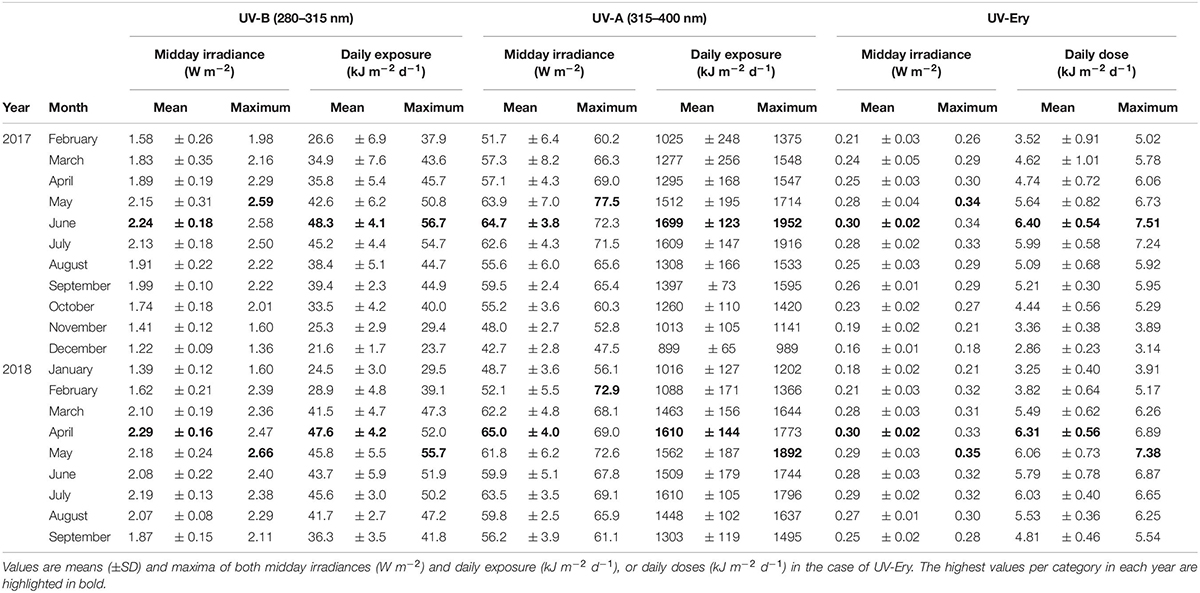
Table 1. Atmospheric UV-B (280–315 nm), UV-A (315–400 nm), and erythemally weighted UV (UV-Ery) conditions at KAUST (22.304639°N, 39.102167°E) between February 2017 and September 2018.
The monthly averaged daily exposure of atmospheric UV varied from 21.6 (December 2017) to 48.3 kJ m–2 d–1 (June 2017) for UV-B, and from 899 (December 2017) to 1699 kJ m–2 d–1 (June 2017) for UV-A (Table 1). UV-Ery ranged from 2.86 (December 2017) to 6.40 kJ m–2 d–1 (June 2017). However, daily UV-A exposures reached a maximum of 1952 kJ m–2 d–1 in 2017 (June) and 1892 kJ m–2 d–1 in May of the following year (Table 1 and Figure 2A). For UV-B, we detected maximum daily exposures of 56.7 kJ m–2 d–1 in 2017 (June) and 55.7 kJ m–2 d–1 in 2018 (May), while UV-Ery doses reached maxima of 7.51 and 7.38 kJ m–2 d–1 in June 2017 and May 2018, respectively (Table 1 and Figure 2B).
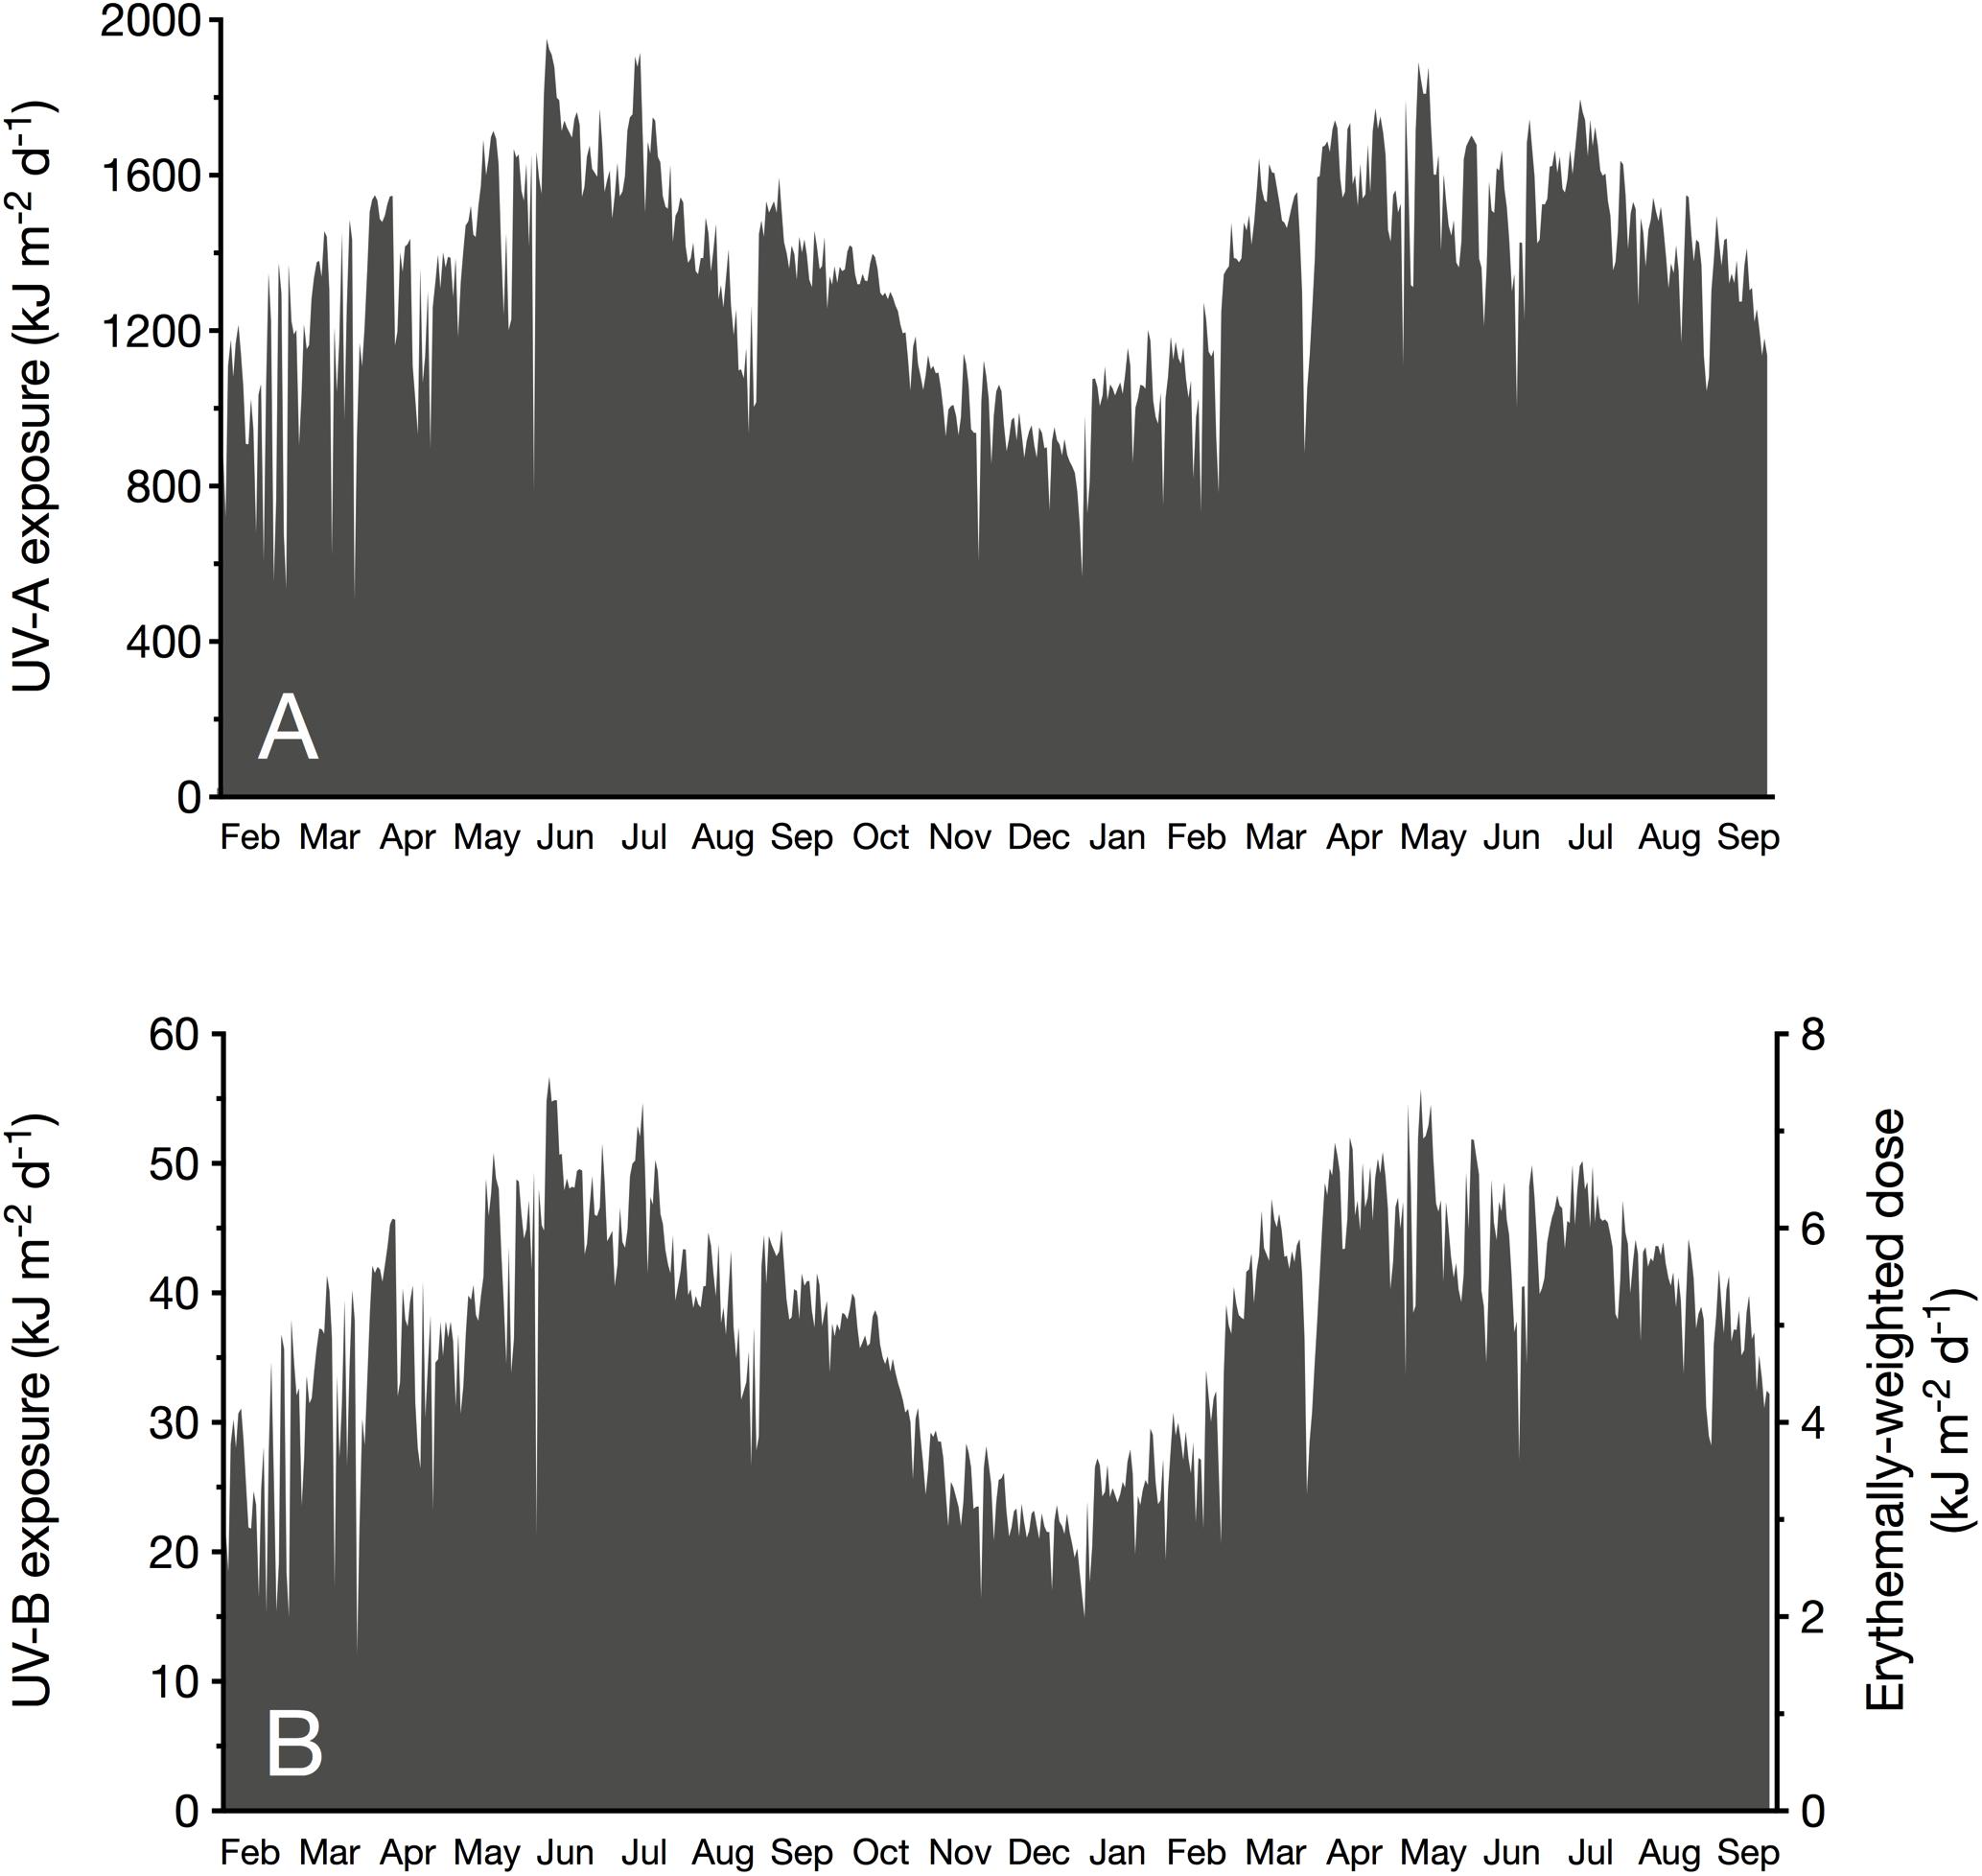
Figure 2. Daily exposure (kJ m– 2 d– 1) of incident unweighted UV-A (315–400 nm; A) and UV-B (280–315 nm; B, left y-axis) radiation, and erythemally weighted UV doses (B, right y-axis). Values were measured at sea level at the KAUST CMOR pier (22.304639°N, 39.102167°E) between February 2017 and September 2018.
It is conspicuous that in 2017, we identified June as the month when mean daily UV exposure peaked; however, in the following year, daily UV exposure was on average highest in April. The annual maximum incident UV irradiances (in W m–2), on the other hand, were recorded in May, except for the UV-A maximum in 2018, which was detected in February.
Independent of the distinct seasonality of UV-B and UV-A, we observed several days with unusually low UV during dust storm events, suggesting a strong influence of aerosols on UV attenuation in the atmosphere. For example, on 19th March 2017, daily exposures of atmospheric UV-B (12.0 kJ m–2 d–1) and UV-A (505 kJ m–2 d–1), and daily doses of UV-Ery (1.59 kJ m–2 d–1) were minimal due to an intense sand storm (Figure 2). Our measurements showed that this dust event continued to influence incident UV radiation until 24th March. A similar, albeit less severe, storm event occurred on 29th May 2017, when the daily exposures of atmospheric UV-B and UV-A were 21.2 and 781 kJ m–2 d–1, respectively, and erythemally weighted UV doses were 2.81 kJ m–2 d–1 (Figure 2). In this case, however, atmospheric UV irradiances were noticeably reduced on the day of the event only.
Temperature, Chl-a and CDOM
During the study period, the SST at the pelagic site ranged from 24.4°C, recorded in February 2018, to 32.2°C in August 2016 and 2018 (Figure 3). Interannual variability between minimum temperatures in winter was negligible, with minimum February temperatures of 24.6 and 24.6°C in 2017 and 2018, respectively. We found an equally low difference for the annual summer temperature extremes, with maximum values of 32.2, 32.1, and 32.2°C in 2016, 2017, and 2018, respectively. In comparison, the SST at the reef site reached the same summer maximum temperature as the pelagic station (i.e., 32.2°C); however, the minimum winter temperature recorded at the reef was considerably lower with values of 23.9°C and 22.8°C in January of 2017 and 2018, respectively. During the three summers of our study, we measured at the reef maximum summer SSTs of 32.2, 31.8, and 32.2°C in 2016, 2017, and 2018, respectively.
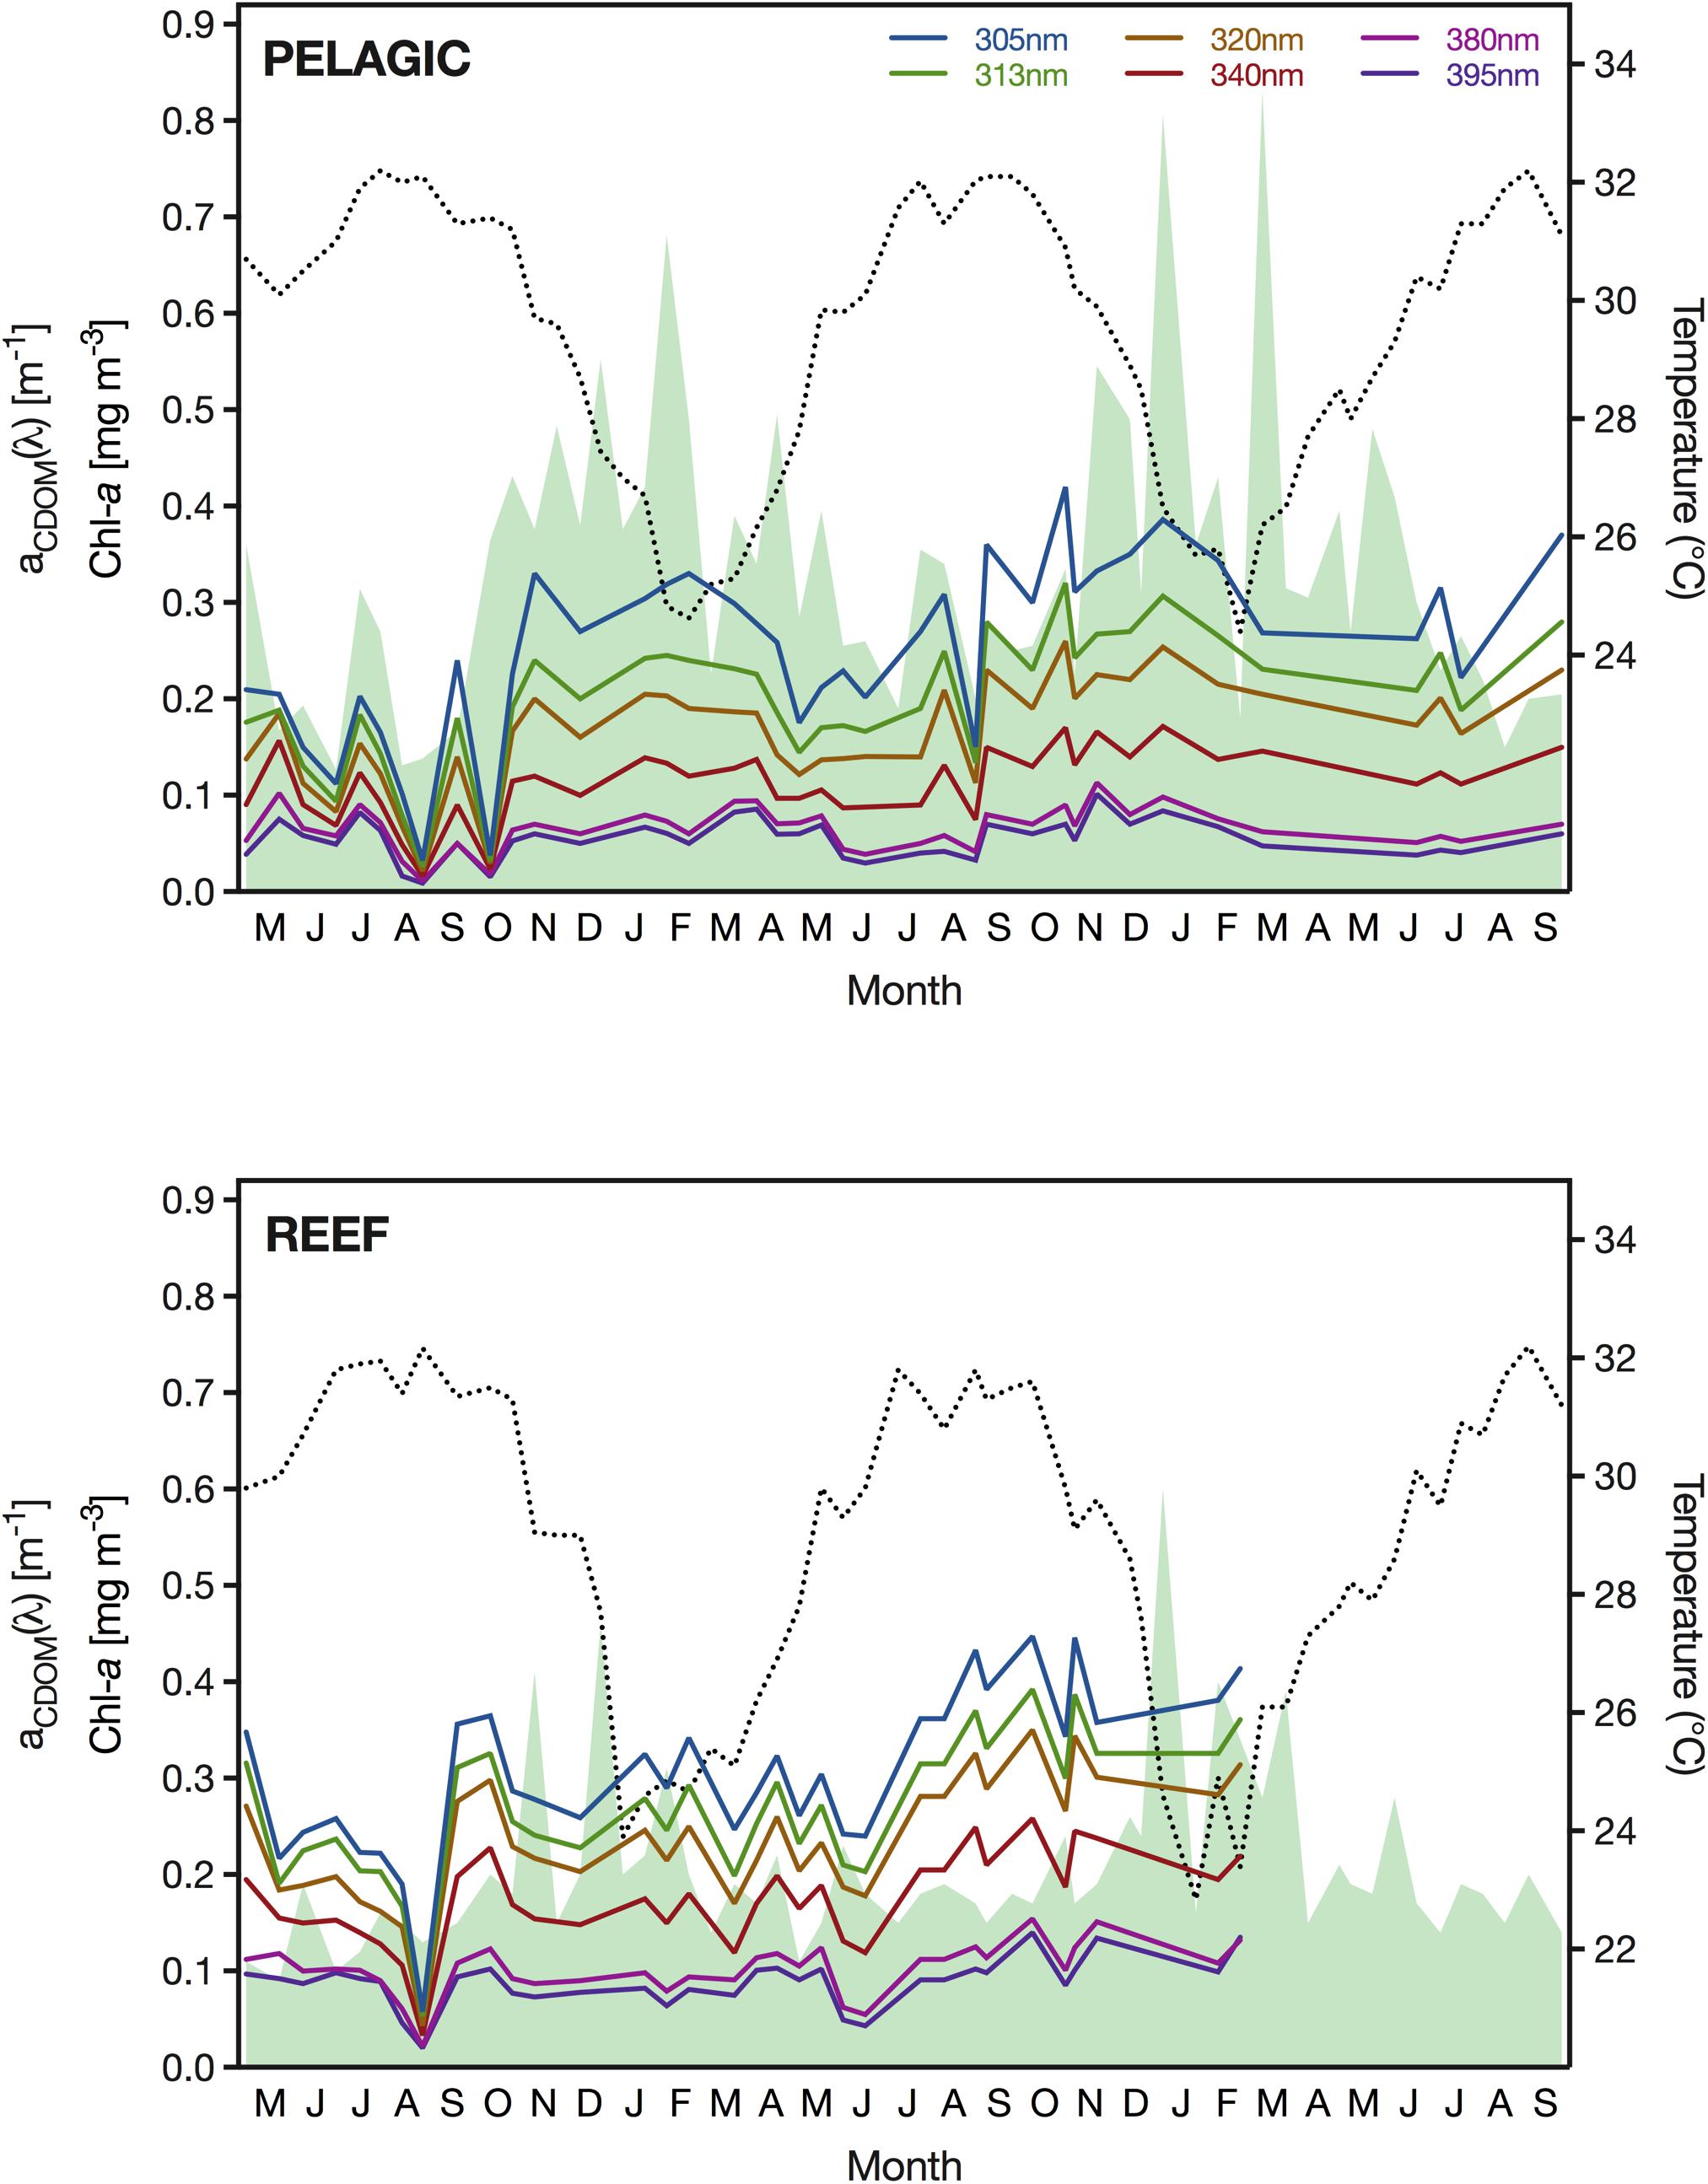
Figure 3. Sea surface temperature (SST) in <1 m depth (dotted black line), surface concentration of Chl-a (shaded green area) and absorption coefficient of CDOM (aCDOM) for the wavelengths 305, 313, 320, 340, 380, 395 nm (see figure legend for color coding) between May 2016 and September 2018 at the pelagic sampling station (22.309333°N, 38.997389°E) (upper panel) and the reef (22.309333°N, 38.997389°E) (lower panel).
Concentrations of Chl-a were generally low at the pelagic study site but exhibited a seasonal pattern. The lowest concentrations (<0.14 mg m–3) were measured between July and September, whereas in February, Chl-a reached surface concentrations of up to 0.83 mg m–3 (Figure 3). Although the maximum Chl-a concentration was detected in February in both years, we noticed a second, albeit less pronounced, bloom occurring in December and a pronounced interannual variability. Specifically, the two Chl-a concentration peaks in December and February in winter 2016/2017 (0.55 and 0.68 mg m–3) were noticeably smaller than in the following winter of 2017/2018 (0.81 and 0.83 mg m–3). At the reef, Chl-a concentrations were generally lower than at the pelagic site, which was particularly apparent during spring blooms when concentrations at the reef remained below 0.46 and 0.60 mg m–3 in the winters of 2016/2017 and 2017/2018, respectively (Figure 3). Furthermore, we measured the annual Chl-a concentration peaks at the reef in December, and thereby 6–8 weeks prior to the peaks at the pelagic site. The lowest amount of Chl-a in the reef waters was detected in June 2016, when concentrations reached a minimum of 0.09 mg m–3. In the following year, concentrations reached a similar low of 0.11 mg Chl-a m–3 at the reef.
For CDOM, we found that the magnitude and range of absorption varied considerably between wavelengths and sampling events. Specifically, aCDOM(305 nm) ranged greatly from 0.032 m–1 (September 2016) to 0.420 m–1 (October 2017) at the pelagic site and from 0.058 m–1 (September 2016) to 0.447 m–1 (September 2017) at the reef (Figure 3). In comparison, aCDOM (395 nm) only ranged from 0.009 m–1 (September 2016) to 0.101 m–1 (November 2017) and from 0.020 m–1 (September 2016) to 0.140 m–1 (September 2017) at the open water station and the reef, respectively. At both locations, we observed abrupt changes in the CDOM absorption coefficient between subsequent sampling events, which was particularly obvious in late summer, when we also observed both the annual minimum and maximum aCDOM values. Despite this large variance, aCDOM exhibited the lowest mean value in summer across all wavelengths at both stations.
The ratio of aCDOM at 254 and 365 nm [i.e., aCDOM(254/365)], which is a proxy of CDOM molecular weight, exhibited a distinct seasonality (Table 2). Specifically, at the pelagic station, the ratio was significantly higher in summer (14.60 ± 3.36) than in autumn (10.22 ± 2.80) [t(16.9) = −3.10, p < 0.01] and winter (10.95 ± 2.23) [t(11.6) = 2.51, p < 0.05]. In comparison, the reef waters had a significantly lower aCDOM(254/365) ratio in autumn (6.46 ± 1.56) than in winter (8.84 ± 1.03) [t(11.5) = −3.44, p < 0.01], spring (8.97 ± 1.90) [t(15.4) = −3.06, p < 0.01] and summer (9.33 ± 2.39) [t(15.6) = −3.12, p < 0.01)]; however, there was no difference between any of the latter three seasons. For the parameter S(275–295), we found significantly higher slope values at the pelagic site during summer (40.8 ± 9.5 μm–1) compared to autumn (28.4 ± 4.9 μm–1) [t(13.8) = −3.61, p < 0.01] and winter (29.0 ± 2.8 μm–1) [t(11.6) = 3.62, p < 0.01] (Table 2). In contrast, the S(275–295) slope values of the reef water were significantly lower in autumn (25.8 ± 3.6 μm–1) than in spring (32.1 ± 4.0 μm–1) [t(15.8) = −3.52, p < 0.01] and summer (34.0 ± 8.2 μm–1) [t(12.6) = −2.88, p < 0.05]. At neither of the stations did we find seasonal differences for the slope S(350–400) (Table 2). The slope ratio SR was consistently above 1 and as high as 7.87 (pelagic) and 8.66 (reef) (Table 2). Moreover, at both stations, the ratio was significantly higher in summer than in autumn or winter, all of which suggests that intense photobleaching occurred at both study sites throughout the year but peaked in summer.
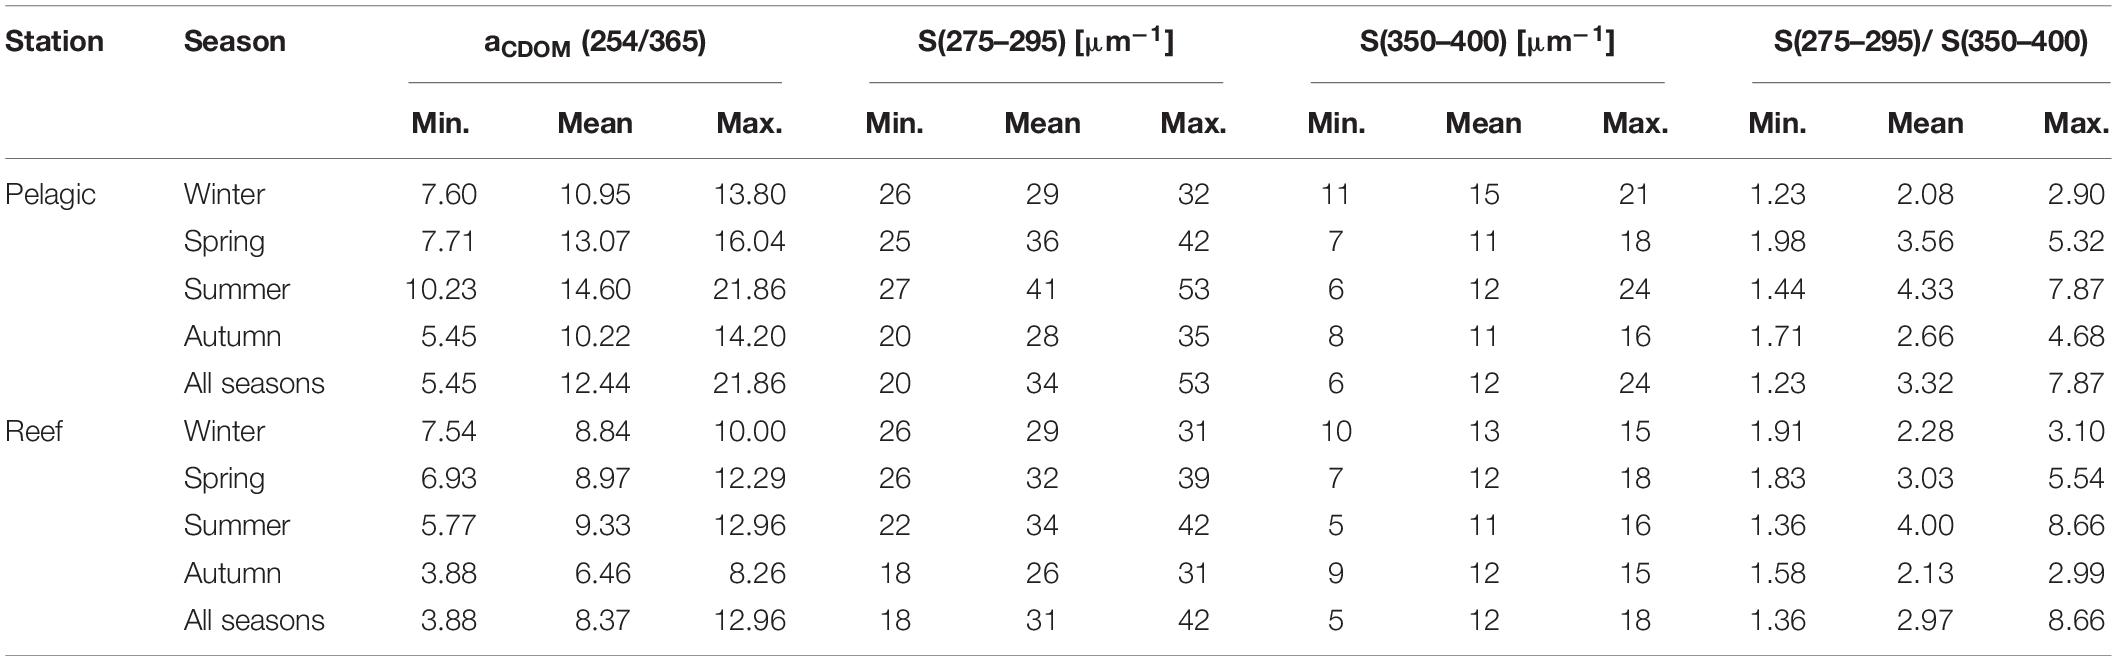
Table 2. Ratio of absorption coefficients at 254 and 365 nm [aCDOM(254/365)], the slopes of the aCDOM(λ) spectra in the regions 275–295 nm [S(275–295)] and 350–400 nm [(S(350–400)], and the ratio of these two slopes [S(275–295)/S(350–400)], summarized by station and season for the period May 2016 to September 2018.
Downwelling Attenuation Coefficient (Kd) and Percent Attenuation Depth (Zn%)
Attenuation of UV radiation varied considerably between wavelengths and seasons. Specifically, the downwelling diffuse Kd ranged between 0.054 (minimum Kd of 395 nm) and 0.425 m–1 (maximum Kd of 305 nm)(Figure 4). Kd values were generally lowest in late summer when Chl-a concentrations and absorption by CDOM reached their annual minimum. During our study, UV attenuation was lowest in October 2016, with Kd values of 0.222 m–1 (305 nm), 0.171 m–1 (313 nm) and 0.148 m–1 (320 nm). We observed similarly low UV attenuation in August 2018, when the downwelling Kd of 305, 313, 320, 340, 380, and 395 nm were 0.225, 0.193, 0.166, 0.124, 0.065, and 0.054 m–1, respectively. Generally, we found UV attenuation to be strongest during spring; however, we recorded the highest Kd values in October 2017, when Kd reached 0.425, 0.352 0.312, 0.218, 0.124, and 0.105 m–1 for 305, 313, 320, 340, 380, and 395 nm, respectively (Figure 4). Attenuation of PAR loosely mirrored the pattern observed for UV wavelengths but with a narrower range of Kd values; the minimum and maximum Kd(PAR) were 0.049 m–1 (September 2016) and 0.119 m–1 (December 2017), respectively (Figure 4).
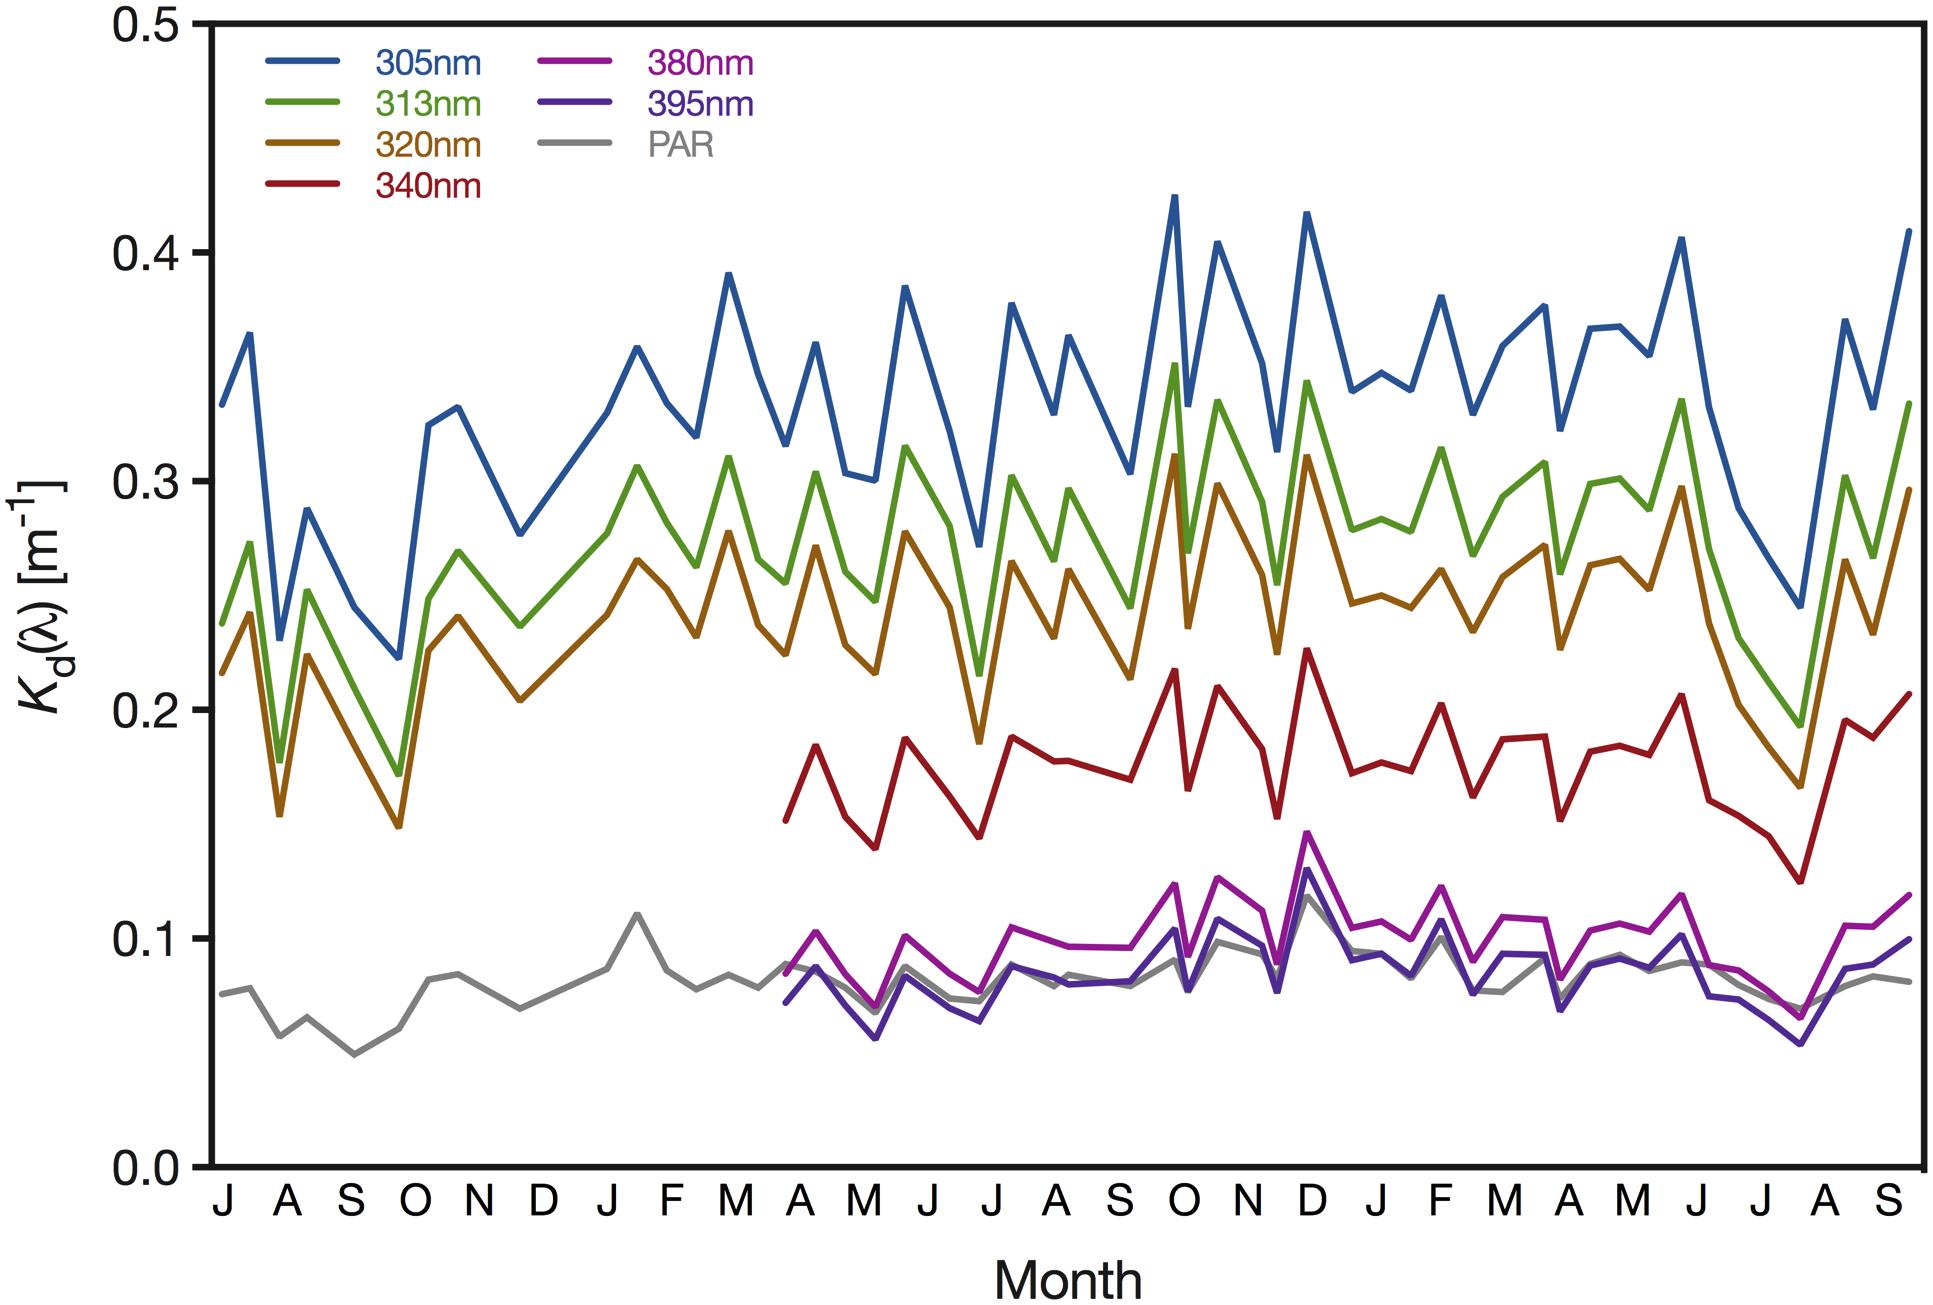
Figure 4. Downwelling attenuation coefficients (Kd) of 305, 313, 320, 340, 380, 395 nm and PAR (400–700 nm) determined for the pelagic sampling station (22.309333°N, 38.997389°E) offshore from KAUST. Measurements of the wavelengths 305, 313, and 320 nm and PAR started in July 2016, whereas the remaining wavebands were included after April 2017.
The midpoint and bottom of the euphotic layer varied between 19.3 and 46.6 m [Z10%(PAR)] and 38.7–93.1 m [Z1%(PAR)] (Table 3). Additionally, we found the biologically effective optical depths of UV in 6.3–12.9 m [Z10%(UV-B)] and 14.4–27.3 m [Z1%(UV-A)], while the depths where UV-B and UV-A could still be detected at 1% of the surface irradiance ranged from 12.6–25.7 m [Z1%(UV-B)] and 28.8–54.5 m [Z1%(UV-A)] (Table 3).
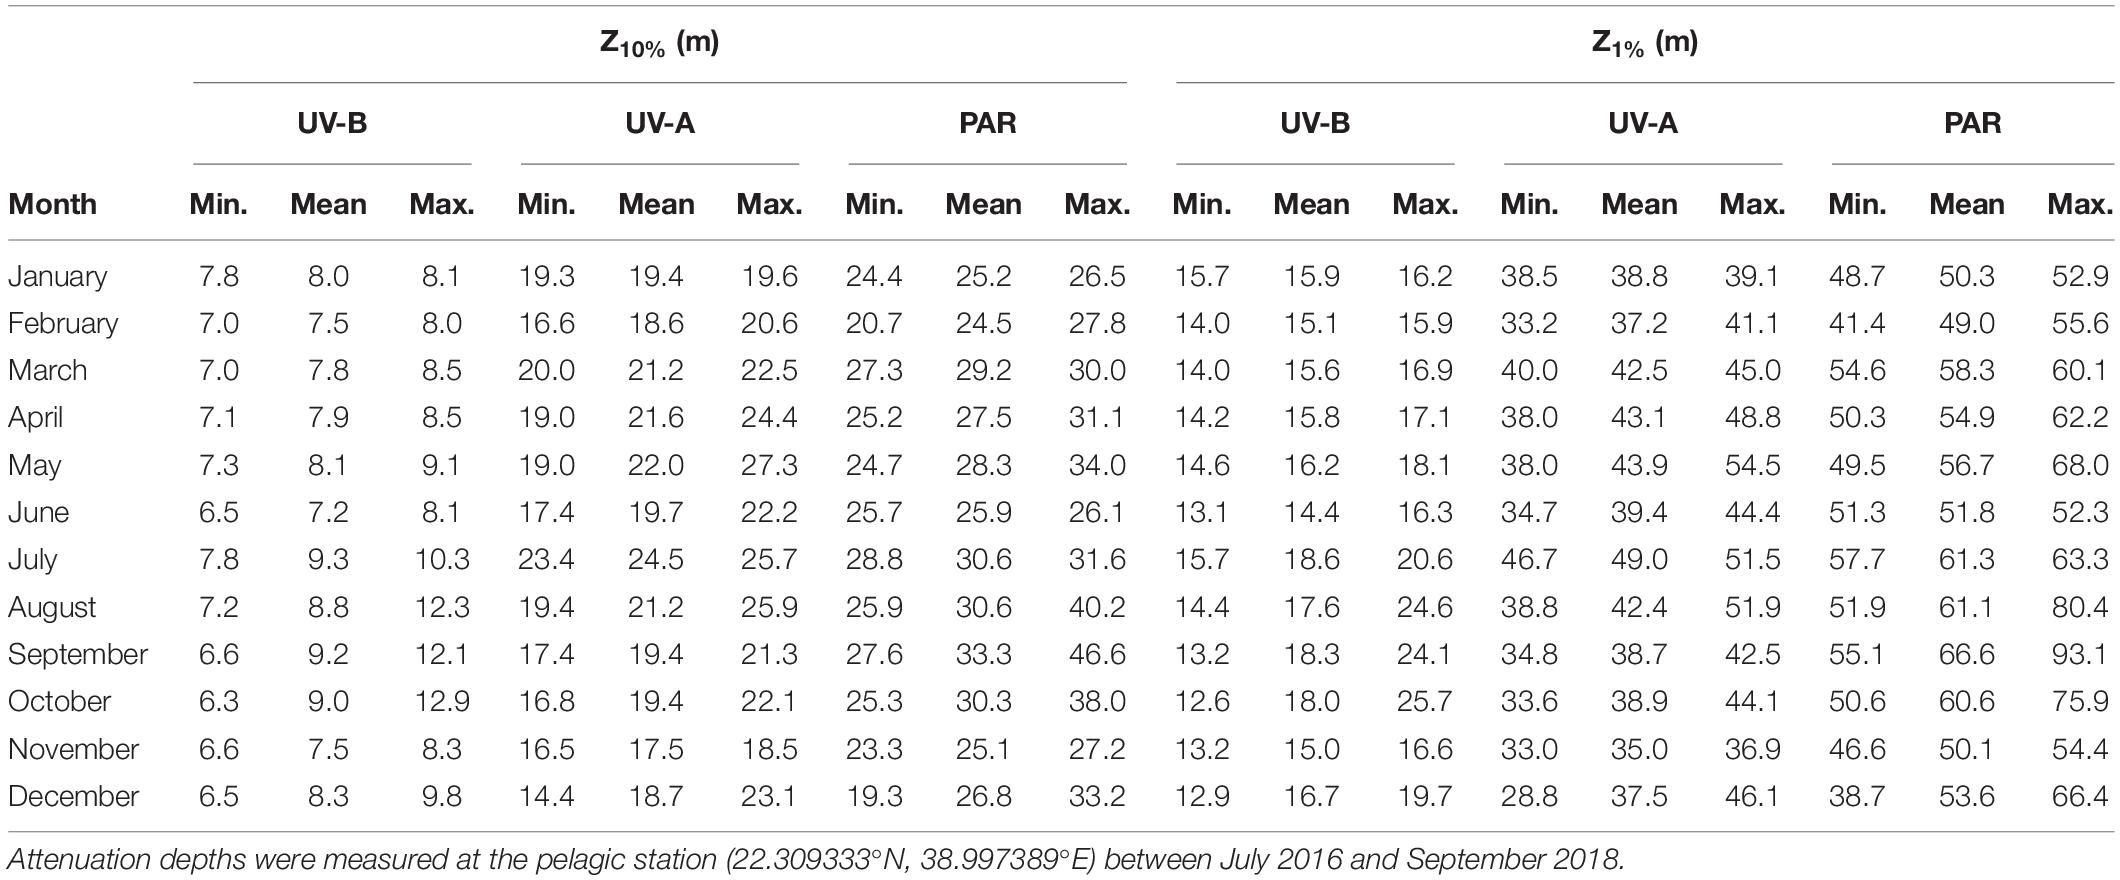
Table 3. Percent attenuation depths (Z10% and Z1%) for the UV-B (280–315 nm), UV-A (315–400 nm), and PAR (400–700 nm) spectra.
UV Exposure in the Water Column
In the water column, the calculated UV exposures continued to exhibit a distinct seasonality. For example, in December 2017, when incoming solar UV reached its annual minimum and UV was strongly attenuated in the water column, daily exposure of UV-B and UV-A at 1 m were less than 16 kJ m–2 d–1 (mean: 13.7 kJ m–2 d–1) and 820 kJ m–2 d–1 (mean: 724 kJ m–2 d–1), respectively (Figure 5 and Table 4). Below 4 m, daily exposure in December rarely exceeded 5 kJ m–2 d–1 (UV-B) and 500 kJ m–2 d–1 (UV-A), while at 10 m, UV-B was barely detectable (<1 kJ m–2 d–1) and UV-A generally was less than 300 kJ m–2 d–1 (Figure 5). In contrast, in July 2018, daily UV exposures in 10 m were on average 3.0 kJ m–2 d–1 (UV-B) and 555 kJ m–2 d–1 (UV-A), but we recorded exposures as high as 3.6 and 626 kJ m–2 d–1 for UV-B and UV-A, respectively, during that month (Table 4).
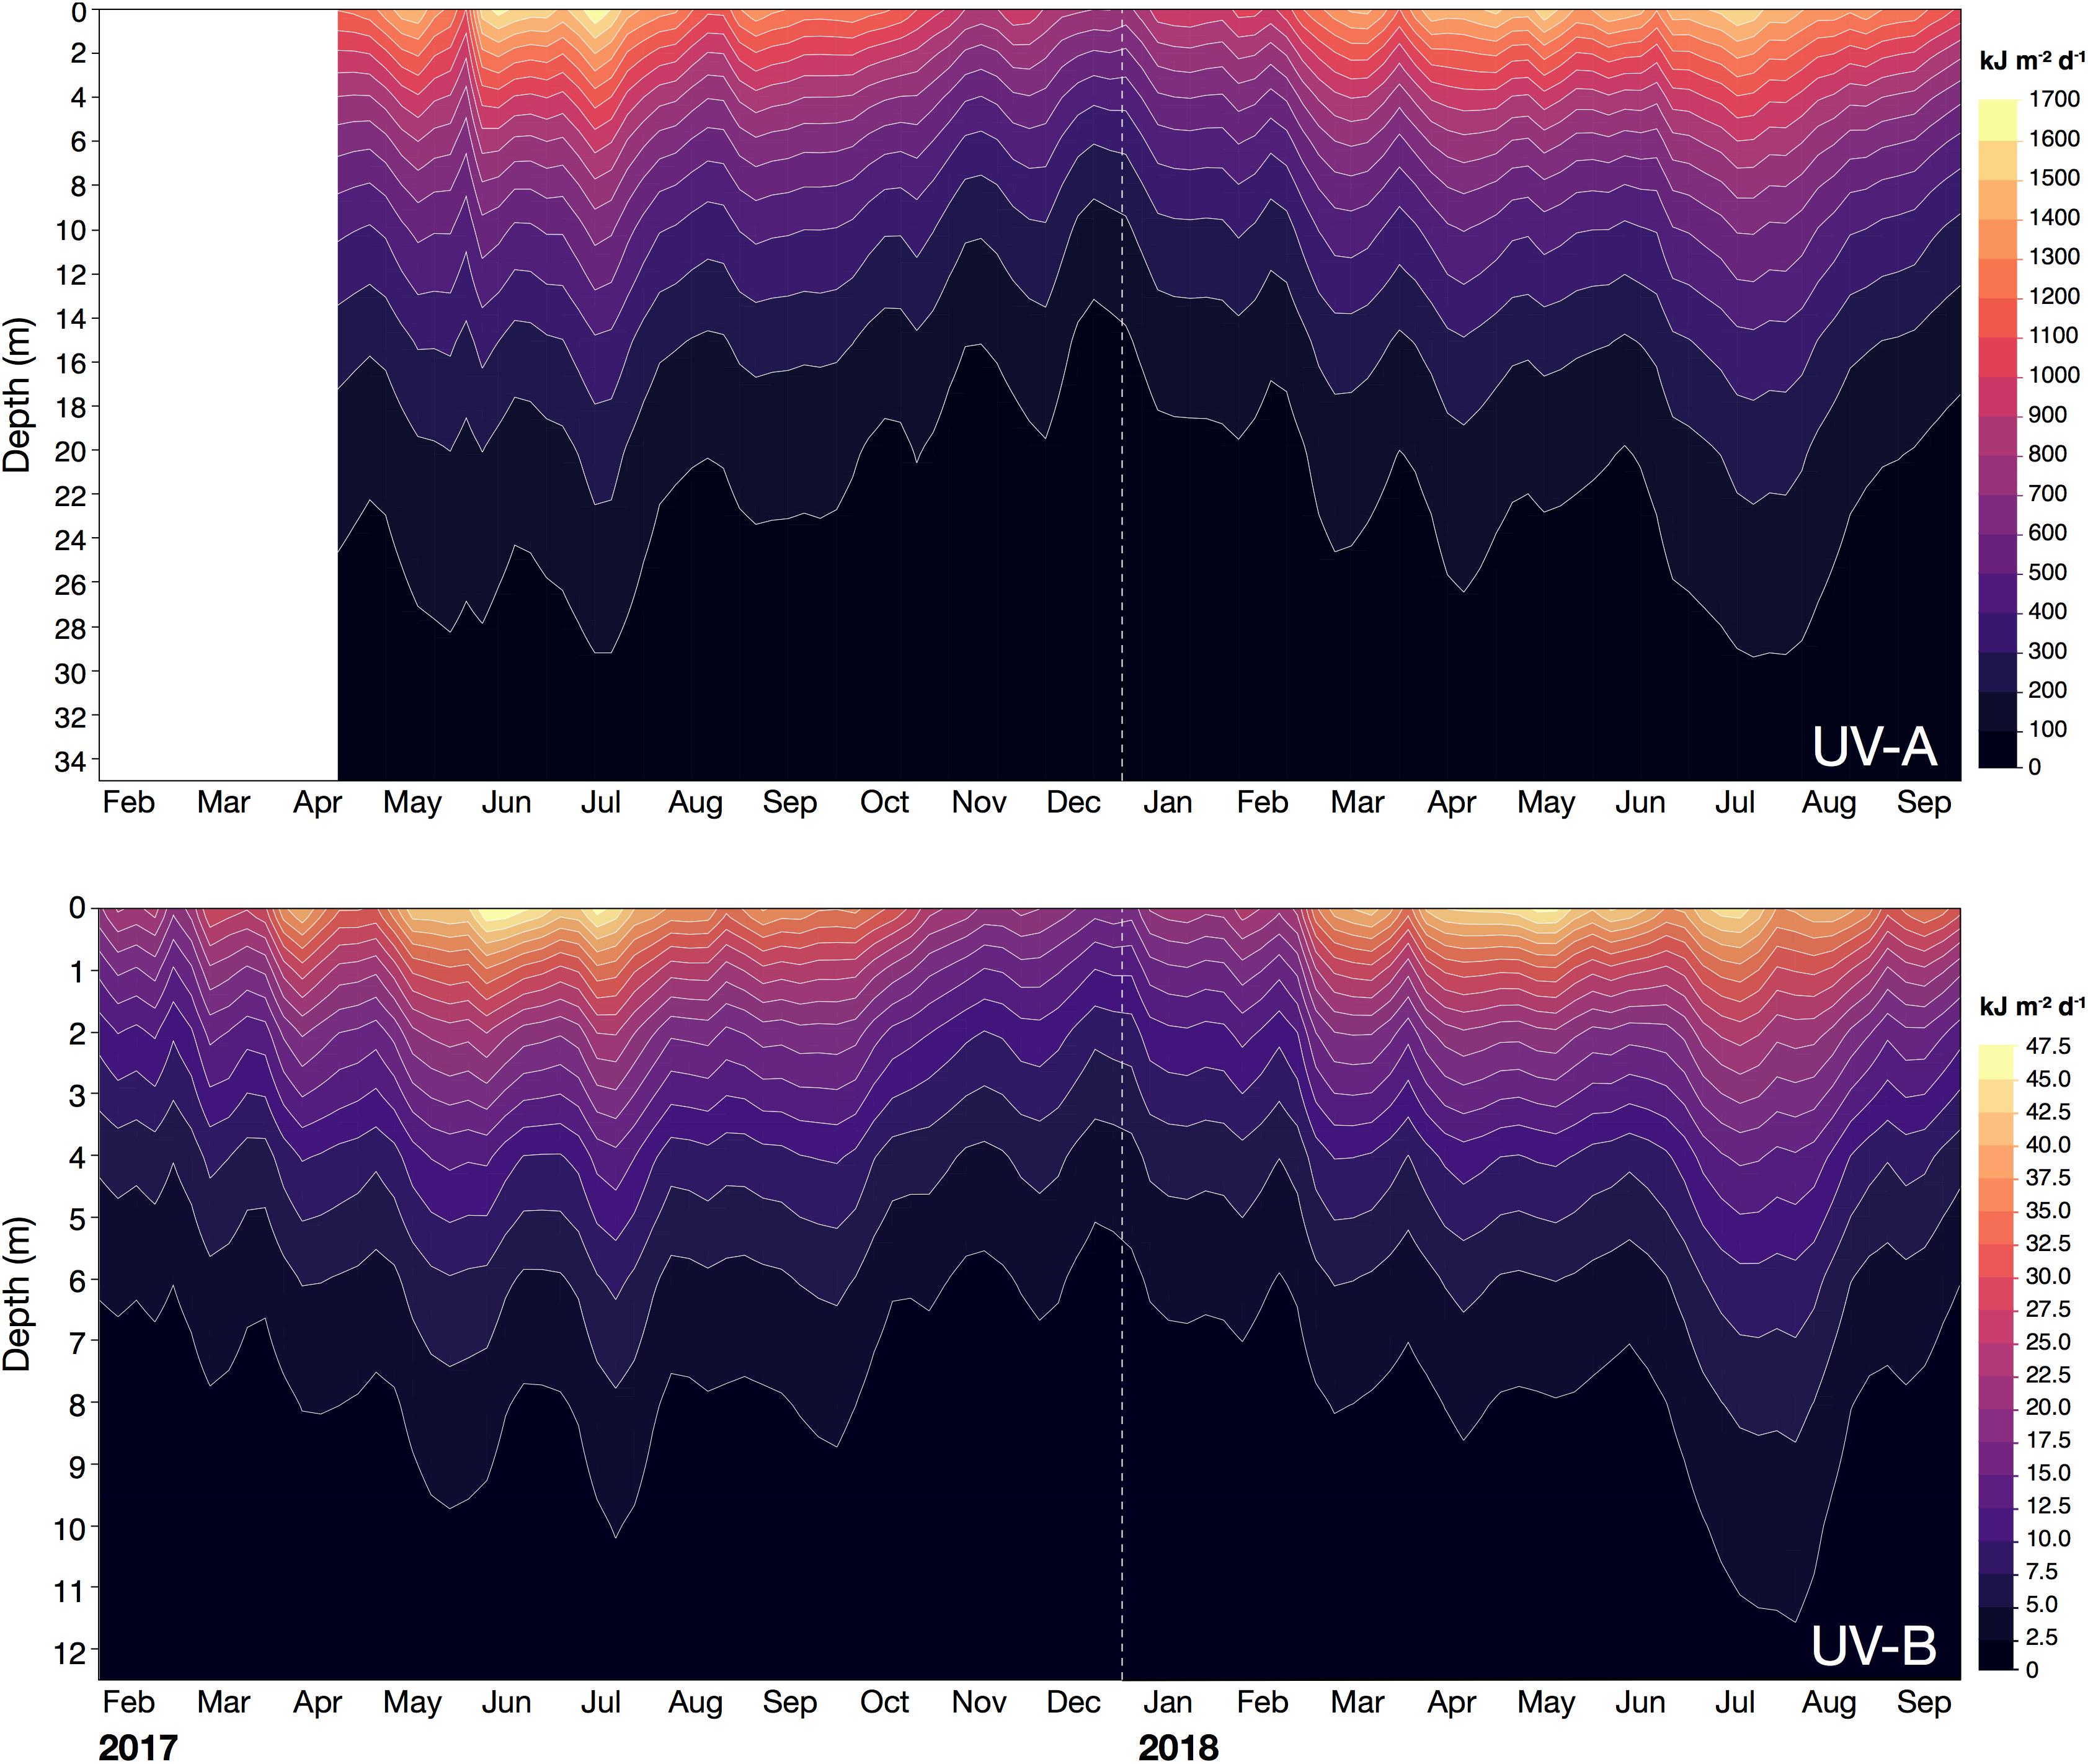
Figure 5. Daily exposure (kJ m– 2 d– 1) of UV-A (315–400 nm; upper panel) and UV-B radiation (280–315 nm; lower panel) received in the water column at the pelagic station (22.309333°N, 38.997389°E) off KAUST between February 2017 and September 2018. Contour lines were smoothed at a level of 0.025.
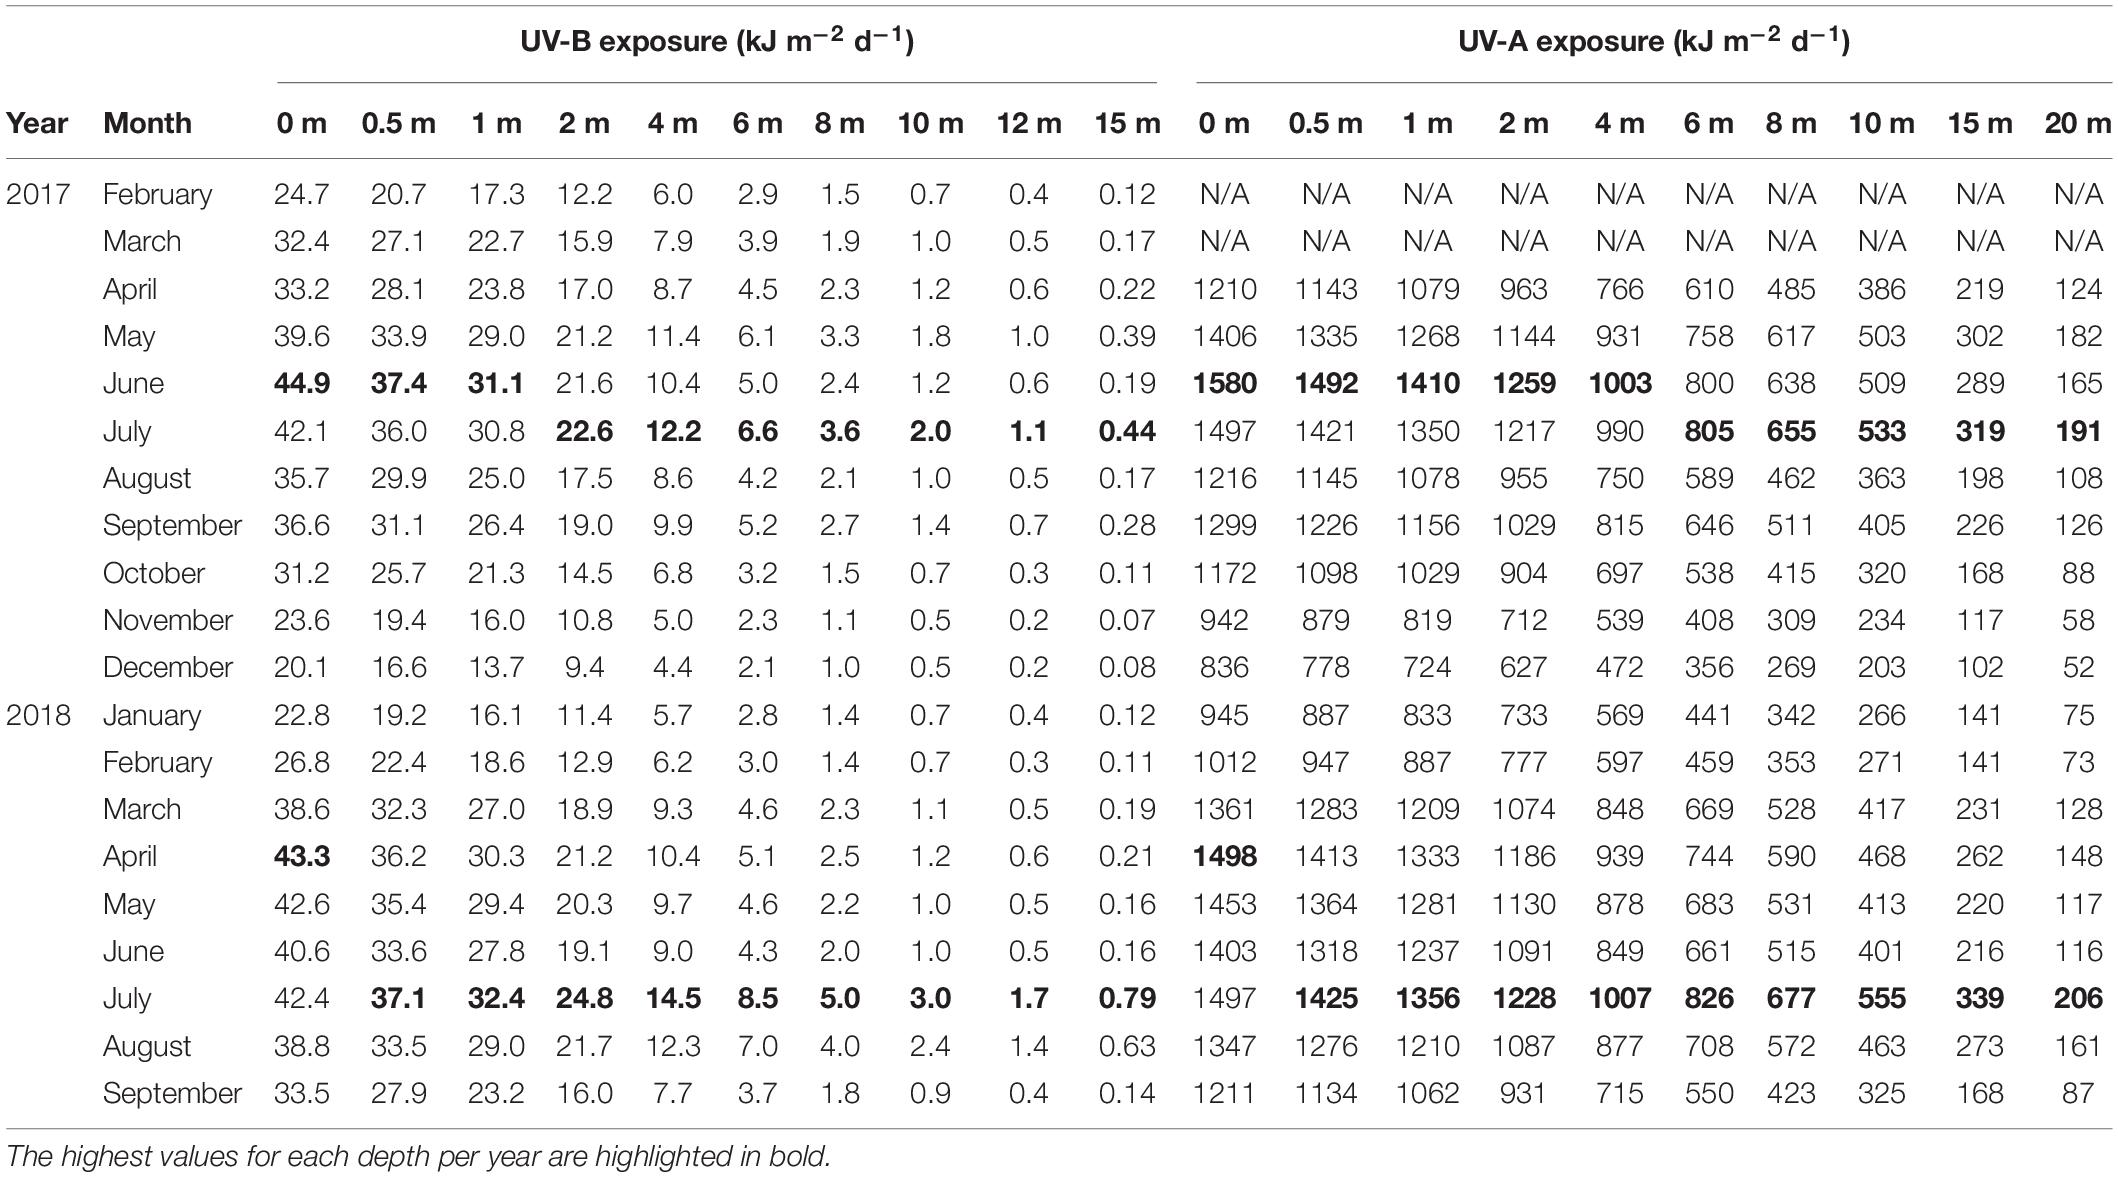
Table 4. Mean daily exposure of UV-B (280–315 nm) and UV-A (315–400 nm) received in different depths of the water column at the Red Sea pelagic sampling station (22.309333°N, 38.997389°E).
Additionally, in 2017, the highest average daily exposures at depths above 1 m (for UV-B) and 4 m (for UV-A) were present in June, but below those depths, average daily exposures reached their peak in July. In 2018, however, the maximum daily exposures at any depth were recorded in July (Table 4).
Relationship Between Kd, Chl-a and CDOM
We identified that the relationship between aCDOM at the six radiometrically studied UV wavelengths and Chl-a was significantly positive; however, both the correlation coefficient and regression slope generally decreased with increasing wavelength: 305 nm (y = 0.26x + 0.16, p < 0.01, R2 = 0.22), 313 nm (y = 0.20x + 0.13, p < 0.01, R2 = 0.24), 320 nm (y = 0.16x + 0.11, p < 0.01, R2 = 0.23), 340 nm (y = 0.10x + 0.08, p < 0.01, R2 = 0.23), 380 nm (y = 0.05x + 0.05, p < 0.05, R2 = 0.15) and 395 nm (y = 0.05x + 0.05, p < 0.05, R2 = 0.14) (Figure 6A).
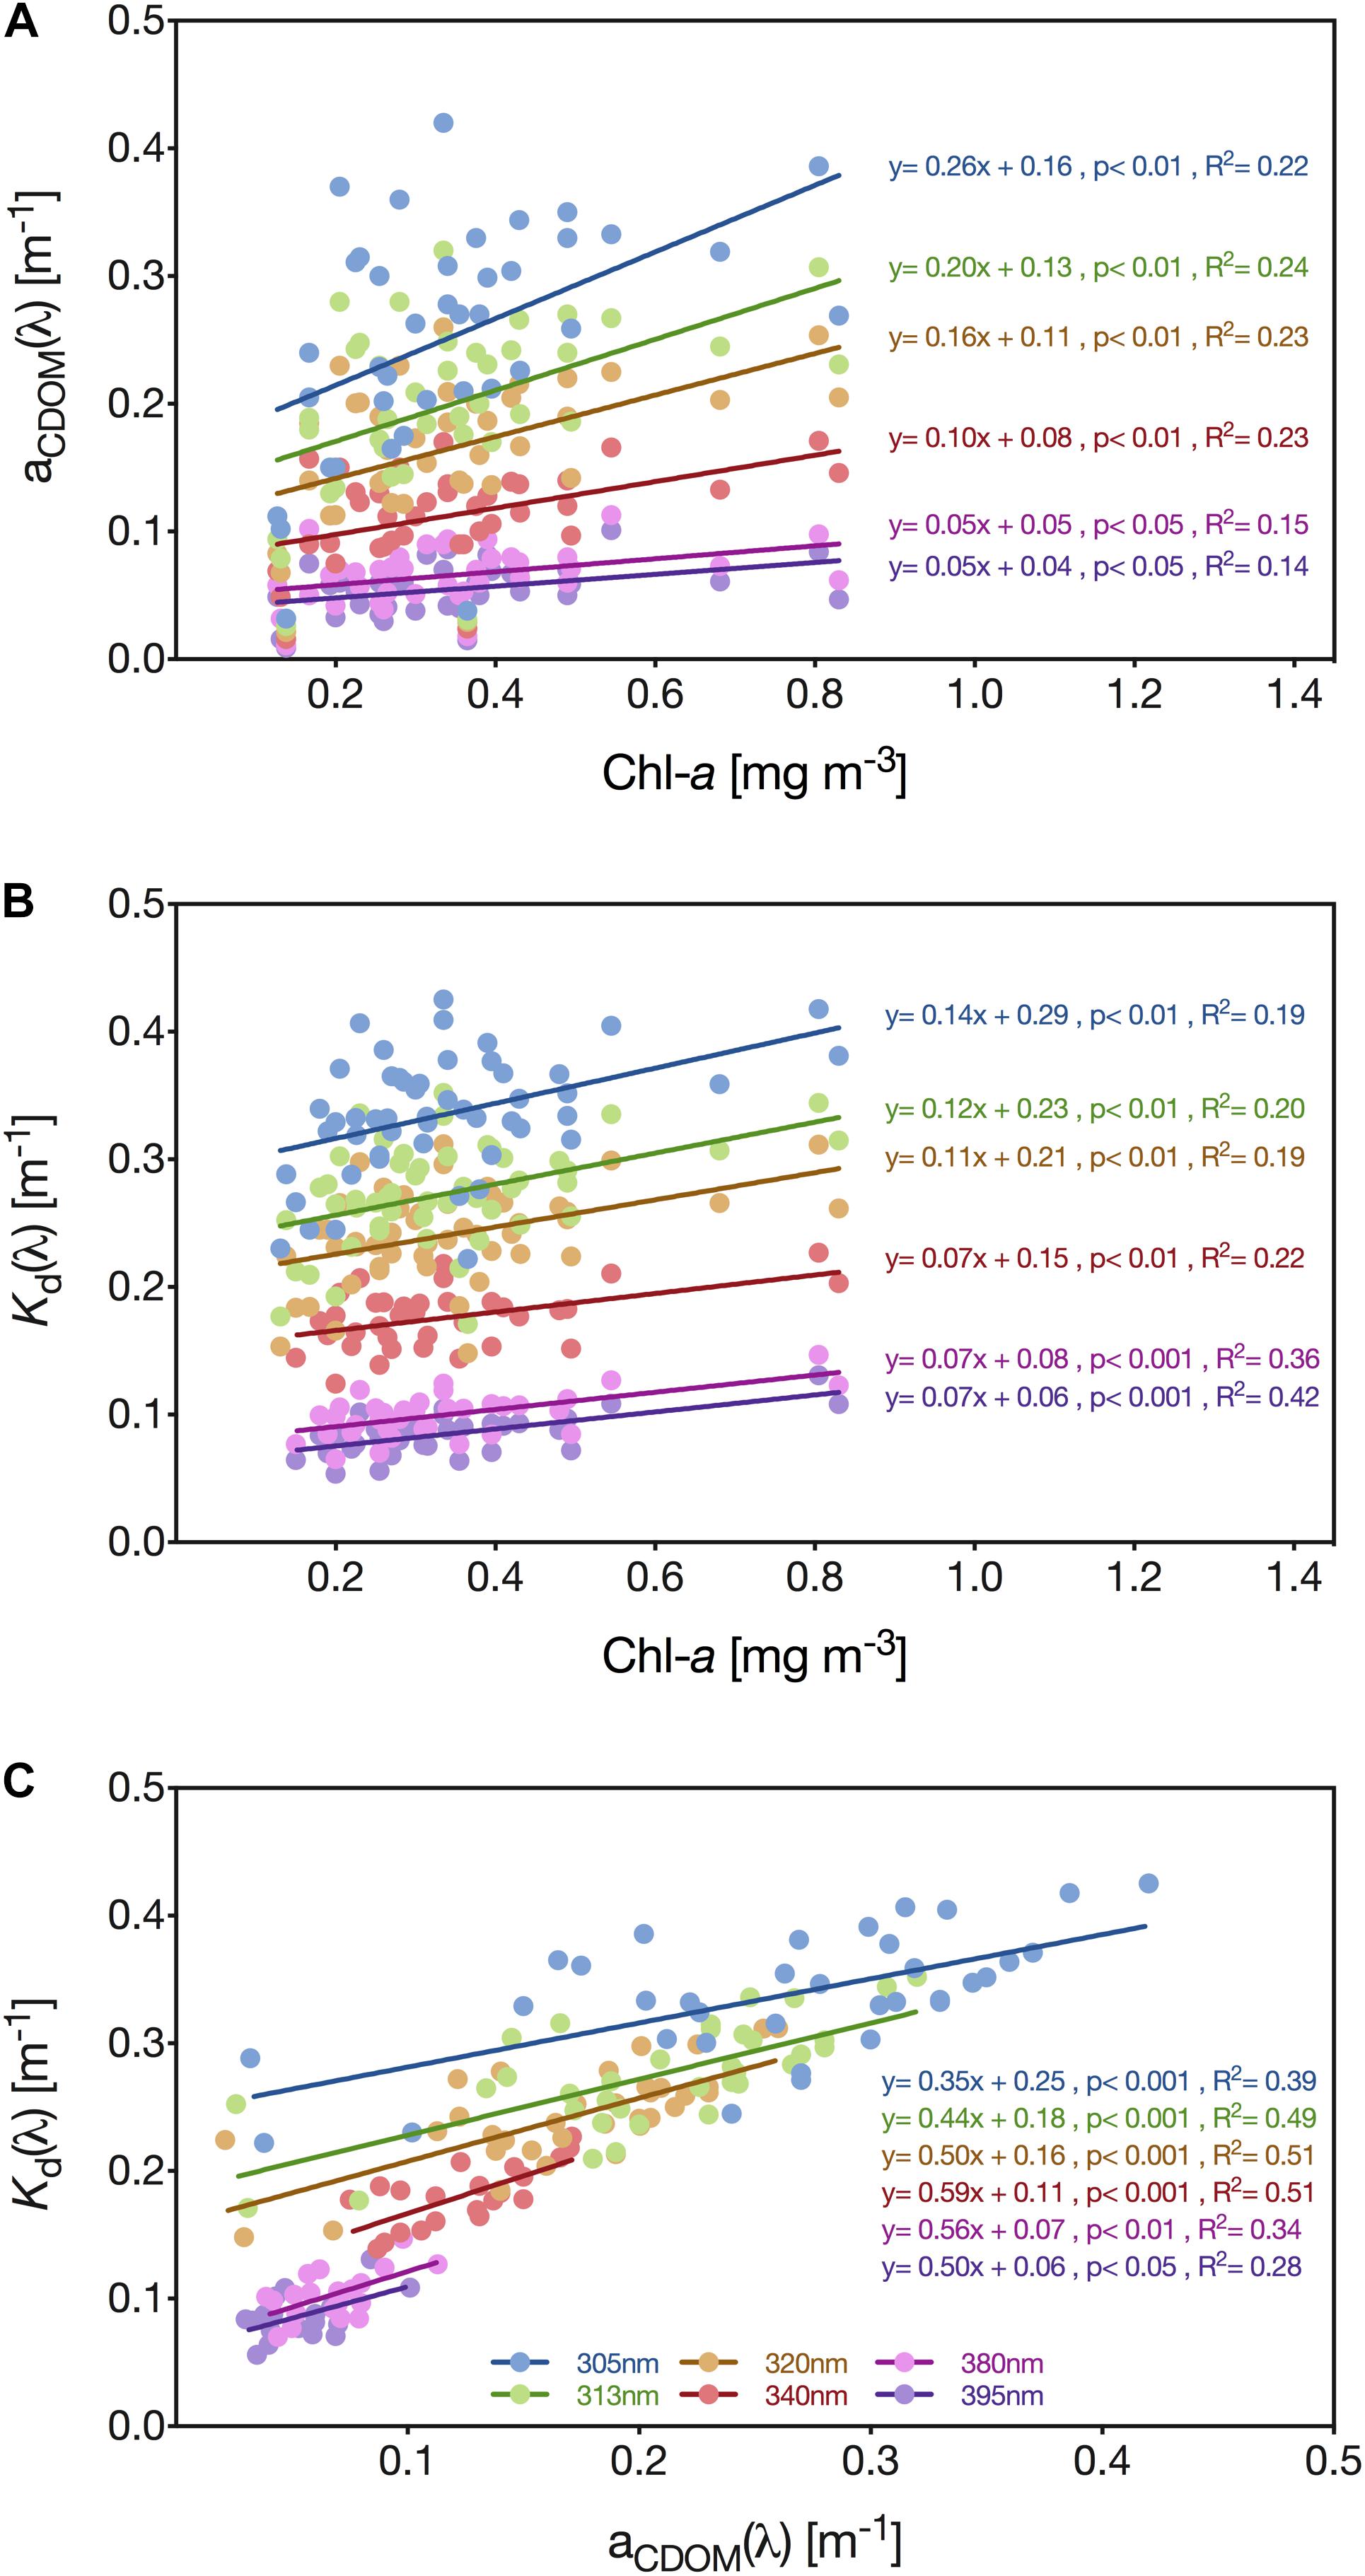
Figure 6. Linear regression analysis of the relationship between aCDOM(λ) and the concentration of Chl-a (A), the downwelling diffuse attenuation coefficient [Kd(λ)] and Chl-a concentration (B), and aCDOM(λ), and Kd(λ) and aCDOM(λ) (C) for the wavelengths 305 (blue circles), 313 (green circles), 320 (brown circles), 340 (red circles), 380 (pink circles), and 395 nm (purple circles). Solid lines represent linear regression lines.
Furthermore, we identified a significant positive linear relationship between the concentration of Chl-a and Kd for each of the analyzed wavelengths: 305 nm (y = 0.14x + 0.29, p < 0.01), 313 nm (y = 0.12x + 0.23, p < 0.01), 320 nm (y = 0.11x + 0.21, p < 0.01), 340 nm (y = 0.07x + 0.15, p < 0.01), 380 nm (y = 0.07x + 0.08, p < 0.001) and 395 nm (y = 0.07x + 0.06, p < 0.001) (Figure 6B). The correlation between Kd(λ) and the pigment concentration was generally low but gradually increased with increasing wavelength, while for the wavelengths 380 nm (R2 = 0.36) and 395 nm (R2 = 0.42) the correlation was even higher than for CDOM (Figures 6B,C).
In comparison, the correlation between Kd(λ) and aCDOM(λ) was moderately strong for 395 nm (R2 = 0.28), but reasonably high for the wavelengths 313 nm (R2 = 0.49), 320 nm (R2 = 0.51), and 340 nm (R2 = 0.51) (Figure 6C). Across all wavelengths, we identified a significant, positive linear relationship between aCDOM and Kd: 305 nm (y = 0.35x + 0.25, p < 0.001), 313 nm (y = 0.44x + 0.18, p < 0.001), 320 nm (y = 0.50x + 0.16, p < 0.001), 340 nm (y = 0.59x + 0.11, p < 0.001), 380 nm (y = 0.56x + 0.07, p < 0.01) and 395 nm (y = 0.50x + 0.06, p < 0.05) (Figure 6C).
Using a least squares multiple linear regression to predict Kd(320 nm) based on aCDOM(320) and Chl-a concentration data from the pelagic station revealed a significant regression equation [F(2,32) = 16.892], p < 0.0001), with an R2 of 0.514. However, of these two environmental parameters, only aCDOM(320) was found to be a significant predictor of the attenuation coefficient Kd(320 nm) (p < 0.001). The model prediction expression output was as follows:
Kd(320 nm) = 0.47307337∗aCDOM(320) + 0.01652723∗Chl-a conc. + 0.15587985 (4)
After using this model output to calculate the expected Kd(320 nm) for the reef waters, we performed a Student’s t-test, which identified that the Kd(320 nm) values of the reef (0.271 ± 0.031 m–1) were significantly higher than those of the pelagic site (0.238 ± 0.030 m–1) [t(64) = 4.34, p < 0.0001].
Variability of Present and Future Extreme Temperature and UV
We identified that during our study period, daily exposure of UV-B close to the surface (0.5 m depth) reached its annual maximum in late May, which was approximately 8 weeks before we observed the maximum SST (Figure 7, left panels). Further down the water column, we detected maximum UV-B exposure slightly later in the year (∼2 weeks later at 2 m depth) because the waters only reached their highest transparency to UV in late summer. Across all depths, extreme UV exposures (>20 kJ m–2 d–1) and temperatures (>31.1°C) coincided from the beginning of June. However, the duration of this concurrence was depth-dependent, i.e., lasting for 9 weeks at 0.5 and 1 m and for 6 weeks at 2 m depth (Figure 7, left panels).
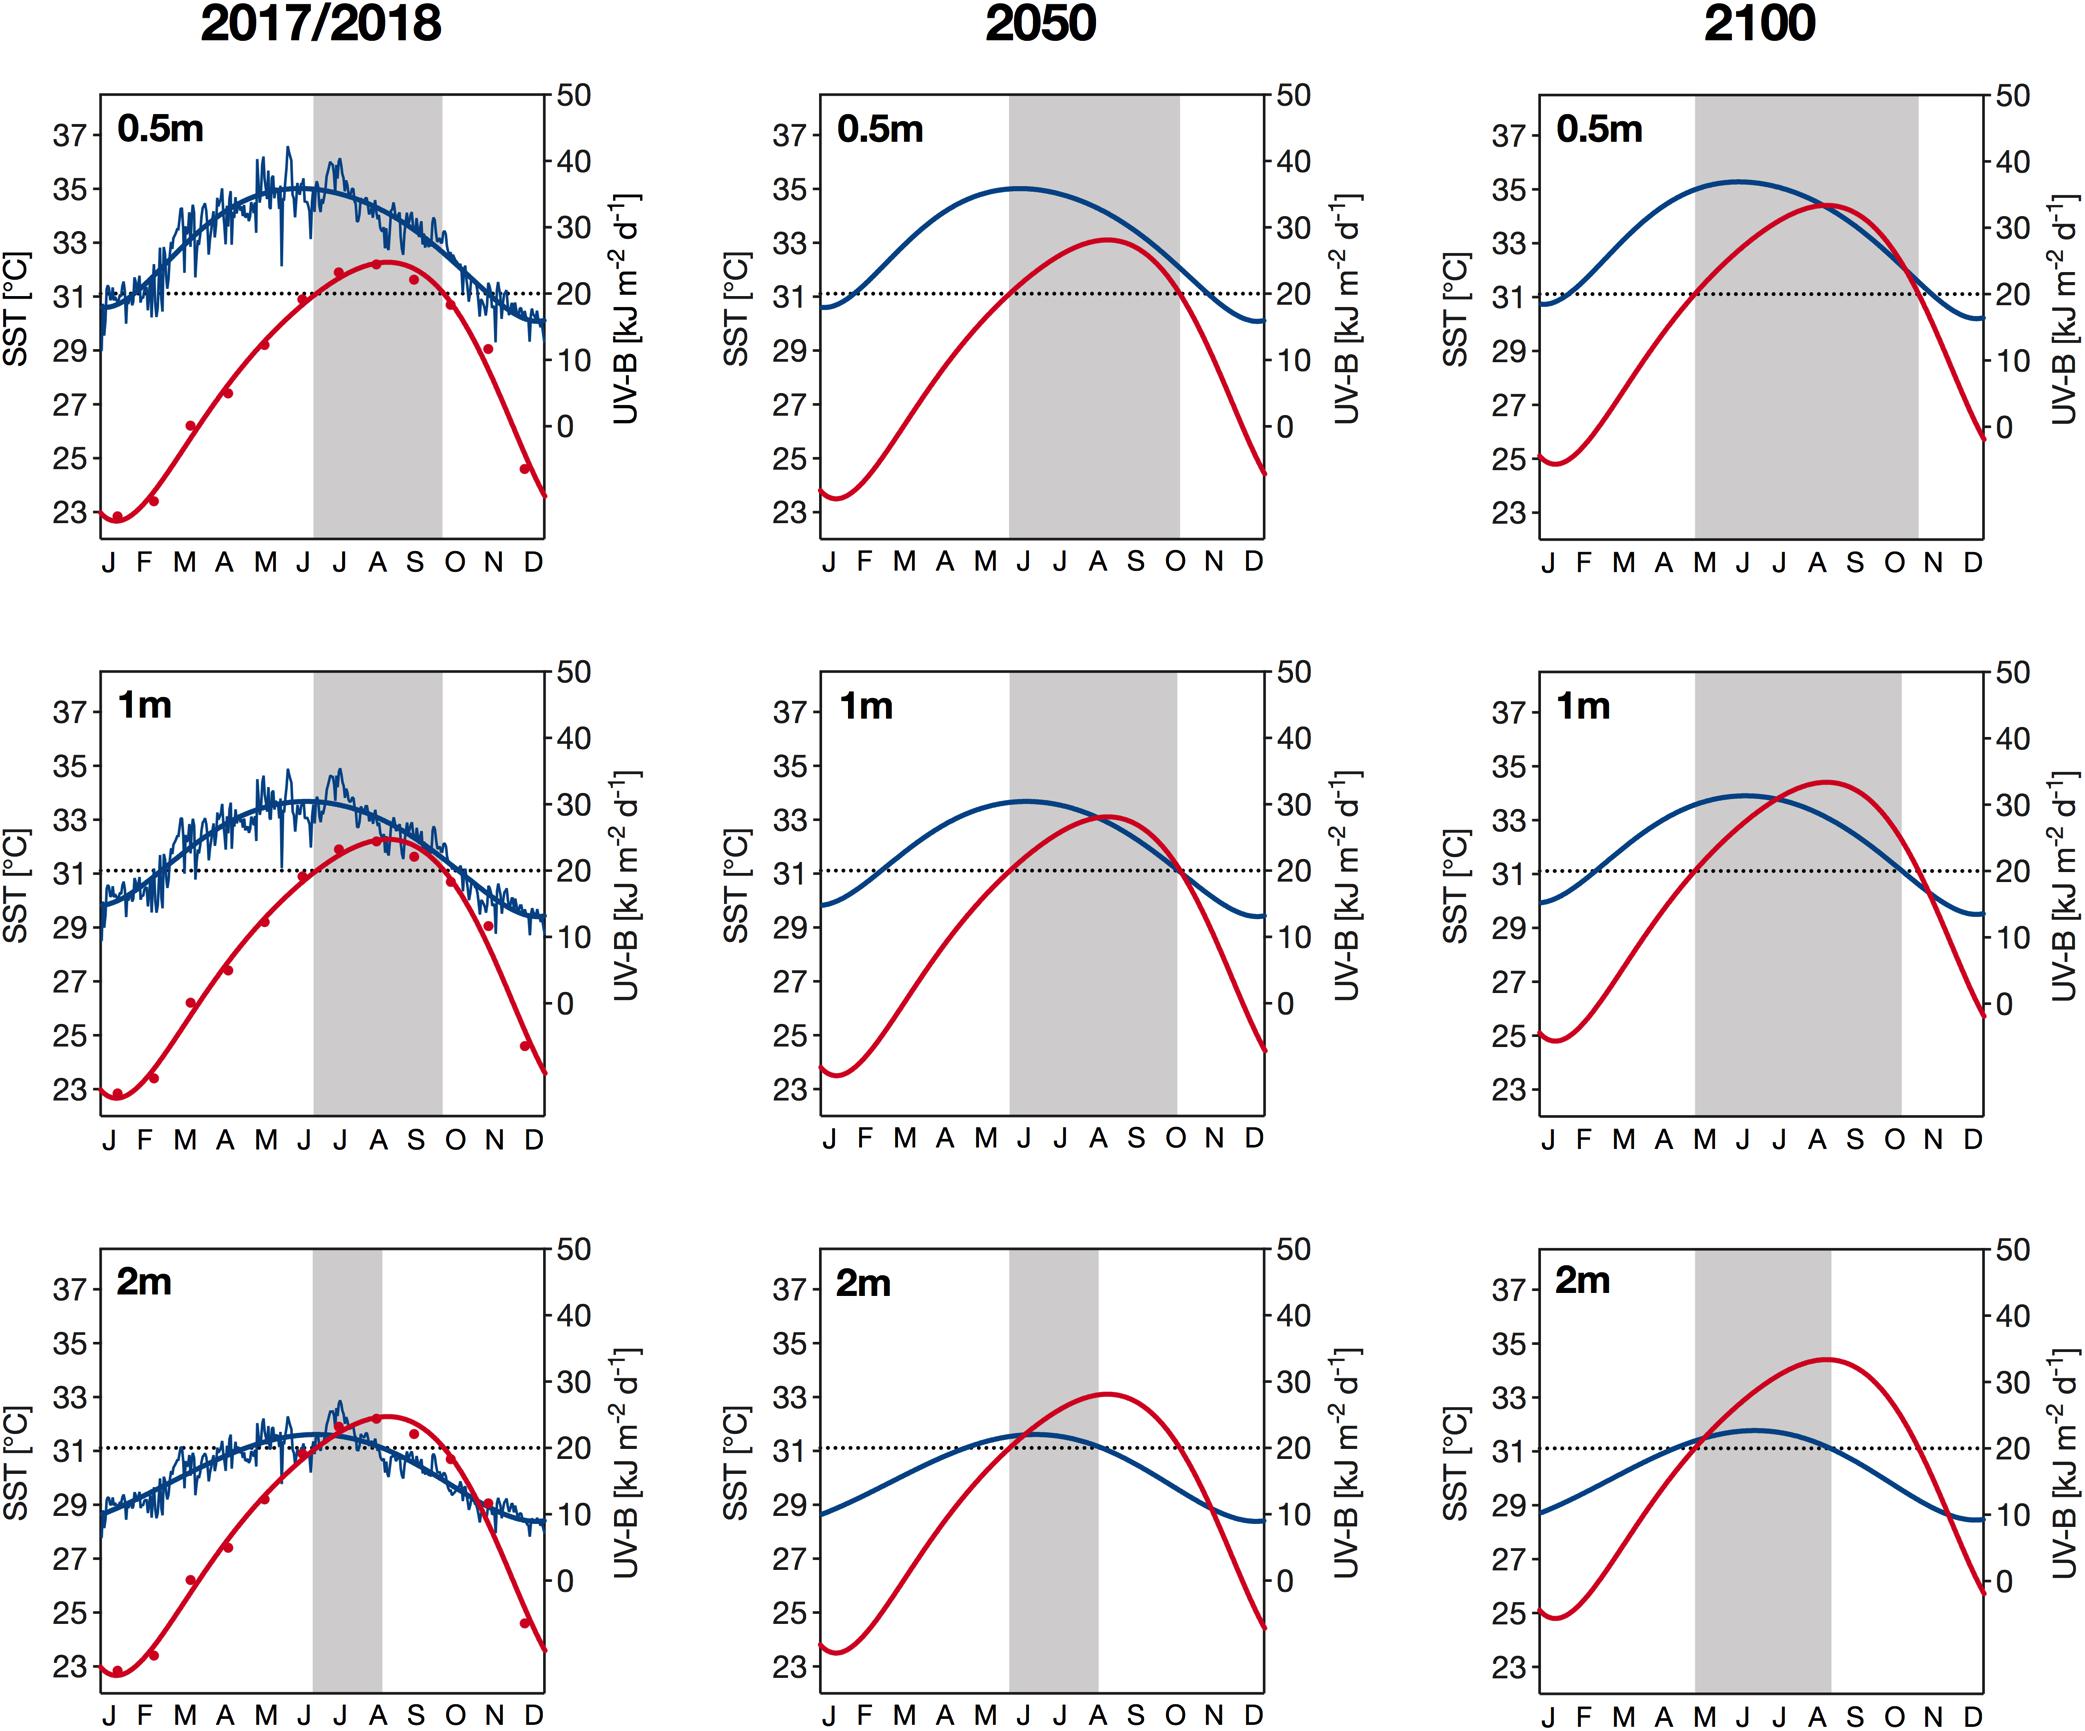
Figure 7. Current (years 2017/2018; left column) and projected (year 2050: middle column; year 2100: right column) sea surface temperatures (SST; in red) and daily UV-B exposure (280–315 nm) (in blue) at Al Fahal reef in 0.5m (top row), 1 m (middle row) and 2 m depth (bottom row). Current UV-B exposure are the daily means of exposure received in 2017 and 2018, while current temperature is shown as the monthly mean temperature during the same period. Thick lines represent sixth-order polynomial trendlines. Projected SST values were calculated based on an annual warming rate of 0.026°C, which is the mean of the two warming rates reported for the central Red Sea by Chaidez et al. (2017) and Osman et al. (2018). Daily UV-B exposure in 2050 are identical to current exposure, while exposure in 2100 are 3% higher, representing the projected increase of UV-B radiation in the tropics according to the latest future-UV radiation models (Bais et al., 2019; Meul et al., 2016). The dotted black line indicates (1) the threshold of severely damaging UV-B exposure (i.e., >20 kJ m– 2 d– 1) for corals (Zhou et al., 2016) and (2) the climatological maximum monthly mean (31.1°C) of the Jeddah region (Osman et al., 2018). Shaded areas indicate periods when both parameters exceed the aforementioned thresholds.
Using the intermediate Red Sea warming rate of the two rates reported by Chaidez et al. (2017) and Osman et al. (2018), we identified a potential SST increase of 0.8 and 2.1°C by 2050 and 2100, respectively, which means that mean SSTs in August could be as high as 33.0 and 34.3°C by 2050 and 2100, respectively (Figure 7, middle and right panels). Based on these projections, the extreme temperature threshold of 31.1°C, i.e., the climatological maximum monthly mean (Osman et al., 2018), would be exceeded earlier in the year. Consequently, extreme SSTs and UV-B exposures would likely start to coincide earlier in the year in the upcoming decades, by an estimated 3 weeks in 2050 and 5–6 weeks in 2100 (see shaded area in Figure 7). In addition to an earlier onset, the combination of extreme temperature and UV exposure will also likely terminate later in the year. Specifically, we found that by 2100, those extreme environmental conditions at 0.5, 1, and 2 m depth might cease an estimated 4, 3, and 2 weeks later, respectively, compared to the years 2017/2018. At shallower depths (<1.5 m), the stressor co-occurrence in autumn would end with the sudden decrease in temperature, whereas at 2 m depth, UV-B exposures would fall below damaging threshold levels first, followed by temperature. This stressor co-occurrence is a common feature that we identified for both present and future conditions.
Discussion
Our findings show a seasonal pattern in the attenuation of UV radiation in the Red Sea water column, with the lowest transparency to UV in spring (March/April) and the highest in late summer (August/September) when CDOM photobleaching processes were most active. Furthermore, our results indicate that the intra-annual variability in UV attenuation is larger than previously described and that the date on which organisms experience their annual maximum of daily UV exposure depends on their depth in the water column. Also, the timing and duration when extreme UV exposure and maximum temperatures coincide is strongly depth-dependent.
The coastal Red Sea site studied here was more transparent than expected from recent reports. For example, Overmans and Agusti (2019) calculated Kd(320 nm) values of 0.158 m–1 (October 2016) and 0.196 m–1 (August 2017) for a nearby sampling site (22.276000°N, 38.787694°E), whereas in the present study, Kd(320 nm) exhibited a much broader range of values (0.148–0.312 m–1), highlighting that the variability in UV attenuation has been underestimated to date. Equally, the same study by Overmans and Agusti (2019) reported that Z1%(320 nm) at this location varied from 23.5 to 29.0 m, whereas in the present study we calculated Z1%(320 nm) ranging from 14.7 to 31.0 m. Red Sea waters in the far north are still the most UV-transparent identified to date, with a Z1%(320 nm) maximum of 41.9 m (Overmans and Agusti, 2019). To put our results in a global context, we found that UV-A [Z10%(340 nm): 18 m] and UV-B [Z10%(305 nm): 10 m] wavelengths in the central Red Sea can reach depths similar to those reported for the highly transparent western Mediterranean Sea [Z10%(340 nm): 15–21 m; Z10%(305 nm): 10–11 m] (Llabres et al., 2010; Sempere et al., 2015), but not as deep as in oceanic waters such as the central subtropical Atlantic Ocean [Z10%(340 nm): 35 m; Z10%(305 nm): 16 m], the Gulf of Mexico [Z10%(340 nm): 37 m; Z10%(305 nm): 13 m] or the exceptionally transparent South Pacific Gyre [Z10%(340 nm): 59.0 m; Z10%(305 nm): 27.7 m] (Weinbauer et al., 1997; Obernosterer et al., 2001; Tedetti and Sempere, 2006; Tedetti et al., 2007).
Regarding UV exposure received in the Red Sea region, our study identified that daily exposure of atmospheric UV reached their maxima in June, with values of 57 and 1952 kJ m–2 d–1 for UV-B and UV-A, respectively. In comparison, Adam (2015) reported an annual mean UV-B exposure of 57 kJ m–2 d–1 and a maximum exposure of 84 kJ m–2 d–1 (June) for the Egyptian city of Qena located 200 km from the central Red Sea coast. Furthermore, maximum daily UV-B and UV-A exposures of approximately 85 and 1540 kJ m–2 d–1, respectively, have been reported for the Gulf of Aqaba in the far north of the Red Sea (Dishon et al., 2012). However, Dishon et al. (2012) chose 320 nm as the upper boundary of the UV-B spectrum as compared to 315 nm in the present study, which explains the significant discrepancy between the annual maxima of UV-B exposures. If we compare the annual maxima of daily exposure for the UV spectrum as a whole (280–400 nm), we find that the maximum daily UV exposure during summer in the lower-latitude central Red Sea (2010 kJ m–2 d–1) is approximately 24% higher than those observed in the Gulf of Aqaba (1625 kJ m–2 d–1).
Regarding in situ UV conditions, Dishon et al. (2012) identified that maximum UV (280–400 nm) exposure in the water column occurred in September with daily exposure of approximately 1080, 640, and 286 kJ m–2 d–1 in 5, 15, and 30 m depth, respectively. In contrast, we found that daily exposure of total UV was on average highest in July, with mean daily UV exposures of 923, 340, and 77 kJ m–2 d–1 in 5, 15, and 30 m, respectively. However, UV exposure at the aforementioned depths reached absolute maxima of 1103 (on 3rd June 2017), 407 (10th July 2017) and 106 kJ m–2 d–1 (28th May 2017), respectively. While the maximum exposure we recorded at 5 m depth slightly exceeds the value reported for the Gulf of Aqaba, the exposures at 10 and 15 m were substantially higher than in our study. In a global context, the UV intensities reported here for the Red Sea are exceptionally high. For example, a study by Downs et al. (2013) investigating UV-B (280–320 nm) exposure in a fringing coral reef in southern Queensland reported that daily exposure at a mean daylight water depth of 1.60 m reached a maximum of approximately 11 kJ m–2 d–1 during the austral spring in September 2010 (i.e., at the onset of the strong 2010–2012 La Niña event). Since the La Niña event impacted the water turbidity, a further study by the same authors found that UV-B (290–315 nm) exposure in a turbid inshore reef after the event were <21.13 kJ m–2 d–1 during peak summer exposure conditions (Downs et al., 2016), which represents a drastic increase in UV-B exposure, especially given the different definitions of the UV-B spectrum between the two studies (i.e., 280–320 nm vs. 290–315 nm). However, the reported maximum exposure of 21.13 kJ m–2 d–1 is still considerably lower than the maximum UV-B exposure of 31.4 kJ m–2 d–1 at 1.60 m depth at our pelagic study site in the Red Sea. Although we did not directly determine daily UV exposure nor the attenuation of UV radiation at our mid-shore coral reef sampling site, our data evidenced that the inshore side of the reef was characterized by consistently higher absorption by CDOM [e.g., aCDOM(320): 0.236 ± 0.065 m–1] than the open-water station [aCDOM(320): 0.162 ± 0.060 m–1], caused by the greater organic matter production of reef organisms. In contrast, the concentration of Chl-a in the reef waters (0.20 ± 0.08 mg m–3) was lower than at the pelagic site (Chl-a: 0.35 ± 0.15 mg m–3), likely due to the efficient removal of phytoplankton by benthic filter feeders (Yahel et al., 1998; Richter et al., 2001; van Duyl et al., 2002). Additionally, both sites showed high values of aCDOM(254/365) (Pelagic: 12.4 ± 3.3 m–1; Reef: 8.4 ± 2.2 m–1) and the slope ratio SR [i.e., S(275–295)/S(350–400)] (Pelagic: 3.32 ± 1.83; Reef: 2.97 ± 1.64), evidencing that photobleaching is occurring at high rates throughout the year and that the bulk of CDOM is of low molecular weight (Helms et al., 2008; Berggren et al., 2010). In comparison, Romera-Castillo et al. (2013) reported a higher annual mean aCDOM(254/365) (14.8 ± 0.6 m–1) but a lower SR (2.02 ± 0.05) for a coastal site in the oligotrophic, north-western Mediterranean Sea. Furthermore, a recent study by Iuculano et al. (2019) investigating the CDOM properties of the oligotrophic oceans found that the aCDOM(254/365) ratio varied considerably among the biogeographic provinces of the ocean, from the lowest mean of 10 (IQR, 6–13) in the North Pacific to the highest mean of 32 (IQR, 24–37) in the North Atlantic tropical gyre, which puts our aCDOM(254/365) values for the Red Sea close to the lower end of the range. The same study by Iuculano et al. (2019) also found that the UV spectral slope S(275–295) ranged from 30.0 μm–1 (IQR, 23.5–35.5 μm–1) in the North Pacific to 47.2 μm–1 (IQR, 41.3–53.1 μm–1) in the Indian South subtropical gyre. For our Red Sea study sites, we calculated intermediate mean values of 34.4 ± 8.2 μm–1 for the pelagic site and 30.5 ± 6.2 μm–1 for the reef, suggesting that the CDOM present in the reef waters is of higher molecular weight.
Although we could not directly measure UV attenuation with the profiling radiometer in the Red Sea reef due to the shallow water depth (<2 m), we expect Kd values of the reef waters to be higher than those of the pelagic site for short UV wavelengths because of the higher absorption by CDOM at the reef, while the lower Chl-a concentrations in the reef waters would suggest the opposite. The multiple regression of our aCDOM and Chl-a data from the pelagic station, using 320 nm as a representative wavelength of the UV spectrum, indeed revealed a higher predicted attenuation of UV wavelengths at the reef [Kd(320 nm): 0.271 ± 0.031 m–1)] than at the pelagic site (0.238 ± 0.030 m–1). However, the reef itself and the surrounding area are characterized by a light-colored substrate, which can potentially reflect a large proportion of the downwelling solar radiation (Joyce and Phinn, 2003; Wangpraseurt et al., 2014) and thereby increase UV exposure. Therefore, it is still uncertain how UV exposure at the shallow reef site compares to the exposure conditions in the same depth at the pelagic site.
Nevertheless, the maximum daily UV exposures calculated for the central Red Sea in the present study were substantially higher than those reported by Downs et al. (2013) for the Australian reef. Hence, we can assume that Red Sea organisms living in shallow waters experience high levels of UV-induced stress. Several reports from the Red Sea have confirmed the severe impacts of UV radiation on key Red Sea biota. Al-Aidaroos et al. (2015) found increased mortality rates in ten different zooplankton taxa in response to natural UV-B exposure intensities comparable to those received in situ at ∼3.5 m depth, while a study by Boelen et al. (2002) reported UV-induced DNA damage in natural communities of bacterio- and phytoplankton from the surface down to a depth of 50 m. For Red Sea corallimorpharians, UV exposure induces a reduction in the concentration of chlorophyll pigments as well as the abundance of endosymbionts living in association with Rhodactis rhodostoma, while exposure to UV causes Discosoma unguja to physically migrate away from exposed locations toward shaded habitats in order to avoid UV damage (Kuguru et al., 2010). For other anthozoans in the Red Sea, such as soft corals, a decreased survival rate in response to combined UV-B (0.8 W m–2) and UV-A (3.0 W m–2) exposure has been reported during the early developmental stages of Heteroxenia fuscescens and Rhytisma fulvum fulvum (Zeevi Ben-Yosef and Benayahu, 2008).
Despite their importance for the region, no studies to date have investigated the sensitivity of Red Sea scleractinian corals to UV radiation. A study by Bellworthy and Fine (2017) reported that the corals Stylophora pistillata and Acropora eurystoma from the Gulf of Aqaba exhibited a high sensitivity to intense solar radiation, yet the authors could not distinguish whether the observed photoinhibition and reduction in symbiont density was due to intense PAR, UVR, or a combination of the two. For the central and southern Red Sea where incident UV exposure is higher than in the northern part of the basin, no studies to date have investigated the sensitivity of corals to solar radiation. Further studies on the impact of UV on corals in areas that are already prone to thermally induced coral bleaching events are critical. In contrast, the northern part of the Red Sea basin has been termed a thermal refuge for corals due to the much lower SSTs relative to the rest of the region (Fine et al., 2013; Osman et al., 2018).
The interplay between temperature and UV stress in the context of coral bleaching is not yet fully understood. However, several studies have suggested that intense UV radiation not only has direct detrimental effects on the physiology and molecular compartments of corals but also acts as an interactive factor that further intensifies thermally induced damage and bleaching in corals worldwide (Gleason and Wellington, 1993; Drollet et al., 1995; Ferrier-Pages et al., 2007; Torregiani and Lesser, 2007; Banaszak and Lesser, 2009; Lesser, 2010). Specifically, Lesser and Farrell (2004) identified that the additional stress caused by exposure to intense UV radiation reduces the bleaching threshold temperature and the number of degree heating weeks (DHWs) required to induce coral bleaching. For the region of our study sites (Jeddah region), a recent study reported a bleaching threshold temperature of 32.1°C (Osman et al., 2018), which we found was frequently exceeded in late summer. During late summer, incident UV exposure were still moderately high; however, we detected that the annual peak intensity occurred several weeks prior. Generally, in the upper meters of the water column (<∼1.5 m), the time of maximum UV exposure (May/June) occurred before that of maximum SST (July/August) (Figure 7), which may presently provide sessile benthic organisms such as corals a means of protection. Further down the water column, however, maximum water temperatures and peak UV exposure coincided in July/August, since the highest transparency to UV occurred in late summer. However, the UV exposure in those depths was substantially lower and UV-induced damage was not as pronounced as in shallower depths. Alarmingly, we have found that in the future, due to the steady increase in SST as a consequence of global climate change, bleaching threshold temperatures will likely be exceeded earlier in the year. As a consequence, the current time gap between the annual extreme of UV and the time when the bleaching threshold temperature is reached will gradually decrease, and thus the two abiotic stressors are more likely to coincide during early summer in the future. This holds especially true if the Red Sea continues to warm at the rapid rate recently reported for the region (Chaidez et al., 2017; Osman et al., 2018) that could result in a temperature change of ∼2°C by 2100 relative to the 1986–2005 period, which is in between the moderate (RCP4.5: ΔT 1.8°C) and high (RCP 6.0: ΔT 2.2°C) IPCC emission scenario (IPCC, 2014). Our predictions are, however, restrained as we did not consider the effect of warming on declining Chl-a concentrations (Behrenfeld et al., 2006; Boyce et al., 2014) that could result in future increases in water transparency, thereby enhancing underwater UV exposure.
It should also be noted that different biological processes are differentially affected by changes in Kd or the depletion of total column ozone (TCO) since certain UV wavelengths target specific molecular responses. For example, the action spectra for erythema (McKinlay and Diffey, 1987) and UV-induced DNA damage (Setlow, 1974) are heavily weighted toward short-waved UV-B, while the action spectrum for photosynthesis-related impacts extends far into the UV-A range (Cullen et al., 1992; Lesser and Lewis, 1996). Zepp et al. (2008) have found that a 30% decrease in the Kd of the Florida Keys’ water column would result in an equal reduction in the photosynthetic activity in 3 m depth whereas the presence of DNA damage could be enhanced by as much as ∼100%. Similarly, while a 5% decrease in stratospheric ozone could cause a 10% increase in DNA-weighted UV doses, photosynthesis-weighted UV doses would be less impacted since ozone depletion does not affect wavelengths > 330 nm (Cutchis, 1974). These findings highlight the importance of applying biological weighting functions when trying to determine the impacts of increased UV-B exposure on a specific organismal compartment or process rather than an organism as a whole.
Conclusion
In conclusion, we identified that the central Red Sea coast exhibits exceptionally high transparency to UV radiation compared to other coastal waters due to negligible inputs of terrestrial CDOM. In addition, we observed a seasonal pattern of transparency to UV governed by the seasonality of Chl-a (i.e., phytoplankton), and the generation and photodegradation of CDOM present in the water column. The Red Sea region experiences high UV radiation for most of the year. However, we identified that maximum incident irradiance does not co-occur at the same time when waters are at their most transparent and reach maximum temperatures. This implies that Red Sea organisms close to the surface experience extreme UV exposure earlier in the year than organisms living at greater depths in the water column, where two abiotic stresses (i.e., extreme UV and temperature) reach their maximum in late summer, even though UV radiation is only at moderately high levels. However, if SSTs continue to increase steadily as a consequence of climate change, bleaching threshold temperatures will be reached earlier in the year and hence will coincide with extreme UV radiation in shallower areas of the reef, which could potentially increase the frequency of coral bleaching events in the near future.
Data Availability Statement
The datasets generated as part of this study can be found in the data repository Mendeley Data (http://dx.doi.org/10.17632/9rdfbfctm7.1).
Author Contributions
SA conceptualized the study and directed the time series project. SO collected and processed the optical data and water samples, generated the tables and figures. SO and SA analyzed the data. SO wrote the manuscript with a substantial contribution from SA.
Funding
The research reported in this publication was supported by baseline funding from KAUST to SA under award number BAS/1/1072-01-01.
Conflict of Interest
The authors declare that the research was conducted in the absence of any commercial or financial relationships that could be construed as a potential conflict of interest.
Acknowledgments
We would like to express special thanks to Juan Martinez-Ayala, Cecilia Martin and Katherine Rowe of the Red Sea Research Center (RSRC) at King Abdullah University of Science and Technology (KAUST), and the team of the Coastal and Marine Resources Core Lab (CMOR) at KAUST for their expert support and assistance during the fieldwork.
References
Acker, J., Leptoukh, G., Shen, S., Zhu, T., and Kempler, S. (2008). Remotely-sensed chlorophyll a observations of the northern Red Sea indicate seasonal variability and influence of coastal reefs. J. Mar. Syst. 69, 191–204. doi: 10.1016/j.jmarsys.2005.12.006
Adam, M. E. (2015). Determination of daily total ultraviolet-B in a subtropical region (Upper Egypt): an empirical approach. Atmos. Res. 153, 1–9. doi: 10.1016/j.atmosres.2014.07.025
Al-Aidaroos, A. M., El-Sherbiny, M. M. O., Satheesh, S., Mantha, G., Agusti, S., Carreja, B., et al. (2015). Strong sensitivity of red sea zooplankton to UV-B radiation. Estuaries Coast. 38, 846–853. doi: 10.1007/s12237-014-9868-4
Ayres-Ostrock, L. M., and Plastino, E. M. (2014). Effects of UV-B radiation on growth rates, pigment content and ultrastructure of red (wild type), greenish-brown and green strains of Gracilaria birdiae (Gracilariales, Rhodophyta). Eur. J. Phycol. 49, 197–212. doi: 10.1080/09670262.2014.904931
Babin, M., Stramski, D., Ferrari, G. M., Claustre, H., Bricaud, A., Obolensky, G., et al. (2003). Variations in the light absorption coefficients of phytoplankton, nonalgal particles, and dissolved organic matter in coastal waters around Europe. J. Geophys. Res. Oceans 108, 1–18.
Bais, A. F., Bernhard, G., McKenzie, R. L., Aucamp, P. J., Young, P. J., Ilyas, M., et al. (2019). Ozone-climate interactions and effects on solar ultraviolet radiation. Photochem. Photobiol. Sci. 18, 602–640. doi: 10.1039/c8pp90059k
Bais, A. F., Tourpali, K., Kazantzidis, A., Akiyoshi, H., Bekki, S., Braesicke, P., et al. (2011). Projections of UV radiation changes in the 21st century: impact of ozone recovery and cloud effects. Atmos. Chem. Phys. 11, 7533–7545. doi: 10.5194/acp-11-7533-2011
Banaszak, A. T., and Lesser, M. P. (2009). Effects of solar ultraviolet radiation on coral reef organisms. Photochem. Photobiol. Sci. 8, 1276–1294. doi: 10.1039/b902763g
Barron, M. G. (2017). Photoenhanced toxicity of petroleum to aquatic invertebrates and fish. Arch. Environ. Contam. Toxicol. 73, 40–46. doi: 10.1007/s00244-016-0360-y
Behrenfeld, M. J., O’Malley, R. T., Siegel, D. A., McClain, C. R., Sarmiento, J. L., Feldman, G. C., et al. (2006). Climate-driven trends in contemporary ocean productivity. Nature 444, 752–755. doi: 10.1038/nature05317
Bellworthy, J., and Fine, M. (2017). Beyond peak summer temperatures, branching corals in the Gulf of Aqaba are resilient to thermal stress but sensitive to high light. Coral Reefs 36, 1071–1082. doi: 10.1007/s00338-017-1598-1
Berggren, M., Laudon, H., Haei, M., Strom, L., and Jansson, M. (2010). Efficient aquatic bacterial metabolism of dissolved low-molecular-weight compounds from terrestrial sources. ISME J. 4, 408–416. doi: 10.1038/ismej.2009.120
Boelen, P., Post, A. F., Veldhuis, M. J., and Buma, A. G. (2002). Diel patterns of UVBR-induced DNA damage in picoplankton size fractions from the Gulf of Aqaba, Red Sea. Microb. Ecol. 44, 164–174. doi: 10.1007/s00248-002-1002-7
Boyce, D. G., Dowd, M., Lewis, M. R., and Worm, B. (2014). Estimating global chlorophyll changes over the past century. Prog. Oceanogr. 122, 163–173. doi: 10.1016/j.pocean.2014.01.004
Bricaud, A., Morel, A., and Prieur, L. (1981). Absorption by dissolved organic-matter of the sea (Yellow Substance) in the Uv and visible domains. Limnol. Oceanogr. 26, 43–53. doi: 10.4319/lo.1981.26.1.0043
Buck, B. H., Rosenthal, H., and Saint-Paul, U. (2002). Effect of increased irradiance and thermal stress on the symbiosis of Symbiodinium microadriaticum and Tridacna gigas. Aquat. Living Resour. 15, 107–117. doi: 10.1016/s0990-7440(02)01159-2
Campbell, J. W., and Aarup, T. (1989). Photosynthetically available radiation at high-latitudes. Limnol. Oceanogr. 34, 1490–1499. doi: 10.1364/AO.57.003088
Cao, F., Fichot, C. G., Hooker, S. B., and Miller, W. L. (2014). Improved algorithms for accurate retrieval of UV/visible diffuse attenuation coefficients in optically complex, inshore waters. Remote Sens. Environ. 144, 11–27. doi: 10.1016/j.rse.2014.01.003
Carrasco-Malio, A., Diaz, M., Mella, M., Montoya, M. J., Miranda, A., Landaeta, M. F., et al. (2014). Are the intertidal fish highly resistant to UV-B radiation? A study based on oxidative stress in Girella laevifrons (Kyphosidae). Ecotoxicol. Environ. Saf. 100, 93–98. doi: 10.1016/j.ecoenv.2013.07.030
Carreja, B., Fernandez, M., and Agusti, S. (2016). Joint additive effects of temperature and UVB radiation on zoeae of the crab Taliepus dentatus. Mar. Ecol. Prog. Ser. 550, 135–145. doi: 10.3354/meps11715
Chaidez, V., Dreano, D., Agusti, S., Duarte, C. M., and Hoteit, I. (2017). Decadal trends in Red Sea maximum surface temperature. Sci. Rep. 7:8144. doi: 10.1038/s41598-017-08146-z
Coble, P. G., Zepp, R. G., and Zika, R. G. (2004). CDOM in the ocean: transformation processes and their effects on optical properties. Mar. Chem. 89, 1–1.
Cullen, J. J., Neale, P. J., and Lesser, M. P. (1992). Biological weighting function for the inhibition of phytoplankton photosynthesis by ultraviolet-radiation. Science 258, 646–650. doi: 10.1126/science.258.5082.646
Cutchis, P. (1974). Stratospheric ozone depletion and solar ultraviolet radiation on Earth. Science 184, 13–19. doi: 10.1126/science.184.4132.13
Dahlen, J., Bertilsson, S., and Pettersson, C. (1996). Effects of UV-A irradiation on dissolved organic matter in humic surface waters. Environ. Int. 22, 501–506. doi: 10.1016/0160-4120(96)00038-4
Dickerson, R. R., Kondragunta, S., Stenchikov, G., Civerolo, K. L., Doddridge, B. G., and Holben, B. N. (1997). The impact of aerosols on solar ultraviolet radiation and photochemical smog. Science 278, 827–830. doi: 10.1126/science.278.5339.827
Dishon, G., Dubinsky, Z., Fine, M., and Iluz, D. (2012). Underwater light field patterns in subtropical coastal waters: a case study from the Gulf of Eilat (Aqaba). Isr. J. Plant Sci. 60, 265–275. doi: 10.1560/ijps.60.1-2.265
Downs, N. J., Schouten, P. W., and Parisi, A. V. (2013). Seasonal variations in the subsurface ultraviolet-B on an inshore Pacific coral reef ecosystem. Photochem. Photobiol. 89, 1234–1243. doi: 10.1111/php.12101
Downs, N. J., Schouten, P. W., and Parisi, A. V. (2016). “In-situ measurements of solar exposure distribution on a coral reef: preliminary findings relating to reef aspect, water turbidity and dosimeter design,” in Proceedings of the 13th International Coral Reef Symposium: Book of Abstracts, Honolulu, HI.
Drohan, A. F., Thoney, D. A., and Baker, A. C. (2005). Synergistic effect of high temperature and ultraviolet-B radiation on the gorgonian Eunicea tourneforti (Octocorallia : Alcyonacea : Plexauridae). Bull. Mar. Sci. 77, 257–266.
Drollet, J. H., Faucon, M., and Martin, P. M. V. (1995). Elevated sea-water temperature and solar UV-B flux associated with two successive coral mass bleaching events in tahiti. Mar. Freshw. Res. 46, 1153–1157.
Ferrier-Pages, C., Richard, C., Forcioli, D., Allemand, D., Pichon, M., and Shick, J. M. (2007). Effects of temperature and UV radiation increases on the photosynthetic efficiency in four scleractinian coral species. Biol. Bull. 213, 76–87. doi: 10.2307/25066620
Fine, M., Gildor, H., and Genin, A. (2013). A coral reef refuge in the Red Sea. Glob. Chang. Biol. 19, 3640–3647. doi: 10.1111/gcb.12356
Garcias-Bonet, N., and Duarte, C. M. (2017). Methane production by seagrass ecosystems in the Red Sea. Front. Mar. Sci. 4:340. doi: 10.3389/fmars.2017.00340
Genevier, L. G. C., Jamil, T., Raitsos, D. E., Krokos, G., and Hoteit, I. (2019). Marine heatwaves reveal coral reef zones susceptible to bleaching in the Red Sea. Glob. Chang. Biol. 25, 2338–2351. doi: 10.1111/gcb.14652
Giomi, F., Barausse, A., Duarte, C. M., Booth, J., Agusti, S., Saderne, V., et al. (2019). Oxygen supersaturation protects coastal marine fauna from ocean warming. Sci. Adv. 5:eaax1814. doi: 10.1126/sciadv.aax1814
Giordanino, M. V., Strauch, S. M., Villafane, V. E., and Helbling, E. W. (2011). Influence of temperature and UVR on photosynthesis and morphology of four species of cyanobacteria. J. Photochem. Photobiol. B 103, 68–77. doi: 10.1016/j.jphotobiol.2011.01.013
Gleason, D. F., Edmunds, P. J., and Gates, R. D. (2006). Ultraviolet radiation effects on the behavior and recruitment of larvae from the reef coral Porites astreoides. Mar. Biol. 148, 503–512. doi: 10.1007/s00227-005-0098-y
Gleason, D. F., and Wellington, G. M. (1993). Ultraviolet-radiation and coral bleaching. Nature 365, 836–838. doi: 10.1038/365836a0
Gomes, V., Passos, M. J. A. C. R., Leme, N. M. P., Santos, T. C. A., Campos, D. Y. F., Hasue, F. M., et al. (2009). Photo-induced toxicity of anthracene in the Antarctic shallow water amphipod, Gondogeneia antarctica. Polar Biol. 32, 1009–1021. doi: 10.1007/s00300-009-0600-y
Helbling, E. W., and Zagarese, H. (2003). UV Effects in Aquatic Organisms and Ecosystems. Cambridge: The Royal Society of Chemistry.
Helms, J. R., Stubbins, A., Ritchie, J. D., Minor, E. C., Kieber, D. J., and Mopper, K. (2008). Absorption spectral slopes and slope ratios as indicators of molecular weight, source, and photobleaching of chromophoric dissolved organic matter. Limnol. Oceanogr. 53, 955–969. doi: 10.4319/lo.2008.53.3.0955
Hirabayashi, S., Kasai, F., Watanabe, M. M., and Hirose, E. (2006). Contents of ultraviolet-absorbing substances in two color morphs of the photosymbiotic ascidian Didemnum molle. Hydrobiologia 571, 419–422. doi: 10.1007/s10750-006-0244-7
Hirose, E., Hirabayashi, S., Hori, K., Kasai, F., and Watanabe, M. M. (2006). UV protection in the photosymbiotic ascidian Didemnum molle inhabiting different depths. Zoolog. Sci 23, 57–63. doi: 10.2108/zsj.23.57
Hsu, N. C., Tsay, S. C., King, M. D., and Herman, J. R. (2004). Aerosol properties over bright-reflecting source regions. IEEE Trans. Geosci. Remote 42, 557–569. doi: 10.1109/tgrs.2004.824067
IPCC, (2014). “Climate change 2014: synthesis report,” in Contribution of Working Groups I, II and III to the Fifth Assessment Report of the Intergovernmental Panel of Climate Change, eds Core Writing Team Pachauri, R. K., and Meyer, L. A. (Geneva: IPCC).
IPCC, (2018). “Summary for Policymakers,” in An IPCC Special Report on the Impacts of Global Warming of 1.5°C Above Pre-Industrial Levels and Related Global Greenhouse Gas Emission Pathways, in the Context of Strengthening the Global Response to the Threat of Climate Change, Sustainable Development, and Efforts to Eradicate Poverty eds V. Masson-Delmotte, P. Zhai, H.-O. Pörtner, D. Roberts, J. Skea, P. R. Shukla, et al. (Geneva: IPCC).
Iuculano, F., Alverez-Salgado, X. A., Otero, J., Catala, T. S., Sobrino, C., Duarte, C. M., et al. (2019). Patterns and drivers of UV absorbing chromophoric dissolved organic matter in the euphotic layer of the open ocean. Front. Mar. Sci. 6:320.
Jin, P., Overmans, S., Duarte, C. M., and Agustí, S. (2019). Increasing temperature within thermal limits compensates negative ultraviolet-B radiation effects in terrestrial and aquatic organisms. Glob. Ecol. Biogeogr. 28, 1695–1711. doi: 10.1111/geb.12973
Joshi, D., Mohandass, C., and Dhale, M. (2018). Effect of UV-B radiation and desiccation stress on photoprotective compounds accumulation in marine Leptolyngbya sp. Appl. Biochem. Biotechnol. 184, 35–47. doi: 10.1007/s12010-017-2523-3
Joyce, K. E., and Phinn, S. R. (2003). Hyperspectral analysis of chlorophyll content and photosynthetic capacity of coral reef substrates. Limnol. Oceanogr. 48, 489–496. doi: 10.4319/lo.2003.48.1_part_2.0489
Kalenderski, S., Stenchikov, G., and Zhao, C. (2013). Modeling a typical winter-time dust event over the Arabian Peninsula and the Red Sea. Atmos. Chem. Phys. 13, 1999–2014. doi: 10.5194/acp-13-1999-2013
Karentz, D., Dunlap, W. C., and Bosch, I. (1997). Temporal and spatial occurrence of UV-absorbing mycosporine-like amino acids in tissues of the Antarctic sea urchin Sterechinus neumayeri during springtime ozone-depletion. Mar. Biol. 129, 343–353. doi: 10.1007/s002270050174
Kaweewat, K., and Hofer, R. (1997). Effect of UV-B radiation on goblet cells in the skin of different fish species. J. Photochem. Photobiol. B Biol. 41, 222–226. doi: 10.1016/s1011-1344(97)00104-8
Kheireddine, M., Ouhssain, M., Calleja, M. L., Moran, X. A. G., Sarma, Y. V. B., Tiwari, S. P., et al. (2018). Characterization of light absorption by chromophoric dissolved organic matter (CDOM) in the upper layer of the Red Sea. Deep Sea Res. Part I 133, 72–84. doi: 10.1016/j.dsr.2018.02.001
Khogali, A., and Albar, O. F. (1992). A study of solar ultraviolet-radiation at makkah solar station. Sol. Energy 48, 79–87. doi: 10.1016/0038-092x(92)90036-a
Kim, B. M., Rhee, J. S., Lee, K. W., Kim, M. J., Shin, K. H., Lee, S. J., et al. (2015). UV-B radiation-induced oxidative stress and p38 signaling pathway involvement in the benthic copepod Tigriopus japonicus. Comp. Biochem. Physiol. C Toxicol. Pharmacol. 167, 15–23. doi: 10.1016/j.cbpc.2014.08.003
Kuguru, B., Achituv, Y., Gruber, D. F., and Tchernov, D. (2010). Photoacclimation mechanisms of corallimorpharians on coral reefs: photosynthetic parameters of zooxanthellae and host cellular responses to variation in irradiance. J. Exp. Mar. Biol. Ecol. 394, 53–62. doi: 10.1016/j.jembe.2010.07.007
Larkum, A. W., and Wood, W. F. (1993). The effect of UV-B radiation on photosynthesis and respiration of phytoplankton, benthic macroalgae and seagrasses. Photosynth. Res. 36, 17–23. doi: 10.1007/BF00018071
Lee, Z. P., Du, K. P., Arnone, R., Liew, S. C., and Penta, B. (2005). Penetration of solar radiation in the upper ocean: a numerical model for oceanic and coastal waters. J. Geophys. Res. Oceans 110:C09019.
Lesser, M. P. (1996). Elevated temperatures and ultraviolet radiation cause oxidative stress and inhibit photosynthesis in symbiotic dinoflagellates. Limnol. Oceanogr. 41, 271–283. doi: 10.4319/lo.1996.41.2.0271
Lesser, M. P. (2010). Interactions between stressors on coral reefs: analytical approaches, re-analysis of old data, and different conclusions. Coral Reefs 29, 615–619. doi: 10.1007/s00338-010-0625-2
Lesser, M. P., and Farrell, J. H. (2004). Exposure to solar radiation increases damage to both host tissues and algal symbionts of corals during thermal stress. Coral Reefs 23, 367–377. doi: 10.1007/s00338-004-0392-z
Lesser, M. P., and Lewis, S. (1996). Action spectrum for the effects of UV radiation on photosynthesis in the hermatypic coral Pocillopora damicornis. Mar. Ecol. Prog. Ser. 134, 171–177. doi: 10.3354/meps134171
Lesser, M. P., Stochaj, W. R., Tapley, D. W., and Shick, J. M. (1990). Bleaching in coral-reef anthozoans - effects of irradiance, ultraviolet-radiation, and temperature on the activities of protective enzymens against active oxygen. Coral Reefs 8, 225–232. doi: 10.1007/bf00265015
Lionard, M., Roy, S., Tremblay-Letourneau, M., and Ferreyra, G. A. (2012). Combined effects of increased UV-B and temperature on the pigment-determined marine phytoplankton community of the St Lawrence Estuary. Mar. Ecol. Prog. Ser. 445, 219–234. doi: 10.3354/meps09484
Llabres, M., Agusti, S., Alonso-Laita, P., and Herndl, G. J. (2010). Synechococcus and Prochlorococcus cell death induced by UV radiation and the penetration of lethal UVR in the Mediterranean Sea. Mar. Ecol. Prog. Ser. 399, 27–37. doi: 10.3354/meps08332
Llabres, M., Agusti, S., Fernandez, M., Canepa, A., Maurin, F., Vidal, F., et al. (2013). Impact of elevated UVB radiation on marine biota: a meta-analysis. Glob. Ecol. Biogeogr. 22, 131–144. doi: 10.1111/j.1466-8238.2012.00784.x
López-Sandoval, D. C., Rowe, K., Carillo-de-Albonoz, P., Duarte, C. M., and Agusti, S. (2019). Rates and drivers of Red Sea plankton community metabolism. Biogeosciences 16, 2983–2995. doi: 10.5194/bg-16-2983-2019
McKenzie, R., Smale, D., and Kotkamp, M. (2004). Relationship between UVB and erythemally weighted radiation. Photochem. Photobiol. Sci. 3, 252–256.
McKenzie, R. L., Aucamp, P. J., Bais, A. F., Bjorn, L. O., and Ilyas, M. (2007). Changes in biologically-active ultraviolet radiation reaching the Earth’s surface. Photochem. Photobiol. Sci. 6, 218–231. doi: 10.1039/b700017k
McKenzie, R. L., Aucamp, P. J., Bais, A. F., Bjorn, L. O., Ilyas, M., and Madronich, S. (2011). Ozone depletion and climate change: impacts on UV radiation. Photochem. Photobiol. Sci. 10, 182–198. doi: 10.1039/c0pp90034f
McKinlay, A. F., and Diffey, B. L. (1987). A reference action spectrum for ultraviolet erythema in human skin. CIE J. 6, 17–22.
Meul, S., Dameris, M., Langematz, U., Abalichin, J., Kerschbaumer, A., Kubin, A., et al. (2016). Impact of rising greenhouse gas concentrations on future tropical ozone and UV exposure. Geophys. Res. Lett. 43, 2919–2927. doi: 10.1002/2016gl067997
Miller, R. L., Belz, M., Del Castillo, C., and Trzaska, R. (2002). Determining CDOM absorption spectra in diverse coastal environments using a multiple pathlength, liquid core waveguide system. Cont. Shelf Res. 22, 1301–1310. doi: 10.1016/s0278-4343(02)00009-2
Nahon, S., Charles, F., Lantoine, F., Vetion, G., Escoubeyrou, K., Desmaladed, M., et al. (2010). Ultraviolet radiation negatively affects growth and food quality of the pelagic diatom Skeletonema costatum. J. Exp. Mar. Biol. Ecol. 383, 164–170. doi: 10.1016/j.jembe.2009.12.006
Obernosterer, I., Ruardij, P., and Herndl, G. J. (2001). Spatial and diurnal dynamics of dissolved organic matter (DOM) fluorescence and H2O2 and the photochemical oxygen demand of surface water DOM across the subtropical Atlantic Ocean. Limnol. Oceanogr. 46, 632–643. doi: 10.4319/lo.2001.46.3.0632
Osman, E. O., Smith, D. J., Ziegler, M., Kurten, B., Conrad, C., El-Haddad, K. M., et al. (2018). Thermal refugia against coral bleaching throughout the northern Red Sea. Glob. Chang. Biol. 24, e474–e484. doi: 10.1111/gcb.13895
Overmans, S., and Agusti, S. (2019). Latitudinal gradient of UV attenuation along the highly transparent Red Sea Basin. Photochem. Photobiol. 95, 1267–1279. doi: 10.1111/php.13112
Overmans, S., Nordborg, M., Diaz-Rua, R., Brinkman, D. L., Negri, A. P., and Agusti, S. (2018). Phototoxic effects of PAH and UVA exposure on molecular responses and developmental success in coral larvae. Aquat. Toxicol. 198, 165–174. doi: 10.1016/j.aquatox.2018.03.008
Pfeifer, M. T., Koepke, P., and Reuder, J. (2006). Effects of altitude and aerosol on UV radiation. J. Geophys. Res. Atmos. 111:D01203.
Prakash, P. J., Stenchikov, G., Kalenderski, S., Osipov, S., and Bangalath, H. (2015). The impact of dust storms on the Arabian Peninsula and the Red Sea. Atmos. Chem. Phys. 15, 199–222. doi: 10.5194/acp-15-199-2015
Raitsos, D. E., Hoteit, I., Prihartato, P. K., Chronis, T., Triantafyllou, G., and Abualnaja, Y. (2011). Abrupt warming of the Red Sea. Geophys. Res. Lett. 38:L14601.
Raitsos, D. E., Pradhan, Y., Brewin, R. J., Stenchikov, G., and Hoteit, I. (2013). Remote sensing the phytoplankton seasonal succession of the Red Sea. PLoS One 8:e64909. doi: 10.1371/journal.pone.0064909
Rhein, M., Rintoul, S. R., Aoki, S., Campos, E., Chambers, D., Feely, R. A., et al. (2013). “Observations: ocean,” in Climate Change 2013: The Physical Science Basis. Contribution of Working Group I to the Fifth Assessment Report of the Intergovernmental Panel on Climate Change, eds T. F. Stocker, D. Qin, G.-K. Plattner, M. Tignor, S. K. Allen, J. Boschung, et al. (Cambridge: Cambridge University Press).
Richter, C., Wunsch, M., Rasheed, M., Kotter, I., and Badran, M. I. (2001). Endoscopic exploration of Red Sea coral reefs reveals dense populations of cavity-dwelling sponges. Nature 413, 726–730. doi: 10.1038/35099547
Romera-Castillo, C., Alvarez-Salgado, X. A., Gali, M., Gasol, J. M., and Marrase, C. (2013). Combined effect of light exposure and microbial activity on distinct dissolved organic matter pools. A seasonal field study in an oligotrophic coastal system (Blanes Bay, NW Mediterranean). Mar. Chem. 148, 44–51. doi: 10.1016/j.marchem.2012.10.004
Schweikert, K., Sutherland, J. E. S., Hurd, C. L., and Burritt, D. J. (2011). UV-B radiation induces changes in polyamine metabolism in the red seaweed Porphyra cinnamomea. Plant Growth Regul. 65, 389–399. doi: 10.1111/jpy.12166
Sempere, R., Para, J., Tedetti, M., Charriere, B., and Mallet, M. (2015). Variability of solar radiation and CDOM in surface coastal waters of the northwestern mediterranean sea. Photochem. Photobiol. 91, 851–861. doi: 10.1111/php.12434
Setlow, R. B. (1974). The wavelengths in sunlight effective in producing skin cancer: a theoretical analysis. Proc. Natl. Acad. Sci. U.S.A. 71, 3363–3366. doi: 10.1073/pnas.71.9.3363
Shi, K. P., Yu, J., Liu, C. Y., Xu, Z. M., and Tang, X. X. (2017). Impacts of enhanced UVB radiation on photosynthetic characteristics of the marine diatom Phaeodactylum tricornutum (Bacillariophyceae, Heterokontophyta). J. Appl. Phycol. 29, 1287–1296. doi: 10.1007/s10811-017-1067-9
Shick, J. M., Dunlap, W. C., Chalker, B. E., Banaszak, A. T., and Rosenzweig, T. K. (1992). Survey of ultraviolet radiation-absorbing mycosporine-like amino-acids in organs of coral-reef holothuroids. Mar. Ecol. Prog. Ser. 90, 139–148. doi: 10.3354/meps090139
Smith, R. C., and Baker, K. S. (1989). Stratospheric ozone, middle ultraviolet radiation and phytoplankton productivity. Oceanography 2, 4–10. doi: 10.5670/oceanog.1989.01
Smyth, T. J. (2011). Penetration of UV irradiance into the global ocean. J. Geophys. Res. Oceans 116:C11020.
Sofianos, S. S., and Johns, W. E. (2002). An oceanic general circulation model (OGCM) investigation of the Red Sea circulation, 1. Exchange between the Red Sea and the Indian Ocean. J. Geophys. Res. Oceans 107:3196.
Stambler, N. (2005). Bio-optical properties of the northern Red Sea and the Gulf of Eilat (Aqaba) during winter 1999. J. Sea Res. 54, 186–203. doi: 10.1016/j.seares.2005.04.006
Tedetti, M., and Sempere, R. (2006). Penetration of ultraviolet radiation in the marine environment. A review. Photochem. Photobiol. 82, 389–397.
Tedetti, M., Sempere, R., Vasilkov, A., Charriere, B., Nerini, D., Miller, W. L., et al. (2007). High penetration of ultraviolet radiation in the south east Pacific waters. Geophys. Res. Lett. 34:L12610. doi: 10.1029/2007GL029823
Torregiani, J. H., and Lesser, M. P. (2007). The effects of short-term exposures to ultraviolet radiation in the Hawaiian coral Montipora verrucosa. J. Exp. Mar. Biol. Ecol. 340, 194–203. doi: 10.1016/j.jembe.2006.09.004
Torres-Perez, J. L., and Armstrong, R. A. (2012). Effects of UV radiation on the growth, photosynthetic and photoprotective components, and reproduction of the Caribbean shallow-water coral Porites furcata. Coral Reefs 31, 1077–1091. doi: 10.1007/s00338-012-0927-7
van de Poll, W. H., Eggert, A., Buma, A. G. J., and Breeman, A. M. (2001). Effects of UV-B-induced DNA damage and photoinhibition on growth of temperate marine red macrophytes: habitat-related differences in UV-B tolerance. J. Phycol. 37, 30–37.
van Duyl, F., Gast, G., Steinhoff, W., Kloff, S., Veldhuis, M., and Bak, R. (2002). Factors influencing the short-term variation in phytoplankton composition and biomass in coral reef waters. Coral Reefs 21, 293–306. doi: 10.1007/s00338-002-0248-3
Wangpraseurt, D., Polerecky, L., Larkum, A. W. D., Ralph, P. J., Nielsen, D. A., Pernice, M., et al. (2014). The in situ light microenvironment of corals. Limnol. Oceanogr. 59, 917–926. doi: 10.4319/lo.2014.59.3.0917
Watanabe, S., Sudo, K., Nagashima, T., Takemura, T., Kawase, H., and Nozawa, T. (2011). Future projections of surface UV-B in a changing climate. J. Geophys. Res. Atmos. 116:D16118.
Waters, K. J., Smith, R. C., and Lewis, M. R. (1990). Avoiding ship-induced light-field perturbation in the determination of oceanic optical properties. Oceanography 3, 18–21.
Weinbauer, M. G., Wilhelm, S. W., Suttle, C. A., and Garza, D. R. (1997). Photoreactivation compensates for UV damage and restores infectivity to natural marine virus communities. Appl. Environ. Microbiol. 63, 2200–2205. doi: 10.1128/aem.63.6.2200-2205.1997
Williamson, C. E., Zepp, R. G., Lucas, R. M., Madronich, S., Austin, A. T., Ballare, C. L., et al. (2014). Solar ultraviolet radiation in a changing climate. Nat. Clim. Change 4, 434–441. doi: 10.1039/c8pp90060d
Xiao, X., de Bettignies, T., Olsen, Y. S., Agusti, S., Duarte, C. M., and Wernberg, T. (2015). Sensitivity and acclimation of three canopy-forming seaweeds to UVB radiation and warming. PLoS One 10:e0143031. doi: 10.1371/journal.pone.0143031
Yadav, S., Prajapati, R., and Atri, N. (2016). Effects of UV-B and heavy metals on nitrogen and phosphorus metabolism in three cyanobacteria. J. Basic Microbiol. 56, 2–13. doi: 10.1002/jobm.201500504
Yahel, G., Post, A. F., Fabricius, K., Marie, D., Vaulot, D., and Genin, A. (1998). Phytoplankton distribution and grazing near coral reefs. Limnol. Oceanogr. 43, 551–563. doi: 10.4319/lo.1998.43.4.0551
Zamzow, J. P., Siebeck, U. E., Eckes, M. J., and Grutter, A. S. (2013). Ultraviolet-B wavelengths regulate changes in UV absorption of cleaner fish Labroides dimidiatus mucus. PLoS One 8:e78527. doi: 10.1371/journal.pone.0078527
Zeevi Ben-Yosef, D., and Benayahu, Y. (2008). Synergistic effects of UVR and temperature on the survival of azooxanthellate and zooxanthellate early developmental stages of soft corals. Bull. Mar. Sci. 83, 401–414.
Zeni, E. C., Ammar, D., Leal, M. L., da Silva, H. S., Allodi, S., Muller, Y. M., et al. (2015). Light-mediated DNA Repair Prevents UVB-induced Cell Cycle Arrest in Embryos of the Crustacean Macrobrachium olfersi. Photochem. Photobiol. 91, 869–878. doi: 10.1111/php.12457
Zepp, R. G., Shank, G. C., Stabenau, E., Patterson, K. W., Cyterski, M., Fisher, W., et al. (2008). Spatial and temporal variability of solar ultraviolet exposure of coral assemblages in the Florida Keys: importance of colored dissolved organic matter. Limnol. Oceanogr. 53, 1909–1922. doi: 10.4319/lo.2008.53.5.1909
Keywords: Red Sea, coral reefs, marine optics, ultraviolet radiation (UV), downwelling diffuse attenuation coefficient (Kd), chlorophyll-a (Chl-a), chromophoric dissolved organic matter (CDOM), climate change
Citation: Overmans S and Agustí S (2020) Unraveling the Seasonality of UV Exposure in Reef Waters of a Rapidly Warming (Sub-)tropical Sea. Front. Mar. Sci. 7:111. doi: 10.3389/fmars.2020.00111
Received: 03 November 2019; Accepted: 11 February 2020;
Published: 28 February 2020.
Edited by:
Patrick J. Neale, Smithsonian Environmental Research Center (SI), United StatesReviewed by:
Anastazia T. Banaszak, National Autonomous University of Mexico, MexicoNorman B. Nelson, University of California, Santa Barbara, United States
Copyright © 2020 Overmans and Agustí. This is an open-access article distributed under the terms of the Creative Commons Attribution License (CC BY). The use, distribution or reproduction in other forums is permitted, provided the original author(s) and the copyright owner(s) are credited and that the original publication in this journal is cited, in accordance with accepted academic practice. No use, distribution or reproduction is permitted which does not comply with these terms.
*Correspondence: Sebastian Overmans, c2ViYXN0aWFuLm92ZXJtYW5zQGthdXN0LmVkdS5zYQ==