 Nathan C. Greig1,2,3
 Ellen M. Hines
 Samantha Cope
- 1Estuary & Ocean Science Center, San Francisco State University, Tiburon, CA, United States
- 2Department of Geography & Environment, San Francisco State University, San Francisco, CA, United States
- 3Midpeninsula Regional Open Space District, Los Altos, CA, United States
- 4ProtectedSeas, Anthropocene Institute, Palo Alto, CA, United States
Most species of whales are vulnerable to vessel collisions, and the probability of lethality increases logistically with vessel speed. An Automatic Identification System (AIS) can provide valuable vessel activity data, but terrestrial-based AIS has a limited spatial range. As the need for open ocean monitoring increases, AIS broadcasts relayed over earth-orbiting satellites, satellite AIS (SAIS), provides a method for expanding the range of AIS broadcast reception. We used SAIS data from 2013 and 2014 to calculate vessel density and speed over ground around the coast of Washington state in the northwestern United States. Nearby shipping lanes connecting the Ports of Seattle, Tacoma, Portland, and in Canada, Vancouver, have the greatest density of vessel traffic arriving and departing. Knowledge of shipping activity is important in this area due to the nearby presence of NOAA designated Cetacean Density and Distribution Working Group’s Biologically Important Areas (BIA) for large whale species vulnerable to vessel collisions. We quantified density and speed for each vessel type that transits through BIA’s. We found that cargo and tanker vessels traveled the farthest distance at the greatest speeds. As ship-strike risk assessments have traditionally relied on terrestrial AIS, we explored issues in the application of SAIS data. Temporal gaps in SAIS data led to a resulting systematic underestimation of vessel speed in calculated speed over ground. However, SAIS can be helpful in documenting minimum vessel speeds across large geographic areas and across national boundaries, especially beyond the reach of terrestrial AIS receivers. SAIS data can also be useful in examining vessel density at broad scales and could be used to assess basin-wide open ocean routes. Future use of additional satellite platforms with AIS receivers and technological advances will help rectify this issue and improve data coverage and quality.
Introduction
Shipping, a highly globalized industry, is an important component of international trade, and is correlated with global economic patterns (Schwehr and McGillivary, 2007; Rodrigue, 2010; Frisk, 2012). While the world’s vessel fleet is growing over time (Silber et al., 2010), so does the need to effectively track vessel movements. The Automatic Identification System (AIS) is a non-proprietary tracking technology standardized by the International Telecommunications Union and required for most vessels by the International Maritime Organization’s Safety of Life at Sea Convention (Tetreault, 2005; United States Coast Guard [USCG], 2008). Originally conceived to improve ships’ navigational safety, terrestrial AIS broadcasts are limited roughly to line-of-sight (Calder and Schwehr, 2009), so coverage does not extend well into the open ocean (Silber et al., 2014). Satellite AIS (SAIS), since 2008, can help overcome the terrestrial line-of-sight limitation by collecting AIS broadcasts from a constellation of earth-orbiting satellites (Ball, 2013; Robards et al., 2016).
Despite the initial intent of AIS as a navigational aid, the data provide valuable insight on human use of marine areas in the context of environmental conservation. Events like the establishment of large off-shore protected areas clarify the need to extend the range of traditional AIS broadcasts to better monitor vessel activity far from shore (McCauley et al., 2016). SAIS data have been employed to monitor fishing activity and protected area regulation compliance (Natale et al., 2015; de Souza et al., 2016; Rowlands et al., 2019). Terrestrial AIS has provided valuable data to assess the risk of collision between ships and whales near established shipping lanes in coastal areas (Williams and O’Hara, 2010; Wiley et al., 2011; Redfern et al., 2013; Jensen et al., 2015), but lethal interactions may also occur outside of these highly monitored areas (Rockwood et al., 2017). For off-shore areas, SAIS has the potential to contribute vessel activity data necessary for collision risk assessments (Williams and O’Hara, 2010; van der Hoop et al., 2012).
Since 2009, the International Whaling Commission has reported more than 1,200 confirmed incidents of vessel collisions with whales (Cates et al., 2017). Vessel speed is an important component of shipping’s potential impact on cetaceans (Gende et al., 2011; Conn and Silber, 2013; Currie et al., 2017). The conservation benefit to whales by reducing vessel speed is well established and is generally expressed as a simple logistic relationship between vessel speed and probability of lethality (Vanderlaan and Taggart, 2007; Gende et al., 2011; Wiley et al., 2011; Conn and Silber, 2013). There is a significant positive relationship, and the greatest rate of change generally occurs between 9 and 15 knots, corresponding roughly to an increase in probability of lethality from 20 to 80% (see Vanderlaan and Taggart, 2007). Vessel speed limits help to reduce the anthropogenic mortality risk and possibly collision probability (Gende et al., 2011; Conn and Silber, 2013). AIS provides data on vessel speed which has been combined with density to examine threats of collision (Felski et al., 2015; Rockwood et al., 2017).
Our objective was to use available SAIS data to delineate spatial locations where vessel traffic density and speed were high in known areas of cetacean concentrations off the coast of Washington state. The use of SAIS data was necessary because only a little more than half of the study area water was within the potential range of terrestrial AIS.
In Washington state waters, there were 19 of 130 (15%) strandings from 1980 to 2006 that showed evidence of collisions with vessels. Numerous biases in collision detection lead to underestimates in true numbers of mortalities (Douglas et al., 2008), so the actual number is likely higher (Williams et al., 2011). There are Biologically Important Areas (BIAs) in this research area for gray (Eschrichtius robustus) and humpback whales (Megaptera novaeangliae) (Calambokidis et al., 2015; Figures 1, 2). BIAs are species, region, and time specific areas which the National Oceanic and Atmospheric Administration (NOAA) Fisheries, Cetacean Density and Distribution Working Group has identified as important for reproduction, feeding, migrating, or small and residential populations (Ferguson et al., 2015).
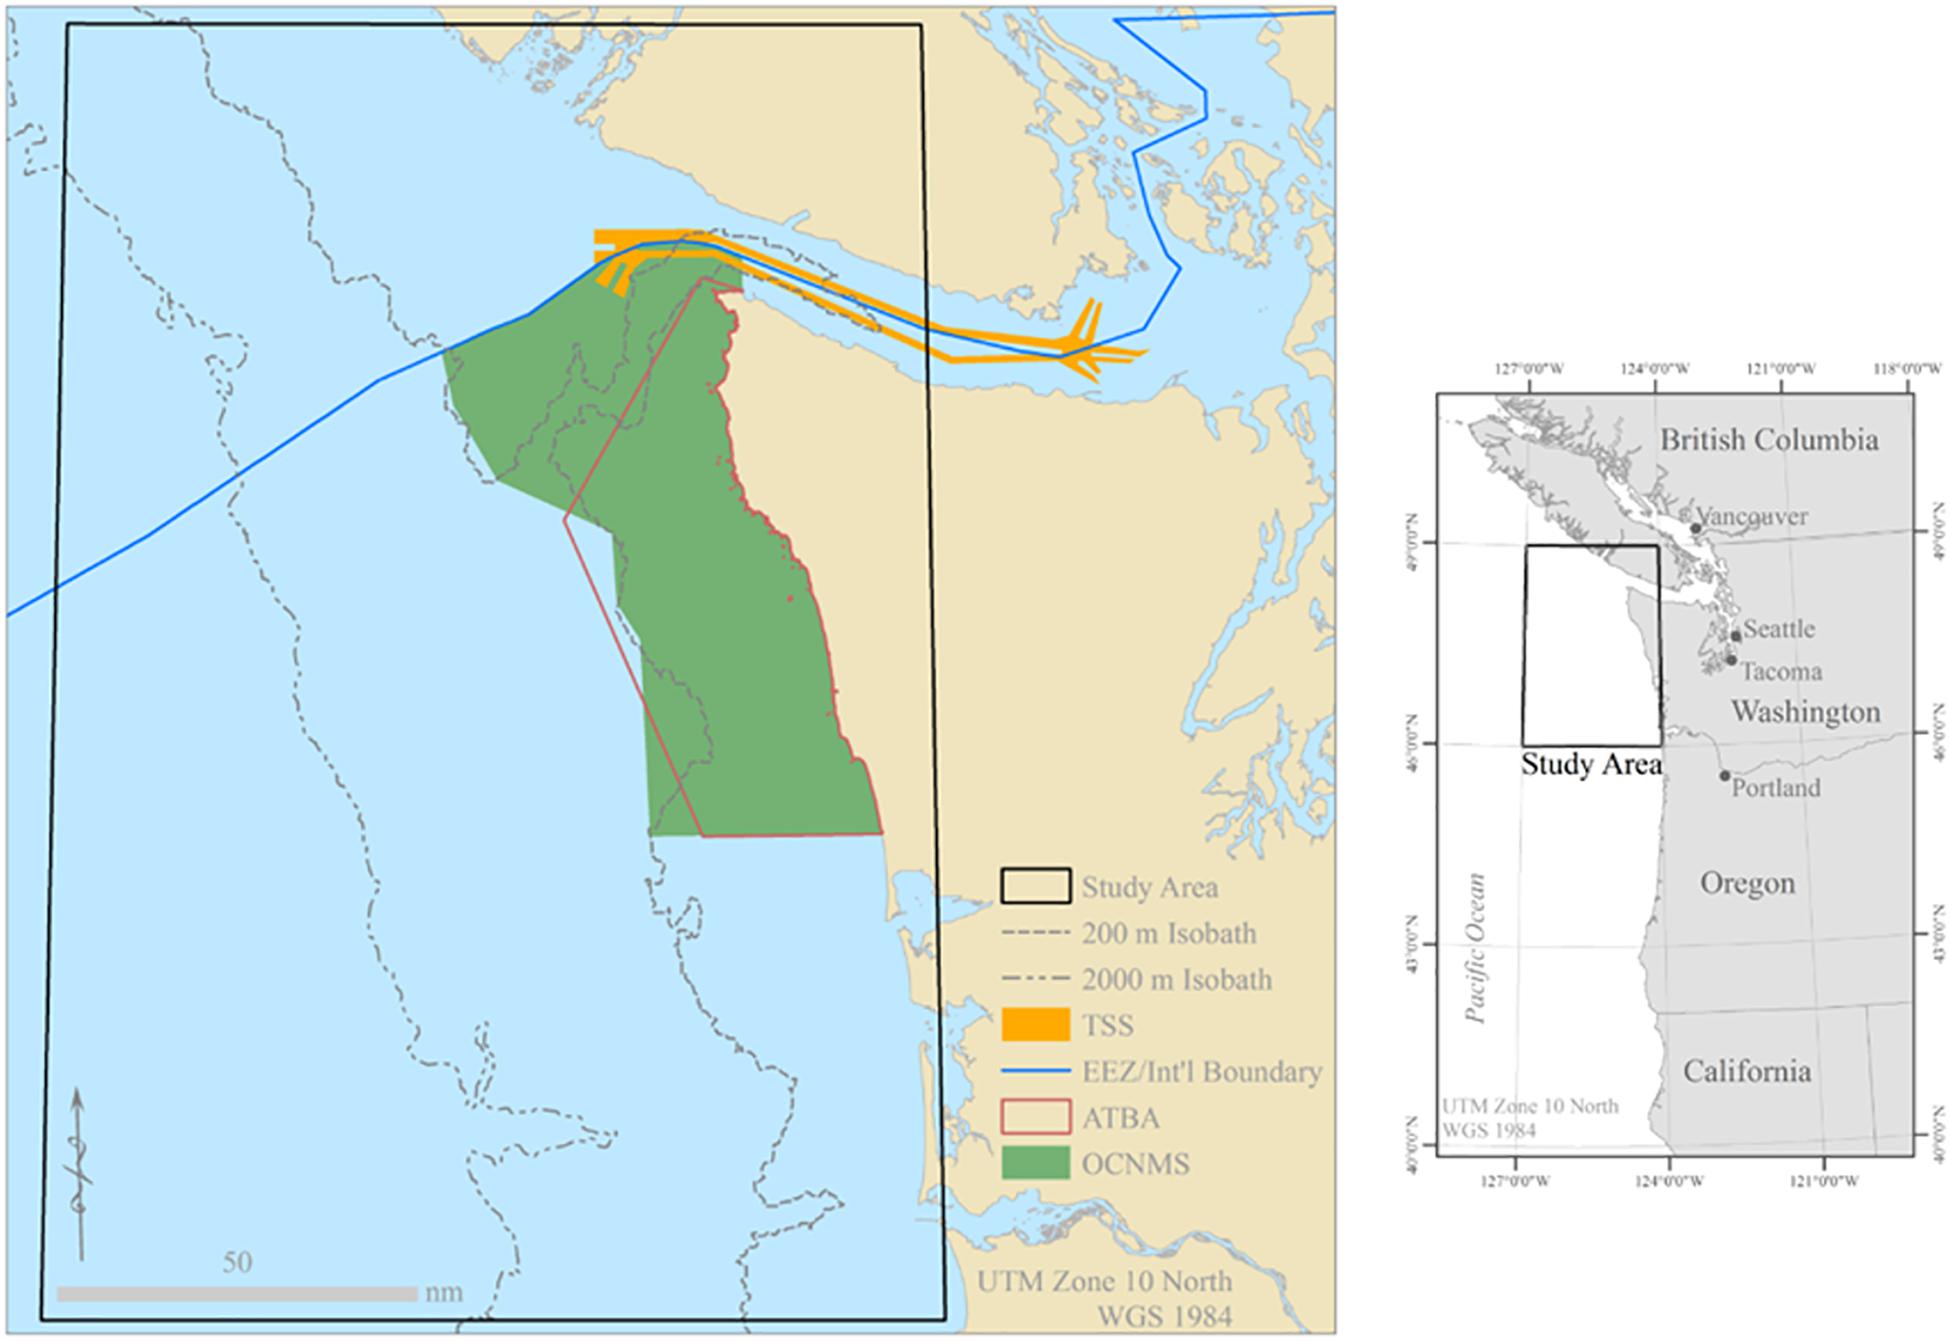
Figure 1. Bathymetry and administrative areas in the study area along the Pacific Northwest coast including Washington state in the United States and southwest Vancouver Island in Canada. Note: Traffic Separation Scheme (TSS), Exclusive Economic Zone (EEZ), Area To Be Avoided (ATBA), Olympic Coast National Marine Sanctuary (OCNMS).
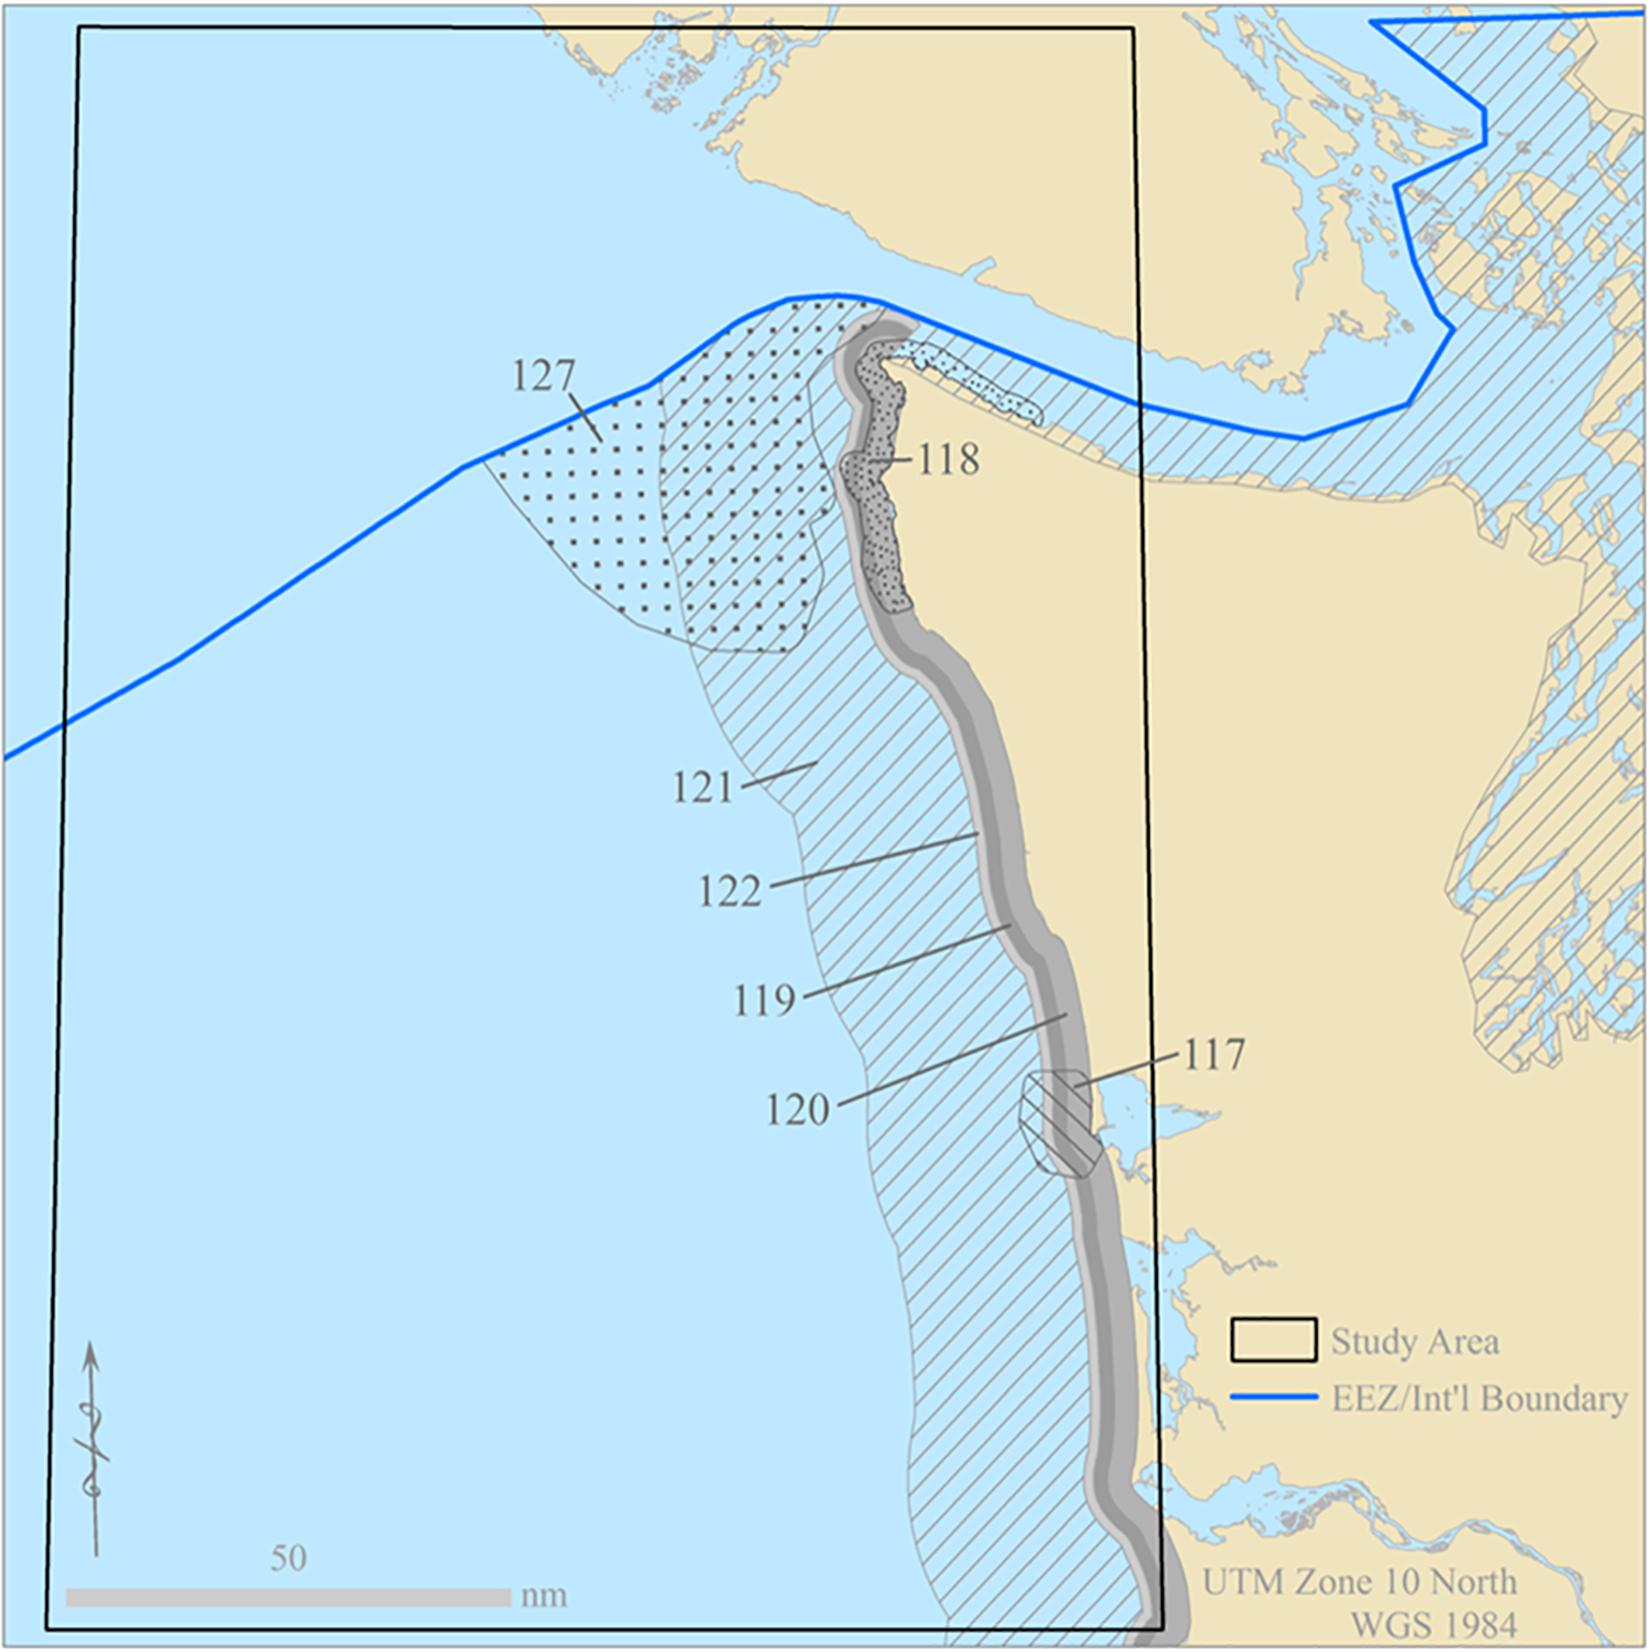
Figure 2. Biologically Important Areas (BIA) (see Table 1 for species and type) for gray (Eschrichtius robustus) and humpback whales (Megaptera novaengliae) along the coast of the North American Pacific Northwest (Calambokidis et al., 2015). All BIAs are for gray whales with the exception of BIA 127 for humpback whales.
At the time of this writing, NOAA has declared an active Unusual Mortality Event (UME) for gray whales along the United States west coast from California to Alaska indicating above-average mortality rates: 34 strandings in Washington state waters and 10 in Canadian waters between January and September of 2019 (National Oceanic and Atmospheric Administration [NOAA], 2019). The gray whale BIAs in our study area were based on migratory corridors between annual feeding and reproductive areas, from numerous survey methods and expert opinion (Calambokidis et al., 2015; Figure 2). Assessing patterns of vessel behavior in these areas can help managers evaluate potential impacts to this vulnerable population suffering from elevated mortality events. While the United States Fish and Wildlife Service removed the species-level listing of humpback whales on the Endangered Species List, some unique migratory populations are still listed as Threatened or Endangered (United States Fish and Wildlife Service [USFWS], 2016). The humpback whale BIAs were based on surveys and opportunistic sources about highly concentrated feeding animals (Calambokidis et al., 2015; Figure 2). We used these BIAs as a proxy for areas of high cetacean concentration for each species.
SAIS can now facilitate a complete global picture of vessel activity (Skauen, 2019). The growing number of satellites in orbit capable of transmitting SAIS data suggests that temporal gaps between satellite passes over an area will be minimized (McCauley et al., 2016). If this trend continues, it may become increasingly more attractive to use SAIS data instead of terrestrial AIS data due to its spatial coverage. We took this opportunity to investigate and evaluate potential issues related to monitoring vessel density and speed using SAIS data that may need to be rectified before more pervasive use of the technology can occur. AIS is an imperfect data source as it is limited by human input, data corruption, signal noise, GPS faults, and gyrocompass or other instrument failure onboard the target vessel (Aarsæther and Moan, 2009; McGillivary et al., 2009; Silber and Bettridge, 2010; Robards et al., 2016). Further, gaps in SAIS data are also evident (Allen et al., 2018; Eriksen et al., 2018), especially in areas of high activity due to satellite congestion (Jia et al., 2019). Despite these issues, both AIS and SAIS provide insights on vessel activity otherwise unavailable.
In this research, we provide a baseline understanding of vessel activity off the Washington coast as a foundation for future risk assessments. Extensive research on risk to North Atlantic right whales on the United States east coast has shown the effectiveness of reduced speed and routing alternatives in reducing whale mortality from vessel collisions (Laist et al., 2014). However, the vessel patterns within United States waters outside the Strait of Juan de Fuca has still not been studied. Multiple species of large whales off the coast of Washington state are vulnerable to collisions (Douglas et al., 2008; Silber et al., 2010). This geographic focus area is important due to its connections to several primary ports and the presence of multiple species of slow-reproducing whales recovering from past population declines.
Materials and Methods
Study Area
Our research site was offshore from the important North American west-coast ports of Vancouver, Seattle, Tacoma, and Portland (Figure 1). The specific study area was between 46–49°n and 124–127°W, and defined the extent of SAIS data collection. Reaching 90 to 125 nm offshore of the state of Washington in the northwestern United States, the study area extended from roughly the mouth of the Columbia River in the south to the Strait of Juan de Fuca and southern Vancouver Island in the north.
Inside the Strait of Juan de Fuca are the Ports of Tacoma and Seattle, major United States shipping ports, and Port Metro Vancouver (Figure 1). Port Metro Vancouver is the largest Canadian port, handling roughly the same amount of total tonnage as the Port of New York and more than Seattle and Tacoma combined (United States Army Corps of Engineers [USACE], 2016; Port Metro Vancouver, 2017). Tacoma and Seattle ranked 7th and 10th, respectively, in the United States for total container ship traffic in 2013 and 29th and 31st, respectively, for total tonnage in the United States in 2014 (United States Army Corps of Engineers [USACE], 2015, 2016). These ports connect internationally to East and Southeast Asia, and domestically to Alaska, Hawaii, and the West Coast of the United States. Additionally, the Port of Portland is located inland from the mouth of the Columbia River. Portland ranked 25th among United States ports for total container ship traffic in 2013 and 28th for total tonnage in 2014 (United States Army Corps of Engineers [USACE], 2015, 2016).
Within the full 75,367 km2 study area, 88% is open water and 12% is land. Administrative areas in the study area include the NOAA administered Olympic Coast National Marine Sanctuary (OCNMS), an International Maritime Organization (IMO) designated Area to be Avoided (ATBA), and part of the United States Coast Guard (USCG) controlled Juan de Fuca Traffic Separation Scheme (TSS) (Figure 1). Within the study area, there are seven BIAs, six for gray whales and one for humpback whales (Table 1; and Figure 2).
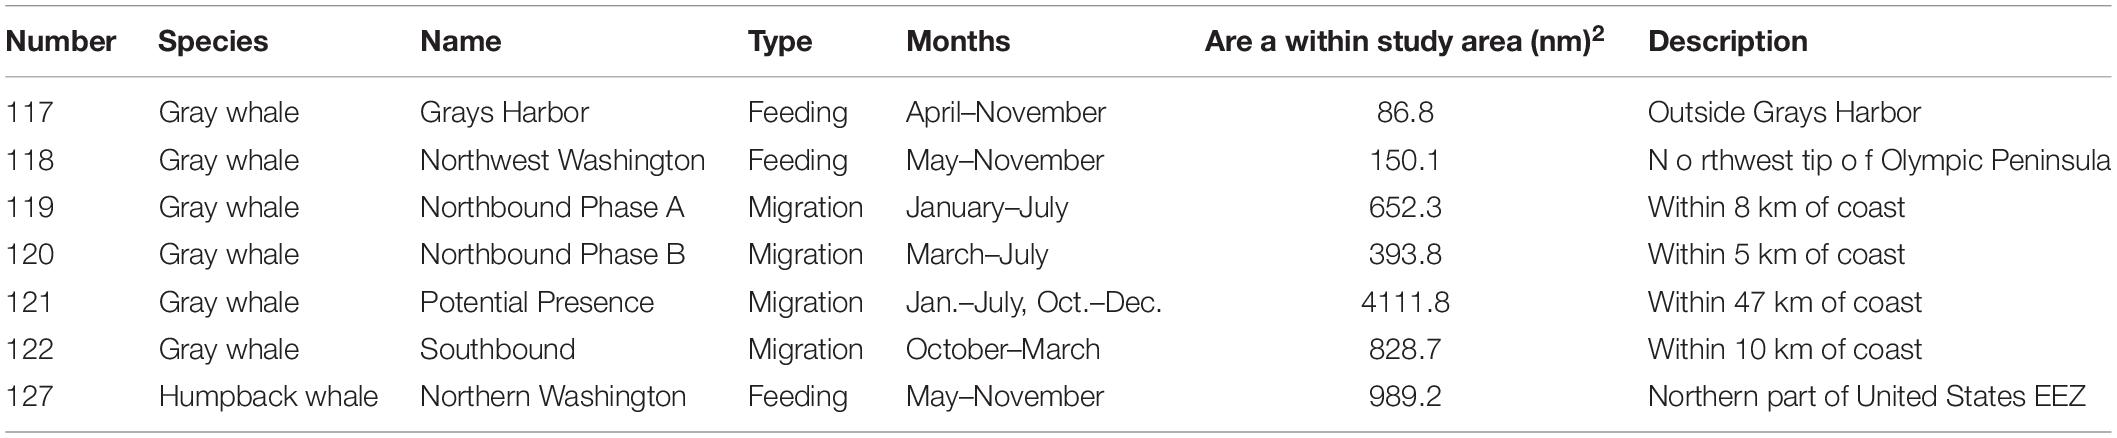
Table 1. Summary of Biologically Important Areas (BIA) within the North American Pacific Northwest (Calambokidis et al., 2015).
SAIS Information
Satellite AIS data were collected by exactEarth Ltd. (Cambridge, ON, Canada) for the calendar years 2013 and 2014, and received from the OCNMS. Each record in the tables corresponded to an individual AIS broadcast. AIS information is comprised of static information that does not change over the course of a voyage, and dynamic information that can change as frequently as every AIS broadcast.
The original SAIS data that were received had 3,045,407 records for the year 2013 and 2,941,900 for 2014. The years 2013 and 2014 had consistent fuel sulfur regulations (10,000 ppm or 1.0%) for vessels operating within the North America Emissions Control Area, 200 nm from the coast (Environmental Protection Agency [EPA], 2010). Thus, there were no temporal changes in traffic patterns based on emissions controls standards during our study period (Jensen et al., 2015). A further reduction in sulfur regulations to 0.1% occurred in 2015 (International Maritime Organization [IMO], 2019). Although evidence from California suggests that ships may alter their speed based on new regulations (Moore et al., 2018), differences in shipping patterns are seen to principally reflect longer term economic changes (Jensen et al., 2015). The results of this study are meant to inform management of past trends and provide insight on the use of SAIS data for evaluating vessel activity.
Data Preparation
We conducted data quality control, starting with removing duplicate SAIS records, defined as records having the same Maritime Mobile Service Identity (MMSI), latitude, longitude, and time. The MMSI is a unique, regulated, and coded identifier for a ship. The second quality control step was to remove all records with a missing or null MMSI. Next, we created a tabular relationship between dynamic SAIS information and static vessel information, using the MMSI as a primary key. We used ArcGIS (Environmental Systems Research Institute [ESRI], 1999–2018) geoprocessing and the programming language Python (Python Software Foundation, 1990–2019) running in PyScripter (Vlahos, 2005–2015) to write or modify numerous Python scripts.
The first script reprojected the point data into the Universal Transverse Mercator (UTM) Zone 10 North projection based on the Geographic Coordinate System (GCS) World Geodetic System (WGS) 1984, which allows distance to be measured in meters. AIS latitude and longitude are collected from a GPS receiver, which is based on GCS WGS 1984. The second Python script ran a spatial selection of only the SAIS points that were broadcasted from the water, and eliminated random error points located on land (Jensen et al., 2015). We added and calculated new fields for season and day/night based on the time stamp. Seasons were defined as Winter (January–March), Spring (April–June), Summer (July–September), and Autumn (October–December) (Forney and Barlow, 1998; Becker et al., 2014; Jensen et al., 2015). Day and night were defined by using published nautical twilight times from the United States Naval Observatory, Astronomical Applications Department for Forks, WA and Ocean Shores, WA for the years 2013 and 2014. The nautical twilight was defined per month by using the average time from the 15th of each month over the study area (Jensen et al., 2015).
We created ship transit line segments and evaluated transit contiguity (Jensen et al., 2015) by joining sequential SAIS data points from the same vessel to create straight line segments between these points. The time difference and distance between sequential points defined the calculated speed over ground (SOG). While reported SOG from terrestrial AIS systems has previously been used to evaluate threat of collision to cetaceans in coastal areas (van der Hoop et al., 2012; Conn and Silber, 2013), we chose to use a calculated SOG due to frequent gaps in SAIS data. Eriksen et al. (2018) used calculated SOG to identify SAIS records with large temporal or positional gaps, therefore unusable in analysis, by removing vessel transits with implausible speeds. We employed a similar approach (see below). The final part of the script evaluated transit contiguity, a single vessel on a continuous transit, based on MMSI, Trip ID, time between broadcasts, and heading difference.
We merged all 24 months’ of line segments and the 22 OCNMS-specified vessel types (see Table 2) together to create complete transit lines. We analyzed the years 2013 and 2014 together to simplify calculations, despite differences in overall mean vessel speeds. In 2013, 42.8% of the data were removed due to duplicate records, whereas this was only 5.8% for 2014. We conducted analyses at the vessel type level to minimize inherent inter-type vessel differences.
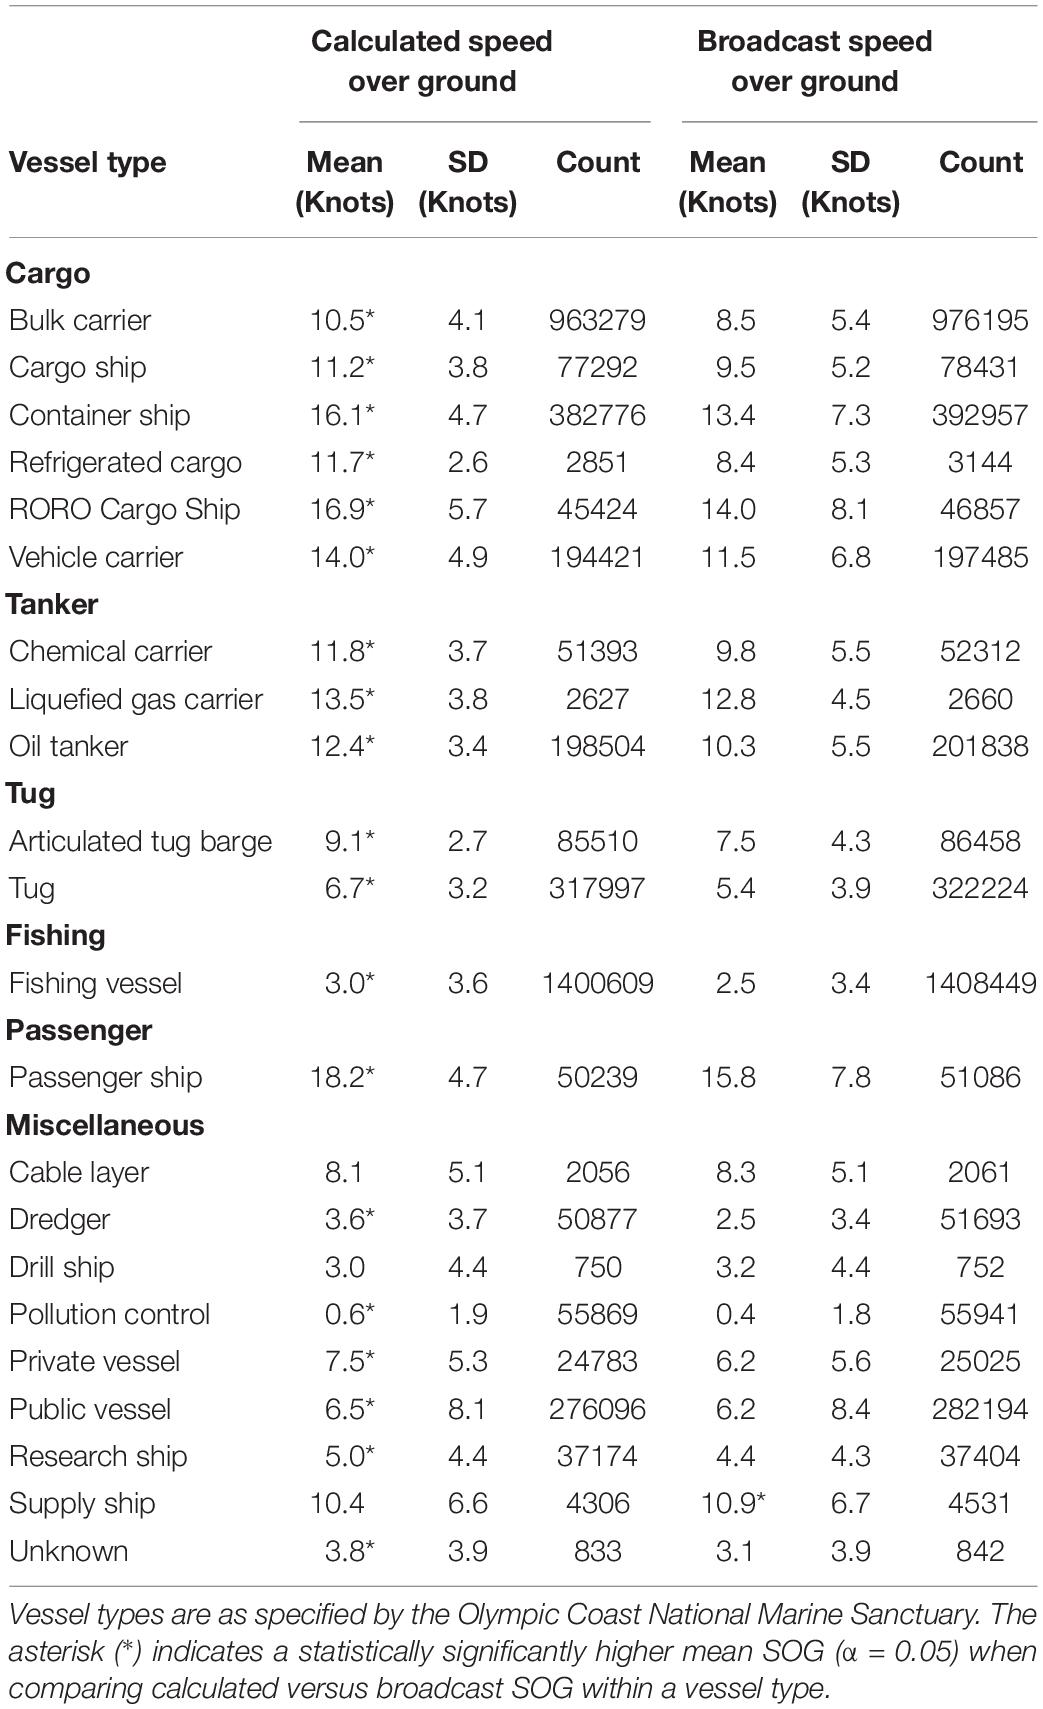
Table 2. Overall calculated and broadcast speed over ground (SOG) by vessel type for 2013 and 2014 combined.
Calculated Speed Truncation
Truncation of calculated SOG values, an attempt to enumerate the highest possible legitimate speed per vessel type, was necessary because of errors in the data or processing that led to implausible SOG values and means, common in SAIS data (Eriksen et al., 2018). The truncation threshold was an estimate of the maximum plausible and attainable speed for each vessel type. The maximum calculated speed of liquefied gas carriers, cable layers, and pollution control vessels were less than one knot under the truncation threshold. Furthermore, the three vessel types in the tanker category had identical truncation thresholds. Combined, these relative measures of accuracy and precision indicate that the truncation threshold method was a workable approximation for maximum speed.
Truncation meant removing any record where the calculated speed was greater than a given threshold from the following equation:
where TTα is the truncation threshold for vessel type α, is the mean non-0 broadcast SOG value for type α, and σα is the standard deviation of non-0 broadcast SOG values for type α. This equation was derived from examining histograms and statistics of broadcast SOG values and validated by expert opinion (G. Galasso, Deputy Superintendent, Olympic Coast National Marine Sanctuary, pers. comm.). The use of non-zero broadcast SOG values was necessary because 36.7% of all broadcast SOG values were zero, skewing the mean and inflating the standard deviation.
We overlaid vessel transit lines with truncated average speed values across a range of areas of interest. This included the entire space and time of the study area, and spatial subsets that included the OCNMS, ATBA, and the BIAs during active months. We examined temporal subsets that included day versus night and the four seasons. The overall truncation rate of 1.28% allowed the vast majority of data to be retained for further analysis. However, truncation was necessitated in almost 55,000 records, due to either anomalous location or time stamp broadcasts.
Several vessel types with the highest truncation thresholds (supply ship, container ship, roll-on/roll-off (RORO) cargo ship, and public vessel) also had some of the highest rates of data truncation (Supplementary Table S1). The source of these high rates of truncation and any possible correlation within SAIS is unclear.
Hexagon Average Speed and Density
The Olympic Coast NMS has used hexagons, one square statute mile or 2.6 square kilometers in area, as a unit of measurement or observation as part of their spatial planning process (N. Wright, Marine Geographer, Olympic Coast NMS, pers. comm.). There are 29,542 homogenous hexagons for the entire study area, including the ONMS. We calculated mean SOG and number of vessel transits per month for vessel transits across each hexagon that intersected the BIAs.
Results
Total Transits and Distance Traveled
The commercial ports of Vancouver, Seattle, Tacoma, and Portland drove much of the vessel traffic in the study area. Bulk carriers had the most cargo transits. Miscellaneous category vessels without private and public vessels accounted for a very small proportion of vessel transits and distance traveled.
The 42,629 sum total transits of all vessels in the years 2013 and 2014 covered 2,694,197 nm. Fishing vessels account for the most total vessel transits at 26.9%, followed by bulk carriers at 23.5% (Supplementary Table S2). The only other vessel type to have greater than 10% of the total transits is container ships (10.4%). Seasonally, as found in Jensen et al. (2015) outside San Francisco Bay, vessel speeds did not change overall, with the exception of passenger ships that traveled more slowly in the autumn and winter, although still at speeds greater than 15 knots (Supplementary Table S3).
The cargo category made up 41.7% of total transits, the most of any category. With the exception of public vessels and private vessels, most vessel types in the miscellaneous category registered very few transits. The remaining seven vessel types in the miscellaneous category only account for 2.2%. Vessels in the cargo and tanker categories averaged 27.7 transits per day.
Bulk carriers accounted for the most distance traveled by any one vessel type (32.0%). Only fishing vessels (16.8%) and container ships (13.2%) accounted for more than 10% of total distance traveled. Cargo category vessels traveled more than half (56.0%) of all distance traveled.
Overall Average Calculated SOG
Passenger ships, including ferries, showed the greatest average calculated SOG, 18.2 knots (Table 2). These were followed by RORO cargo ships (16.9 knots), container ships (16.1 knots), and vehicle carriers (14.0 knots). The five vessel types with the greatest average calculated SOG also had the five greatest average broadcast SOG. Supply ships were the only miscellaneous category vessel type to average greater than 10 knots (10.4 knots). Public vessels had the greatest variability of speeds, with a standard deviation of 8.1 knots, followed by supply ships (6.6 knots) and RORO cargo ships (5.7 knots).
With the exceptions of three vessel types (cable layer, drill ship, and supply ship), all vessel types had a greater calculated SOG than broadcast SOG. We tested if the calculated and broadcast speeds came from the same statistical population using both the parametric Welch t-Test and the non-parametric Mann-Whitney-Wilcoxon Test. Further, with the exception of four vessel types (fishing vessels, dredgers, pollution control, and research ships), all vessel types had an equal or greater broadcast SOG standard deviation than calculated SOG standard deviation (Table 2).
Biologically Important Areas
There are three feeding BIAs in the study area, each of which was transited by most vessel types (Figure 3). The areas of the BIAs most frequented by vessels were the western and northern regions of the humpback whale feeding BIA. The southeastern part of this BIA is inside the IMO-designated ATBA, which specifies an area that all ships greater than 400 gross tonnage should avoid for safety and environmental concerns. The shipping lanes entering and exiting the Strait of Juan de Fuca had the highest density of vessels. Vessels in the Grays Harbor and Northwest Washington feeding BIAs for gray whales were not as common, with the exception of the Strait of Juan de Fuca. Commercial vessels infrequently transited the Grays Harbor BIA.
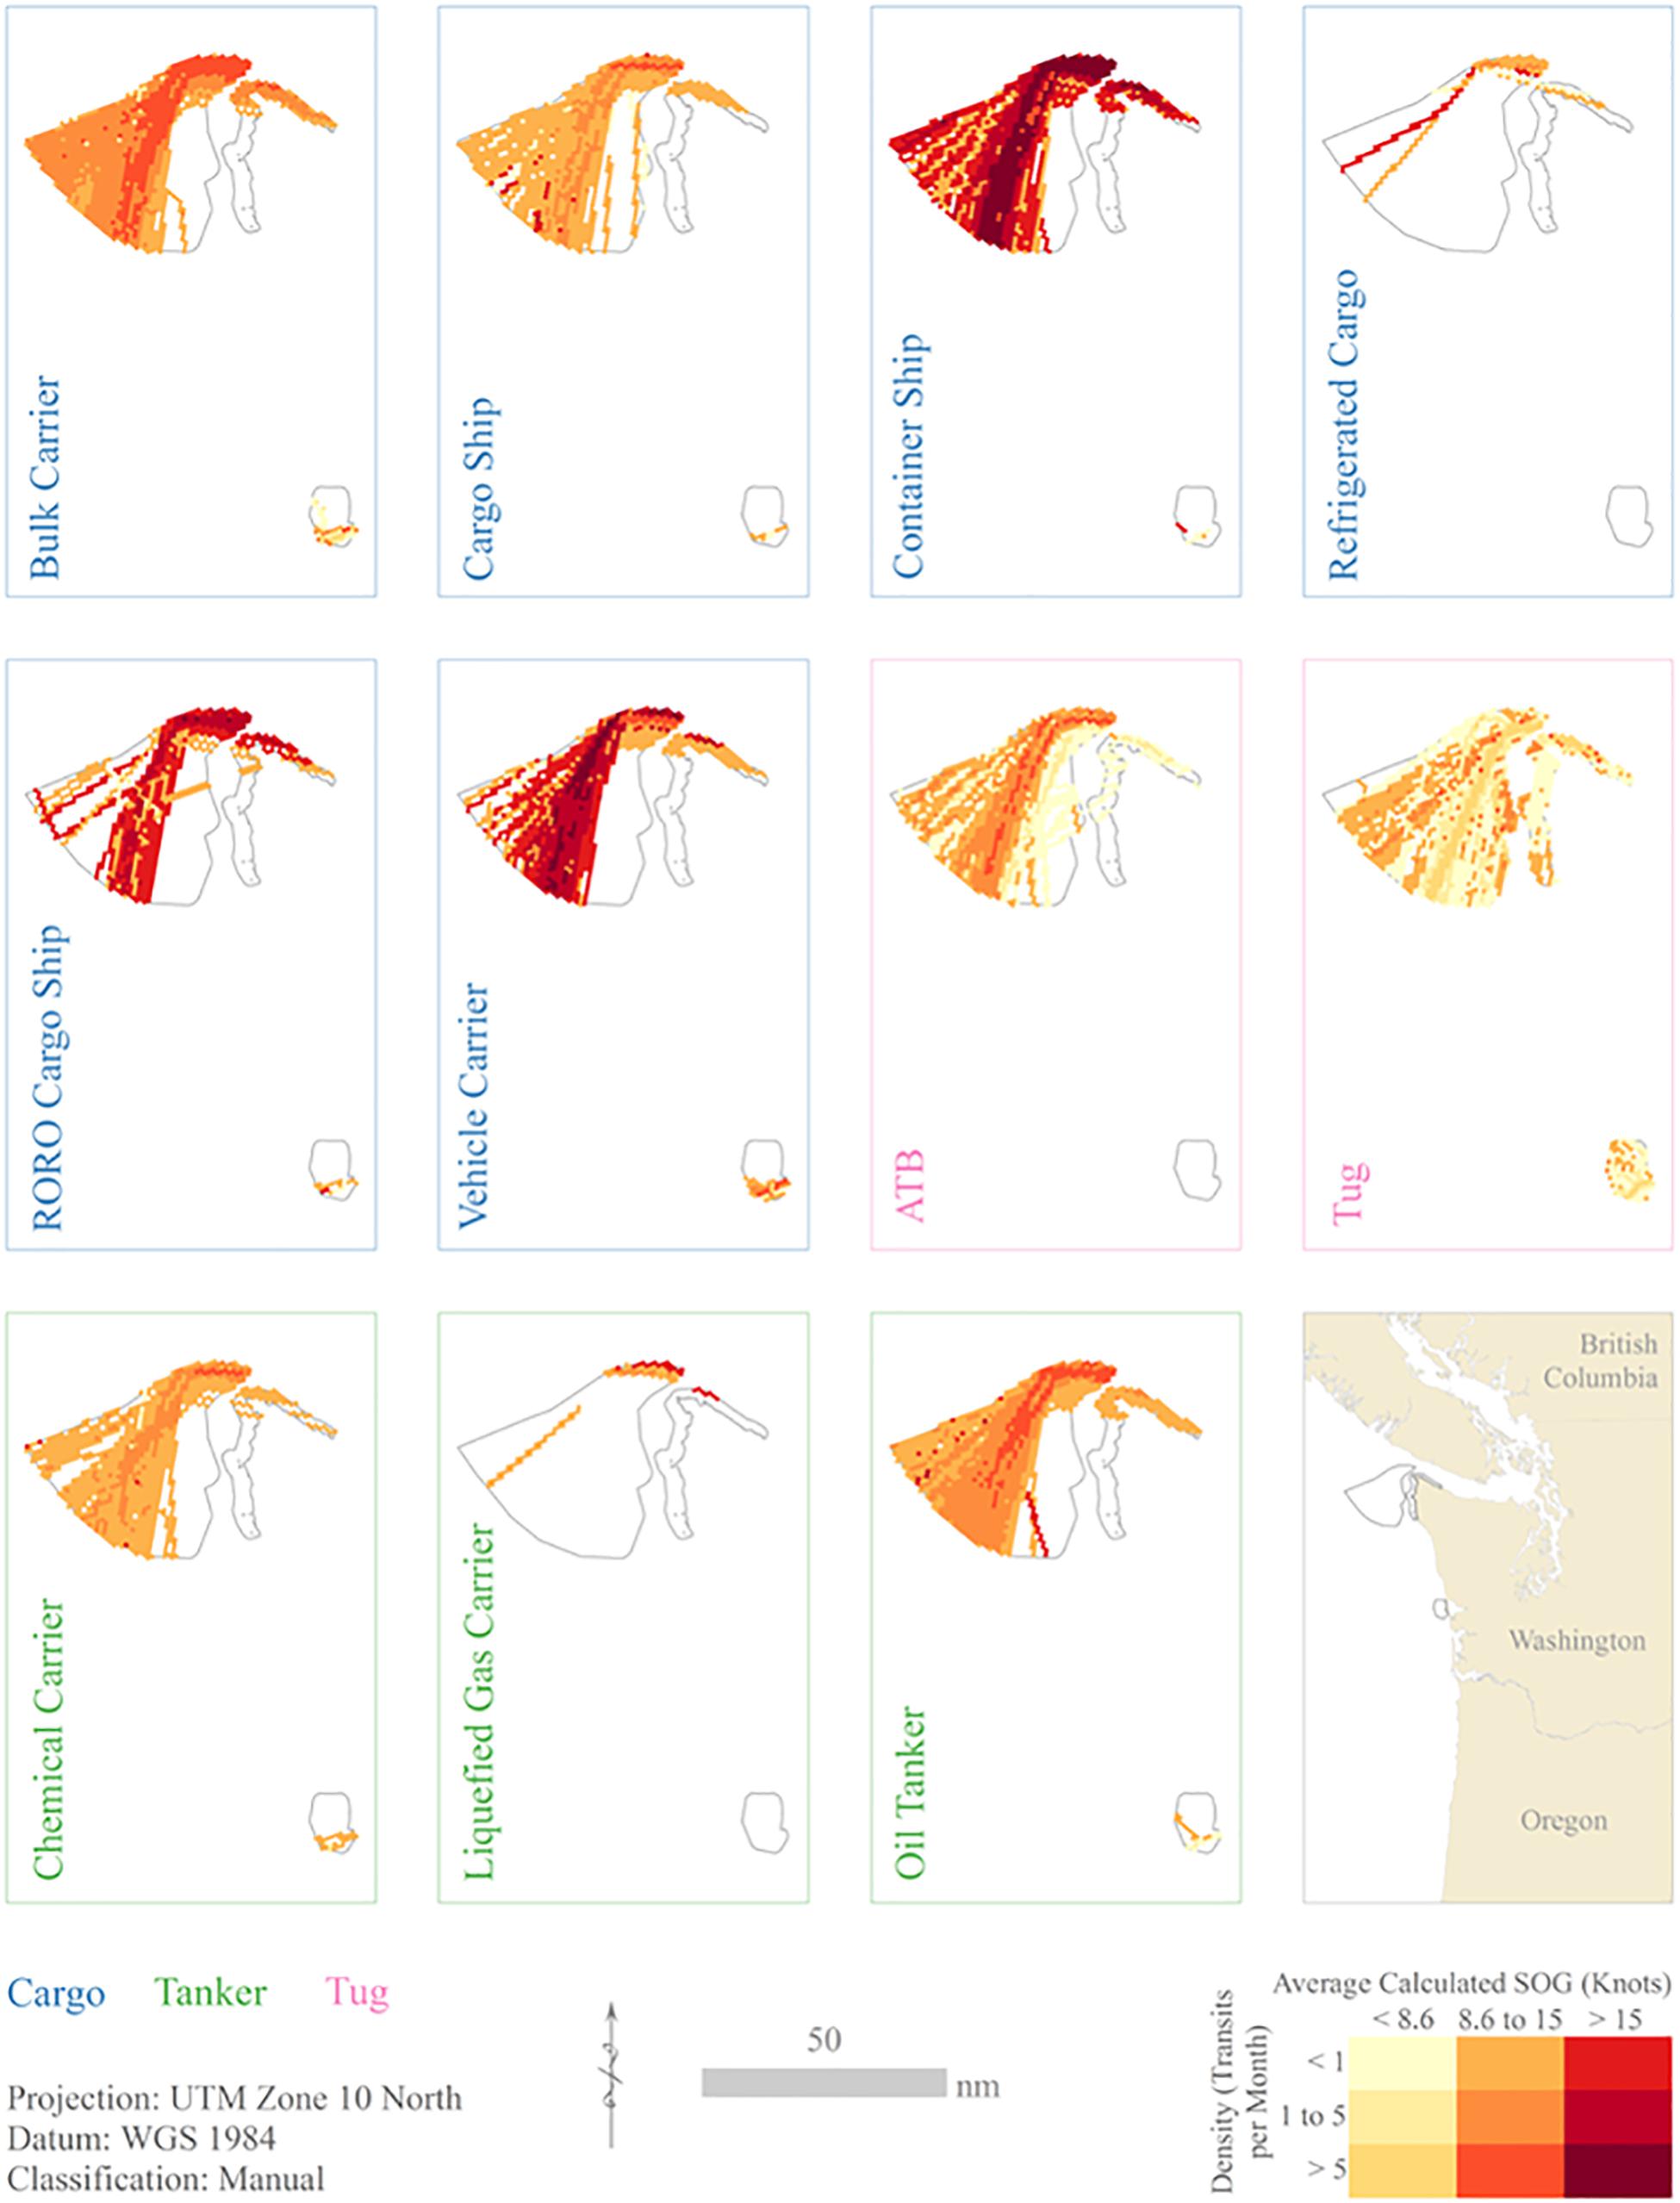
Figure 3. Average calculated speed over ground (SOG) and vessel transits per month in the feeding Biologically Important Areas (BIA) for gray and humpback whales for 2013 and 2014. Darker colors represent faster average speeds and more transits per month for each vessel type. The unit of observation is the square statute mile hexagon.
There were four gray whale migration BIAs within the study area. The Northbound Phase A, Northbound Phase B, and Southbound migration BIAs are located within eight-, five-, and ten-kilometer buffers of the coast, respectively. Due to this coastal proximity and the ATBA, there were relatively few vessels in any of these BIAs. However, the potential presence BIA extends 47 km from the coast and was transited by all vessel types (Figure 4). Fishing vessels, tugs, private vessels, public vessels, and research ships utilized the entire area, while most vessels in the cargo and tanker categories avoided the ATBA, which overlaps with a large portion of the central part of this BIA.
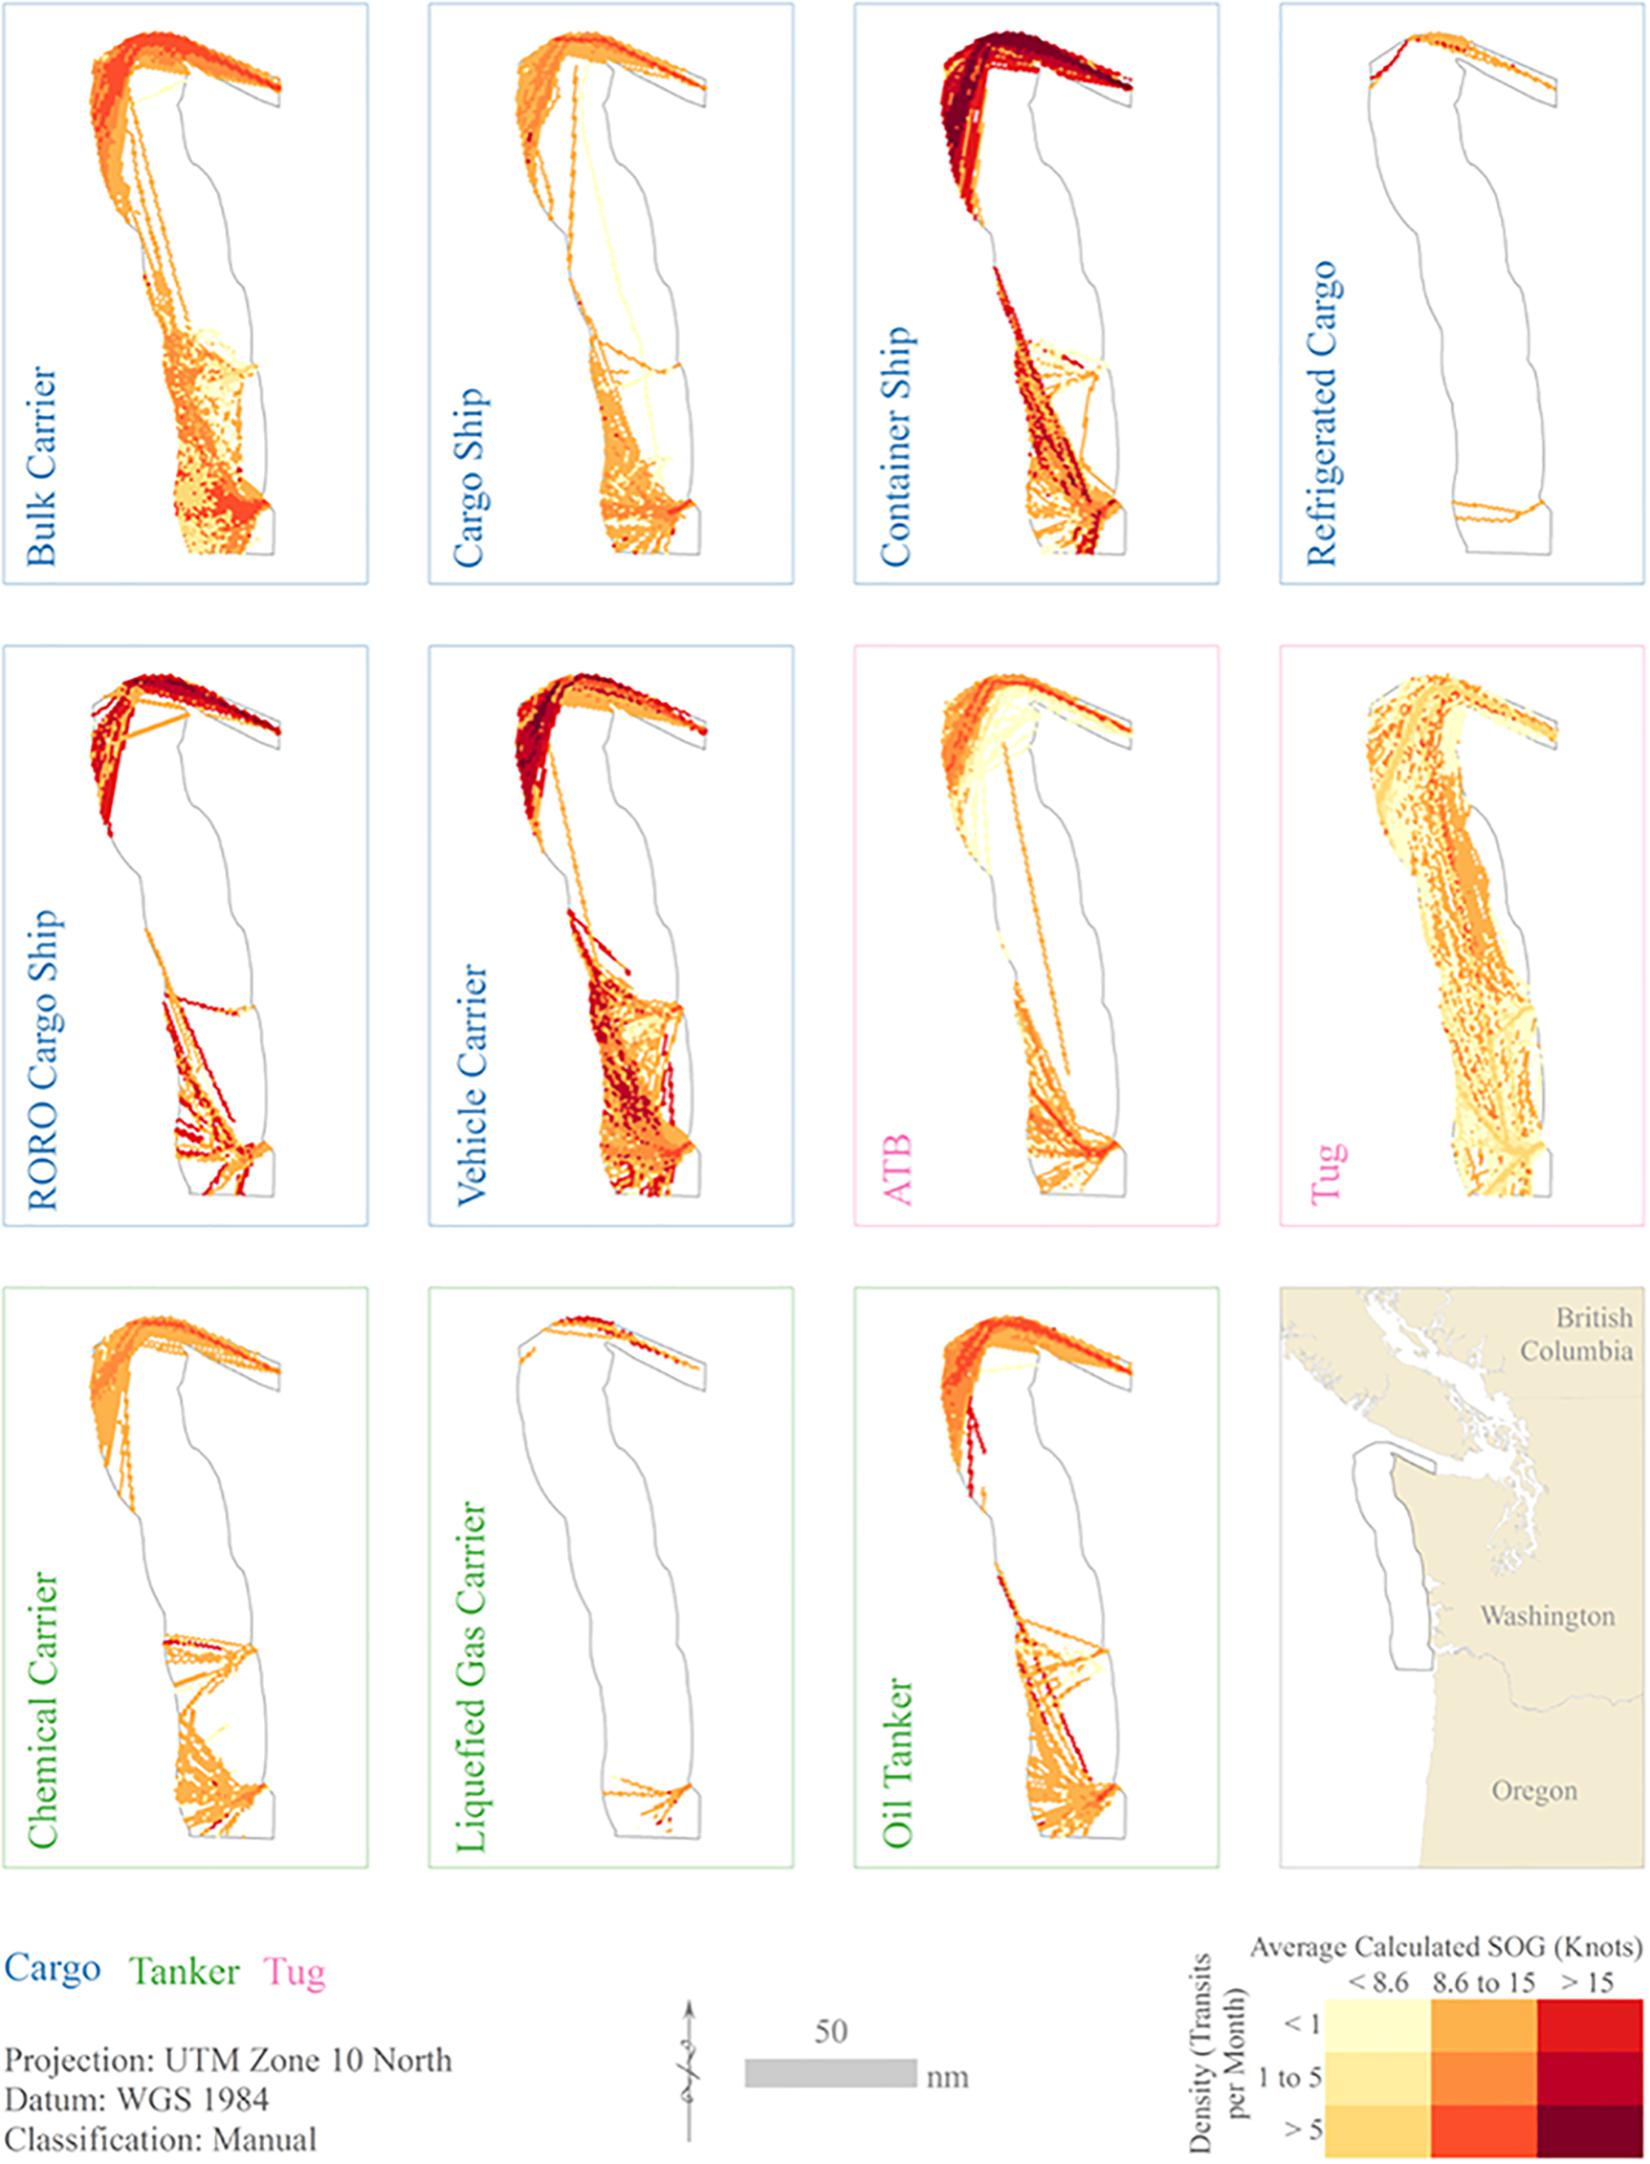
Figure 4. Average calculated speed over ground (SOG) and vessel transits per month in the gray whale potential presence Biologically Important Area (BIA) for 2013 and 2014. Darker colors represent faster average speeds and more transits per month for each vessel type. The unit of observation is the square statute mile hexagon.
Container ships had the greatest combined average SOG and density, particularly in the northern region of the BIA. The northern portion of the BIA at the mouth of or inside the Strait of Juan de Fuca had the highest densities of most vessel types. Drill ships and unknown vessel types were very uncommon in the potential presence BIA. Tugs and ATBs showed very different movement patterns. Tugs traversed the entire BIA, but ATBs followed the pattern of commercial vessels and avoided the ATBA.
A full tabular statistical summary for calculated SOG in the four BIAs analyzed can be found in Supplementary Table S4. Most transits for most vessel types across the BIAs occurred at less than 15 knots (Table 3). Notable exceptions were the fastest vessel types (container ship, RORO cargo ship, vehicle carrier, and passenger ship). Grays Harbor had the greatest proportion of vessel speeds below 15 knots. This BIA is just offshore, so vessels were likely approaching or leaving port at slower speeds.
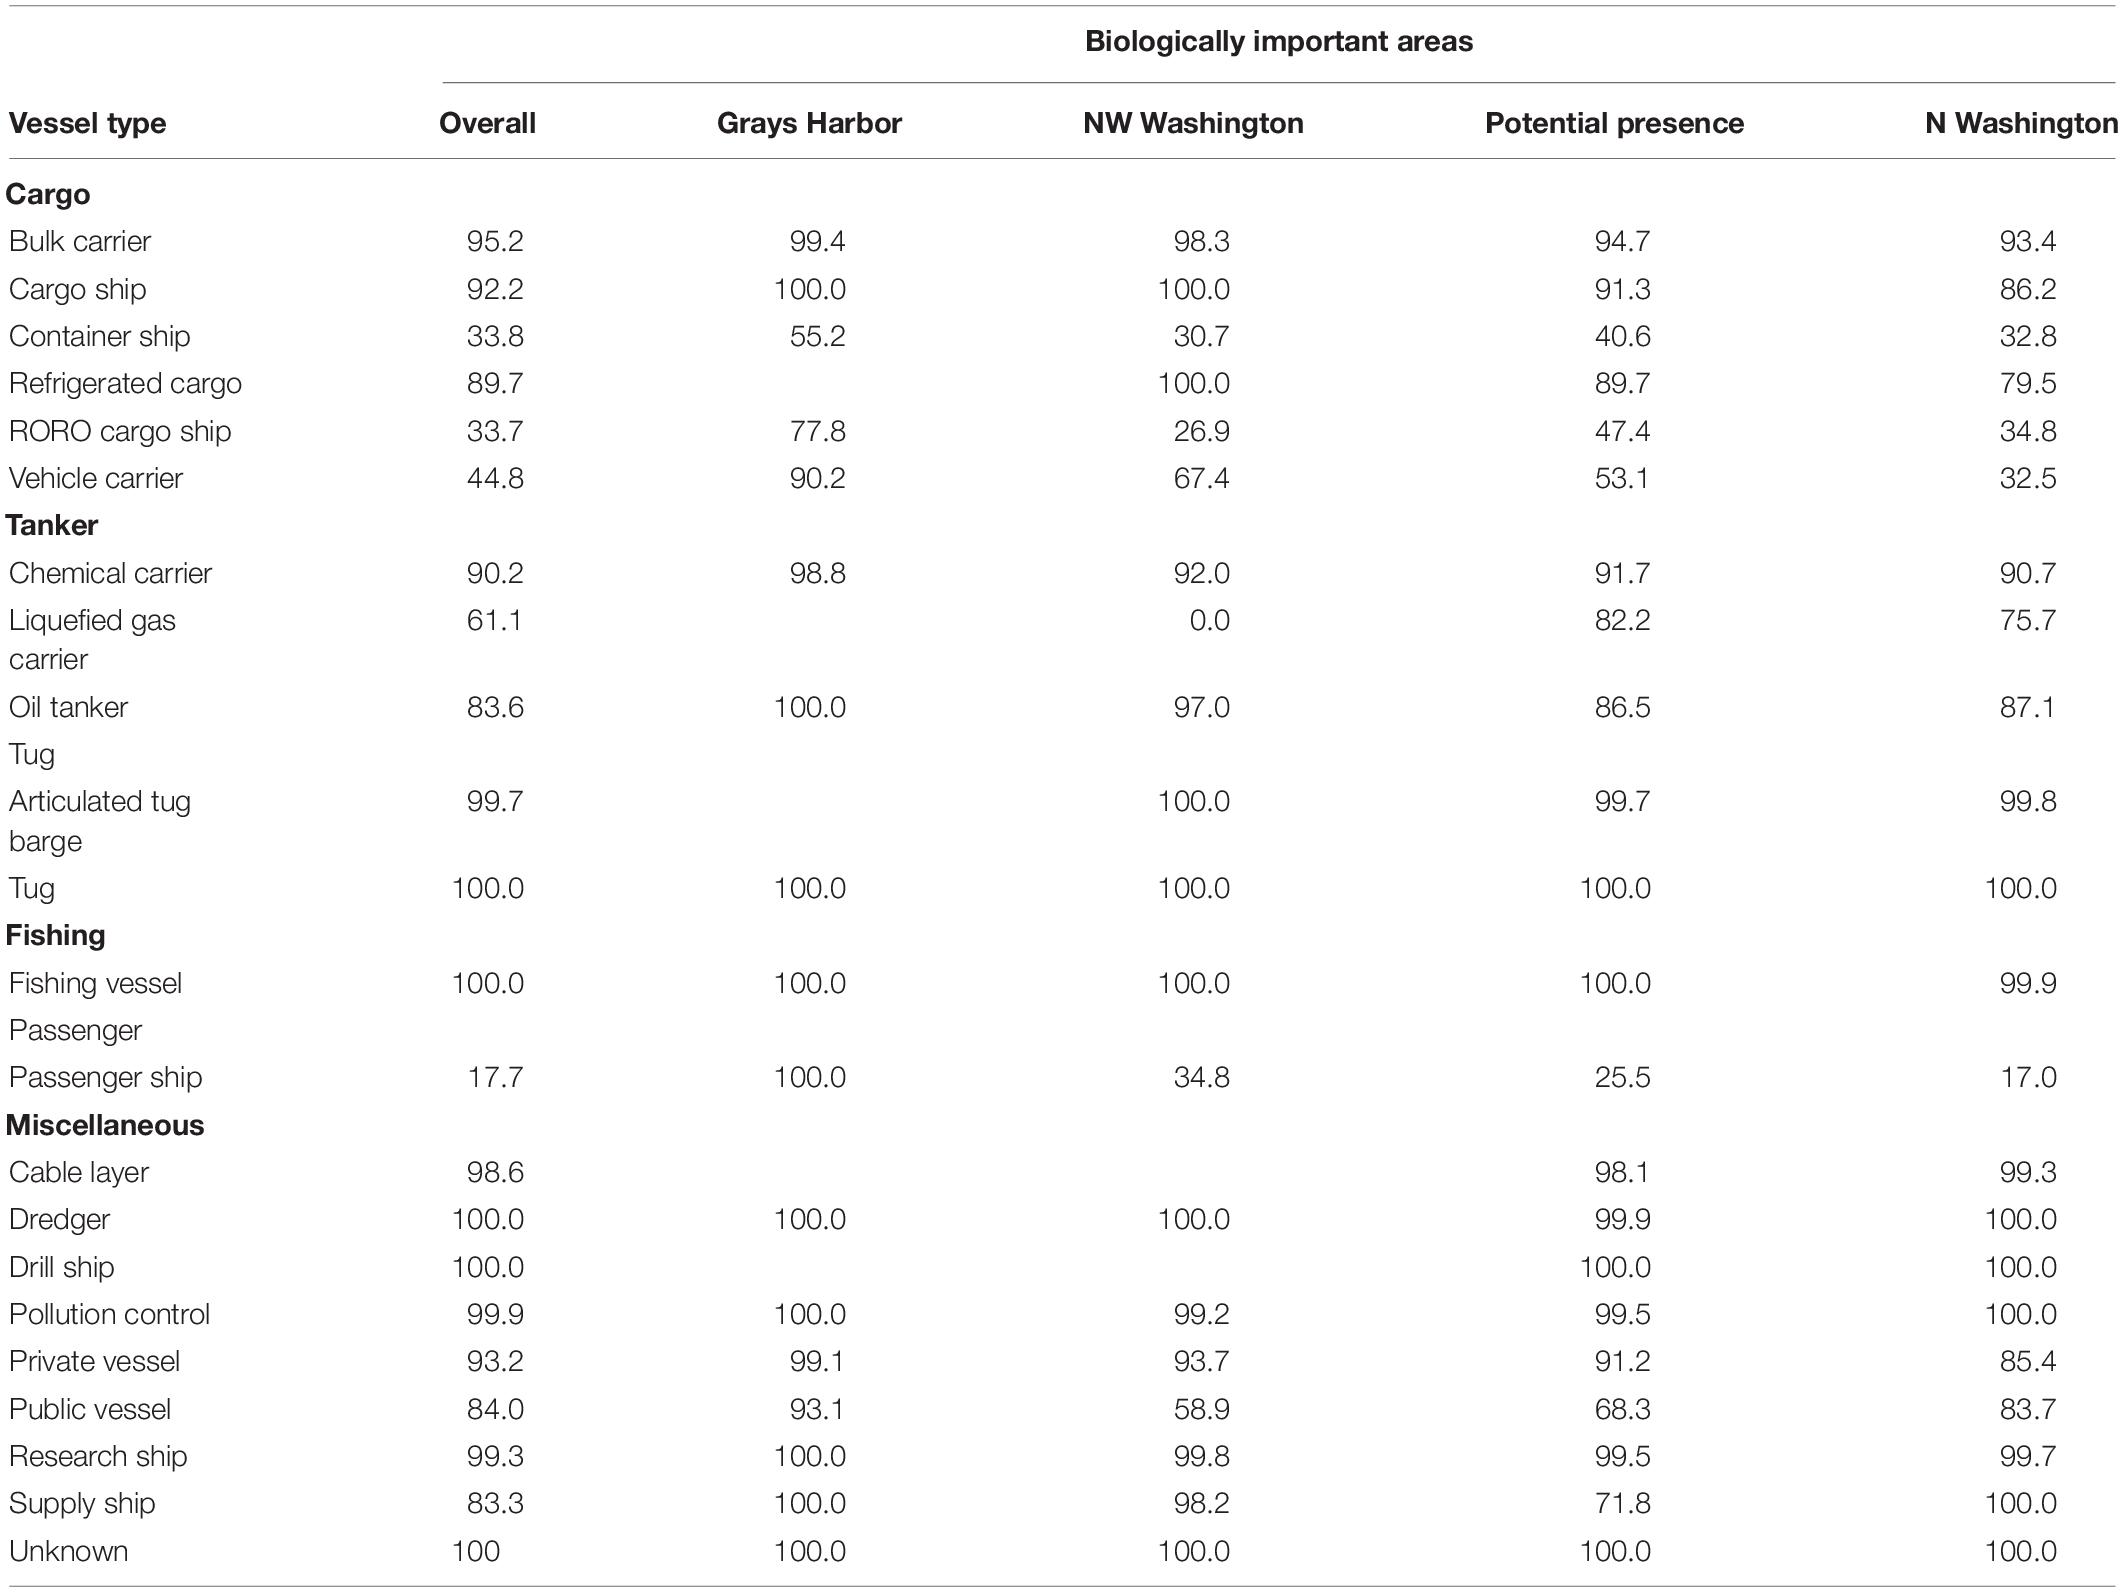
Table 3. Percent of calculated speed over ground (SOG) values less than 15 knots for the entire research area and within each of the Biologically Important Areas (BIA) for 2013 and 2014.
Discussion
Satellite AIS data are valuable for assessing broad-scale patterns of human activity in off-shore waters (Rowlands et al., 2019) and will likely grow in value and accessibility over time (McCauley et al., 2016), as the use of SAIS-derived data allows for vessel tracking much further from the coast than is possible with terrestrial receivers. By analyzing vessel density and speed using SAIS data, our contribution to the current understanding of cetacean collision risk assessment was two-fold. First, we broadly assessed vessel density and speed by vessel type and further narrowed the assessment within the active months of BIAs for local cetaceans. Second, we investigated issues related to the nature of SAIS data and their potential impact on its successful use for informing cetacean-vessel collision risk assessments in the future.
Overall Average Calculated Speed Over Ground
Most vessel types had a greater average calculated SOG than average broadcast SOG. It is important to use calculated SOG in any analysis so that the risk from potential vessel collisions is not underestimated by using broadcast SOG. Bulk carriers, cargo ships, refrigerated cargo, and chemical carriers had an average broadcast SOG less than 10 knots, but an average calculated SOG greater than 10 knots, the speed limit for North Atlantic right whale seasonal management areas (Laist et al., 2014). Similarly, container ships and RORO cargo ships crossed the 15 knot threshold when average calculated SOG was considered instead of average broadcast SOG. Exceeding these thresholds could have important management implications. More research is needed to document the difference between broadcast and calculated SOG when using SAIS data.
Container ships were one of the fastest and most common vessel types. Although passenger ships did not comprise a large proportion of transits or total distance, they were the fastest vessel type, and thus warrant special consideration in any potential future risk assessment. Fishing vessels and bulk carriers, the most common vessel types, had average calculated SOG less than or near the 10 knot speed restrictions that are commonly used in whale management areas (Laist et al., 2014). All other cargo and tanker ships had average calculated SOG values above 10 knots. Vessel categories that transited across the study area (cargo, tanker, and passenger) tended to have greater average speeds than those working within the study area (fishing, miscellaneous). These categories should warrant potentially differing policy and analysis considerations. Tugs and ATBs had characteristically different patterns, with more common tugs behaving like small vessels and less common ATBs behaving like larger cargo ships. ATBs are generally much larger than tugs, and are likely subject to ATBA restrictions.
Biologically Important Areas
The northern-most portion of the BIAs had the highest concentration of vessel traffic and the fastest average vessel speeds. The Northern Washington feeding BIA for humpback whales had the greatest number of transits among the feeding BIAs, due to its location just offshore of the TSS. While this BIA does not extend north of the United States EEZ to cover the shipping lanes between the Strait of Juan de Fuca and Alaska and Asia, it does overlap the shipping lanes toward the United States West Coast and Hawaii. The Northwest Washington feeding BIA for gray whales was infrequently transited, as it is located close to shore. The Grays Harbor feeding BIA for gray whales was transited most commonly by tugs, fishing, public, and private vessels. Commercial traffic in this area was uncommon.
The potential presence migration BIA for gray whales is spatially extensive and located from the mouth of the Strait of Juan de Fuca south along the coast, and was transited by all vessel types. The majority of large, commercial vessels abided by the ATBA restrictions. Notable vessel types inside the ATBA were tug, public, private, research, and fishing vessels. Each of these vessel types had a low average calculated SOG. The other gray whale migration BIAs are located within several kilometers of the coast (Figure 2). Exploratory analyses showed relatively few vessels transits in these areas, so they were not considered for further analysis.
The BIAs were designated solely within the United States EEZ and do not cross international boundaries (Calambokidis et al., 2015). However, the shipping routes between the Strait of Juan de Fuca and Asia and Alaska continue north and west of the United States EEZ, in an area with frequent humpback whale sightings (Calambokidis et al., 2015). The study area extended to cover Canadian waters, and vessel speed and density remain high in the shipping routes extending toward Asia and Alaska (dark red in Figure 5). We recommend that future analyses or management planning concerning whales or vessel traffic, including risk analyses, should be considered a transboundary effort.

Figure 5. Container ship calculated speed over ground (SOG) and transits per month for 2013 and 2014. The area northwest of the blue Exclusive Economic Zone (EEZ) exhibits high vessel speed and density, although it was not included in the Biologically Important Area (BIA) designations.
Marine Spatial Planning
Using AIS in the risk analysis process is one potential tool in marine management (Wiley et al., 2013). Marine Spatial Planning (MSP) is designed as an adaptive spatial planning process to help manage current and future human activities in the marine environment to meet a variety of objectives and minimize user-user and user-environment interactions by engaging multiple stakeholders (Ehler and Douvere, 2007; Ehler, 2008; Foley et al., 2010; Redfern et al., 2013). Recent examples of successful MSP for cetacean protection are the shifts in the TSS outside Boston, Massachusetts, and San Francisco Bay, California (Wiley et al., 2013; United States Coast Guard [USCG], 2013). The scientific processes used stakeholder involvement throughout, created numerous alternatives, showed how challenges can help the process, and used AIS to evaluate and monitor results (Wiley et al., 2013).
Since AIS is an international standard (Tetreault, 2005), the SAIS data that were provided crossed jurisdictional boundaries along the border with Canada. Off the coast of British Columbia, risk to several species of cetaceans has been investigated (Williams and O’Hara, 2010). The findings of the present research, including calculated SOG and SAIS data, should be important considerations in any MSP processes off the coast of the state of Washington and British Columbia in Canada. The SAIS data, within its limitations and at small scale, are an effective means to delineate areas of high use for vessel traffic, even across international boundaries. Calculating vessel speed is critical to avoid underestimating vessel speed and the probability of a lethal vessel and cetacean collision.
Limitations
One of the main limitations of this research is the temporal resolution of the available SAIS data. The ability to precisely track vessel movement decreases with increasing time between sequential points. Vessels can potentially transit around corners, but large amounts of time between SAIS broadcasts can make transit lines appear to cut those corners. This is evident in many vessel types on the northwestern tip of the Olympic Peninsula and the near-shore BIAs (see Figure 6 as an example). This introduces the potential for a vessel to appear to cross a BIA when in fact it did not. The TSS, controlled by the USCG and used by vessels for insurance and accident coverage purposes, never intersects the Northwest Washington BIA. However, the TSS circumnavigates this BIA, and it is therefore possible that a vessel remaining in the TSS could appear to transit through the BIA. This results in calculated transits across the BIA, sometimes at high SOG, that never actually occurred. The other BIAs, the TSS, ATBA, and OCNMS are also susceptible to this limitation.
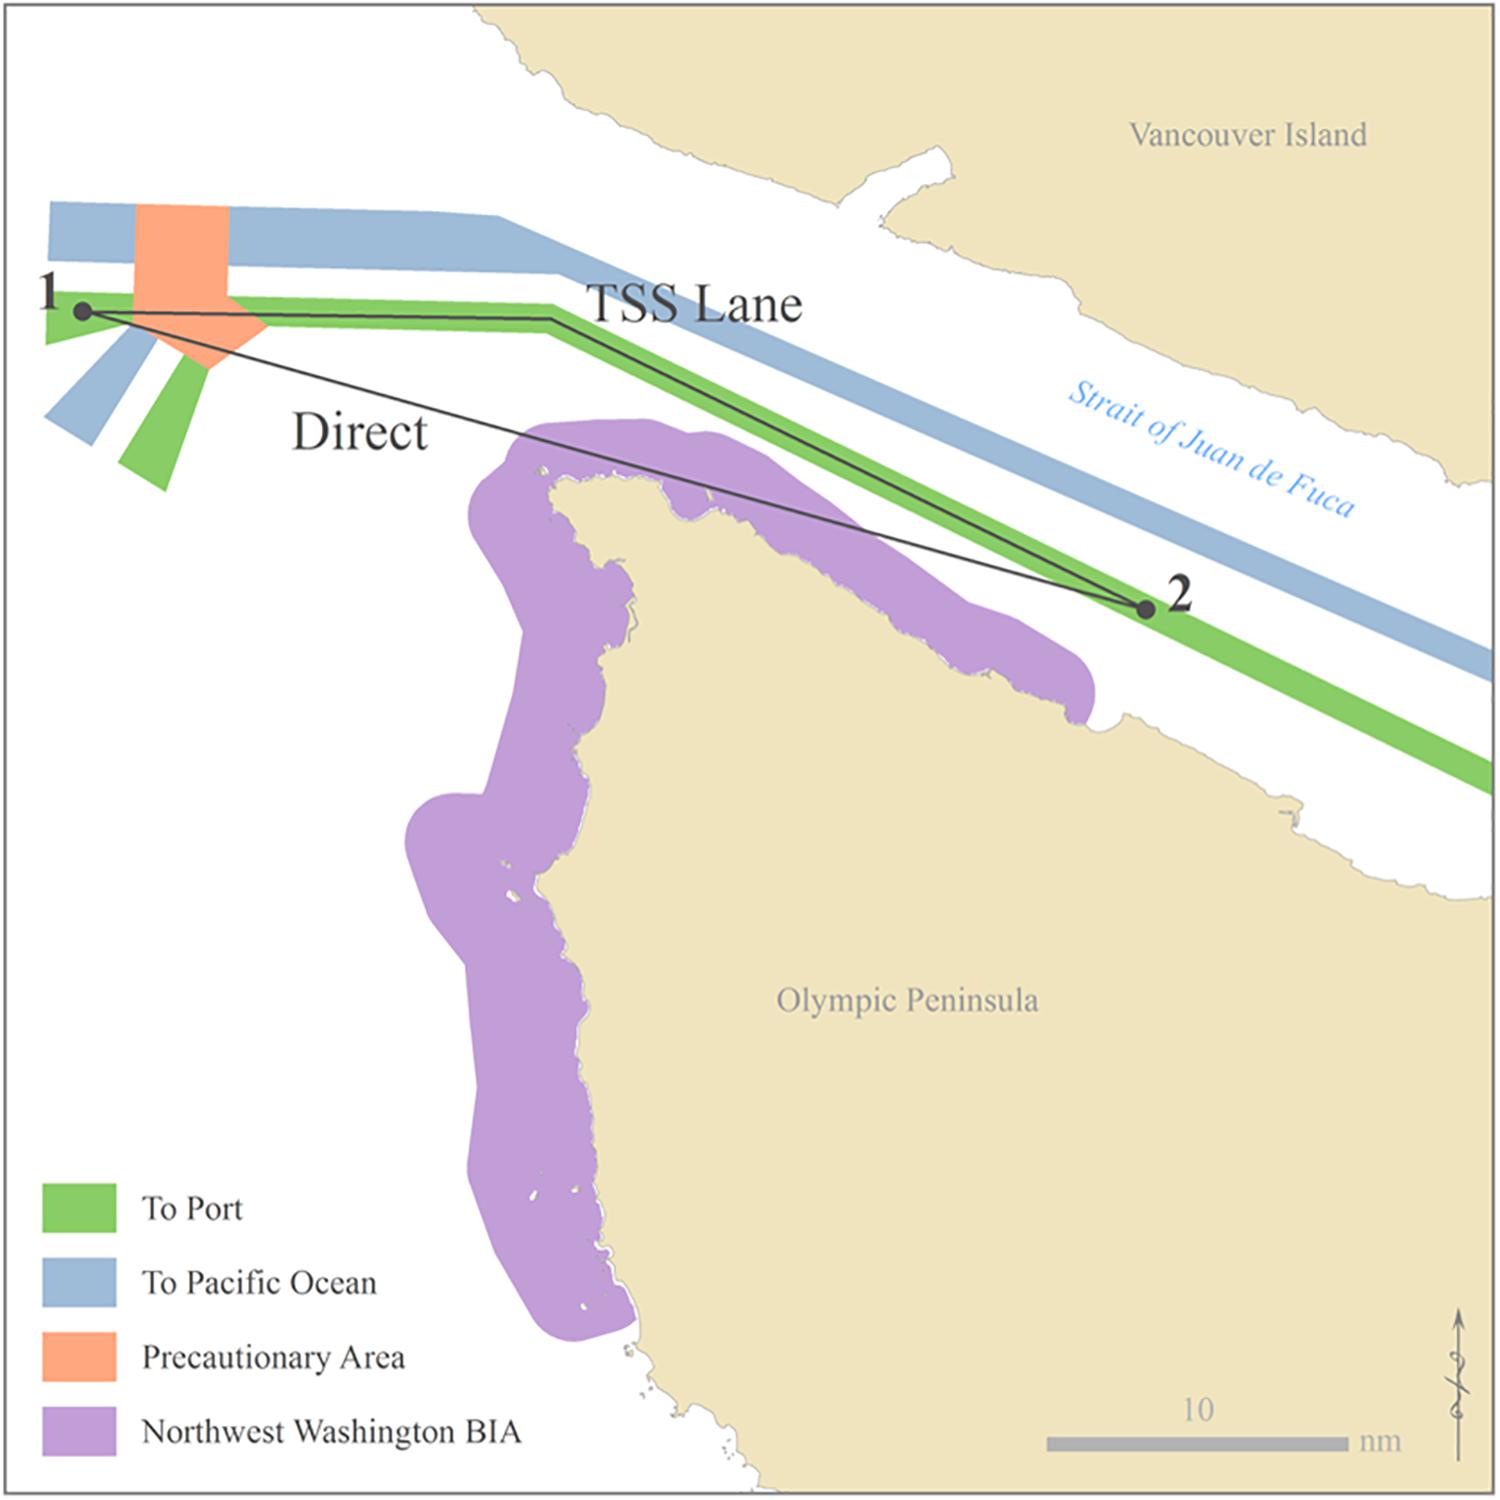
Figure 6. Potential vessel transit lines cutting across the Northwest Washington Biologically Important Area (BIA) due to temporal gaps between sequential points in the SAIS data, (1) and (2). The vessel could actually remain inside the Traffic Separation Scheme (TSS), but could appear to cut across the BIA, leading to false transits.
Since the shortest distance between two points is a line and the time between points remains identical despite the actual path taken, the calculated SOG, while faster than broadcast SOG, is still a systematic underestimation of true SOG, assuming random GPS error. As distance increases for a vessel to traverse around a corner and time remains the same, speed also must increase. Using the example in Figure 6, the TSS lane distance and speed are greater than the direct distance and speed between points 1 and 2. Although we may be overestimating the number of transits through some administrative areas, this would be associated with an underestimation of SOG. Most vessels are required to broadcast every few seconds while under way using engine, but the time gap between SAIS records is frequently on the order of minutes or hours. The uncertainty in vessel path is unknown, but will increase with path sinuosity.
As an emerging technology, current SAIS presents tremendous opportunities for research, but caution should be used and uncertainty addressed when using this technology for large scale applications. Temporal gaps in vessel transits add uncertainty to transit path and calculated SOG that was not quantified in this research. Duplicate records accounted for 42.8% of total SAIS records for the year 2013. Broadcast SOG values were zero in 36.7% of all records. There were numerous time, location, and missing value errors that had to be addressed prior to data analysis. Units of measurement for vessel length were also not consistent. These factors cast into question the reliability of individual values and the present quality of SAIS data as a whole, and add uncertainty to automated aggregate calculations. SAIS data in its current state should not be used in a policy enforcement context or for documenting individual presence or absence in an administrative area at large scale. However, SAIS data can be helpful to assess general or overall compliance within an area of interest. As calculated SOG is an underestimation of true vessel speed, SAIS can be helpful in documenting minimum vessel speeds across large geographic areas, especially beyond the reach of terrestrial AIS receivers. SAIS is useful in examining vessel density at broad scales, and could be used to assess basin-wide open ocean routes. Future additional satellite platforms with AIS receivers will only increase the quality of SAIS data and decrease the amount of temporal gaps. This will open potential research questions involving larger scale questions of specific areas.
Data Availability Statement
The datasets generated for this study are available on request to the corresponding author.
Author Contributions
NG conducted the analysis and led the project. All authors listed have made a substantial, direct and intellectual contribution to the work, and approved it for publication.
Conflict of Interest
The authors declare that the research was conducted in the absence of any commercial or financial relationships that could be construed as a potential conflict of interest.
Acknowledgments
We would like to thank the following people for the integral roles they played in this process. Their ideas, insights, and material support made this research possible. T. J. Moore, the scripts you wrote to create transit lines from point AIS data and calculate speed over ground were a fundamental component of this research. Nancy Wright and George Galasso, NOAA Olympic Coast National Marine Sanctuary, for providing the data necessary for this project, and for your support and consultation. John Berge, Pacific Merchant Shipping Association and Cpt. John Veentjer, Marine Exchange of Puget Sound, for insight into the shipping industry.
Supplementary Material
The Supplementary Material for this article can be found online at: https://www.frontiersin.org/articles/10.3389/fmars.2020.00109/full#supplementary-material
References
Aarsæther, K. G., and Moan, T. (2009). Estimating navigation patterns from AIS. J. Navig. 62, 587–607. doi: 10.1017/s0373463309990129
Allen, A. S., Yurk, H., Vagle, S., Pilkington, J., and Canessa, R. (2018). The underwater acoustic environment at Sgaan kinghlas-bowie seamount marine protected area: characterizing vessel traffic and associated noise using satellite AIS and acoustic datasets. Mar. Pollut. Bull. 128, 82–88. doi: 10.1016/j.marpolbul.2018.01.014
Ball, H. (2013). Satellite AIS for Dummies, Special Edition. Mississauga. Ontario: John Wiley & Sons Canada, Ltd.
Becker, E. A., Forney, K. A., Foley, D. G., Smith, R. C., Moore, T. J., and Barlow, J. (2014). Predicting seasonal density patterns of California cetaceans based on habitat models. Endanger. Species Res. 23, 1–22. doi: 10.3354/esr00548
Calambokidis, J., Steiger, G. H., Curtice, C., Harrison, J., Ferguson, M. C., Becker, E., et al. (2015). Biologically Important Areas for Selected Cetaceans within US Waters – West Coast Region. Aquat. Mamm. 41, 39–53. doi: 10.1578/am.41.1.2015.39
Calder, B., and Schwehr, K. (2009). “Traffic analysis for the calibration of risk assessment methods,” in Proceedings of the U.S. Hydrographic Conference, Norfolk, VA.
Cates, K., DeMaster, D. P., Brownell, R. L. Jr., Silber, G., Gende, S., et al. (2017). Strategi Plan to Mitigate the Impacts of Ship Strikes on Cetacean Populations: 2017-2020. IWC Strategic Plan to Mitigate Ship Strikes. Available online at: https://iwc.int/ship-strikes (accessed January 2, 2020).
Conn, P. B., and Silber, G. K. (2013). Vessel speed restrictions reduce risk of collision-related mortality for North Atlantic right whales. Ecosphere 4:43.
Currie, J. J., Stack, S. H., and Kaufman, G. D. (2017). Modelling whale-vessel encounters: the role of speed in mitigating collisions with humpback whales (Megaptera novaeangliae). J. Cetacean Res. Manag. 17, 57–63.
de Souza, E. N., Boerder, K., Matwin, S., and Worm, B. (2016). Improving fishing pattern detection from satellite AIS using data mining and machine learning. PLoS One 11:e0163760. doi: 10.1371/journal.pone.0163760
Douglas, A. B., Calambokidis, J., Raverty, S., Jeffries, S. J., Lambourn, D. M., and Norman, S. A. (2008). Incidence of ship strikes of large whales in Washington State. J. Mar. Biolog. Assoc. U.K. 88, 1121–1132. doi: 10.1017/s0025315408000295
Ehler, C. (2008). Conclusions: benefits, lessons learned, and future challenges of marine spatial planning. Mar. Policy 32, 840–843. doi: 10.1016/j.marpol.2008.03.014
Ehler, C., and Douvere, F. (2007). Visions for a Sea Change. Report of the First International workshop on Marine Spatial Planning. Intergovernmental Oceanographic Commission and Man and the Biosphere Programme. IOC Manual and Guides, 46: ICAM Dossier, 3. Paris: UNESCO.
Environmental Protection Agency [EPA], (2010). Designation of North American Emission Control Area to Reduce Emissions from Ships. Office of Transportation and Air Quality. Regulatory Announcement EPA-420-F-10–015. Washington, DC: EPA.
Environmental Systems Research Institute [ESRI], (1999–2018). ArcGIS 10.X for Desktop. Redlands, CA: ESRI.
Eriksen, T., Greidanus, H., and Delaney, C. (2018). Metrics and provider-based results for completeness and temporal resolution of satellite-based AIS services. Mar. Policy 93, 80–92. doi: 10.1016/j.marpol.2018.03.028
Felski, A., Jaskólski, K., and Banyś, P. (2015). Comprehensive assessment of automatic Identification System (AIS) data application to anti-collision manoeuvring. J. Navig. 68, 697–717. doi: 10.1017/s0373463314000897
Ferguson, M. C., Curtice, C., Harrison, J., and Van Parijs, S. M. (2015). Biologically important areas for cetaceans within us waters – overview and rationale. Aquat. Mamm. 41, 2–16. doi: 10.1578/am.41.1.2015.2
Foley, M. M., Halpern, B. S., Micheli, F., Armsby, M. H., Caldwell, M. R., Crain, C. M., et al. (2010). Guiding ecological principles for marine spatial planning. Mar. Policy 34, 955–966. doi: 10.1002/eap.1469
Forney, K. A., and Barlow, J. (1998). Seasonal patterns in the abundance and distribution of California cetaceans, 1991-1992. Mar. Mamm. Sci. 14, 460–489. doi: 10.1111/j.1748-7692.1998.tb00737.x
Frisk, G. V. (2012). Noiseonomics: the relationship between ambient noise levels in the sea and global economic trends. Sci. Rep. 2:437. doi: 10.1038/srep00437
Gende, S. M., Hendrix, A. N., Harris, K. R., Eichenlaub, B., Nielsen, J., and Pyare, S. (2011). A Bayesian approach for understanding the role of ship speed in whale-ship encounters. Ecol. Appl. 21, 2232–2240. doi: 10.1890/10-1965.1
International Maritime Organization [IMO], (2019). Sulphur Oxides (SOx) and Particulate Matter (PM) – Regulation 14. Available at: http://www.imo.org/en/OurWork/Environment/PollutionPrevention/AirPollution/Pages/Sulphur-oxides-%28SOx%29-%E2%80%93-Regulation-14.aspx (accessed November 26, 2019).
Jensen, C. M., Hines, E., Holzman, B. A., Moore, T. J., Jahncke, J., and Redfern, J. V. (2015). Spatial and temporal variability in shipping traffic off San Francisco, California. Coast. Manag. 43, 575–588. doi: 10.1080/08920753.2015.1086947
Jia, H., Smith, T., and Prakash, V. (2019). Estimating vessel payloads in bulk shipping using AIS data. IJSTL 11:25. doi: 10.1504/IJSTL.2019.096864
Laist, D. W., Knowlton, A. R., and Pendleton, D. (2014). Effectiveness of mandatory vessel speed limits for protecting North Atlantic right whales. Endanger. Species Res. 23, 133–147. doi: 10.3354/esr00586
McCauley, D. J., Woods, P., Sullivan, B., Bergman, B., Jablonicky, C., Roan, A., et al. (2016). Ending hide and seek at sea. Science 351, 1148–1150. doi: 10.1126/science.aad5686
McGillivary, P. A., Schwehr, K. D., and Fall, K. (2009). “Enhancing AIS to improve whale-ship collision avoidance and maritime security,” in Proceedings of the OCEANS 2009, MTS/IEEE Biloxi - Marine Technology for Our Future: Global and Local Challenges, Biloxi, MS, 1–8.
Moore, T. J., Redfern, J. V., Carver, M., Hastings, S., Adams, J. D., and Silber, G. K. (2018). Exploring ship traffic variability off California. Ocean Coast. Manage. 163, 515–527. doi: 10.1016/j.ocecoaman.2018.03.010
Natale, F., Gibin, M., Alessandrini, A., Vespe, M., and Paulrud, A. (2015). Mapping fishing effort through AIS data. PLoS One 10:e0130746. doi: 10.1371/journal.pone.0130746
National Oceanic and Atmospheric Administration [NOAA], (2019). 2019-2020 Gray Whale Unusual Mortality Event Along the West Coast. Available at: https://www.fisheries.noaa.gov/national/marine-life-distress/2019-gray-whale-unusual-mortality-event-along-west-coast (accessed November 26, 2019).
Port Metro Vancouver, (2017). Statistics Overview, Decision Support Services. Available online at: https://www.portvancouver.com/wp-content/uploads/2018/03/2017-Stats-Overview-1.pdf (accessed January 2, 2020).
Redfern, J. V., McKenna, M. F., Moore, T. J., Calambokidis, J., DeAngelis, M. L., Becker, E. A., et al. (2013). Assessing the risk of ships striking large whales in marine spatial planning. Cons. Biol. 27, 292–302. doi: 10.1111/cobi.12029
Robards, M. D., Gilber, G. K., Adams, J. D., Arroyo, J., Lorenzini, D., Schwehr, K., et al. (2016). Conservation science and policy applications of the marine vessel automatic identification system (AIS)–a review. Bull. Mar. Sci. 92, 75–103. doi: 10.5343/bms.2015.1034
Rockwood, R., Calambokidis, J., and Jahncke, J. (2017). High mortality of blue, humpback and fin whales from modeling of vessel collisions on the U.S. West Coast suggests population impacts and insufficient protection. PLoS One 12:183052. doi: 10.1371/journal.pone.0183052
Rodrigue, J. (2010). Maritime transportation: drivers for the shipping and port industries. Paper Commissioned for the Experts’ Session on Innovation and the Future of Transport (Paris: International Transport Forum).
Rowlands, G., Brown, J., Soule, B., Boluda, P. T., and Rogers, A. D. (2019). Satellite surveillance of fishing vessel activity in the ascension island exclusive economic zone and marine protected area. Mar. Policy 101, 39–50. doi: 10.1016/j.marpol.2018.11.006
Schwehr, K. D., and McGillivary, P. A. (2007). “Marine ship automatic identification system (ais) for enhanced coastal security capabilities: an oil spill tracking application,” in Proceedings of the IEEE. OCEANS 2007, Vancouver, BC. doi: 10.1109/OCEANS.2007.4449285
Silber, G. K., Adams, J. D., and Fonnesbeck, C. J. (2014). Compliance with vessel speed restrictions to protect North Atlantic right whales. PeerJ 2:e399. doi: 10.7717/peerj.399
Silber, G. K., and Bettridge, S. (2010). Vessel Operations in Right Whale Protection Areas in 2009. NOAA Technical Memorandum NMFS-OPR-44. Silver Spring, MD: NOAA.
Silber, G. K., Slutsky, J., and Bettridgea, S. (2010). Hydrodynamics of a ship/whale collision. J. Exp. Mar. Biol. Ecol. 391, 10–19. doi: 10.1016/j.jembe.2010.05.013
Skauen, A. N. (2019). Ship tracking results from state-of-the-art space-based AIS receiver systems for maritime surveillance. CEAS Space J. 11, 301–316. doi: 10.1007/s12567-019-00245-z
Tetreault, B. J. (2005). Use of automatic identification system (AIS) for maritime domain awareness (MDA). Oceans Proc. IEEE 2, 1590–1594.
United States Army Corps of Engineers [USACE], (2015). US Waterborne Container Traffic by Port/Waterway in 2013. New Orleans, LO: Waterborne Commerce Statistics Center.
United States Army Corps of Engineers [USACE], (2016). Tonnage for Selected US Ports in 2014. New Orleans, LO: Waterborne Commerce Statistics Center.
United States Coast Guard [USCG], (2008). The Nationwide Automatic Identification System Increment One (I-1) Resource Guide. Washington, DC: USCG.
United States Coast Guard [USCG], (2013). Changes to Offshore Traffic Separation Schemes off San Francisco Bay. Coast Guard District Eleven, Local Notice to Mariners 16/2013. Washington, DC: USCG.
United States Fish and Wildlife Service [USFWS], (2016). Endangered and Threatened Wildlife and Plants; Identification of 14 Distinct Population Segments of the Humpback Whale and Revision of Species-Wide Listing. 81 FR. 62259. Washington, DC: USFWS.
van der Hoop, J. M., Vanderlaan, A. S. M., and Taggart, C. T. (2012). Absolute probability estimates of lethal vessel strikes to North Atlantic right whales in Roseway Basin, Scotian Shelf. Ecol. Appl. 22, 2021–2033. doi: 10.1890/11-1841.1
Vanderlaan, A. S. M., and Taggart, C. T. (2007). Vessel collisions with whales: the probability of lethal injury based on vessel speed. Mar. Mamm. Sci. 23, 144–156. doi: 10.1111/j.1748-7692.2006.00098.x
Wiley, D., Hatch, L., Thompson, M., Schwehr, K., and MacDonald, C. (2013). Marine Sanctuaries and Marine Planning: Protecting endangered marine life. Proc. Mar. Saf. Secur. Counc. 70, 10–15.
Wiley, D., Thompson, M., Pace, R. M. III, and Levenson, J. (2011). Modeling speed restrictions to mitigate lethal collisions between ships and whales in the Stellwagen Bank National Marine Sanctuary, USA. Biol. Conserv. 144, 2377–2381. doi: 10.1016/j.biocon.2011.05.007
Williams, R., Gero, S., Bejder, L., Calambokidis, J., Kraus, S. D., Lusseau, D., et al. (2011). Underestimating the damage: interpreting cetacean carcass recoveries in the context of the Deepwater Horizon/BP incident. Conserv. Lett. 4, 228–233. doi: 10.1111/j.1755-263x.2011.00168.x
Keywords: satellite automatic identification system, cetacean ship strikes, geographic information systems, olympic coast national marine sanctuary, baleen whales, biologically important areas, shipping speed
Citation: Greig NC, Hines EM, Cope S and Liu X (2020) Using Satellite AIS to Analyze Vessel Speeds Off the Coast of Washington State, U.S., as a Risk Analysis for Cetacean-Vessel Collisions. Front. Mar. Sci. 7:109. doi: 10.3389/fmars.2020.00109
Received: 17 March 2019; Accepted: 10 February 2020;
Published: 28 February 2020.
Edited by:
David Peel, Commonwealth Scientific and Industrial Research Organisation (CSIRO), AustraliaReviewed by:
Natalie Kelly, Australian Antarctic Division, AustraliaJens Currie, Pacific Whale Foundation, United States
Copyright © 2020 Greig, Hines, Cope and Liu. This is an open-access article distributed under the terms of the Creative Commons Attribution License (CC BY). The use, distribution or reproduction in other forums is permitted, provided the original author(s) and the copyright owner(s) are credited and that the original publication in this journal is cited, in accordance with accepted academic practice. No use, distribution or reproduction is permitted which does not comply with these terms.
*Correspondence: Ellen M. Hines, ZWhpbmVzQHNmc3UuZWR1