 Tamara M. Frank
 Charles D. Fine2
 Tracey T. Sutton
95% of researchers rate our articles as excellent or good
Learn more about the work of our research integrity team to safeguard the quality of each article we publish.
Find out more
ORIGINAL RESEARCH article
Front. Mar. Sci. , 21 February 2020
Sec. Deep-Sea Environments and Ecology
Volume 7 - 2020 | https://doi.org/10.3389/fmars.2020.00099
This article is part of the Research Topic Deep Pelagic Ecosystem Dynamics in a Highly Impacted Water Column: The Gulf of Mexico After Deepwater Horizon View all 14 articles
The vertical and horizontal distributions of Euphausiacea in the northern Gulf of Mexico (GOM), including the location of the Deepwater Horizon oil spill, were analyzed from 340 trawl samples collected between April and June 2011. This study is the first comprehensive survey of euphausiid distributions from depths deeper than 1000 m in the GOM and includes stratified sampling from five discrete depth ranges (0–200 m, 200–600 m, 600–1000 m, 1000–1200 m, and 1200–1500 m), and expands the depth ranges of 30 species. In addition, this study demonstrates significantly higher abundance and biomass of the euphausiid assemblage from slope vs. offshore stations, while the offshore assemblage was significantly more diverse. There is also some evidence for seasonality in reproduction amongst the seven species that had gravid females. Lastly, these data represent the first quantification of the euphausiid assemblage in the region heavily impacted by the Deepwater Horizon event, and as there are no pre-spill data, may serve as an impacted baseline against which to monitor changes in the euphausiid assemblage in the years following exposure to Deepwater Horizon oil and dispersants in the water column.
Euphausiids are pelagic crustaceans that range in size from mesozooplankton (0.2 μm to 2 mm), macrozooplankton (2–20 mm), and actively swimming micronekton (20–200 mm) (Omori and Ikeda, 1984; Sutton, 2013). They are a vital part of the food web as they consume phytoplankton and zooplankton (Kinsey and Hopkins, 1994; Atkinson et al., 2009) and are in turn consumed by larger organisms including seabirds (Deagle et al., 2007), commercially important fish species such as tuna (Jayalakshmi et al., 2011), whales (Schramm, 2007), and humans (Baker et al., 1990). Euphausiacea are also important because most of them undergo diel vertical migrations, in which they remain in deeper waters during the day to avoid visual predators, and ascend 100 s of meters into shallower waters at sunset to feed under the cover of darkness (reviewed in Cohen and Forward, 2009). This behavior means that not only are they potential prey for a variety of different organisms at multiple depth levels but are also vectors for the vertical transport of both carbon and pollutants through the water column.
The current study is unique because it utilizes samples collected simultaneously from 0 to 1500 m water depth within five discrete depth ranges. Previous studies of euphausiids in the Gulf of Mexico (GOM) did not extend past 1000 m (Kinsey and Hopkins, 1994; Gasca et al., 2001). When Burghart et al. (2007) collected samples of Decapoda, Lophogastrida and Mysida from depths greater than 1000 m in the eastern GOM, they found that the bathypelagic zone was dominated by different species than those that dominated in the mesopelagic zone. They found an additional 10 species of oplophorids present below 1000 m, that were not known to occur in the GOM. Their study also demonstrated that several species thought to be relatively rare based on collections shallower than 1000 m (Hopkins et al., 1989) were actually quite common in the deeper depths, such as the oplophorids Acanthephyra stylorostratis and Hymenodora glacialis. The Burghart et al. study emphasized the need to extend these studies to the Euphausiacea, one of the dominant groups of crustaceans in the GOM (Kinsey and Hopkins, 1994; Burdett et al., 2017).
In addition, this study sampled sites at boundary zones along the continental slope. While these boundary zones along continental margins are found in oceanic ecosystems worldwide, there are few studies on the micronektonic composition on both sides of these boundary zones, most of which focused on fish species with limited information on crustaceans (Reid et al., 1991; Aguzzi and Company, 2010; Sutton, 2013; Feagans-Bartow and Sutton, 2014). The data presented here will provide vital information needed to understand the community structure and relationships between species found at these boundary regions and adjacent oceanic systems.
The trawling sites for this study encompassed the region most heavily impacted by the Deepwater Horizon oil spill, resulting from the explosion on the Deepwater Horizon rig on April 20, 2010. This damaged rig discharged 3.19 million barrels of oil into the northeastern GOM before it was capped in July, with the deepest hydrocarbon plume occurring at 1100 m (Reddy et al., 2011; US District Court, 2015). This spill caused the crash of several local fisheries and coastal ecosystems (Gulfbase.org, 2012) and a recent study on deep-sea crustaceans in the family Oplophoridae demonstrated a significant decrease in their biomass and abundance between 2011 (1 year after the spill) and 2017 (7 years after the spill) (Nichols, 2018). The data presented here, collected 1 year after the spill, represent the first quantification of the euphausiid assemblage in this region and will serve as the initial impacted baseline against which to monitor temporal changes in the assemblage in studies conducted 5–10 years after the spill.
Samples were collected from April through June 2011 on the M/V Meg Skansi in the northern GOM (Figure 1) with a 10-m2 mouth area, six-net MOCNESS (Multiple Opening and Closing Net and Environmental Sensing System) (Wiebe et al., 1976) with 3-mm mesh nets. Sampling was standardized at five discrete depth ranges from 0 to 1500 m, except in locations where depths did not reach 1500 m. Sampling depths were chosen based on the following rationales, developed during the NOAA-supported Offshore Nekton Sampling and Analysis Program (ONSAP): net 1 (1500–1200 m) fished below the depth at which a subsurface hydrocarbon plume was detected after the oil spill, net 2 (1200–1000 m) fished through the hydrocarbon plume (Reddy et al., 2011), net 3 (1000–600 m) fished where many of the vertical migrators reside during the day, net 4 (600–200 m) was at depths that vertical migrators pass through during their diel vertical migrations and net 5 (200–0 m) fished the epipelagic zone where strong vertical migrators are found at night. Samples were collected twice during each 24-h cycle, resulting in one “day” trawl and one “night” trawl at each station. A total of 340 discrete depth samples were collected from 45 stations. The samples were fixed in 10% buffered formalin in seawater and transported to the Deep-sea Biology lab at Nova Southeastern University, where all the euphausiids were identified to the lowest taxonomic classification possible, using the Baker et al. (1990) euphausiid key. The body lengths of up to 25 individuals (some samples contained less than 25 individuals) of each species in each sample were measured with digital calipers (CO030150 electronic digital caliper, Marathon Management). After taxonomic identification, wet weights for each species in every sample were recorded to the nearest 0.01 g (P-114 Balance, Denver Instruments). As the volume of water filtered by each net in each trawl varied, these data were standardized by dividing the combined species counts (N) or biomass (g) by the total volume filtered (m3) for the respective net.
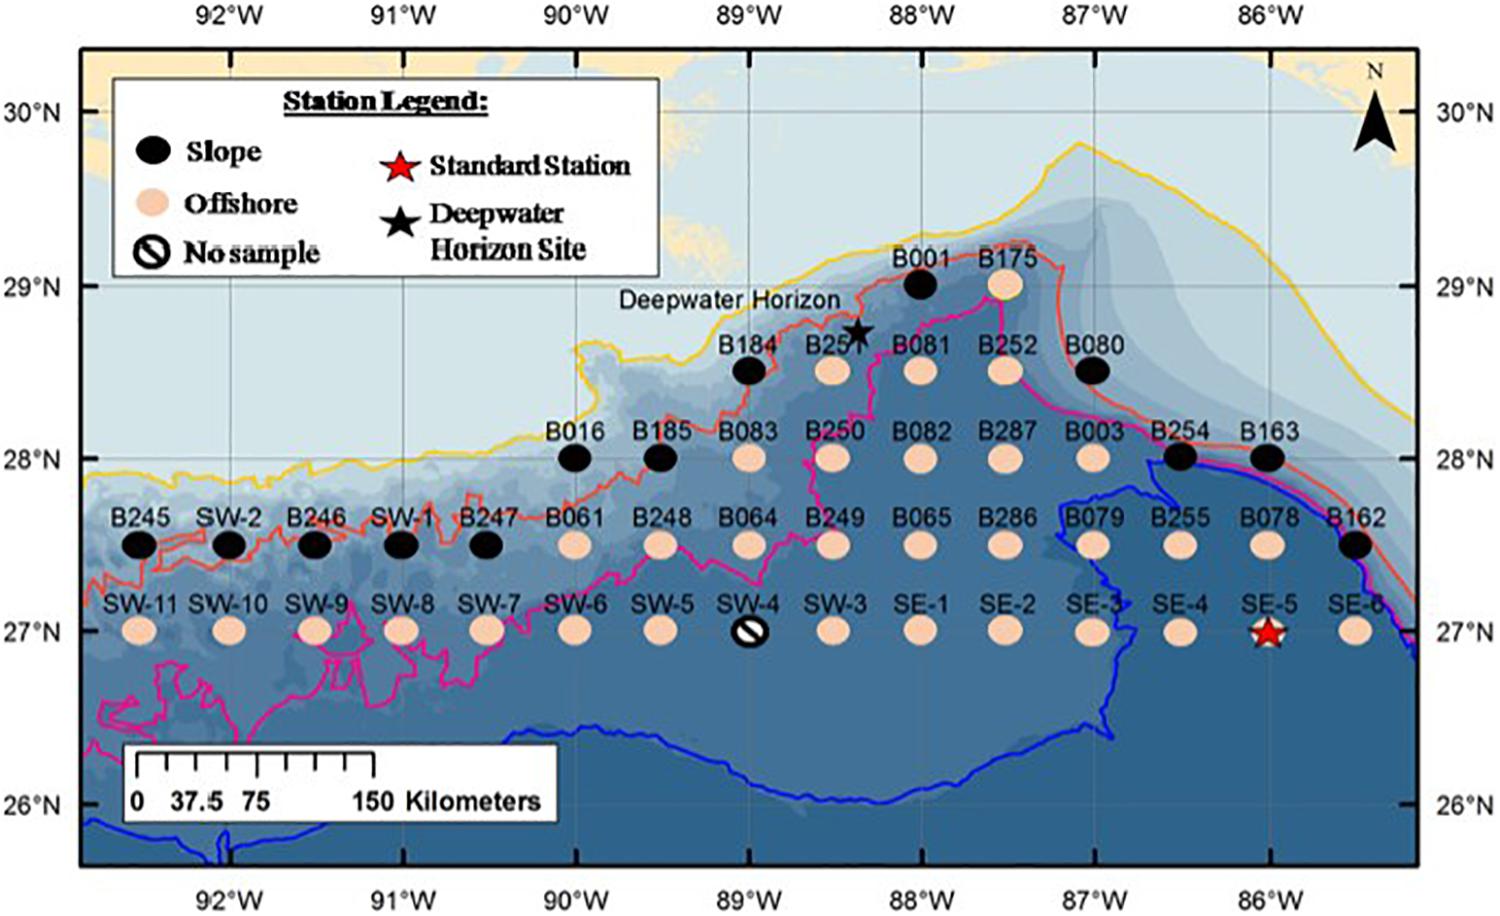
Figure 1. Sampling stations of the M/V Meg Skansi cruise from April to June showing slope and offshore station divisions. The orange line is the 1000 m isobath. Stations on or to the landward size of this line (black circles) were considered slope stations; stations on the seaward side of this line (pink circles) were considered offshore stations. Black star indicates Deepwater Horizon oil rig. Red star indicates Standard Station (Kinsey and Hopkins, 1994). Figure is from Burdett et al. (2017), used with permission from the Bulletin of Marine Science.
The stations sampled were a subset of the Southeast Area Monitoring and Assessment Program (SEAMAP) sampling grid (Eldridge, 1988), bound by the 1000-m isobath to the north and the 27°N latitudinal line to the south. Stations were divided into two groups and listed as either slope or offshore (Figure 1). Those stations that were on or adjacent to the 1000-m isobath, where trawls down to 1500 m were not possible, were categorized as slope stations and trawled down to their maximum depth. Stations that were located on the seaward side of the isobath where trawls down to 1500 m were possible, were categorized as offshore stations. To compare slope assemblages of euphausiids with offshore assemblages, species data from all the trawls in one area were combined; i.e., data from all slope stations (n = 13) were combined to compare with data from all offshore stations (n = 32). Standard Station (27°N, 86°W), where extensive sampling of euphausiids was conducted in the 1990s (Kinsey and Hopkins, 1994), coincided with Sampling Station SE-5.
Euphausiids were ranked in descending order of abundance with the most abundant species having a rank of 1, for both slope and offshore assemblages. A Spearman’s rank comparison was completed to determine if there were significant differences between slope and offshore euphausiid assemblages. As the data were not normally distributed (Shapiro-Wilk test), Mann-Whitney U tests were utilized to determine if there were significant differences between abundance and biomass as well as individual species’ abundances for slope vs. offshore assemblages.
Species richness (S), evenness (J’), calculated with Pielou’s Evenness Index equation, and diversity (H’), calculated with the Shannon Diversity Index equation were calculated for every depth range and time period sampled within either slope or offshore assemblages (Hill, 1973). Independent sample t-tests were then performed on the Shannon Diversity Indices as per Jayaraman (1999) and Aguzzi et al. (2015). All analyses and graphs were performed with the analyses package and graphing options available in Excel.
Species whose abundance was >1% to the total euphausiid abundance were characterized as abundant species, and collectively, they made up 99% of the euphausiid abundance. Species that contributed less than 1% to the total abundance were characterized as rare species (Figure 2). Only the abundant species were analyzed with respect to their vertical distributions, as there were enough individuals present (over 100 per species) for meaningful analyses. The standardized abundance (N m–3) was determined for each species, and the percentage of the assemblage at every depth range and time period sampled within either slope or offshore assemblages was calculated.
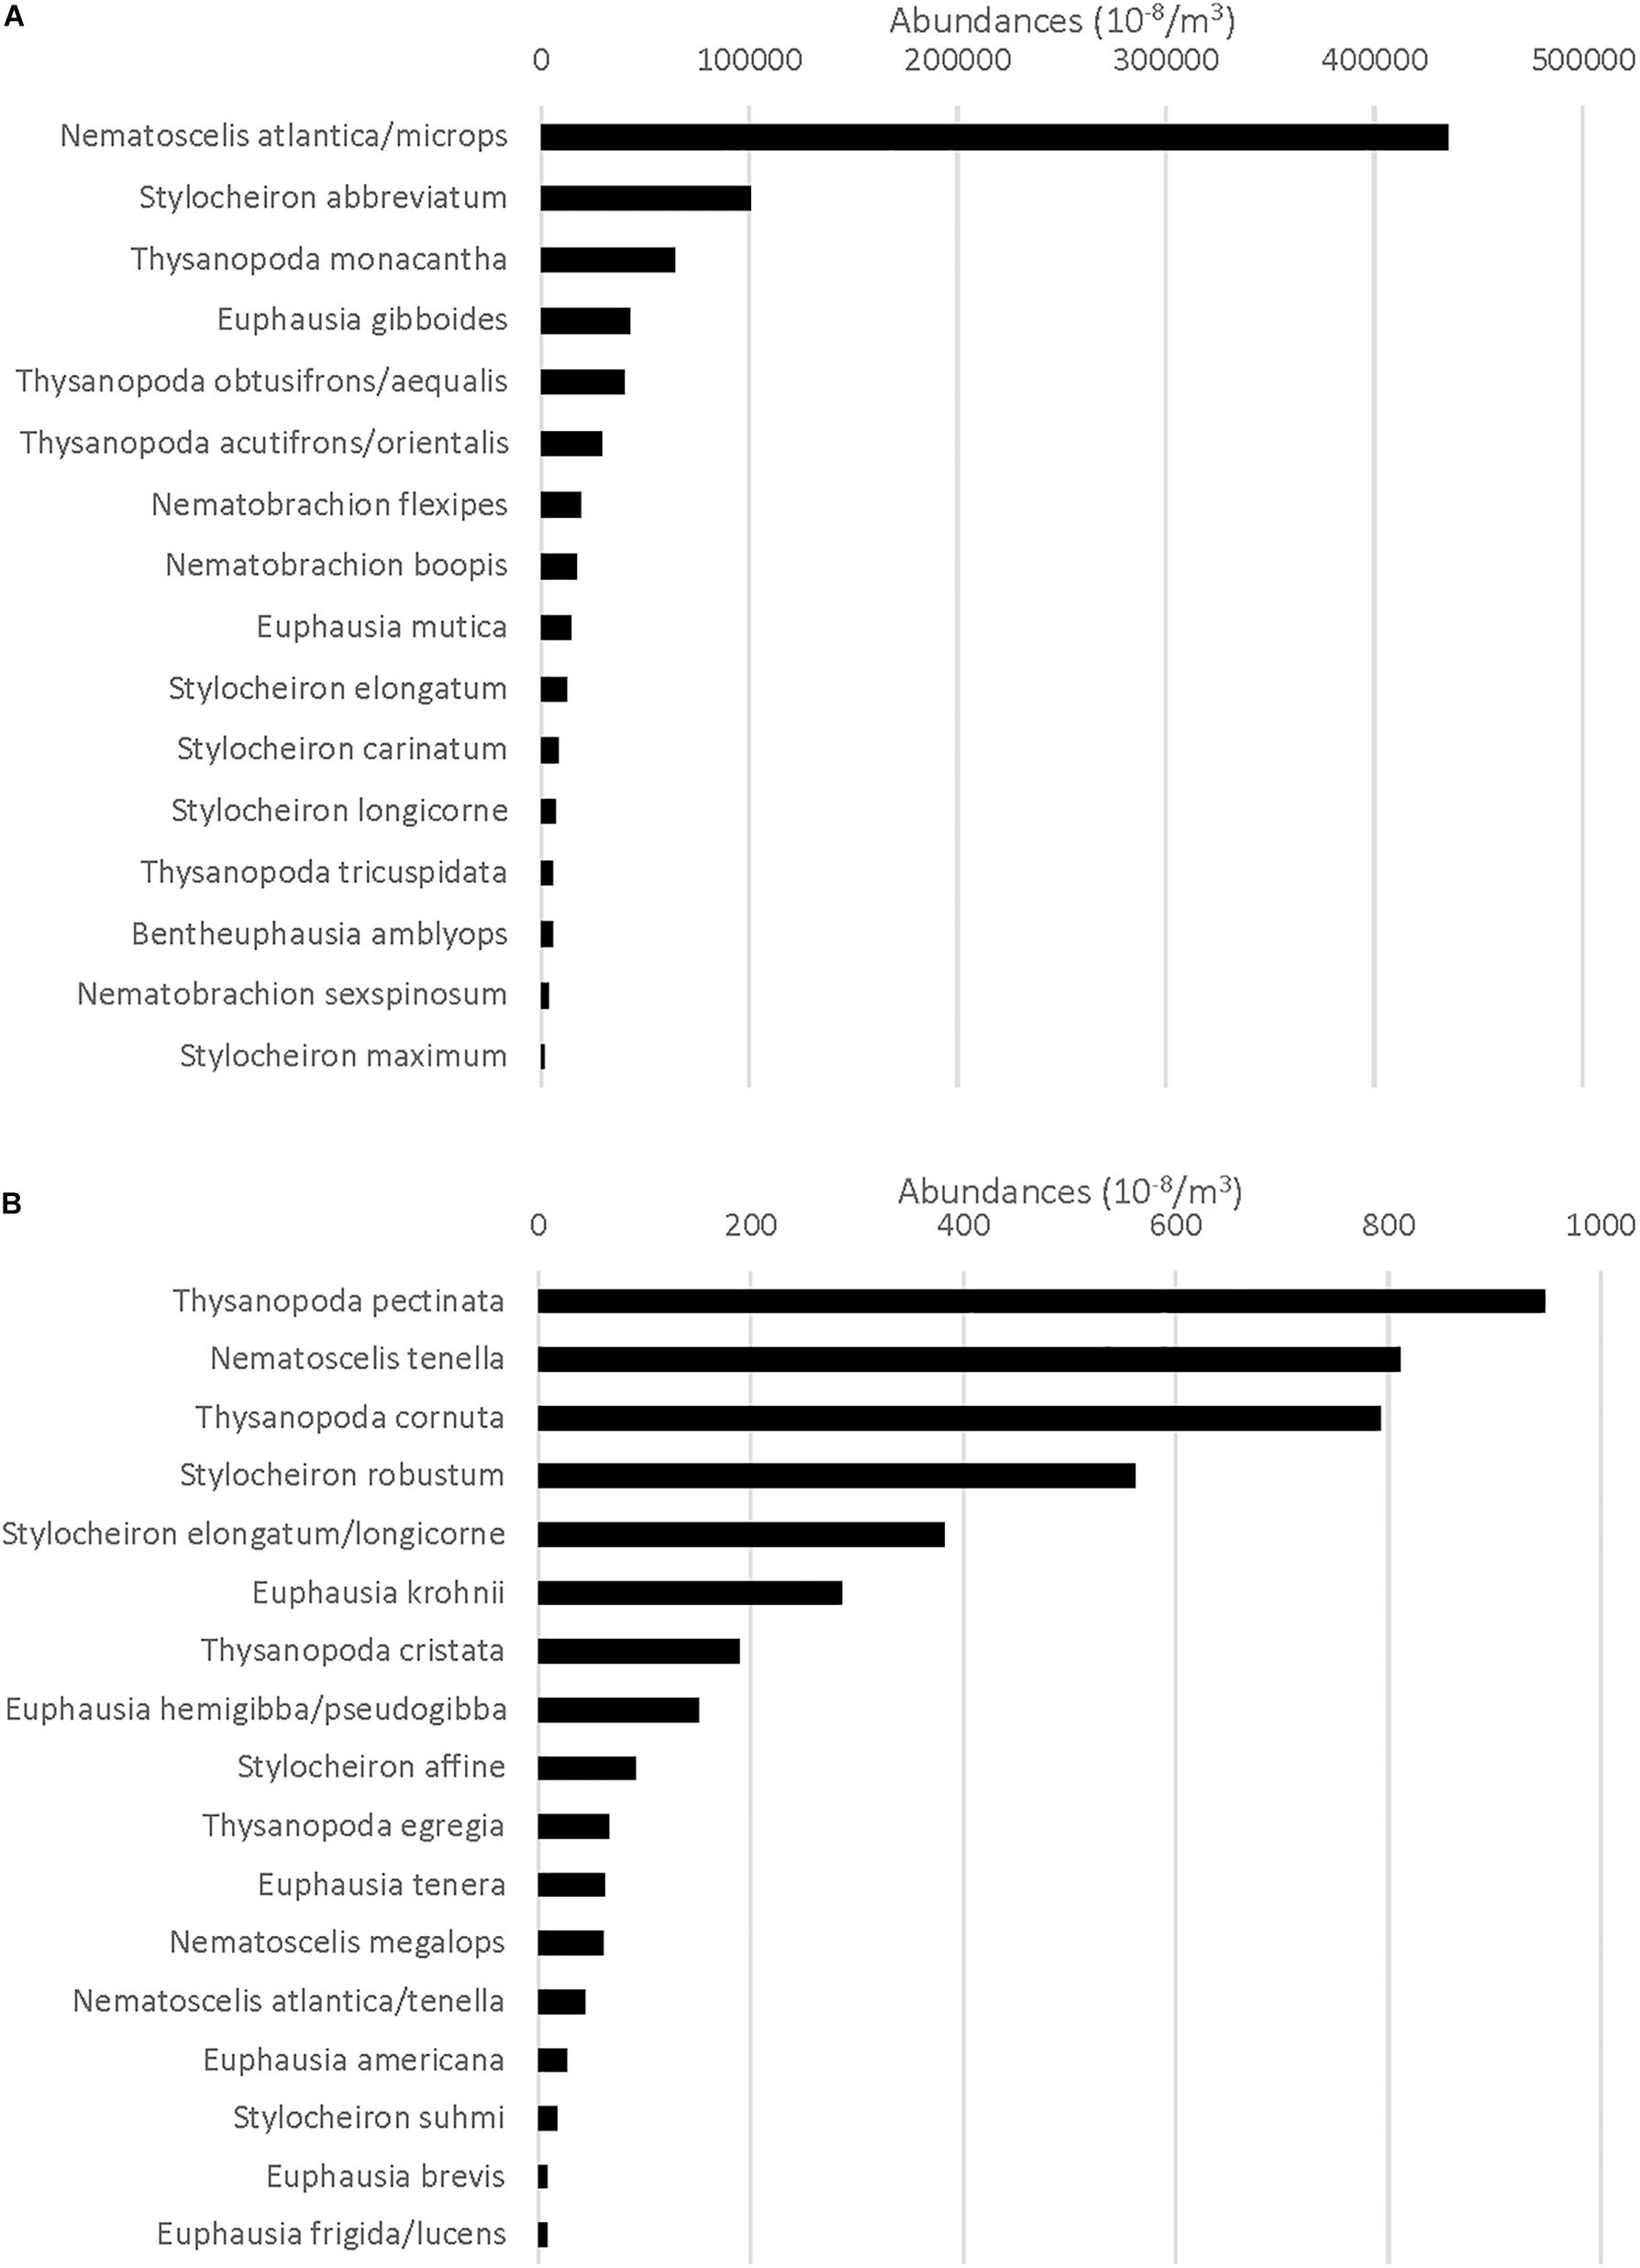
Figure 2. (A) Total standardized abundance (N m–3) for the species that comprise the top 99% of all Euphausiacea caught (categorized as abundant species) at all stations. (B) Total standardized abundance for the species that comprise the remaining 1% of all Euphausiacea caught (categorized as rare). X-axis maximum value is different from that in (A).
The number of gravid females present was recorded for the species that had at least one gravid female, and standardized abundances (N m–3 of water filtered) of gravid females per depth range and per month were calculated, as was the percent of the total catch that was represented by gravid females for the specified month.
Temperature and salinity profiles for April–June 2011 (Burdett et al., 2017), showed that there was little variation in these physical parameters with respect to location or month – depth and range of the thermocline and halocline, as well as surface temperature/salinity and those at trawling depths – so these factors were not taken into consideration during the analyses.
During the analyses, it became clear that for several groups of euphausiids collected at these sites, the species description did not match known species. The characteristic distinguishing Nematoscelis atlantica and Nematoscelis microps (James, 1970; Roger, 1978; Mikkelsen, 1987; Baker et al., 1990) is the number of setae on the propodus of the first thoracic leg, which should be 5–6 for N. atlantica, and 8–9 for N. microps. In addition, the dactylus should be straight and evenly tapering in N. atlantica, while it is described as being strongly recurved in N. microps. Of the first two hundred individuals that were examined, 91% of them possessed seven setae, while the dactylus was between the diagrams in the keys (Baker et al., 1990; Gibbons et al., 1999; Brinton et al., 2000). Dr. Martha Nizinski, Curator of Decapods at the National Museum of Natural History, could also not determine which species group these aberrant individuals belonged to, so, while ∼ 10% of the 25000 individuals examined did have the “correct” number of setae, they were all grouped together as Nematoscelis atlantica/Nematoscelis microps. Ongoing molecular analyses will determine if this is a new species, or if the original separation was a misidentification of a single species. Furthermore, Thysanopoda obtusifrons and Thysanopoda aequalis (James, 1970; Mikkelsen, 1987; Baker et al., 1990) are reportedly distinguishable by the structure of their antennular lappets. T. obtusifrons should have an antennular lappet that covers a third to half of the width of the base of the second segment of the antennular peduncle, while T. aequalis should have an antennular lappet that covers the full width of the base of the second segment. This difference was not readily apparent in the samples analyzed in this study, so the two species were grouped together as T. obtusifrons and T. aequalis. Lastly, T. acutifrons and T. orientalis are two very closely related species and cannot be differentiated unless they are sexually mature adults with petasmae or thelyca (Baker et al., 1990). The individuals in these samples were small with very few sexually mature individuals, so these two species were grouped together as T. acutifrons and T. orientalis.
In total, 51,559 euphausiids belonging to 31 species were collected. Numerically, 16 species made up 99% of the total (slope + offshore stations) euphausiid assemblage and were categorized as abundant, while 15 species made up the remaining 1% and were categorized as rare. N. atlantica/N. microps was by far the most abundant euphausiid taxon, accounting for 51.2% of all euphausiids present, with Stylocheiron abbreviatum (12.4%) being the only other species to account for more than 10% of the total assemblage (Figure 2A). Each of the rare species included in the bottom 1% accounted for 0.2% or less of the total euphausiid assemblage (Figure 2B).
The total number of individuals caught per m3 was significantly greater (Mann Whitney U, p = 0.004) in slope samples than it was in offshore samples (Figure 3A). However, in terms of individual species’ contributions to the total abundance, the relative abundance of each species (i.e., the percent contribution to the total abundance) remained consistent (less than a 2% difference in relative abundance) for the species categorized as abundant in both locations (Figure 4), with the exception of N. atlantica/N. microps and Euphausia mutica. N. atlantica/N. microps accounted for 56.1% of the total abundance for slope samples vs. 49.4% of the total abundance for offshore samples. E. mutica accounted for 0.1% of the total abundance for slope samples vs. 2.6% of the total abundance for offshore samples. While N. atlantica/N. microps was the most abundant species in both slope and offshore samples, E. mutica was the 7th most abundant species in offshore samples and the 16th most abundant in slope samples (Figure 4).
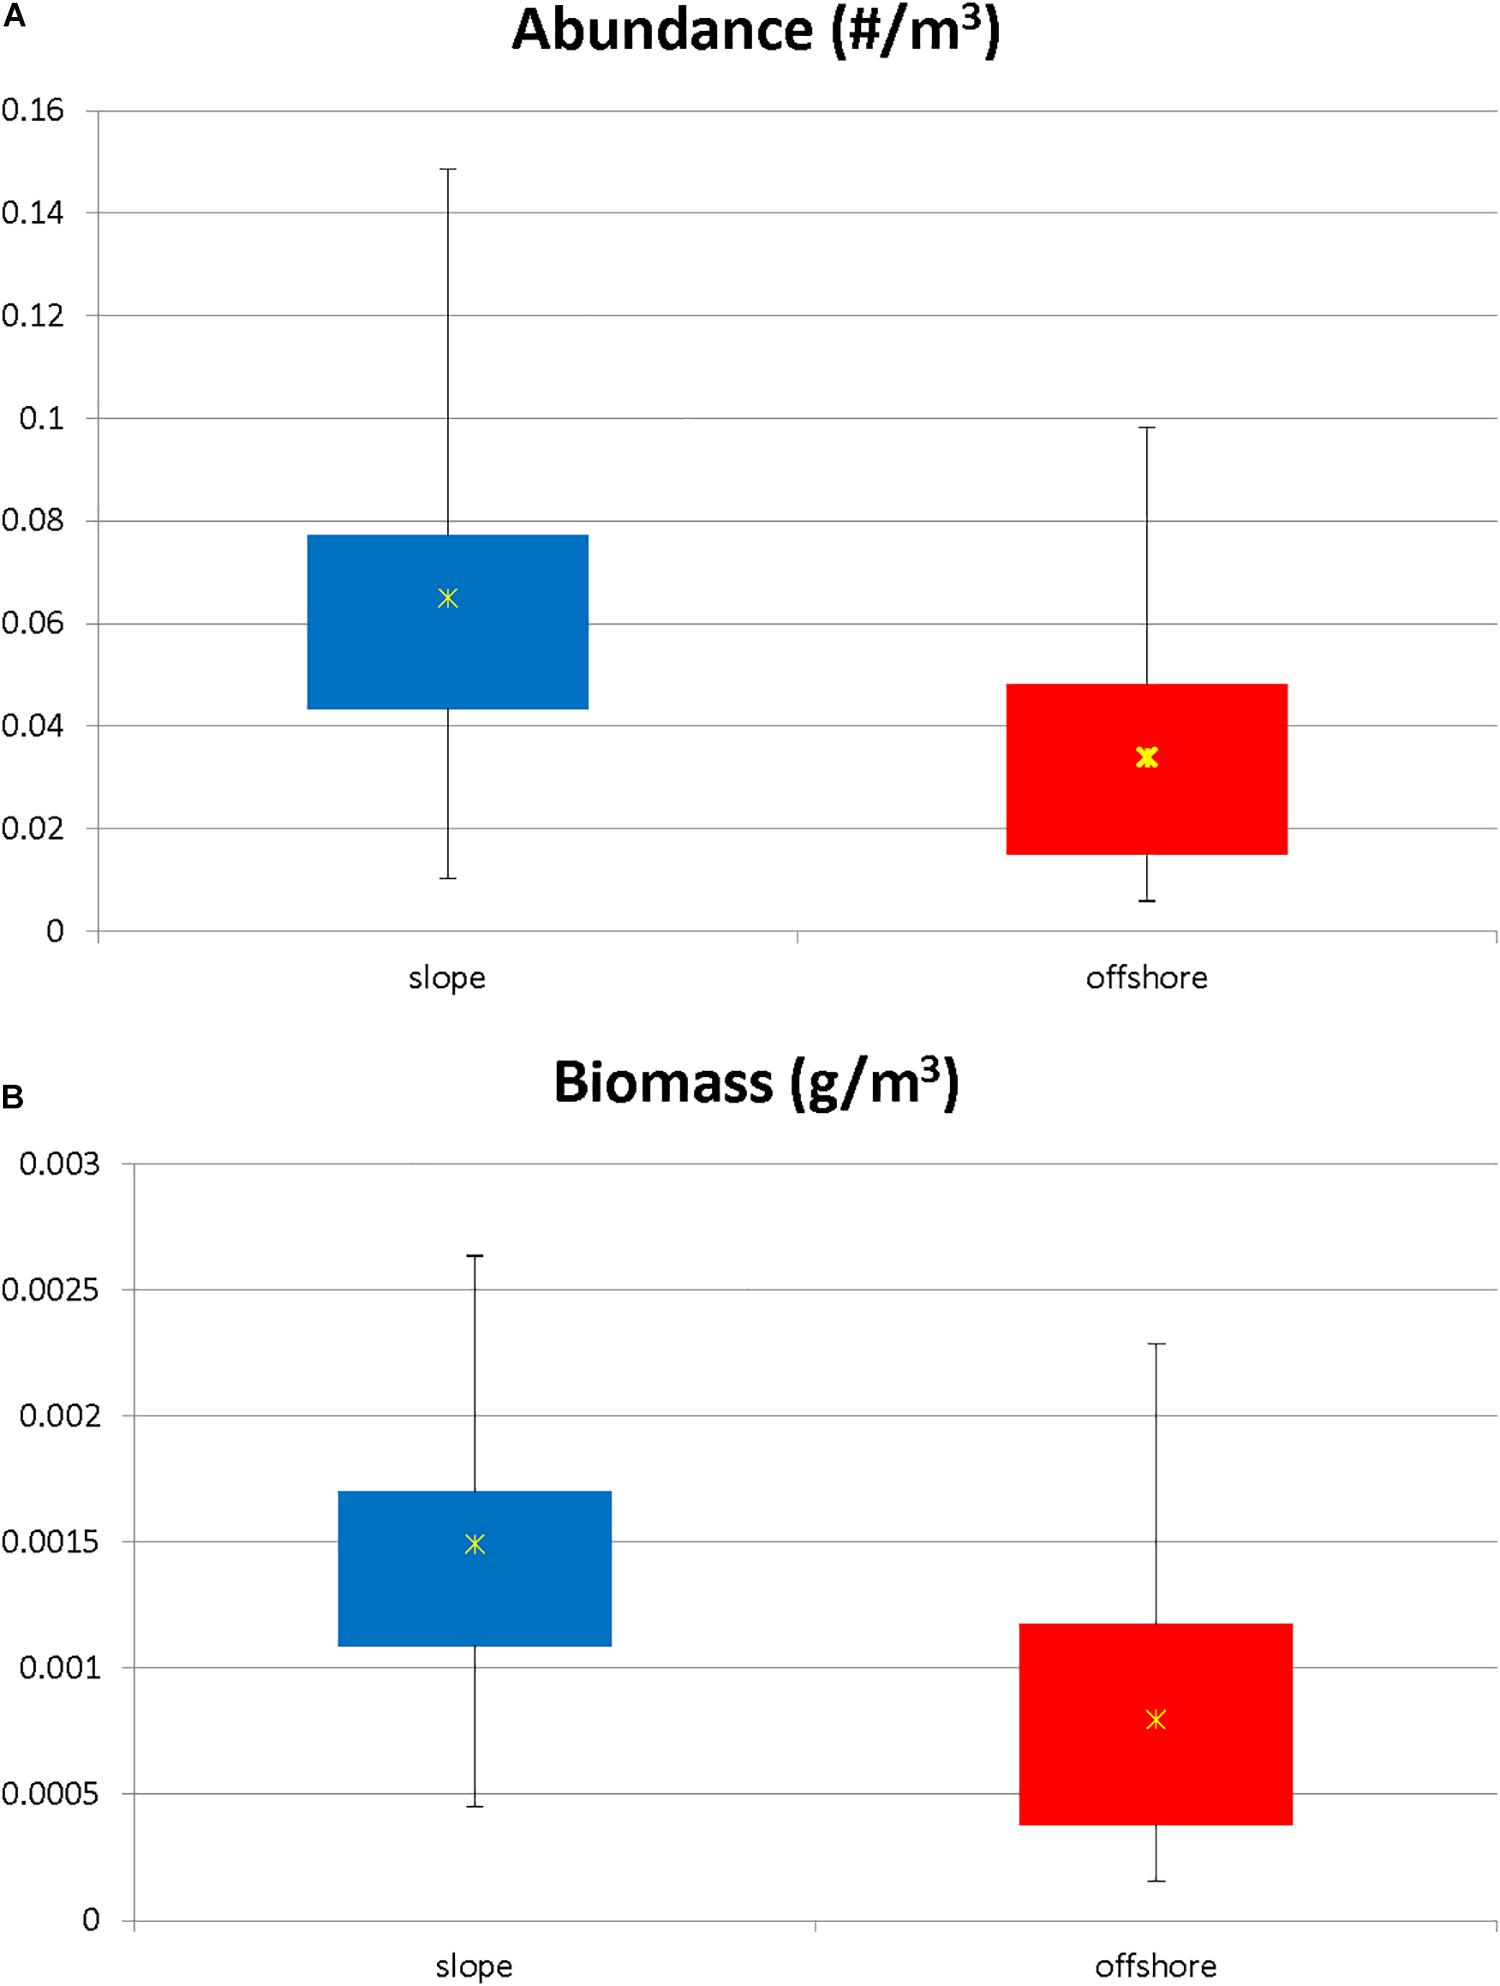
Figure 3. (A) Standardized abundance (N m–3) for slope vs. offshore euphausiid assemblage. Abundance was significantly higher in the slope stations (Kruskal Wallis, p = 0.005). Stars represent mean values. (B) Standardized biomass for slope vs. offshore euphausiid assemblage. Biomass was significantly higher in the slope stations (Kruskal Wallis, p = 0.0009). Stars represent mean values.
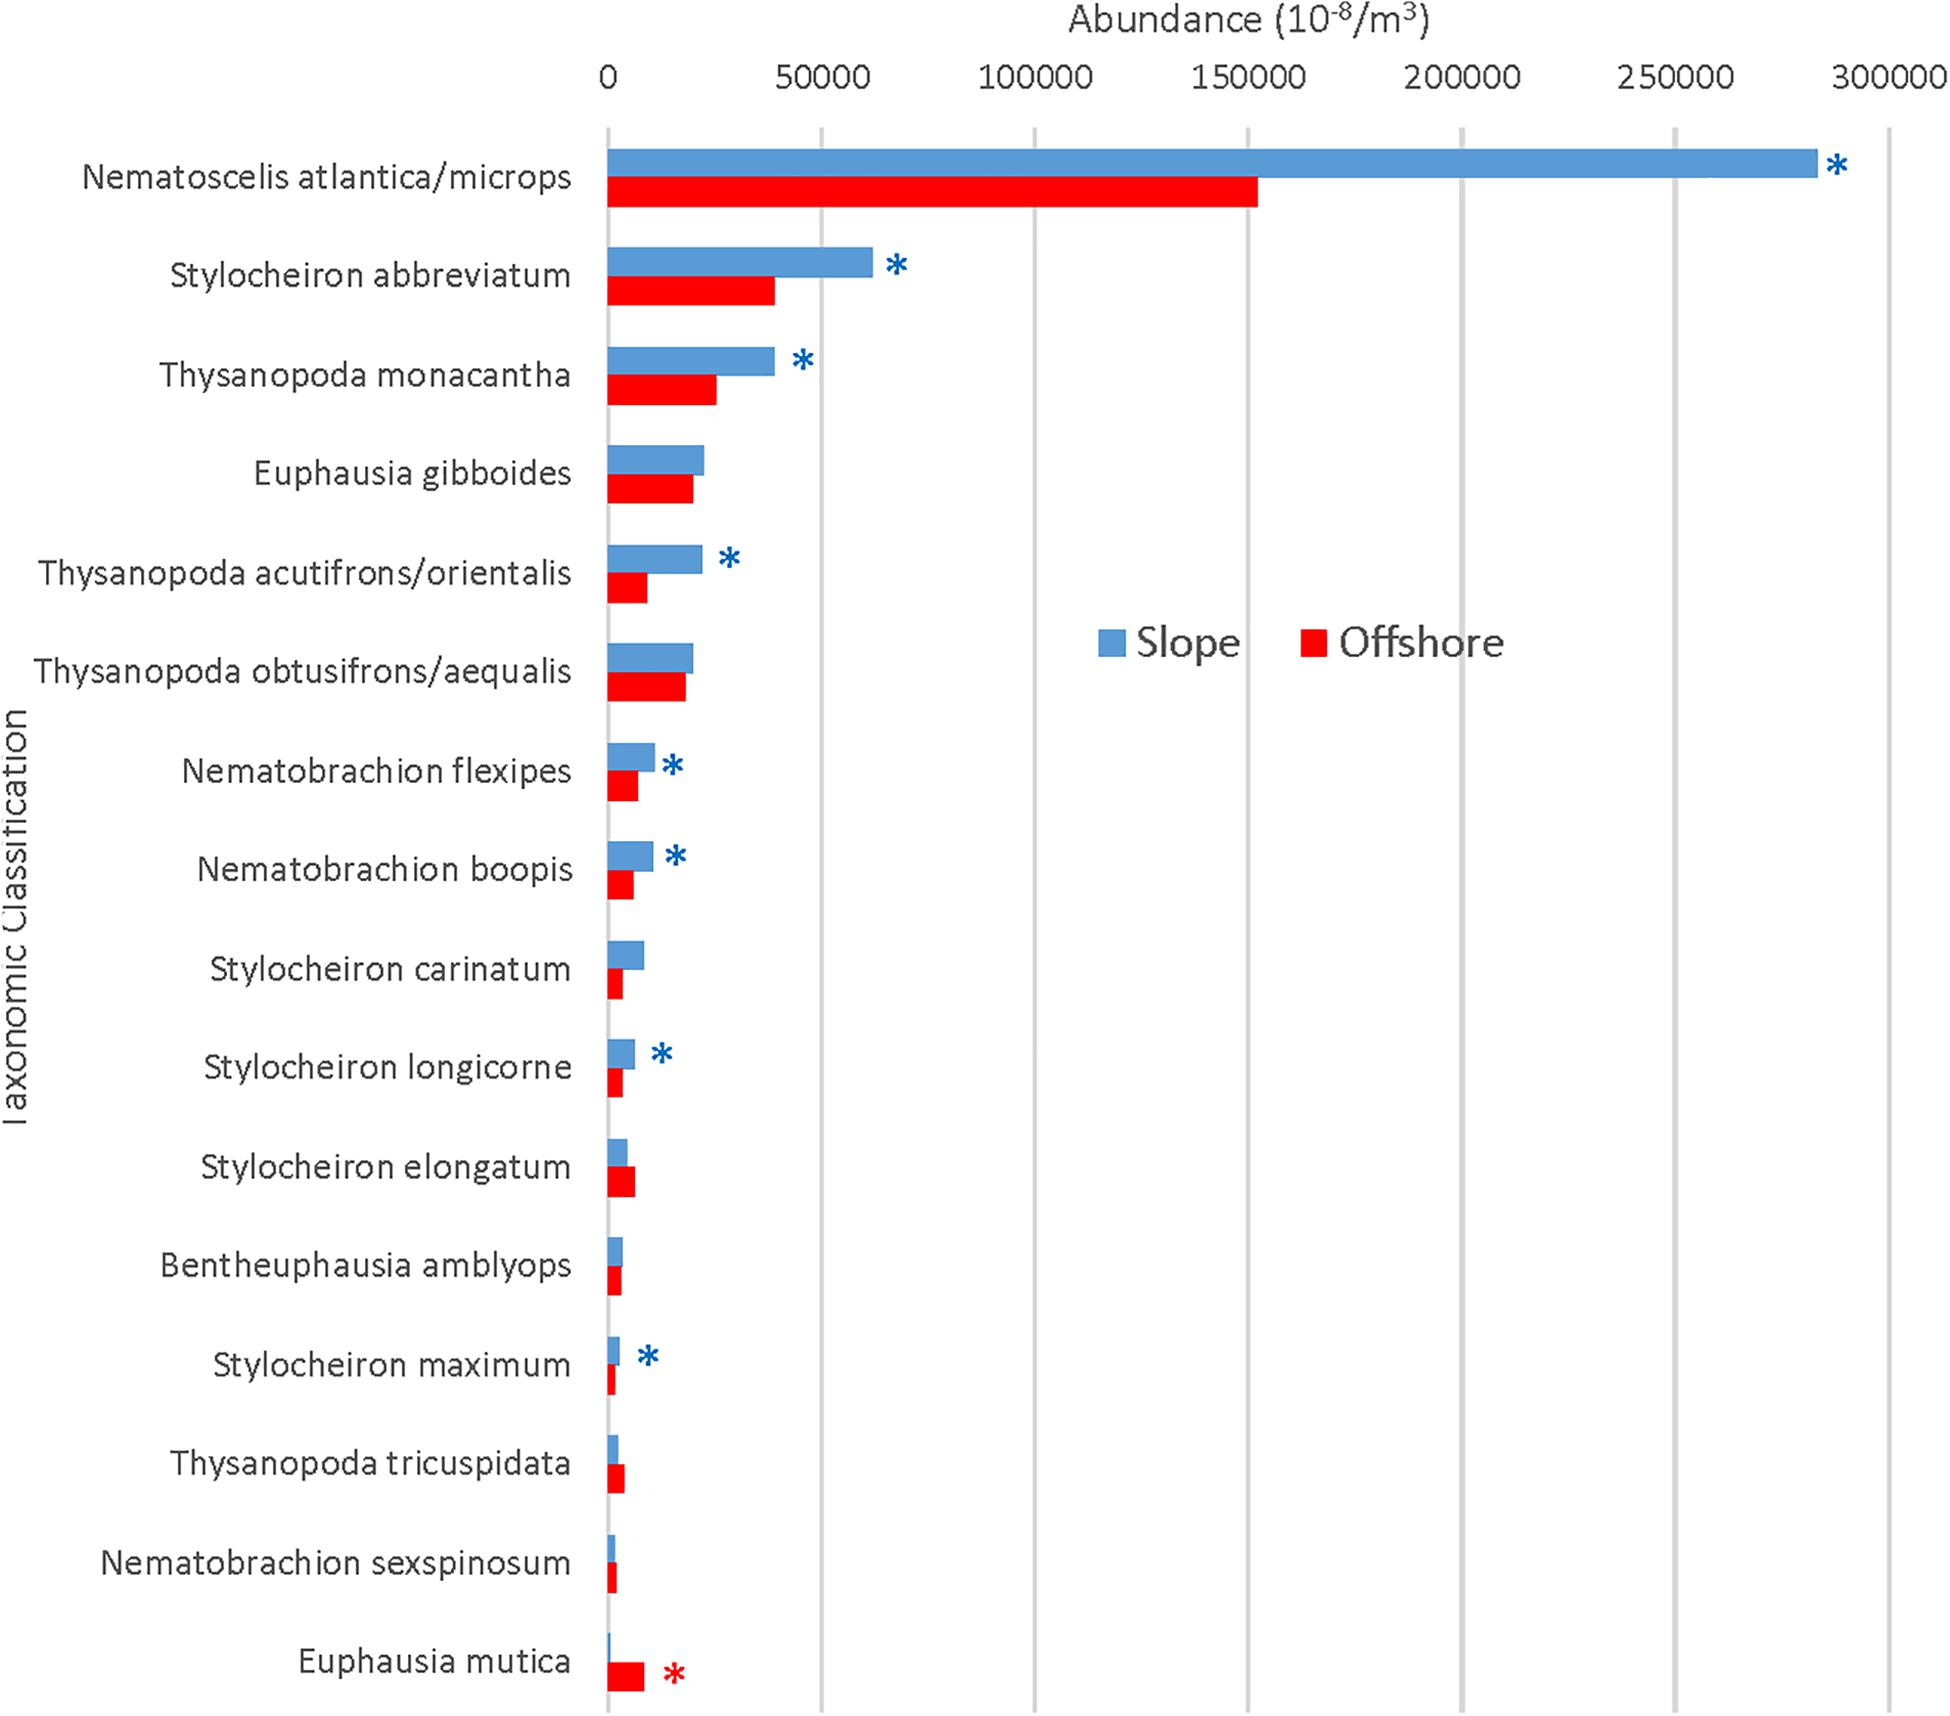
Figure 4. Slope and offshore standardized abundances for abundant species. Asterisks indicate significantly greater abundances for slope (blue) or offshore (red) locations. Species are arranged from maximum to minimum abundances at slope stations.
While there were more offshore stations, station variance was very low for both slope (1.19 × 10⁻⁵m–3) and offshore (6.41 × 10⁻⁶ m–3) stations, indicating that the greater abundance of euphausiids in slope waters vs. offshore waters was not due to skewed data resulting from more trawling offshore. Of the ten rare species that were present only in the offshore samples, four of them (N. tenella, S. robustum, E. krohnii, and E. hemigibba/E. pseudogibba) were collected in substantial numbers (91, 63, 32, and 17) and distributed across multiple stations. The remaining six species were collected in much lower numbers (one to seven) and additional slope sampling is needed before drawing any conclusions about their geographical restrictions.
A Spearman’s Rank correlation demonstrated a significant (ρ = 0.90, DF = 31 p < 0.001) monotonic relationship, meaning that as slope abundances increased, each abundant species’ respective offshore abundance also increased. Eight of the 16 abundant euphausiid species were significantly more abundant in the slope samples than offshore (all p < 0.01; Mann Whitney U), while one species (E. mutica) was significantly (p < 0.01) more abundant in offshore samples than in slope samples (Figure 4).
With respect to the rare euphausiid species, 10 species were found in offshore samples that were not found in slope samples (Figure 5), with Nematoscelis tenella (n = 91), Stylocheiron robustum (n = 63), Euphausia krohnii (n = 32), and Euphausia hemigibba/Euphausia pseudogibba (n = 17) occurring in abundances of over 10 individuals. The abundance of the remaining six species ranged from one to seven. There were no species found in slope samples that were not found in offshore samples.
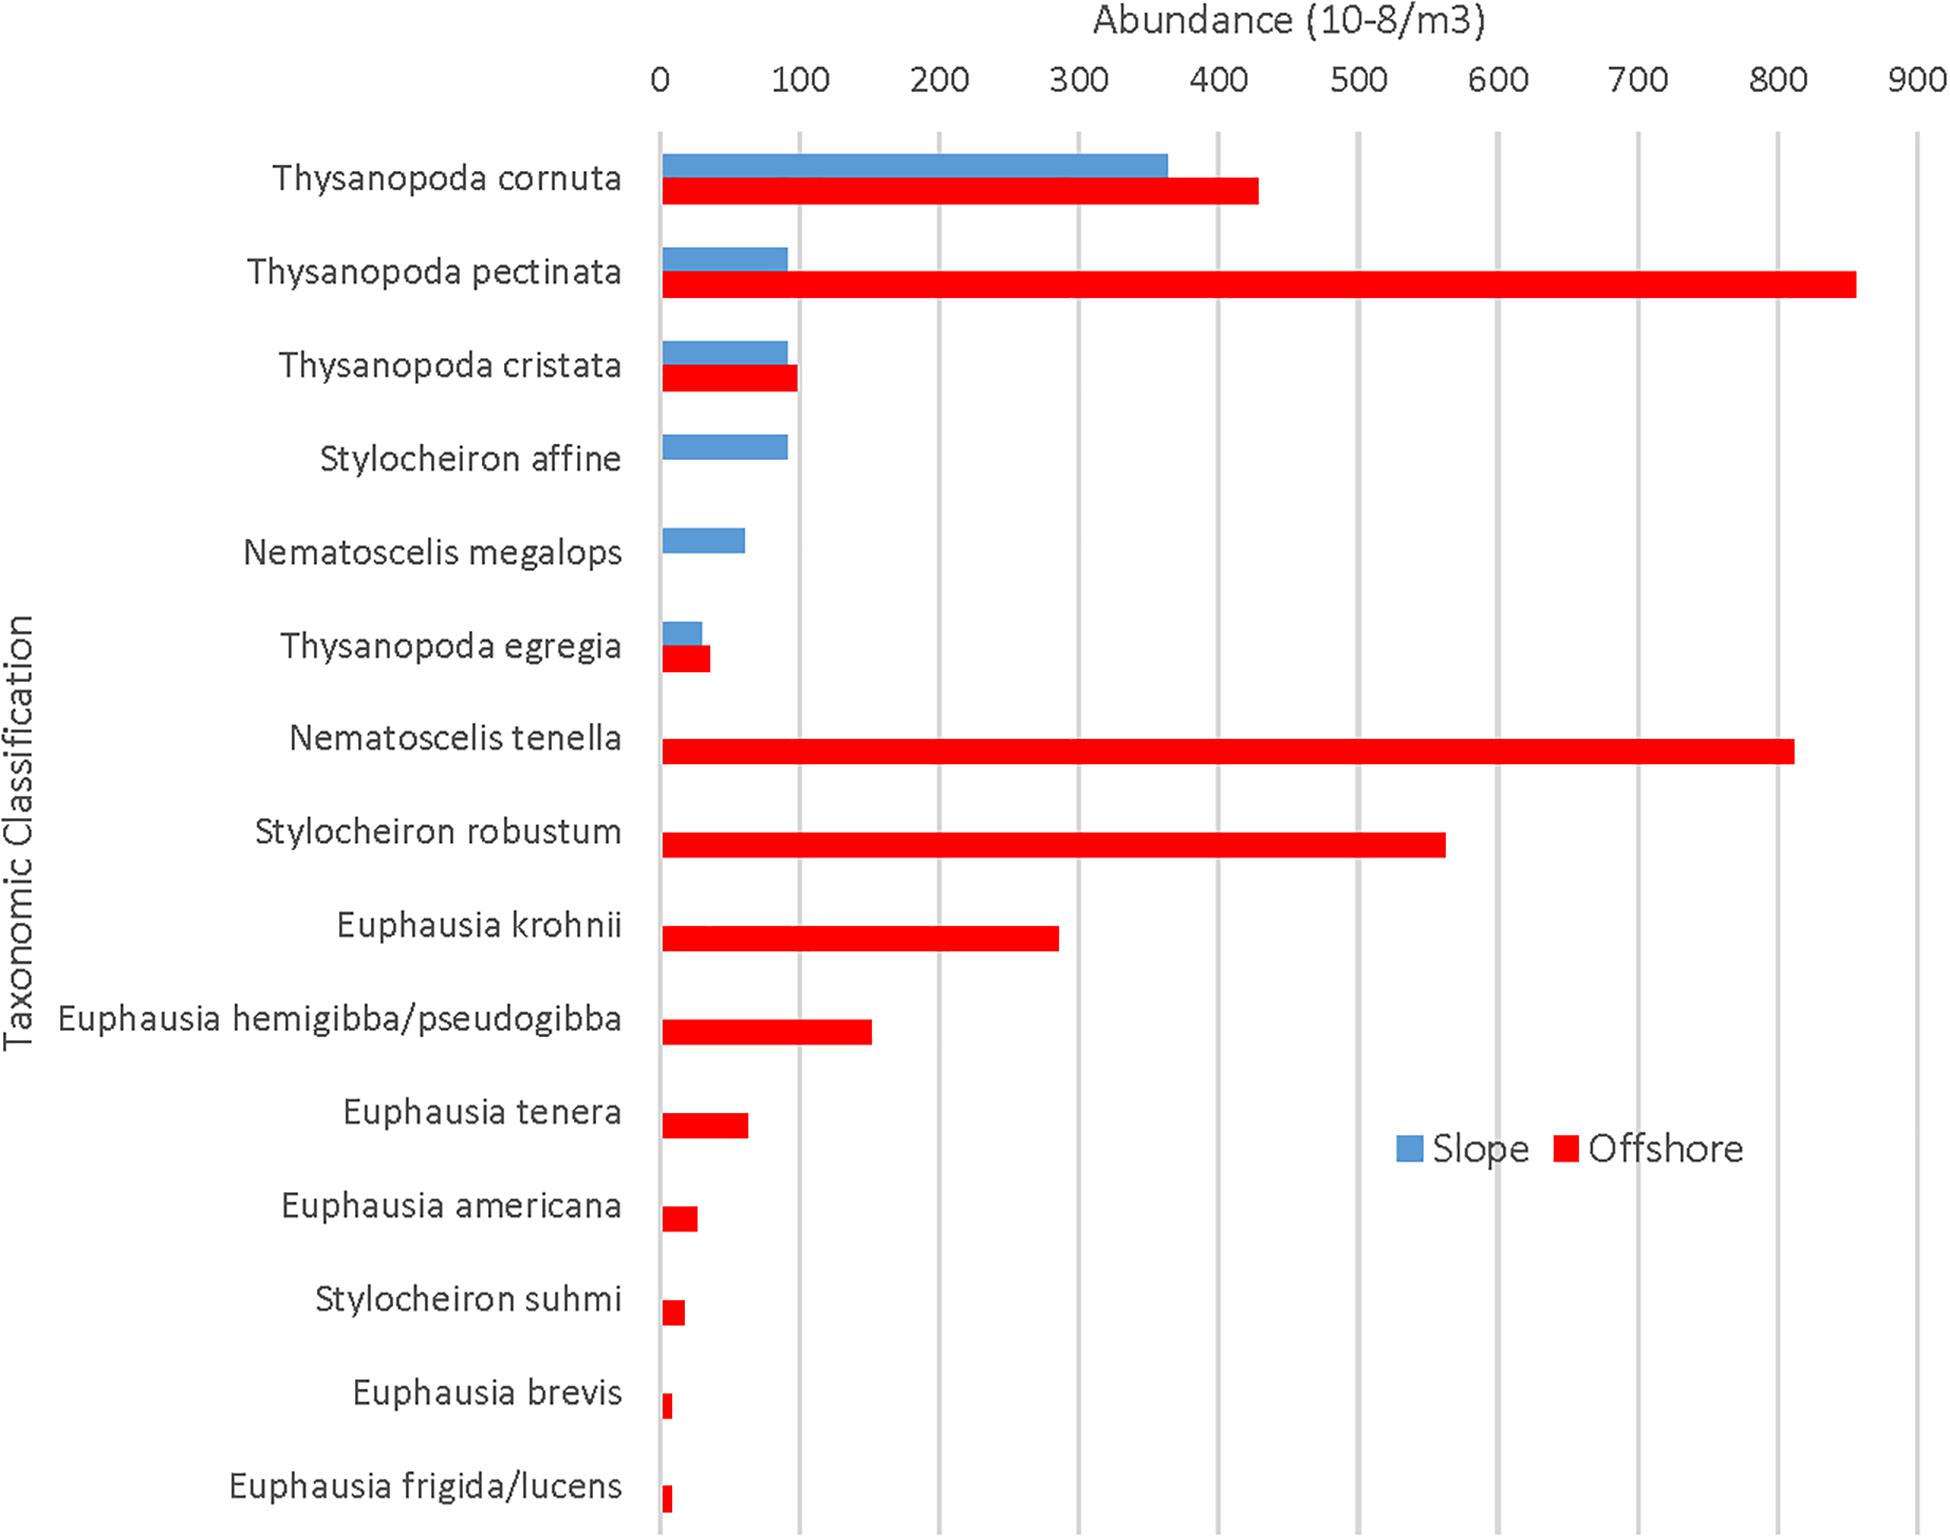
Figure 5. Slope and offshore abundances for rare euphausiids. X-axis maximum value is substantially lower than that of Figure 4.
The biomass for the euphausiid assemblage reflected the abundance trends, with biomass for the slope assemblage being significantly higher (Mann-Whitney U, p = 0.0004) than it was for the offshore assemblage (Figure 3B). The biomass trends for individual species also reflected abundance trends, with the biomass of the majority of abundant euphausiid species higher at slope stations than at offshore stations (Figure 6). N. atlantica/N. microps had the highest biomass for both slope and offshore locations. The same eight species that were significantly more abundant in the slope stations also had significantly (Mann-Whitney U, all p < 0.01) higher biomasses than in the offshore stations; the same species (E. mutica) that was significantly more abundant in the offshore stations also had a significantly (Mann-Whitney U, p < 0.01) higher biomass in offshore stations. Euphausiids made up 15.8% of the total biomass of all the crustaceans collected during this study (1.837 kg), making it the 3rd highest ranking crustacean family in terms of biomass in this region, with N. atlantica/N. microps, the most abundant euphausiid, making up 44% of the total euphausiid biomass. Thysanopoda acutifrons/Thysanopoda orientalis was the 6th-most abundant euphausiid, but due to its larger size compared to the more abundant species, it ranked 2nd in terms of biomass, making up 12.7% of the total euphausiid biomass.
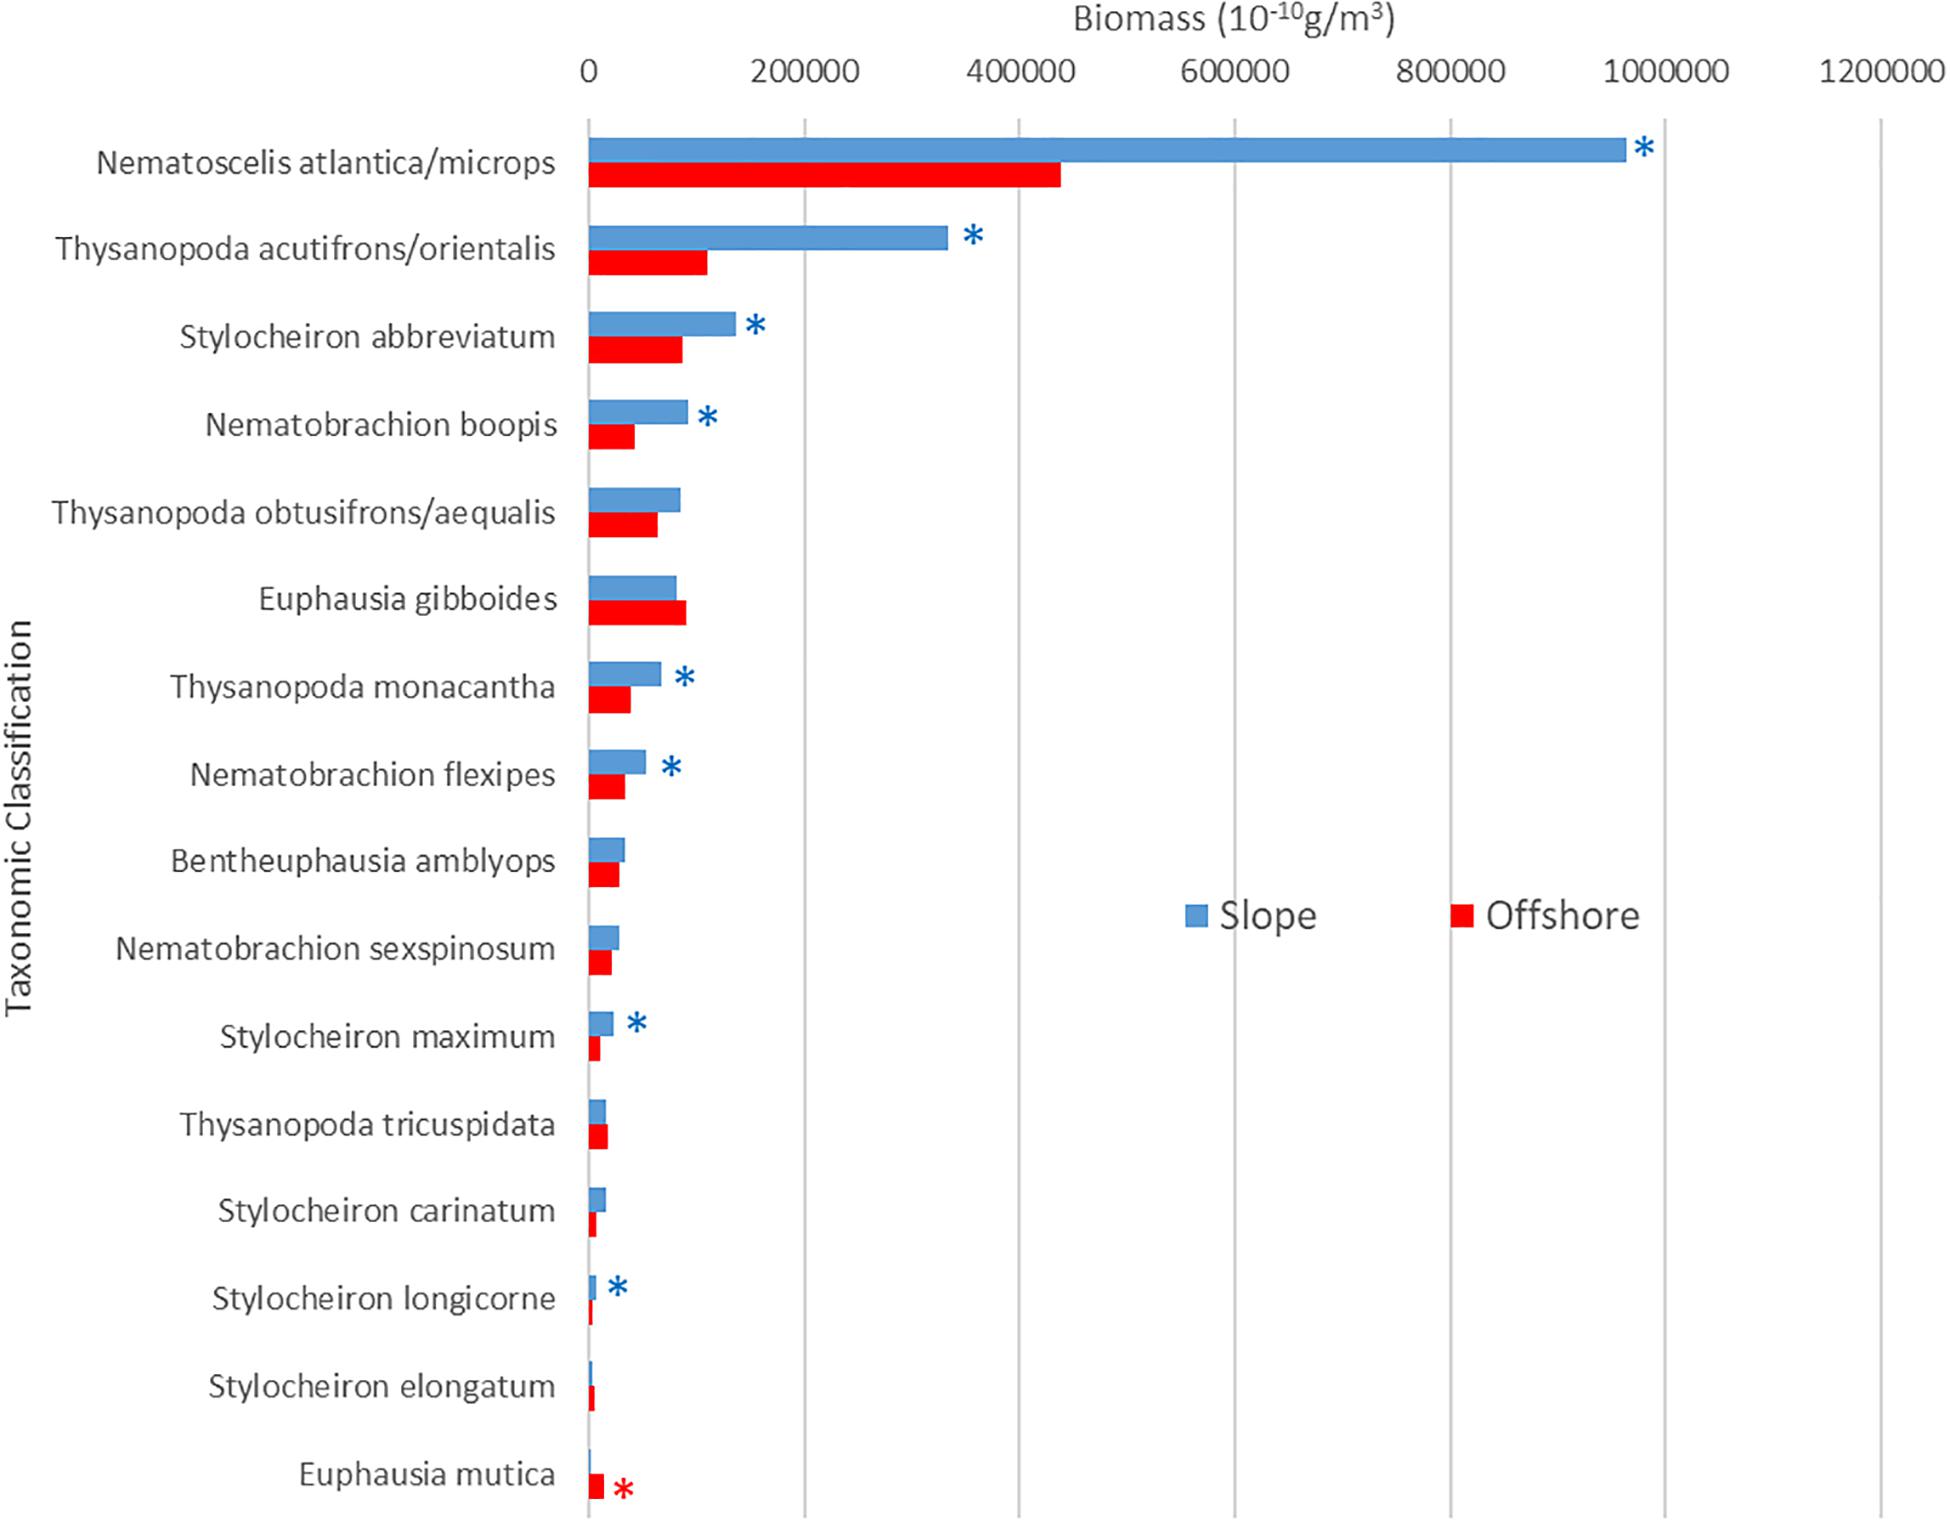
Figure 6. Slope and offshore population biomass for abundant euphausiids. Asterisks indicate significantly greater biomass for slope (blue) or offshore (red) locations Species are arranged from maximum to minimum biomasses at slope stations.
Slope and offshore euphausiid assemblages were compared using the Shannon Diversity (H’) and Pielou’s #Evenness (J’) indices, but these analyses did not include the bathypelagic zone because bathypelagic samples were not available for the slope stations. Diversity was significantly higher (p < 0.001) in the slope samples than the offshore samples in the epipelagic zone during the day (Table 1) but was significantly higher (<0.001) in the offshore samples than the slope samples during the night (Table 2). In the mesopelagic zone (200–1000 m), both day and night, the diversity was significantly higher (p < 0.05) in the offshore samples. The upper and lower mesopelagic assemblages were more evenly distributed offshore during the day, whereas the epipelagic assemblage was more evenly distributed over the slope.
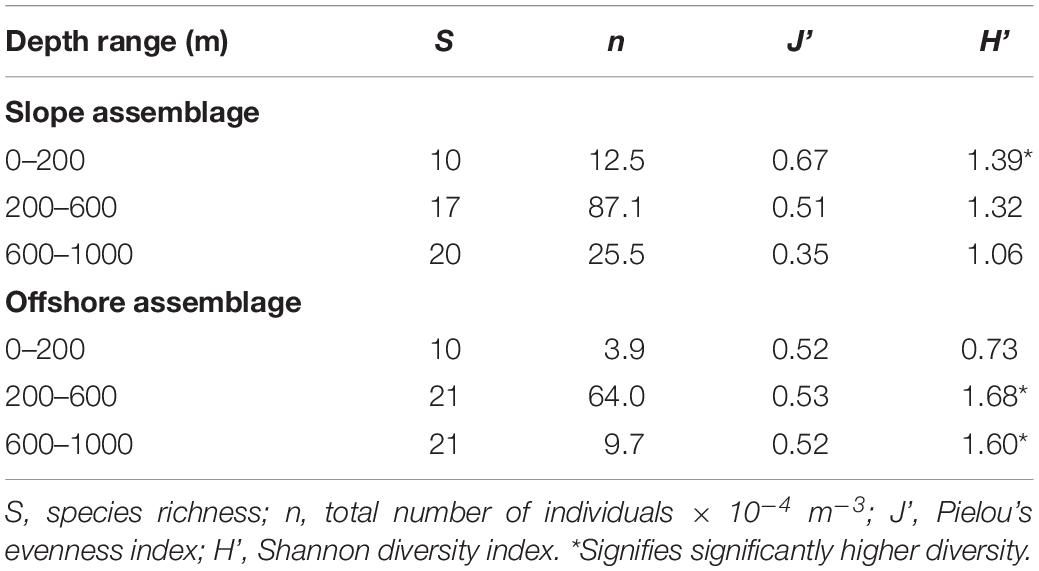
Table 1. Evenness and diversity indices for daytime slope and offshore assemblages of euphausiids.
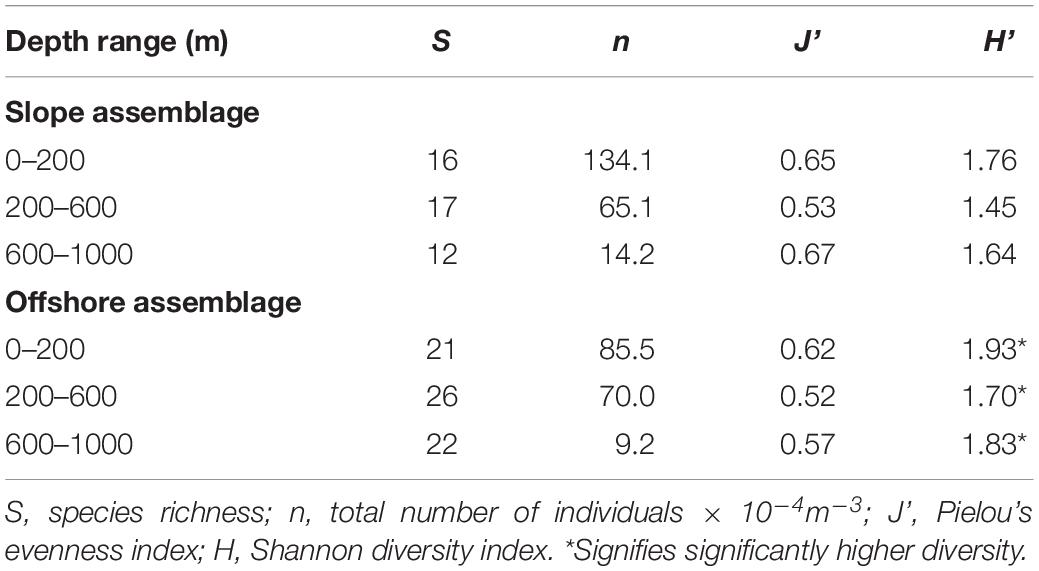
Table 2. Evenness and diversity indices for nighttime slope and offshore assemblages of euphausiids.
Vertical distribution patterns were determined for the 16 most abundant species (those that made up 99% of the euphausiid assemblage). These species could be separated into three distinct groups based on their vertical distributions: (1) species in which over 50% of the population migrated to a shallower depth range at night, and were thus categorized as strong vertical migrators (SVM – Figure 7A); (2) species in which 19.5–41.3% of the population migrated to a shallower depth range at night and thus categorized as weak vertical migrators (WVM – Figure 7B); and (3) species where less than 2% of the population moved to a shallower depth range at night, and thus categorized as non-vertical migrators (NVM- Figure 7C).
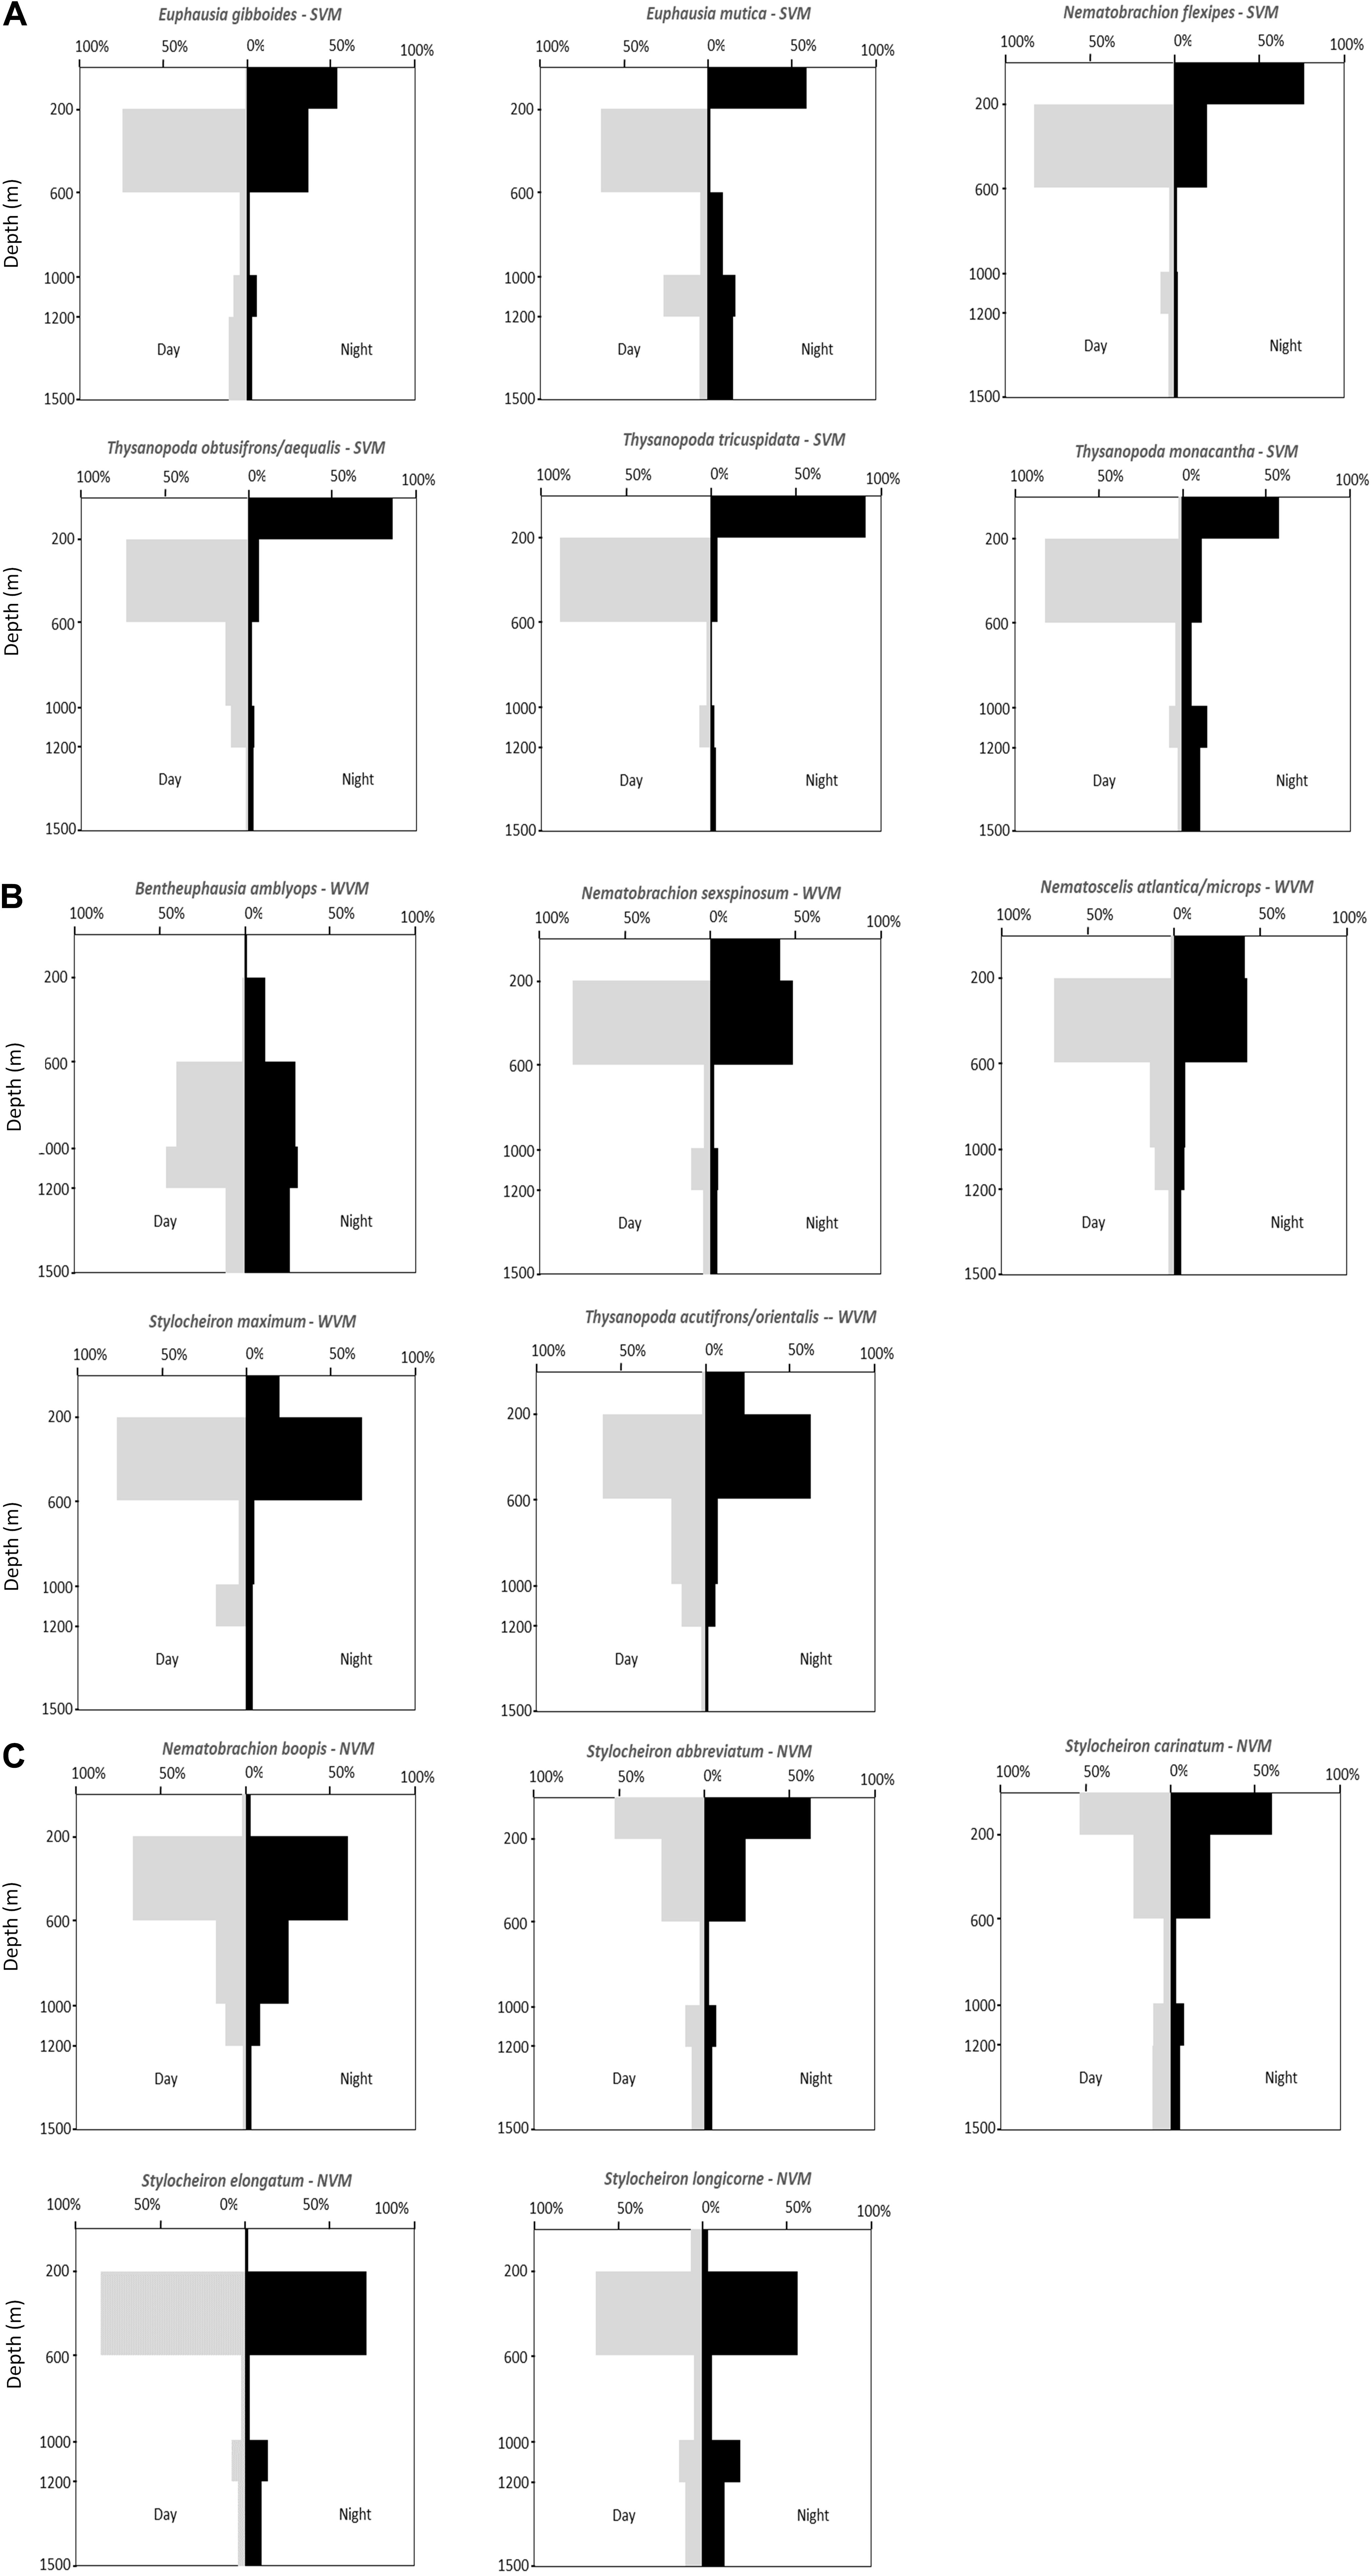
Figure 7. Vertical distribution patterns of abundant euphausiid species. (A) Strong vertical migrators (SVM). (B) Weak vertical migrators (WVM). (C) Non-vertical migrators (NVM).
A total of 6 of the 16 abundant species were strong vertical migrators, five species were weak vertical migrators, and five species showed no discernable vertical migrations. All six of the species that were considered strong vertical migrators had over 50% of their respective day populations caught at depths of between 200 and 600 m during the day. Four of the five species that showed a weak vertical migration pattern had over 50% of their respective day populations caught between 200 and 600 m, while the other weak migrator, Bentheuphausia amblyops, was found primarily between 600 and 1200 m (40.4% between 600 and 1000 m and 46.1% between 1000 and 1200 m) during the day, with a small portion (11.8%) migrating up to 200–600 m at night. Of the five species that showed no vertical migration, more than 50% of the S. abbreviatum and Stylocheiron carinatum individuals were caught between 0 and 200 m during both the day and the night. The remaining three species (Stylocheiron longicorne, Stylocheiron elongatum, and Nematobrachion boopis) were caught primarily between 200 and 600 m during both the day and night.
The 15 species that accounted for the remaining 1% of total euphausiid abundance were not caught in sufficient quantities to create meaningful vertical distribution graphs. Supplementary Table S1 shows the depth distribution of these rare species.
Gravid females were found in seven species. N. atlantica/N. microps had the highest number of gravid females, and Euphausia tenera had the highest percentage of gravid females. N. atlantica/N. microps was the only species in which gravid females were caught in all five depth ranges (Table 3). Table 4 shows monthly representation of gravid female abundance and what percent of that species’ population the gravid abundance represents. Only one species had gravid females in April (N. atlantica/N. microps), while five species had gravid females in May and six species had gravid females in June. N. atlantica/N. microps is the only species in which gravid females were caught in all 3 months of sampling with the greatest abundance (2925 × 10–7m–3) and percent (10.0%) of population gravid occurring in May.
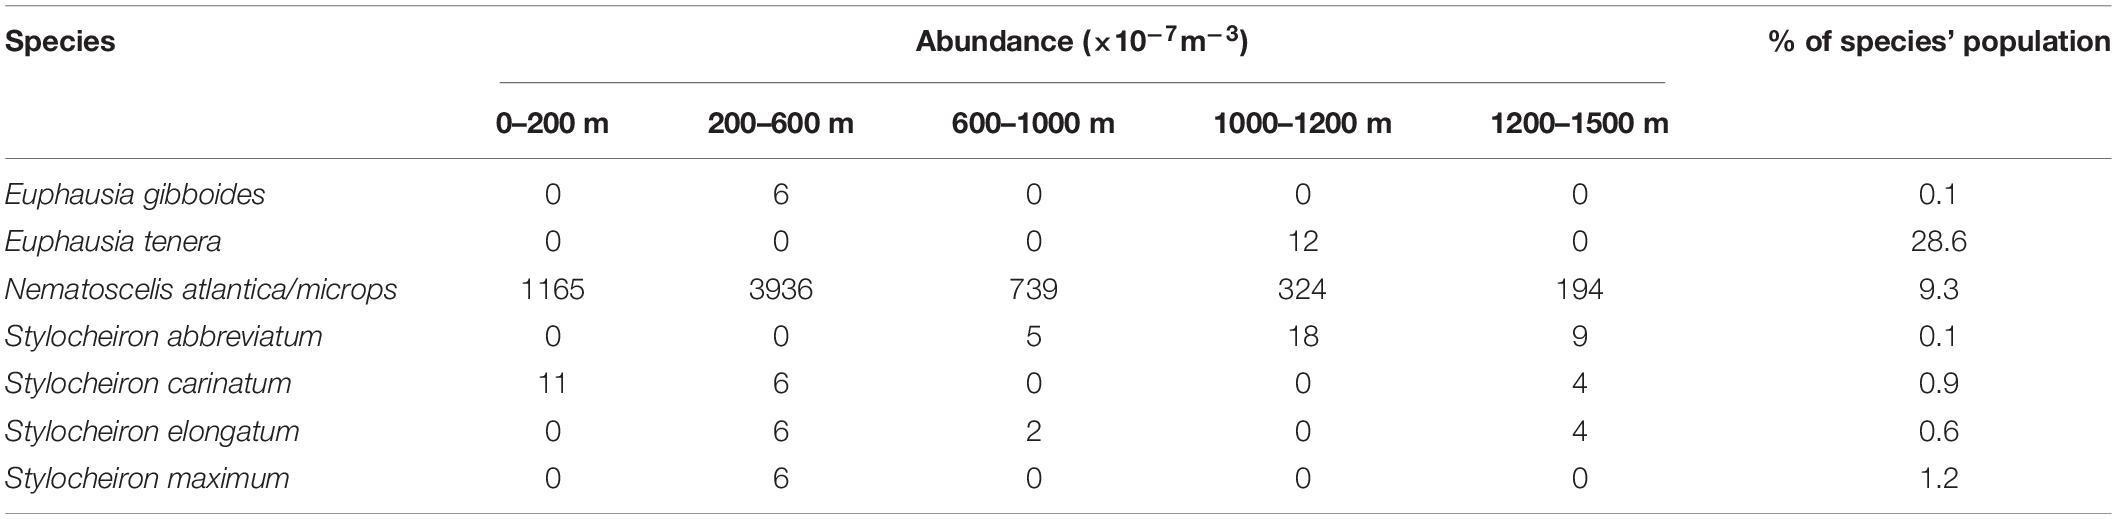
Table 3. Abundances (×10–7m–3) of gravid euphausiid species for each depth range and the percent of the population that gravid females represent.
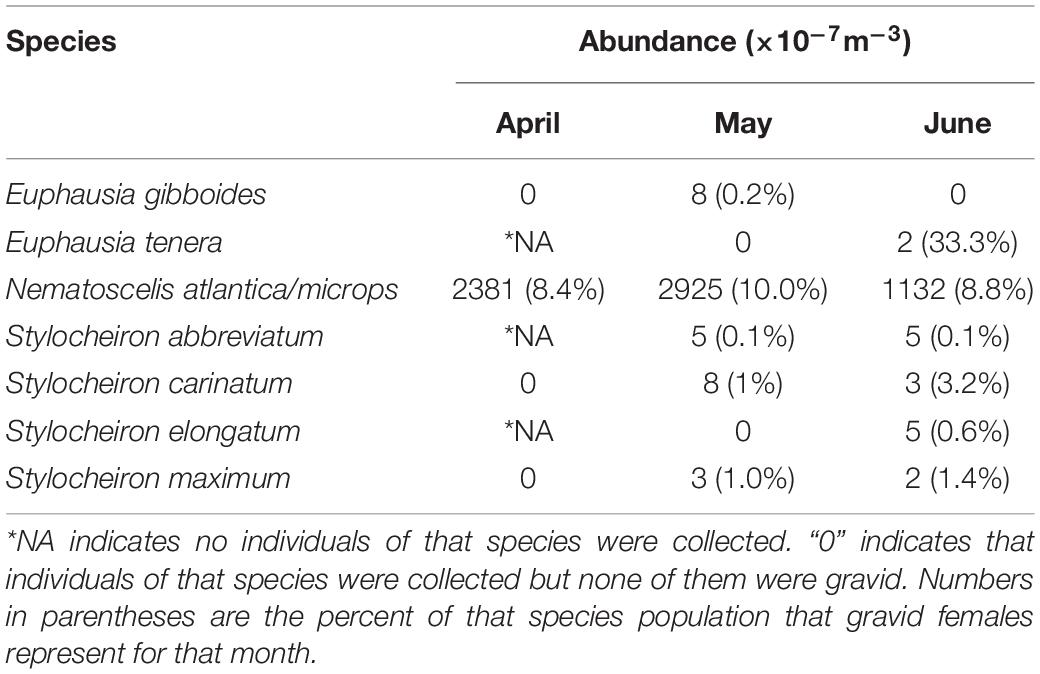
Table 4. Gravid female abundance (×10–7m–3) by month for each species of Euphausiacea.
Sixteen species of euphausiids made up 99% of the euphausiid abundance, with the most abundant species being the combined species group N. atlantica/N. microps, in both slope and offshore stations. The only previous study in this region was by Kinsey and Hopkins (1994), conducted at their Standard Station, which overlapped with Station SE-5 in the current study. Combined values of N. atlantica and N. microps from the Hopkins and Kinsey study puts them as the 5th most abundant species in their study while the three most abundant species in their study were E. tenera, S. carinatum, and Euphausia americana. More recent studies by Castellanos and Gasca (1999) and Gasca et al. (2001) collected Euphausiacea from the southern GOM, and although they only trawled in the epipelagic zone (0–200 m), their night trawls would have collected most of the vertical migrating species. They found 17 species of euphausiids and determined that three species, S. carinatum, Stylocheiron suhmi, and E. tenera (in decreasing order of abundance) contributed to the majority of the euphausiid abundance in both spring and summer. This means that two of the top three most abundant species in these two studies (S. carinatum and E. tenera), separated by location (southern GOM vs. northern GOM) and time (7 years) were the same. In the current study, E. tenera was extremely rare, with only six collected in 340 samples from all depths, while S. carinatum ranked 11th in abundance for the abundant species. E. americana, the 3rd most abundant species in the Hopkins and Kinsey study, and S. suhmi, the 2nd most abundant species in the Gasca studies, were was also extremely rare in the current study, with only four and two collected in all samples.
Interestingly, the species that were most abundant in the Gasca et al. and Kinsey and Hopkins studies E. americana (mean body length = 11.15 mm), E. tenera (mean body length = 10.86 mm), S. carinatum (mean body length = 12.01 mm), and S. suhmi (mean body length = 5.77 mm) are all substantially smaller species than this study’s three most abundant species – N. atlantica/N. microps (mean body length = 16.36 mm), S. abbreviatum (mean body length = 13.80 mm), and Thysanopoda monacantha (mean body length = 13.08 mm). With the most recent unimpacted baseline data more than 15 years old, it is impossible to determine if the change in the assemblage rank from smaller species to larger species was due to protracted slow change in the assemblage due to spatial and temporal changes in oceanographic conditions (temperature, nutrient availability, and runoff) or a more acute shift resulting in response to the DWH oil spill. The possibility that this shift may be due to the oil spill arises from the fact that oil droplets in the water could have a greater impact on smaller species due to their larger surface area to volume ratios; as animals increase in size, their surface area doubles, but their volume triples (Schmidt-Nielsen, 1984). The relatively larger surface area means a larger area for contaminants to diffuse into the body, and the smaller volume means less internal components to dilute the contaminants, giving rise to the possibility that oil/dispersants might have a greater impact on smaller individuals. This has been experimentally demonstrated in copepods (Jiang et al., 2012), where smaller individuals were more sensitive to oil WAF (water associated fraction) than larger ones, and in the amphipod Gammarus oceanicus, where larvae were hundreds of times more sensitive to oils than adults (Lindén, 1976). Further decadal long studies are required in this region to determine if this is an acute shift in the assemblage that may show recovery over time or is simply part of a persistent decadal pattern.
The abundance and biomass of euphausiids were significantly greater in slope than in offshore stations (Figure 3), but the vast majority of the euphausiid assemblage was found between 0 and 600 m in both regions, which was also reported by Kinsey and Hopkins (1994) and Castellanos and Gasca (1996) at their study sites. These data indicate that deeper depths offshore cannot account for the distribution differences, and the reason remains to be determined.
The offshore assemblage was significantly more diverse than the slope assemblage at all depths and times of day, with the exception of the epipelagic assemblage sampled during the day, which was significantly more diverse over the slope (Tables 1, 2). Diversity values incorporate species richness and evenness within a population and since species richness was the same for both locations in the epipelagic zone (10 species), the lower number of individuals offshore (5 × 10⁻⁴ m–3) compared to those over the slope (11 × 10–4 m–3) might explain the observed differences.
While studies comparing slope and offshore fauna are relatively rare, Reid et al., 1991 described a mesopelagic-boundary community for micronekton off the coast of Hawaii, that occupied a narrow boundary zone over the upper slope. The faunal composition of this boundary community differed substantially from the neighboring oceanic community for fishes, squids, and crustaceans. In addition, there were higher concentrations of boundary species closer to shore, with rapid seaward reduction in abundances, similar to what we report here for Euphausiidae, and what Burdett et al. (2017) reported for the Oplophoridae. However, although Burdett et al. (2017) sampled many of the same Oplophoridae species sampled in the Reid et al., 1991 study, they found several species with significantly different distributions. For example, Janicella spinacauda was primarily an offshore species in the NE GOM, while the Reid study found them to be equally abundant in both inshore and offshore samples, indicating that there may be considerable local differences in species compositions and diversity. The data reported here, together with the Burdett and Reid studies (and earlier studies referenced therein) emphasize the idea that boundary communities are globally distributed, and that slope communities are unique to their regions, with local geography, currents and even seasonality contributing to these differences. Future studies need to take into account that there may be significant differences in species composition and biomass between slope and. neritic stations, and how these boundary communities impact the neritic ecosystem.
Species richness in night assemblages increased in the epipelagic zone for both offshore and slope samples compared to their respective day assemblages. The greatest increase occurred in the offshore epipelagic samples (10 species during the day, 20 species at night), due to the nighttime vertical migrations of these species. These findings are supported by Biggs et al. (1977) and Castellanos and Gasca (1999), who also noted species richness increased during the night in the epipelagic zone. This huge increase in species richness in the epipelagic zone due to vertical migrations at night underscores of importance of conducting a full spatial and temporal sampling series when attempting to assess the impact of human activities on deep-sea species.
At least one gravid female was found in seven species of Euphausiacea. Six of these species were categorized as abundant, while one (E. tenera) was a rare species. Gravid females were found at all depth ranges with the majority found between 200 and 600 m (Table 3). N. atlantica/N. microps gravid females (total of 1683 gravid females, 9.3% of the sampled population) were present in all depth ranges, with the vast majority occurring between 0 and 600 m depth. The total number of gravid N. atlantica/N. microps females (the only species for which large numbers of gravid females were found) varied from April to June, but the total number of individuals varied as well, so there were no substantial differences in the percent of gravid females collected each month. Four of the seven species that had at least one gravid female, had the largest percent of their population gravid in the month of June. In addition, the number of species with gravid females increased from one in April, to five in May, to six in June (Table 4). Previous studies suggest that euphausiids reproduce seasonally (Cuzin-Roudy, 2000; Gómez-Gutiérrez and Robinson, 2005), and data from the current study point towards a seasonal aspect to their reproduction as well. Further data are needed on reproductive seasonality in euphausiids, as the timing of events like an oil spill in the GOM would have significantly greater impacts if they occur during the reproductive season.
The data for most species in the current study support the conclusions of Kinsey and Hopkins (1994) in terms of whether species are strong, weak or non-vertical migrators. Based on the data reported in the current study, T. tricuspidata, whose sample size was too small for Kinsey and Hopkins (1994) to categorize, can now also be added to the list of strong vertical migrators in the GOM, with more than 50% of the daytime population ascending to shallower depths at night. N. atlantica/N. microps and Stylocheiron maximum were considered to be vertical migrators by Kinsey and Hopkins (1994), but their sample size was not large enough for them to distinguish between strong and weak vertical migrators. Based on the large sample sizes in the current study, these species can be identified as weak vertical migrators, as are Nematobrachion sexspinosum, Bentheuphausia amblyops, and T. acutifrons/T. orientalis.
However, their conclusion that S. longicorne was a vertical migrator are not supported by the results of the current study. Their conclusion was based on a small sample size and apparent movements from 200 to 300 m during the day, to 125 to 200 m during the night. These depth ranges encompass two of the depth ranges in the current study, so if vertical migrations were occurring, they should have been apparent. Based on the large sample size in the current study and the fact that the percentage of the population at night in the epipelagic zone (2.3%) was lower than during the day (7.4%), this species should be considered a non-vertical migrator.
Bergstrom and Stromberg (1997), studying the euphausiid assemblage off the Swedish west coast, found that Meganyctiphanes norvegica did not vertically migrate through a thermocline that was present between 50 and 60 m, although Thysanoessa raschii did. This suggests that some euphausiid species may be limited by thermoclines with respect to their vertical distribution, but others are not. At the time of the current study, a thermocline was present between 25 and 600 m and a halocline was present between 125 and 500 m at both slope and offshore locations (Burdett et al., 2017). As shown by Burdett et al., there were no significant differences between temperature or salinity at similar depths between slope and offshore stations. Since the thermocline in the present study extended for hundreds of meters and all the vertically migrating species of euphausiids traversed these depths, it does not appear that the presence of a thermocline inhibited the vertical activity of euphausiids in this study. In addition, the lack of differences in this parameter between offshore and slope stations indicates that differences in distribution patterns for these species cannot be attributed to this factor.
Supplementary Table S2 shows depth ranges for all euphausiids caught in the GOM from previous studies. Due to the deeper depths included in the current study, the depth ranges of 30 species have been expanded – 25 down to 1500 m. two down to 1200 m, and three to shallower depths where they were not reported before.
There is one species of weak vertical migrator, Bentheuphausia amblyops, with a deeper daytime depth distribution than the other 15 abundant species, with more than 50% of the daytime population found at the depth of the subsurface plume (1000 to 1200 m) that initially resulted from the DWHOS [e.g., Camilli et al., 2010; Hazen et al., 2010; Ryan et al., 2011)]. One might anticipate that this species would be more profoundly affected by the oil spill that the shallower living species. However, extensive sampling of the water column in 2010 from the surface to just above the seafloor showed PAH concentrations higher than 0.3 μ/L in (Murawski et al., 2016; Romero et al., 2018), levels which are toxic to marine organisms (Whitehead et al., 2012). Therefore, it is unlikely that any species specific effects would be present. In addition, these types of analyses require comparisons with samples collected before the oil spill, and these samples do not exist, with the exception of the 15-year old Kinsey and Hopkins study, which did not mention quantify B. amblyops in their study.
However, the fact that 11 of the 16 most abundant species are vertical migrators can substantially increase the impact of an anthropogenic event such as an oil spill. Vertical migrators serve as vectors of oil released in deeper waters, such as the DWHOS, to surface waters, as well as vectors of oil spilled at the surface, to deeper waters. Being primary prey for a variety of species – stomiid deep-sea fish, tuna, whales, seabirds (Sutton and Hopkins, 1996; Deagle et al., 2007; Schramm, 2007; Jayalakshmi et al., 2011) – they would serve as mechanisms of trophic transport of contaminants through the food web.
In conclusion, the results of this study indicate that there are significant differences between offshore and slope assemblages of euphausiids, with both biomass and abundance being significantly higher at the slope stations, indicating that these location factors need to be taken into account when describing the assemblages in regions when sampling includes stations close to the continental slope. In addition, this study also supports suggestions from earlier studies that seasonality in reproduction is present in euphausiids, data that are vital for modeling potential effects of anthropomorphic disturbances in this region. While no conclusions can be drawn about the impact of the DWHOS, it is interesting that there has been a shift in the assemblage from domination by smaller species to domination by larger species between a study that occurred 15 years ago, and the current study, that occurred 1 year after the oil spill. Finally, the large number of vertical migrators, the extent of their migrations, and the significant effect of this behavior on species richness in shallow waters, emphasizes the need to conduct studies of this type throughout the water column, both during the day and at night. These data will also serve as an impacted baseline against which to monitor future assemblage shifts as the region recovers from any changes that may have resulted from the Deepwater Horizon oil spill.
The datasets generated for this study can be found in the https://data.gulfresearchinitiative.org (doi: 10.7266/N7VX0DK2).
TS and AC did all the cruise planning, led the cruises, and provided the samples for analysis. TF, CF, and EB completed all the taxonomic analysis. TF and CF completed the majority of the statistical analyses, wrote the manuscript, and produced the figures and tables.
The authors declare that the research was conducted in the absence of any commercial or financial relationships that could be construed as a potential conflict of interest.
This project was funded in part by the NOAA Office of Response and Restoration and in part from a grant from the Gulf of Mexico Research Initiative (GoMRI) to the Deep Pelagic Nekton Dynamics of the Gulf of Mexico (DEEPEND) Consortium. Data are publicly available through the Gulf of Mexico Research Initiative Information and Data Cooperative (GRIIDC) at https://data.gulfresearchinitiative.org (doi: 10.7266/N7VX0DK2).
We thank the crew of the M/V Meg Skansi for collecting the samples used in this study. We also thank Martha Nizinski for her aid in validating specimen identification, Lacey Malarky for her contributions to the statistical analysis of this report, and D. Hahn and N. Thompson for the manuscript review.
The Supplementary Material for this article can be found online at: https://www.frontiersin.org/articles/10.3389/fmars.2020.00099/full#supplementary-material
Aguzzi, J., and Company, J. B. (2010). Chronobiology of deep-water decapod crustaceans on continental margins. Adv. Mar. Biol. 58, 55–225. doi: 10.1016/B978-0-12-381015-1.00003-4
Aguzzi, J., Sbragaglia, V., Tecchio, S., Navarro, J., and Company, J. B. (2015). Rhythmic behaviour of marine benthopelagic species and the synchronous dynamics of benthic communities. Deep Sea Res. Part 1 Oceanog. Res. Pap. 95, 1–11. doi: 10.1016/j.dsr.2014.10.003
Atkinson, A., Siegel, V., Pakhomov, E. A., Jessopp, M. J., and Loeb, V. (2009). A re-appraisal of the total biomass and annual production of Antarctic krill. Deep Sea Res. I 56, 727–740. doi: 10.1016/j.dsr.2008.12.007
Baker, A. de, C., Boden, B. P., and Brinton, E. (1990). A Practical Guide to the Euphausiids of the World. London: Natural History Museum, 1–96.
Bergstrom, B., and Stromberg, J. O. (1997). Behavioral differences in relation to pycnoclines during vertical migration of the euphausiids Meganyctiphanes norvegica (M. Sars) and Thysanoessa raschii (M. Sars). J. Plankton Res. 19, 255–261. doi: 10.1093/plankt/19.2.255
Biggs, D. C., Zimmerman, R. A., Gasca, R., Suarez-Morales, E., Castellanos, I. A., and Leben, R. R. (1977). Note on plankton and cold-core rings in the Gulf of Mexico. Fish. Bull. 95, 369–375.
Brinton, E., Ohman, M. C., Townsend, A. W., Knight, M. D., and Bridgeman, A. L. (2000). Euphausiids of the World Ocean. Leiden: ETI BioInformatics.
Burdett, E., Fine, C., Sutton, T., Cook, A., and Frank, T. (2017). Geographic and depth distributions, ontogeny, and reproductive seasonality of decapod shrimps (Caridea: Oplophoridae) from the northeastern Gulf of Mexico. Bull. Mar. Sci. 93, 743–767. doi: 10.5343/bms.2016.1083
Burghart, S. E., Hopkins, T. L., and Torres, J. J. (2007). The bathypelagic decapoda, lophogastrida, and Mysida of the eastern Gulf of Mexico. Mar. Biol. 152, 315–327. doi: 10.1007/s00227-007-0691-3
Camilli, R., Reddy, C. M., Yoerger, D. R., Van Mooy, B. A. S., Jakuba, M. V., Kinsey, J. C., et al. (2010). Tracking hydrocarbon plume transport and biodegradation at Deepwater Horizon. Science 330, 201–204. doi: 10.1126/science.1195223
Castellanos, I. A., and Gasca, R. (1996). Eufáusidos (Crustacea: Euphausiacea) de aguas superficiales del sur del Golfo de Mexico. Caribb. J. Sci. 32, 187–194.
Castellanos, I. A., and Gasca, R. (1999). Epipelagic euphausiids (Euphausiacea) and spring mesoscale features in the Gulf of Mexico. Crustaceana 72, 391–404. doi: 10.1163/156854099503456
Cohen, J. H., and Forward, R. B. Jr. (2009). Zooplankton diel vertical migration-a review of proximate control. Oceanogr. Mar. Biol. 47, 77–110.
Cuzin-Roudy, J. (2000). Seasonal reproduction, multiple spawning, and fecundity in northern krill, Meganyctiphanes norvegica, and Antarctic krill, Euphausia superba. Can. J. Fish. Aquat. Sci. 57, 6–15. doi: 10.1139/f00-165
Deagle, B. E., Gales, N. J., Evans, K., Jarman, S. N., Robinson, S., Trebilco, R., et al. (2007). Studying seabird diet through genetic analysis of faeces: a case study on macaroni penguins (Eudyptes chrysolophus). PLoS One 2:831. doi: 10.1371/journal.pone.0000831
Eldridge, P. J. (1988). The southeast area monitoring and assessment program (SEAMAP): a state federal-university program for collection, management, and dissemination of fishery-independent data and information in the southeastern United States. Mar. Fish Rev. 50, 29–39.
Feagans-Bartow, J. N., and Sutton, T. T. (2014). Ecology of the oceanic rim: pelagic eels as key ecosystem components. Mar. Ecol. Prog. Ser. 502, 257–266. doi: 10.3354/meps10707
Felder, D. L., and Camp, D. K., (2010). Gulf of Mexico Origin, Waters, and Biota: Biodiversity. College Station, TX: Texas A&M University Press.
Gasca, R., Castellanos, I., and Biggs, D. C. (2001). Euphausiids (Crustacea Euphausiacea) and summer mesoscale features in the Gulf of Mexico. Bull. Mar. Sci. 68, 397–408.
Gibbons, M. J., Spiridonov, V. A., and Tarling, G. A., (1999). “Euphausiacea,” in South Atlantic Zooplankton, Vol. 2, ed. D. Boltovskoy, (Leiden: Backhuys Publishers)Google Scholar
Gómez-Gutiérrez, J., and Robinson, C. J. (2005). Embryonic, early larval development time, hatching mechanism and interbrood period of the sac-spawning euphausiid Nyctiphanes simplex Hansen. J. Plankton Res. 27, 279–295. doi: 10.1093/plankt/fbi003
Gulfbase.org (2012). Resource Database for Gulf of Mexico Research. Available at: http://www.gulfbase.org/facts.php
Hazen, T. C., Dubinsky, E. A., DeSantis, T. Z., Andersen, G. L., Piceno, Y. M., and Singh, N., et al., (2010). Deep-sea oil plume enriches indigenous oil-degrading bacteria. Science 330, 204–208. doi: 10.1126/science.1195979
Hill, M. O. (1973). Diversity and evenness: a unifying notation and its consequences. Ecology 54, 427–432. doi: 10.2307/1934352
Hopkins, T. L., Gartner, J. V. Jr., and Flock, M. E. (1989). The caridean shrimp (Decapoda: Natantia) assemblage in the mesopelagic zone of the eastern Gulf of Mexico. Bull. Mar. Sci. 45, 1–14.
James, B. M., (1970). “Euphausiacean crustacea,” in Contributions on the Biology of the Gulf of Mexico, eds W. E. Pequegnat, and F. A. Chase, Jr. (Houston: Gulf Publishing), 205–229.
Jayalakshmi, K. J., Jasmine, P., Muraleedharan, K. R., Prabhakaran, M. P., Habeebrehman, H., Jacob, J., et al. (2011). Aggregation of Euphausia sibogae during summer monsoon along the southwest coast of India. J. Mar. Biol. 10:945734. doi: 10.1155/2011/945734
Jayaraman, K. (1999). A Statistical Manual for Forestry Research. Bangkok: Food and Agricultural Organization of the United Nations, Regional Office for Asia and the Pacific, 1–231.
Jiang, Z., Huang, Y., Chen, Q., Zeng, J., and Xu, X. (2012). Acute toxicity of crude oil water accommodated fraction on marine copepods: the relative importance of acclimatization temperature and body size. Mar. Environ. Res. 81, 12–17. doi: 10.1016/j.marenvres.2012.08.003
Kinsey, S. T., and Hopkins, T. L. (1994). Trophic strategies of euphausiids in a low-latitude ecosystem. Mar. Biol. 118, 651–661. doi: 10.1007/bf00347513
Lindén, O. (1976). Effects of oil on the amphipod Gammarus oceanicus. Environ. Pollut. (1970) 10, 239–250. doi: 10.1016/j.toxicon.2013.11.015
Mikkelsen, P. (1987). The Euphausiacea of eastern Florida (Crustacea: Malacostraca). Proc. Biol. Soc. 100, 275–295.
Moore, H. B. (1950). The relation between the scattering layer and the Euphausiacea. Biol. Bull. 99, 181–212. doi: 10.2307/1538738
Murawski, S. A., Fleeger, J. W., Patterson, W. F., Hu, C., Daly, K., Romero, I., et al. (2016). How did the Deepwater Horizon oil spill affect coastal and continental shelf ecosystems of the Gulfof Mexico? Oceanography 29, 160–173. doi: 10.5670/oceanog.2016.80
Nichols, D. (2018). A Temporal Analysis of a Deep-Pelagic Crustacean Assemblage (Decapoda: Caridea: Oplophoridae and Pandalidae) in the Gulf of Mexico After the Deep Water Horizon Oil Spill. Ph.D. thesis, Nova Southeastern University, Fort Lauderdale, FL. doi: 10.2307/1538738
Omori, M., and Ikeda, T. (1984). Methods in marine zooplankton ecology. J. Mar. Biol. Assoc. U. K. 65, 562–894.
Reddy, C. M., Arey, J. S., Seewald, J. S., Sylva, S. P., Lemkau, K. L., Nelson, R. K., et al. (2011). Composition and fate of gas and oil released to the water column during the Deepwater Horizon oil spill. Proc. Nat. Acad. Sci. U.S.A. 109, 20229–20234. doi: 10.1073/pnas.1101242108
Reid, S. B., Hirota, J., Young, R. E., and Hallacher, L. E. (1991). Mesopelagic-boundary community in Hawaii: micronekton at the interface between neritic and oceanic ecosystems. Mar. Biol. 109, 427–440. doi: 10.1007/BF01313508
Roger, C. (1978). Bioecological Sheets on Tropical Pacific Euphausiids. Initiations – Documentations Techniques, Paris (ORSTOM) 36. Paris: IRD Editions, 1–81.
Romero, I. C., Sutton, T., Carr, B., Quintana-Rizzo, E., Ross, S. W., Hollander, D. J., et al. (2018). Decadal assessment of polycyclic aromatic hydrocarbons in mesopelagic fishes from the Gulf of Mexico reveals exposure to oil-derived sources. Environ. Sci. Technol. 52, 10985–10996. doi: 10.1021/acs.est.8b02243
Ryan, J. P., Zhang, Y., Thomas, H., Rienecker, E. V., Nelson, R. K., and Cummings, S. R. (1‘2011). “A high-resolution survey of a deep hydrocarbon plume in the Gulf of Mexico during the 2010 Macondo blowout,” in Monitoring and Modeling the Deepwater Horizon Oil Spill: A Record-Breaking Enterprise. Geophysical Monograph Series, Vol. 195, eds Y. Liu, A. Macfadyen, Z.-G. Ji, and R. H. Weisberg, 63–75. doi: 10.1029/2011GM001106
Schmidt-Nielsen, K. (1984). Scaling: Why is Animal Size so Important? Cambridge: Cambridge University Press.
Schramm, M. J. (2007). Tiny Krill: Giants in Marine Food Chain. NOAA National Marine Sanctuary Program. Available at: http://sanctuaries.noaa.gov/news/pdfs/sanctuarywatch/sw8_3.pdf (accessed December 12, 2013).
Springer, S., and Bullis, H. R. Jr. (1956). Collections by the Oregon in the Gulf of Mexico. List of Crustaceans, Mollusks, and Fishes Identified From Collections Made by the Exploratory Fishing Vessel Oregon in the Gulf of Mexico and Adjacent Seas 1950 Through 1955. United States Department of the Interior, Special Scientific Report, Fisheries, 196. Washington, DC: U.S. Department of the Interior, Bureau of Commercial Fisheries, 1–134.
Sutton, T. T. (2013). Vertical ecology of the pelagic ocean: classical patterns and new perspectives. J. Fish. Biol. 83, 1508–1527. doi: 10.1111/jfb.12263
Sutton, T. T., and Hopkins, T. L. (1996). Trophic ecology of the stomiid (Pisces: Stomiidae) fish assemblage of the eastern Gulf of Mexico: strategies, selectivity and impact of a top mesopelagic predator group. Mar. Biol. 127, 179–192. doi: 10.1007/bf00942102
Whitehead, A., Dubansky, B., Bodinier, C., Garcia, T.I, Miles, S., Pilley, C., et al. (2012). Genomic and physiological footprint of the Deepwater Horizon oil spill on resident marsh fishes. Proc. Natl. Acad. Sci. U.S.A. 109, 20298–20302. doi: 10.1073/pnas.1109545108
Keywords: deep-sea crustaceans, mesopelagic, Euphausiacea, Gulf of Mexico, vertical migrations
Citation: Frank TM, Fine CD, Burdett EA, Cook AB and Sutton TT (2020) The Vertical and Horizontal Distribution of Deep-Sea Crustaceans in the Order Euphausiacea in the Vicinity of the DeepWater Horizon Oil Spill. Front. Mar. Sci. 7:99. doi: 10.3389/fmars.2020.00099
Received: 31 July 2019; Accepted: 06 February 2020;
Published: 21 February 2020.
Edited by:
Daphne Cuvelier, Center for Marine and Environmental Sciences (MARE), PortugalReviewed by:
Patricia Esquete Garrote, University of Aveiro, PortugalCopyright © 2020 Frank, Fine, Burdett, Cook and Sutton. This is an open-access article distributed under the terms of the Creative Commons Attribution License (CC BY). The use, distribution or reproduction in other forums is permitted, provided the original author(s) and the copyright owner(s) are credited and that the original publication in this journal is cited, in accordance with accepted academic practice. No use, distribution or reproduction is permitted which does not comply with these terms.
*Correspondence: Tamara M. Frank, dGZyYW5rMUBub3ZhLmVkdQ==
Disclaimer: All claims expressed in this article are solely those of the authors and do not necessarily represent those of their affiliated organizations, or those of the publisher, the editors and the reviewers. Any product that may be evaluated in this article or claim that may be made by its manufacturer is not guaranteed or endorsed by the publisher.
Research integrity at Frontiers
Learn more about the work of our research integrity team to safeguard the quality of each article we publish.