 Fahad Al Senafi1*
 Raeid M. M. Abed2
 Thirumahal Muthukrishnan2
 Ayal Anis3
 Ahmed N. Al Rawahi2,4
 Huda Mahmoud5
- 1Department of Marine Science, Kuwait University, Safat, Kuwait
- 2Department of Biology, Sultan Qaboos University, Muscat, Oman
- 3Department of Oceanography, Texas A&M University, College Station, TX, United States
- 4Natural and Medical Sciences Research Center, University of Nizwa, Nizwa, Oman
- 5Department of Biological Sciences, Kuwait University, Safat, Kuwait
Information pertaining to changes in abundance and composition of microbial communities on offshore platforms in relation to changes in environmental conditions due to internal tides are scarce. In this study, artificial substrata were deployed at two locations on a gently sloping seabed off the coast of Kuwait. The abiotic factors at the two sites were recorded spatially and temporally using time-series measurements and continuous turbulence profiling for 13 days. Results showed variations in water density between the upper and deeper waters with the pycnocline undulating between 6 and 15 m depth at both locations. In the water layer beneath the pycnocline, significant current shear due to the internal tides led to higher turbidity coupled with lower dissolved oxygen (DO) and chlorophyll a concentration. The microbiological data showed a significant decrease in the biofilm total biomass, bacterial counts and phototrophic biomass with increase in depth at both locations. The 16S rRNA amplicon sequence analysis revealed that biofouling bacterial communities were affected by depth with Alphaproteobacteria and Bacteroidetes members dominating the upper and deeper waters at both locations. The non-metric multidimensional scaling (NMDS) based-ordination analysis revealed that biofouling bacterial communities at 3 m were different than at 15 m, with a percentage of shared operational taxonomic units (OTUs) ≤64% between locations and depths. The power of the employed system is demonstrated in the results that shed light on the significance of prevailing environmental conditions associated with internal tides in shaping the biofilm community in subtropical offshore water systems.
Introduction
The Arabian Gulf (AG) is a semi-enclosed shallow basin with an average depth of 36 m that is situated in the subtropical high-pressure belt region (25–30°N) where the harshest deserts are found (Chao et al., 1992). The region experiences large swings in average air temperatures that can range between 11°C in winter and >50°C in summer (Rezai et al., 2004; Al Senafi and Anis, 2015). The relatively shallow AG, and the coastal regions in particular, exhibit strong stratification from late spring to early fall, mainly as a result of the intense solar heating (Sultan and Elghribi, 1996; Swift and Bower, 2003). During summer, the northern AG becomes roughly a two-layer system with a mixed surface layer and a mixed bottom layer, which is a residual of the winter water (Reynolds, 1993). So far, few studies have been conducted to monitor the differences in hydrographic conditions between these two layers and between different locations in the AG.
The combination of warm waters, high solar radiation availability, and nutrient-rich inflow from the 880 m3/s Tigris–Euphrates–Karun delta discharge in the northern tip makes the AG ideal for biofouling growth and its marine commercial sector vulnerable to negative effects (Reynolds, 1993; Thoppil and Hogan, 2010). Although biofouling has been extensively studied in inshore or near shore surfaces, a relatively much less research has investigated offshore biofouling. Previous studies conducted in the offshore areas of the AG, Scottish Sea, Mediterranean Sea, North Sea, and the North China Sea, focused mainly on macrofoulers and showed an overall low fouling biomass and low amounts on various surfaces deployed in deeper waters compared to subsurface waters (Ghobashy and El Komy, 1980; Stachowitsch et al., 2002; Head et al., 2004; Abdelsalam and Wahab, 2012; Zhang et al., 2015; Beukhof et al., 2016; Van der Stap et al., 2016). On the contrary, information pertaining to variability in the abundance and composition of bacterial communities on offshore platforms has rarely been reported since first introduced by Mohammad (1976). Offshore biofouling is of a major concern to the AG countries, mainly because their marine commercial sector is vulnerable to negative effects (Reynolds, 1993; Thoppil and Hogan, 2010). For instance, on an average day, about 20 tankers carrying 25 million barrels per day of total petroleum pass through the AG. These tankers that supply six contents represent 35% of the global oil tankers (Cordesman, 2007; U. S. Energy Information Administration, 2016). The undesired growth of biofilms has been a recurring costly problem to all marine commercial sectors (Sandholm and Wirtanen, 1992): costing the shipping industry an annual 5 billion United States Dollars for antifouling agents (Sathe et al., 2016). Although the shipping industry in the AG plays a major role in the regional economy, surprisingly few studies on biofouling have been conducted in the region.
In this study, two inter-linked tracks were applied: (1) to monitor the hydrographic and meteorological conditions through the changes in temperature and salinity structures, ambient stratification, water currents, energy budgets, chlorophyll a, dissolved oxygen (DO), and external forcing, i.e., wind stress and heat fluxes at two depths (3 and 15 m) at two offshore locations in the AG coasts off Kuwait and (2) to characterize the composition, abundance, and biomass of fouling bacterial communities on acrylic panels deployed at the same depths and locations. Our aim was to understand the physical processes associated with meteorological and hydrographic changes on the continental shelf of the north-western AG and relate them to bacterial biofilm diversity and development. We hypothesize that the differences in depths on a slope would generate environmental variations and the differences in environmental conditions would lead to variations in bacterial biofilm diversity and development.
Materials and Methods
Study Site and Setup
Two moorings were deployed on a gentle slope seabed (0.23°) at two locations off the coast of Fintas, Kuwait. The site was naturally muddy and flat with no topographic features making it ideal to focus solely on the physical-chemical effects that varied with depth and location. The deployment lasted for 13 days between 15 and 27 July 2017 to observe the complete succession of the neaps and springs tides. The first location (29°10′25.62″ N, 48°09′53.70″ E) was 4 km offshore at a nominal depth of 24 m and the second location (29°09′34.92″ N, 48°08′14.25″ E) was 1 km offshore at a nominal depth of 17 m. Both locations included a mooring (#1 and #2) with eight white acrylic panels with a surface area of 600 cm2 placed at two depth levels (3 and 15 m). These depth levels were centered between the upper and bottom layers that were separated by the pycnocline at ∼10.5 m depth (Figure 1). The four panels at each depth level were attached to a white plastic pipe that was connected to the mooring line using a rotating swivel, orienting the pipe to face into the currents to make sure that all pipes are consistent in direction throughout the study period. Unfortunately, both R12 and R16 panels from mooring #2 were lost during the experiment.
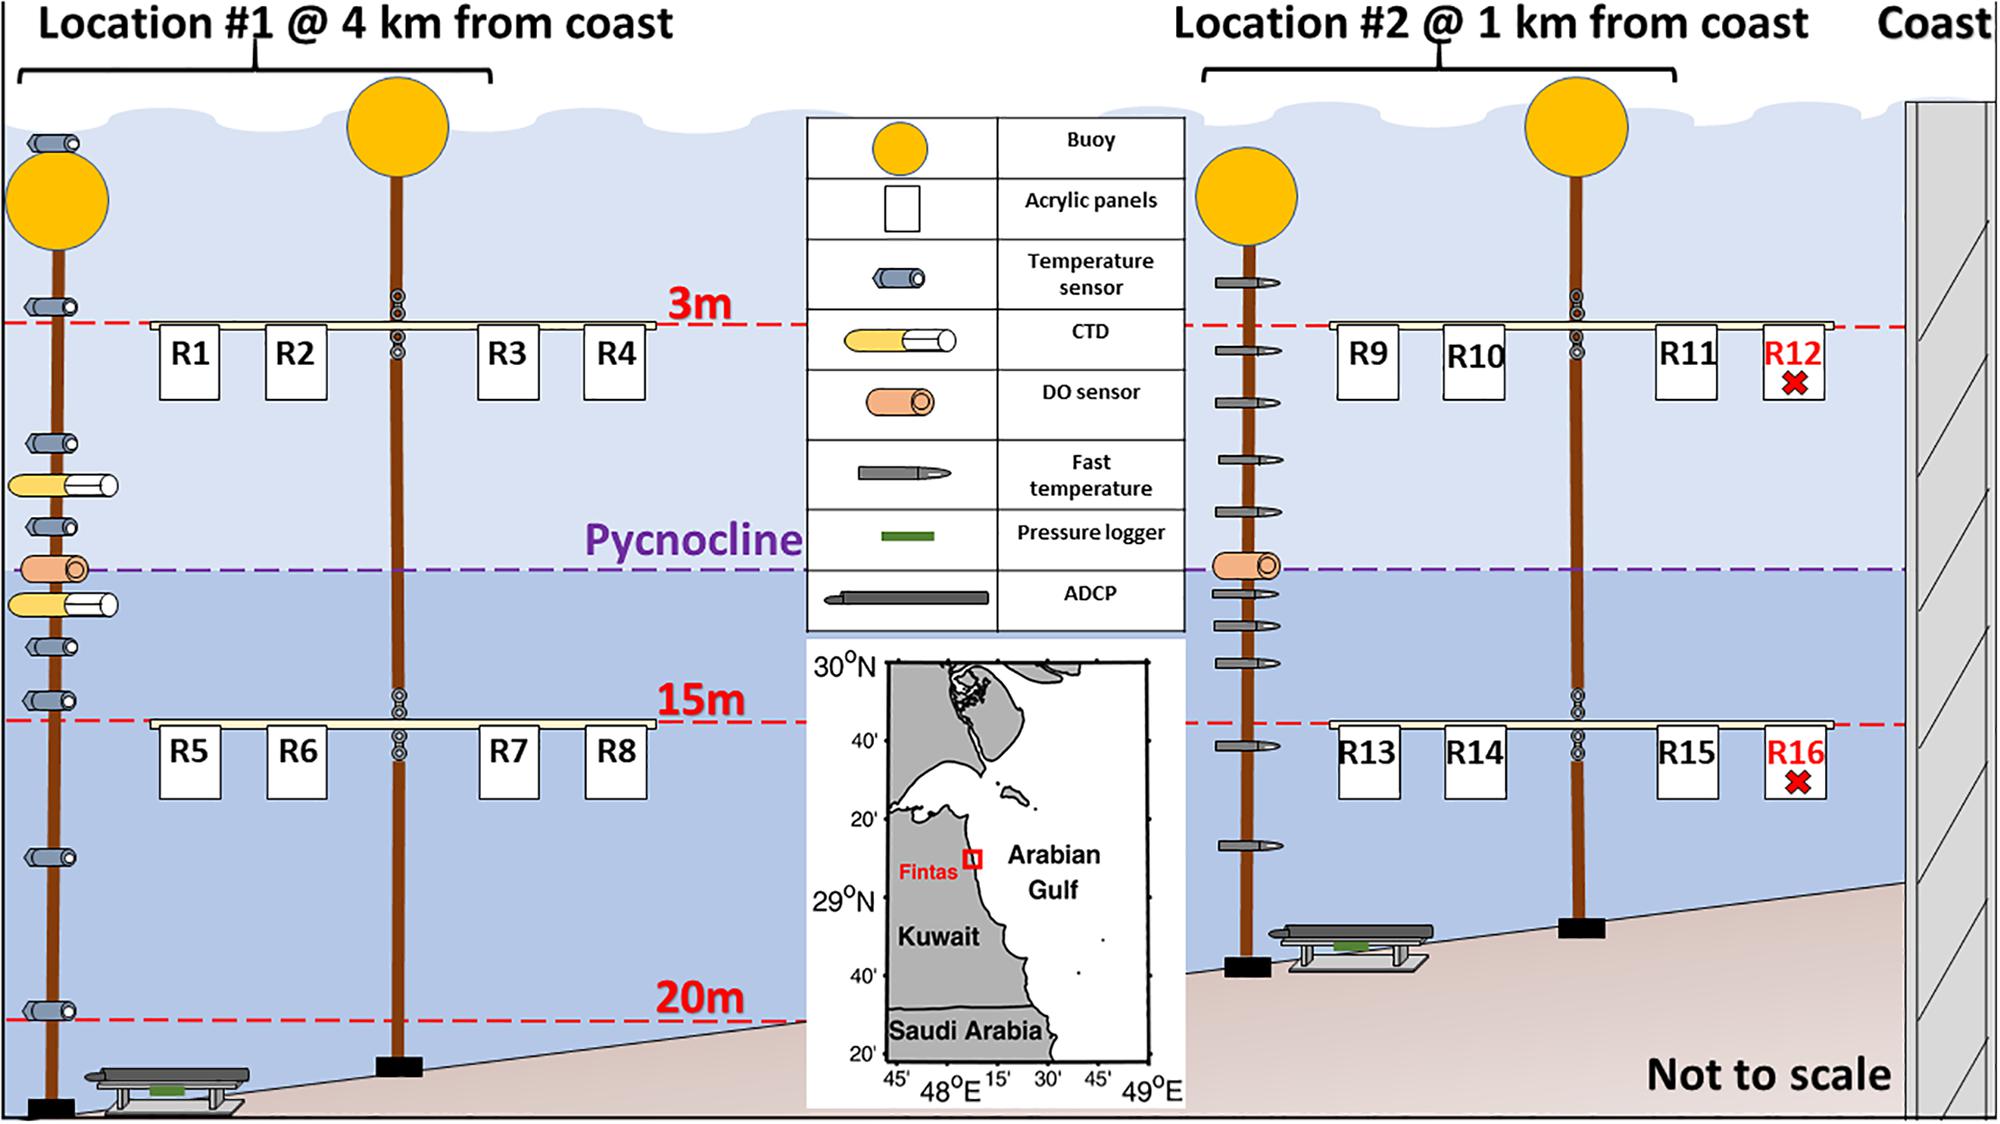
Figure 1. Map and schematic of the sampling design at locations #1 and #2 off the coast of Fintas, Kuwait.
Monitoring the Environmental Conditions
Two observational approaches were used to monitor the environmental conditions both spatially and temporally. The first approach was time-series measurements using two moorings carrying hydrographic instruments deployed within 25 m from each of the white acrylic panel moorings at locations #1 and #2. These moorings included measurements of current velocities using acoustic Doppler current profilers (ADCPs), temperature, salinity using a CTD (conductivity-temperature-depth) loggers, pressure, and DO (Figure 1 and Table 1).
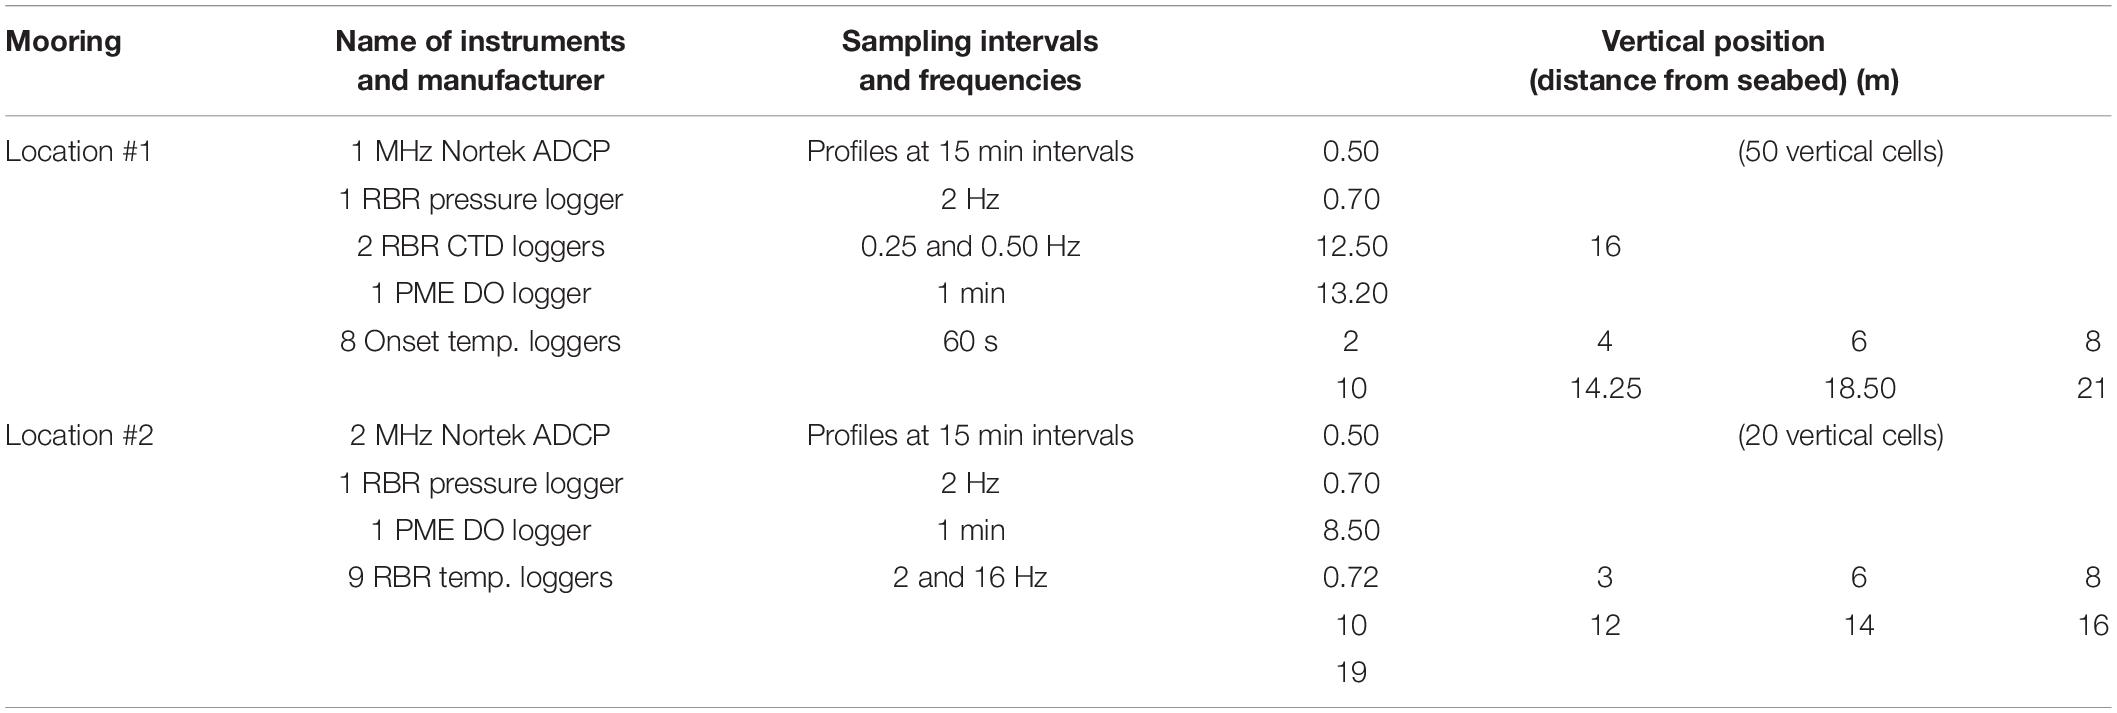
Table 1. Mooring setup and details.
In order to emphasize the tidal role in the current structure at the different stages of the tidal cycle, the current structure was phase averaged, ϕ,
where t is time, pn is the demeaned pressure, and τt is the tidal period. A ± π phase corresponds to high water (HW) while zero corresponds to low water (LW). This follows an approach by Richards et al. (2013) and McCardell et al. (2016) who analyzed the current structure in tidal dominate regions.
The second approach was 2 days (July 15–17) of continues turbulence profiling to obtain measurements of the physical and turbulence parameters using Rockland Scientific micro-CTD profiler, measuring at a rate of 512 Hz. The free-falling profiler provided measurements during descend of conductivity, temperature, chlorophyll a, and turbidity throughout the water column. A full day of profiling was conducted at each of the two study locations, comprising of a total of 580 profiles.
In addition, the profiler was equipped with two current shear probes that provided high resolution (∼1 mm) velocity fluctuation measurements. The velocity measurements from each profile were split into 26 overlapping (50% overlap) groups with a vertical length of 1.4 m that contained 1024 measurements per group. Each group was then Cosine windowed to calculate the velocity fluctuation spectra after being high-pass Butterworth filtered to minimize noise. Using these spectra, the turbulence kinetic energy dissipation rates, ε, were directly estimated by integration (Bluteau et al., 2016)
where ν is the kinematic viscosity, is vertical shear velocity, Φ is the velocity fluctuation spectrum, and k is the wave number (Al Senafi and Anis, 2020).
To quantify the water column stability/instability we used the classical Richardson number, Ri = N2/S2, where the buoyancy frequency, N2, is the measure of stratification and S2 is the current shear. This number represents the ratio between potential energy and kinetic energy that has an empirical critical value, Ric, of 0.25 but may range between 0.2 and 1 (Galperin et al., 2007). A low Ri number (Ric > Ri), is associated with enough kinetic energy to cause vertical mixing and instability. While a high Ri number (Ric > Ri), is associated with high stratification that would suppress mixing.
To characterize the regional surface meteorology, a fully instrumented meteorological station was deployed. The station was installed at a pier in the Marine Science Center, Kuwait University located 800 m from location #2 moorings that provided time series measurements of air temperature, relative humidity, atmospheric pressure, rainfall, solar radiation, longwave radiation, and wind speed and direction at 1-min intervals. These measurements were used to compute momentum flux (wind stress), τ, and net heat flux, , at the air–sea interface using the Coupled Ocean Atmosphere Response Experiment algorithms (COARE 3.5; Fairall et al., 2003) to provide details of the surface forcing.
Quantitative Analysis of Biofouling Communities
The biofouling communities developed on the replicate panels at each depth in locations #1 and #2 were collected after 13 days using a sterile scalpel. The biofilms were transferred into sterile Falcon tubes and stored at −20°C for further processing. The total weight of the biofilms was determined using a weighing balance. The total bacterial density was estimated by staining 10 mg of each biofilm sample (n = 3) with 4,6-diamidino2-phenylindole (DAPI, Sigma, Munich, Germany) solution, as previously described (Dobretsov and Thomason, 2011). The total number of bacteria was counted in 20 randomly selected fields of view using an epifluorescence microscope (Axiostar Plus, Zeiss, Göttingen, Germany; magnification 1000×; λEx = 359 nm, λEm = 441 nm). The abundance of phototrophs within the biofilm was determined by measuring the concentration of chlorophyll a after extraction of 0.1–0.3 g of each biofilm (n = 3) in 90% acetone (Thermo Fisher Scientific Inc., Waltham, MA, United States) for 24 h in the dark. The absorbance of the resulting extract was measured at 645, 662, and 710 nm using spectrophotometry and the concentration of chlorophyll a was estimated according to Lorenzen (1967). Two-way ANOVA was used to test the effect of depth and location on total biomass, bacterial abundance, and chlorophyll a concentrations using Statistica 12 (StatSoft, United States). The post hoc Tukey honestly significant difference (HSD) test was used to test for significant differences in all cases at a threshold of 0.05.
Molecular Analysis of Bacterial Communities
The total genomic DNA was extracted from the triplicate biofilm samples collected at 3 and 15 m depths in both locations, using PowerSoil DNA extraction kit (MOBIO Laboratories, Inc., Carlsbad, CA, United States) according to the manufacturer’s instructions. Purified DNA extracts were then submitted to Molecular Research MR DNA laboratory1 (Shallowater, TX, United States) for paired-end Illumina MiSeq sequencing of the bacterial 16S rRNA genes V3-V4 variable region using the primers 341F (5′-CCTACGGGNGGCWGCAG-3′) and 805R (5′-GACTACHVGGGTATCTAATCC-3′) with barcode on the forward primer (Klindworth et al., 2013). Sequences were generated from the samples using the single indexing strategy. Samples were demultiplexed, and the sequencing adapters, barcodes, and primers were removed using the fastqprocessor developed by MRDNA (MRDNA, Shallowater, TX, United States, date accessed: December 23, 2019). This in turn oriented all the forward and reverse reads (R1 and R2, respectively). After demultiplexing, intact read pairs were extracted using pairfq_lite2 and these sequences were deposited to ENA (accession numbers PRJEB36024; ERP119154). Further processing was conducted in R (3.5.2) using the R package dada2 (1.10.1) with default parameters. Quality filtering was conducted at a maximum expected error rate of three for both forward and reverse reads after reads were truncated to 230 bp. Error learning (based on at least 108 bases) and denoising (pooling all sequences per run) were also executed. Consequently, the forward and reverse reads of each sample were merged with a minimum overlap of 10 bp, and chimera detection was performed with the method “consensus” on the whole data set. Furthermore, only sequences between 399 and 430 bp as well as those occurring at least twice in the data set were retained. Taxonomic classification was conducted using the silvangs web-service (date accessed April 12, 2019) with the SILVA ribosomal database (version 132). Only bacterial sequences classified on phylum level with a sequence similarity of at least 93% to the reference database and not affiliated with chloroplasts and mitochondria were used for the further analysis. OTUs were defined as unique amplicon sequence variants. OTU richness and Chao 1 index of the fouling bacterial communities were determined using an R customized script. Spatial and depth-related shifts in the composition of fouling bacterial communities were assessed using non-metric multidimensional scaling (NMDS) based on Bray–Curtis dissimilarities as previously described (Ramette and Tiedje, 2007). OTU partitioning was done to estimate the percentage of shared and unshared OTUs based on location and depth.
Results and Discussion
Environmental Conditions
Background Hydrographic Conditions
The water column thermal structure followed a diurnal pattern that was consistent with the day-night heating. The lowest water temperature of 32°C was recorded near the bottom at #1 on the night of July 15 commensurate with the lowest recorded air temperature of 33°C (Figure 2). The highest water temperature of 35°C was recorded near the surface at #2 on the afternoon of July 25. The water column average temperature toward the end of the study period was warmer at #1 and #2 by 1.2°C compared to the rest of period (Figure 2), likely in response to the persistent warmer air of >39°C brought by the north-westerly winds. Overall, water temperatures at the shallower location (#2) were warmer compared to the deeper location (#1) by an average difference of 1.4°C. Also, the vertical temperature variation from the sea surface to seabed at #2 was larger compared to that of #1 with variations of −1.33 and −0.99°C, respectively.
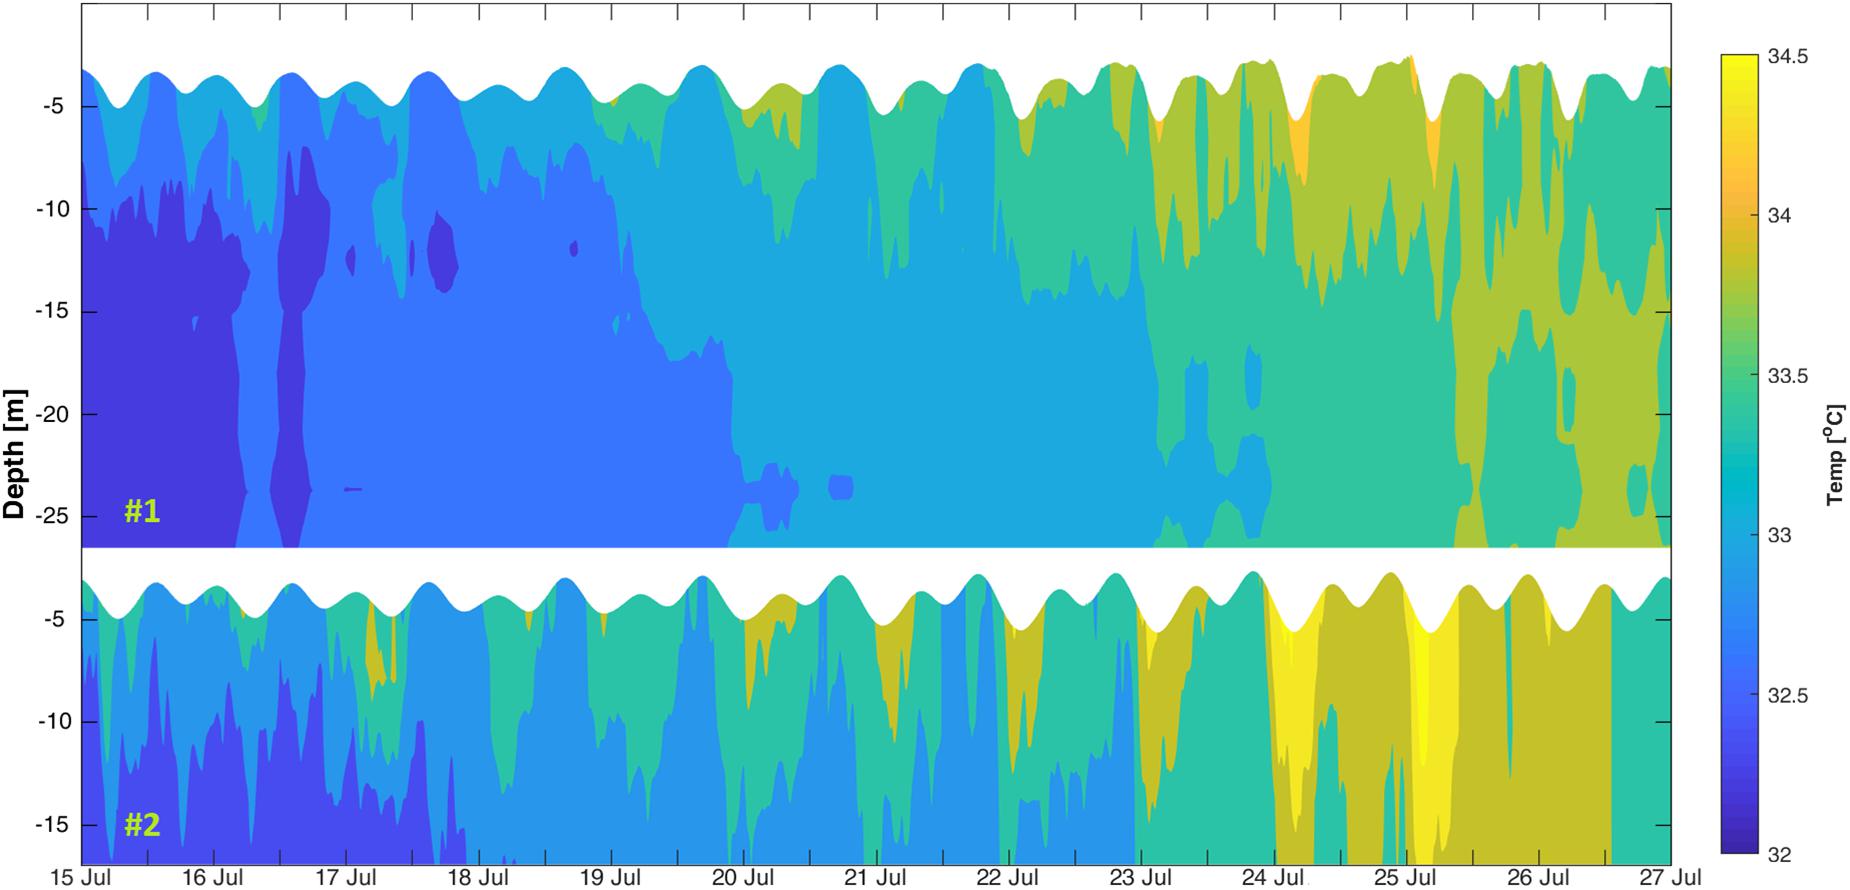
Figure 2. Vertical thermal structure between 15 and 27 July 2017 at #1 (top) and #2 (bottom).
Visual examination of the current structure at both locations revealed that the horizontal currents direction followed closely the tidal cycle, where the flooding phase generated north-easterly currents and the ebbing phase generated south-easterly currents (Figures 3A,B). This is highlighted in both horizontal (blue) and vertical (red) velocity power spectral density (PSD) at the semidiurnal (M2 and S2) and diurnal (K1 and O1) tide constituents periods (Figure 4). These tide constituents accounted for 95% of the total tidal kinetic and potential energy.
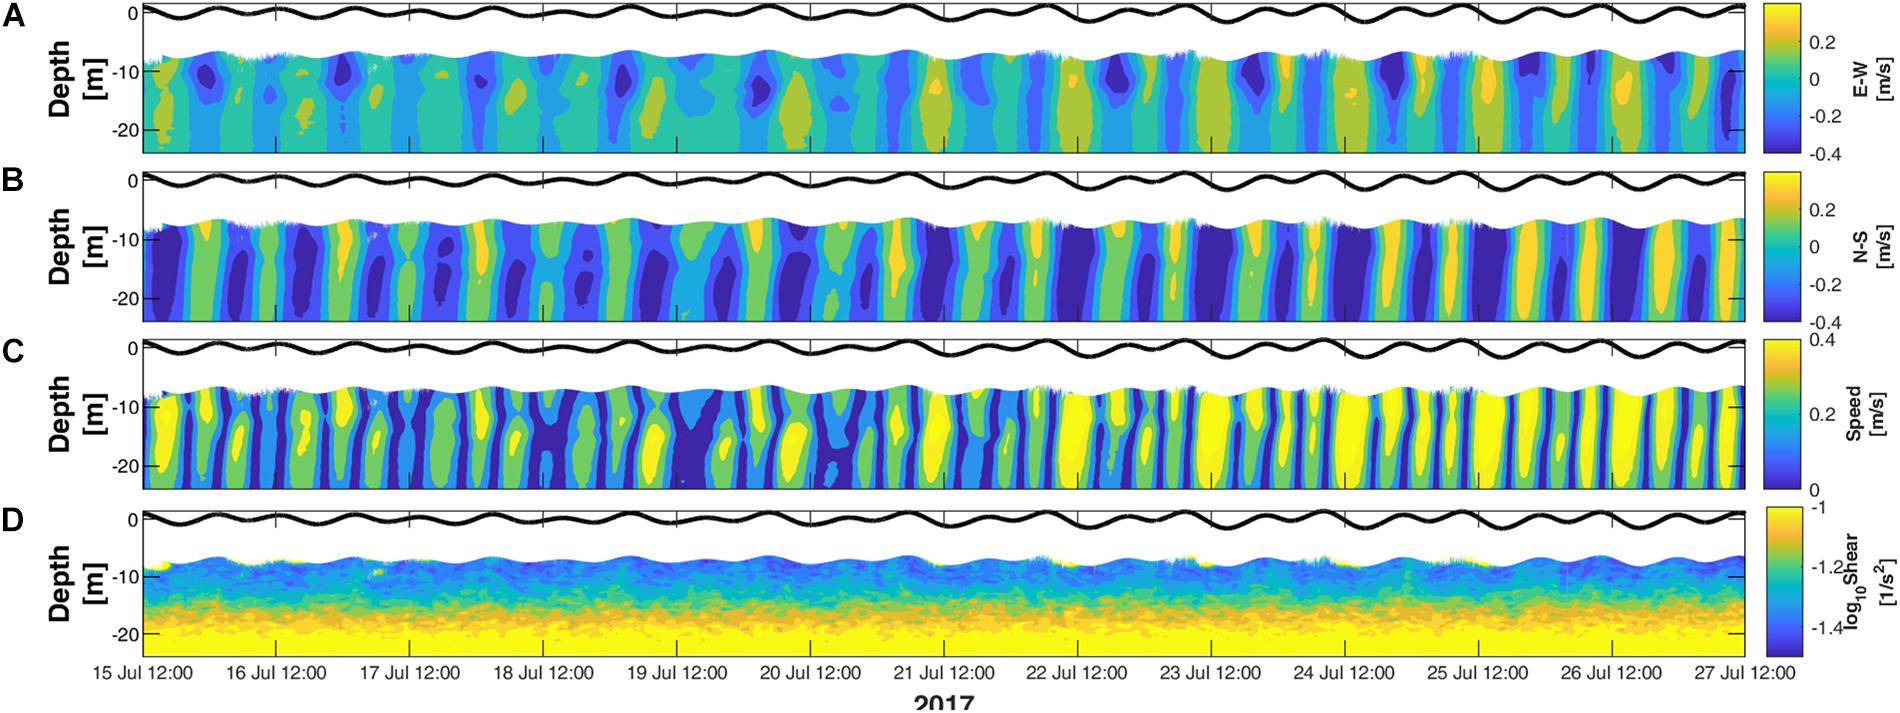
Figure 3. Current structure between 15 and 27 July 2017 averaged from locations #1 and #2. (A) East-West currents. (B) North-South currents. (C) Current speed. (D) Vertical shear of horizontal currents.
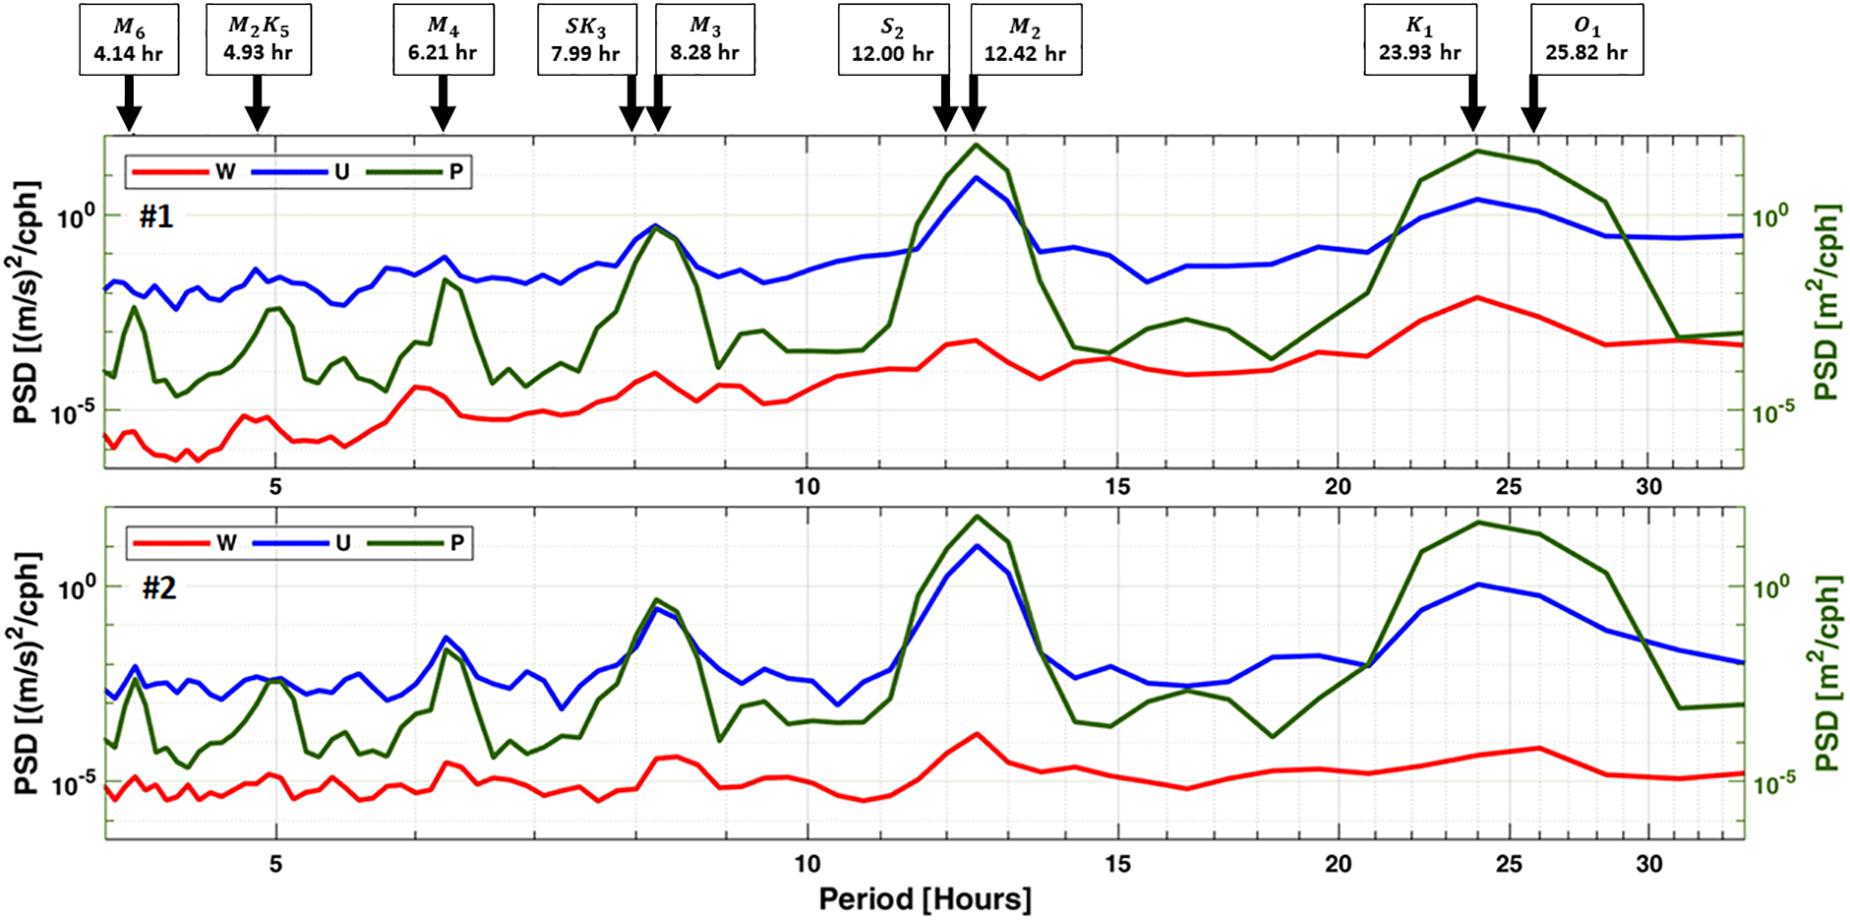
Figure 4. Power spectral density (PSD) of horizontal (blue) and vertical (red) velocities, computed as the average of all vertical cells, and pressure (green) between 15 and 27 July 2017. Black arrows indicate tidal constituents during elevated PSD levels.
The tides produced maximum changes in sea elevation of 2.91 m measured mid-springs on July 25, and minimum changes of 0.57 m measured mid-neaps on July 18. Despite the currents following a similar direction at both locations, they differed in speed with faster currents of up to 0.78 m/s recorded at #1 compared to 0.68 m/s at #2 (Figure 3C). Also, both locations were consistent in measuring higher variability of horizontal currents in the vertical direction at depths between 14 m and the seabed compared to the surface (Figure 3D).
The role of tides on the current structure is emphasized in the 12 days phase averaged (Eq. 1) current data from moorings #1 and #2 that clearly showed that during the tidal ebbing phase (HW to LW; −π to 0), the currents were southeastward (Figures 5B,C). A phase-averaged maximum speed of 0.48 m/s was observed at mid-depth (∼15 m) at #1 and 0.38 m/s at mid-depth (∼9 m) at #2 (Figure 5D). In contrast, during the tidal flooding phase (LW to HW; 0 to −π), the currents were northwestward with maximum phase averaged speeds of 0.46 m/s at #1 and 0.37 m/s at #2 both measured in the top 5 m.
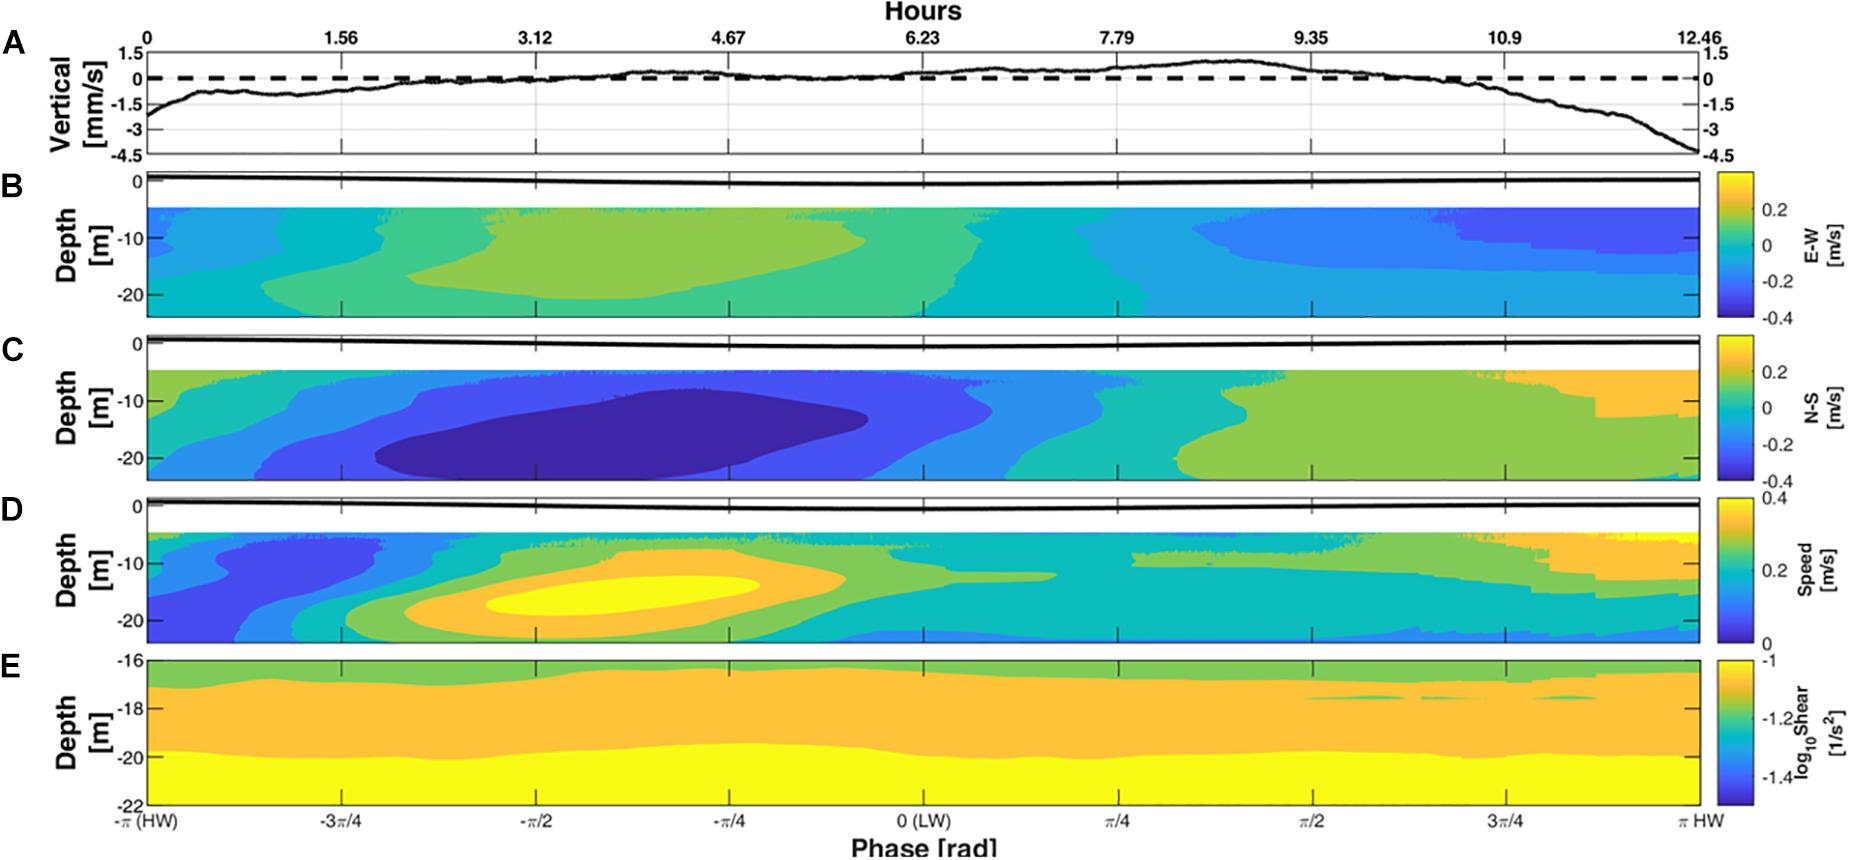
Figure 5. Phase averaged currents from 15 to 27 July 2017, averaged from locations #1 and #2. (A) Depth averaged vertical velocity; (B) E–W velocity; (C) N–S velocity; (D) horizontal speed. (E) Vertical shear of horizontal current. The time in the upper axis indicates hours into the M2 tide.
Spatial Variations in Environmental Conditions
The tidal dominance in the region reflected on the water column stability and water parameters. The 12 days vertical shear results described above revealed an overall consistent temporal pattern following the tidal cycle at both locations but differed vertically with depth (Figure 3D). The role of shear instabilities in inducing mixing are crucial in altering the environmental conditions that may result in variations of biofouling communities. To this end, we analyzed the high resolution micro-CTD profiles taken during a complete diurnal cycle at both study locations to quantify the stability and mixing levels of the water column to link them with the spatial variations in the biofouling communities. Focusing on a full tidal cycle should allow observation of the effects of tide on the shear and other water parameters.
The density structure (Figure 6E) computed from the measured temperature (Figure 6C) and salinity (Figure 6D) profiles showed a distinctive boundary (pycnocline) dividing the water column into two main layers. The pycnocline undulated between 6 and 15 m depths at both locations in sync with the tidal phase (known as internal tidal wave; Apel, 2002). The upper layer, defined as the layer above the pycnocline, was subjected to surface heating/cooling rates of up to −620 W/m2 during daytime and up to 610 W/m2 during night-time (Figure 6B), resulting in day-to-night water temperature differences of 0.6°C. This layer also responded to the momentum flux generated by wind stress that tripled the vertical shear intensity (Figure 7A) during wind stress values above 0.01 N/m2 (Figure 6A). The layer surrounding the pycnocline at both locations remained stable with Ric < Ri (Figure 7C) throughout the study period.
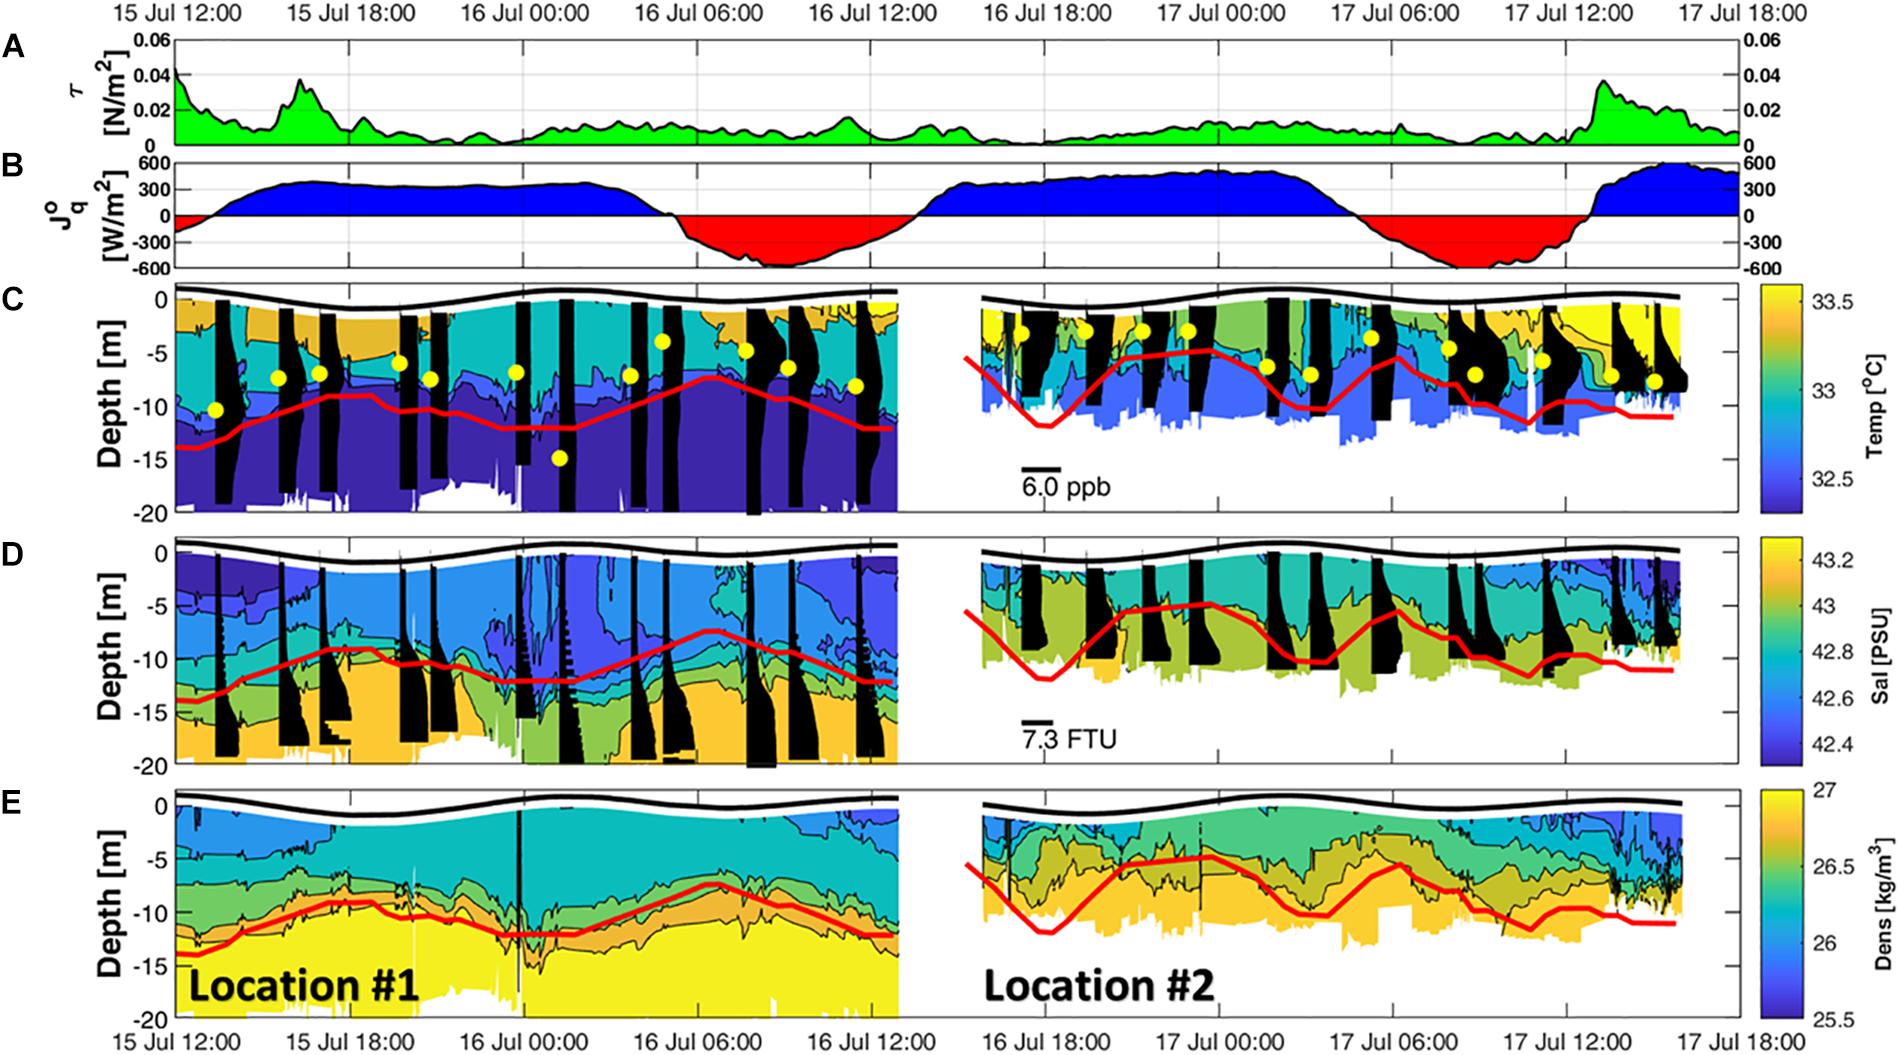
Figure 6. Surface meteorological forcing and micro-CTD measurements at locations #1 and #2. (A) Wind stress. (B) Net heat flux where negative values (red) indicates net heating and positive values (blue) indicate net cooling. (C) Thermal structure overlaid with vertical profiles of chlorophyll a concentrations in black bars. Maximum chlorophyll concentration depths are indicated by yellow dots. (D) Salinity structure plotted over turbidity concentrations in black bars. (E) Density structure. Solid red lines (C–E) indicate the pycnocline depth.
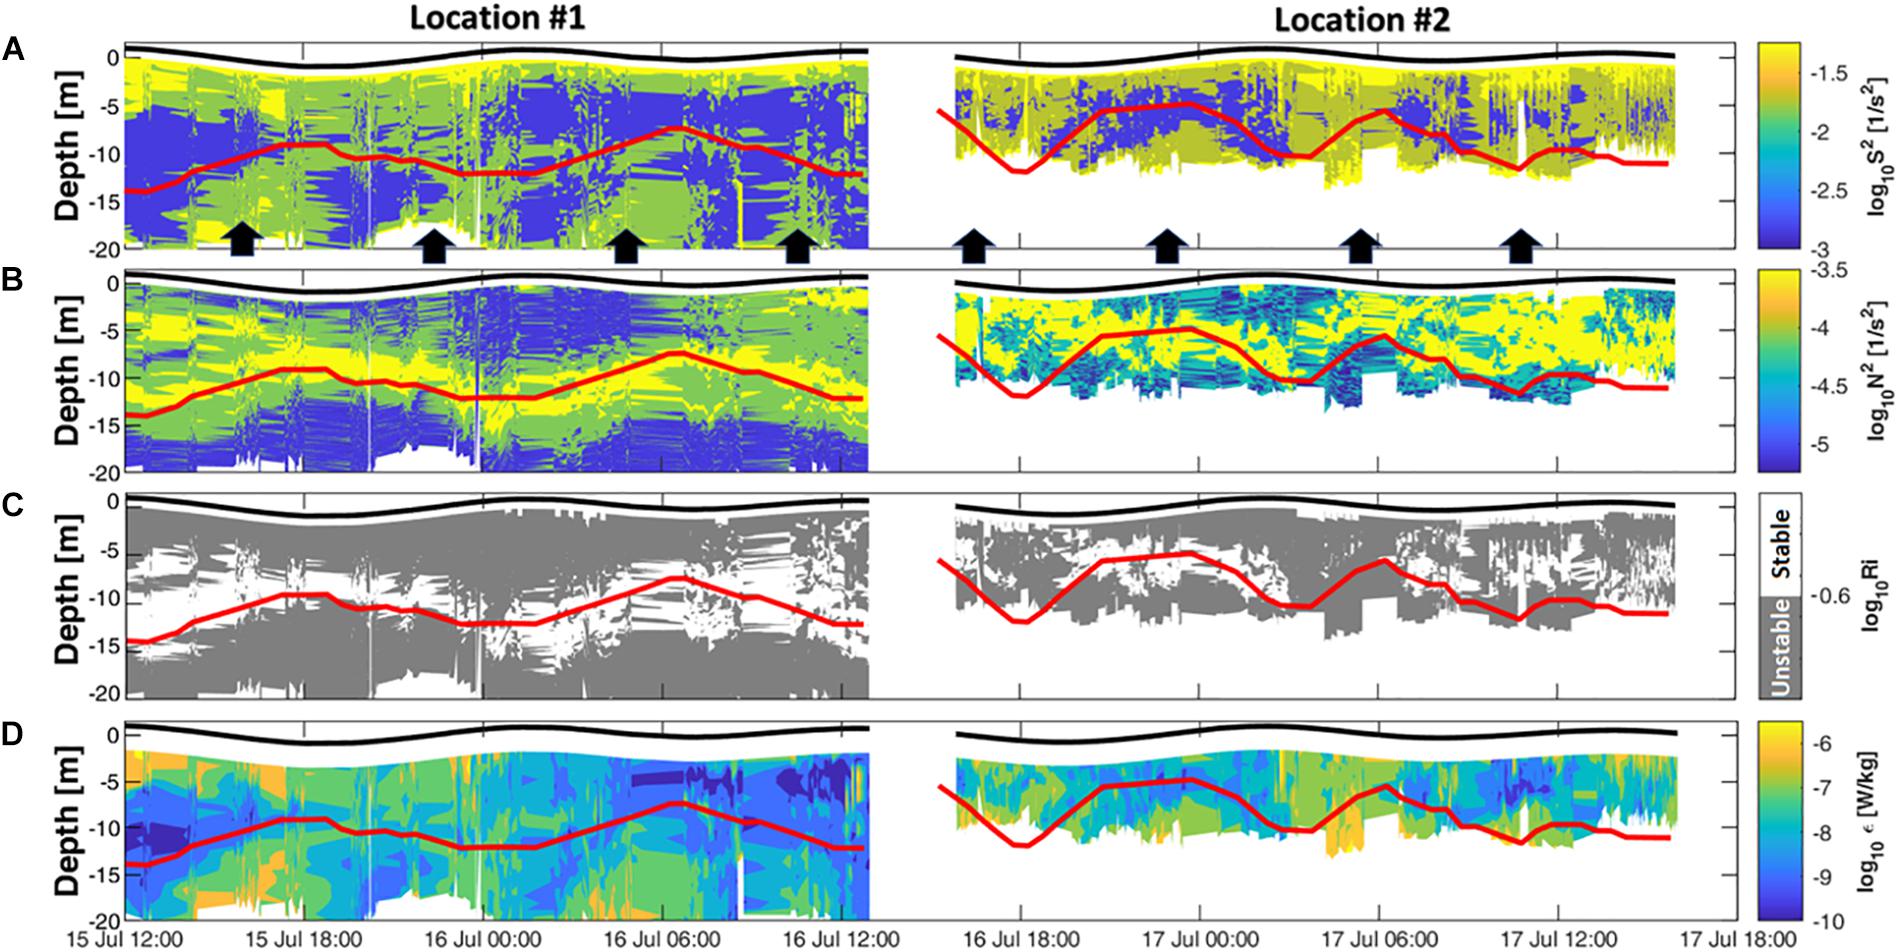
Figure 7. Micro-CTD measurements at locations #1 and #2. (A) Measured current shear overlaid with black arrows indicating periods of increased vertical shear in the lower layer. (B) Buoyancy frequency. (C) Ri number [gray indicates instability (Ric > Ri)]. (D) TKE dissipations. Solid red lines indicate the pycnocline depth.
In contrast, the lower layer, defined as the layer beneath the pycnocline, was away from the influence of surface forcing (net heat flux and wind stress) and responded closely to the tidal currents. Tidal currents during flooding and ebbing phases reached average speeds of 0.48 and 0.46 m/s, respectively, decreasing to ∼0 m/s during the tidal slack phase. These conditions resulted in consistent bursts of elevated vertical shear intensities (>0.01 1/s2) during the flooding and ebbing phases (Figure 7A, black arrows). The shear produced by the tides in the lower layer appears to be stronger compared to the shear produced by wind stress in the upper layer, except during the period of maximum wind stress on the afternoon of July 15, where near surface shear values increased to 0.05 1/s2. The lowest vertical shear levels were observed in the pycnocline region where stratification was the largest in the water column (Figure 7B).
To explore the spatial effects of internal tidal waves on DO concentrations, a commonly used water quality parameter, we examined the DO variability induced by the waves as they propagated across the study region. DO concentration ranged from 6.2 to 10.9 mg/l with the highest values recorded at locations #1 (∼10 m) and #2 (∼5 m) during the afternoon of July 17. The vertical oscillation of the pycnocline associated with the internal tide activity appears to be consistent with the observed fluctuations in DO levels at locations #1 and #2. During LW, the upward vertical velocity (Figure 5A) and the associated upward pycnocline movement brought up deeper water with lower DO concentrations, causing a decrease in DO levels to 6.8 mg/l at mid-depth. During HW, the downward vertical velocity (Figure 5A) and deepening of the pycnocline pushed DO rich surface water deeper, increasing DO levels at mid-depth to 8.3 mg/l. This change in DO levels, corresponding to internal tide activity, is similar to results obtained at Long Island Sound, United States by McCardell et al. (2016) where higher DO concentration were observed during deepening of the pycnocline that followed the tidal cycle.
Overall at both locations, the lower layer generated higher vertical shear (Figure 5E), with an average of 0.11 1/s2 (0.07, 0.33), compared to the upper layer with an average value of 0.04 1/s2 (0.03, 0.05). This difference in shear between the two layers, resulted in the turbulent kinetic energy (TKE) dissipation rates larger (∼10–5 W/kg) in the lower layer than in the upper layer (∼10–8 W/kg) (Figure 7D). The higher turbulent mixing levels due to the intensified shear in the lower layer has likely resuspended sediments off the seabed and resulted in turbid waters (>3.6 FTU) that extended up to the pycnocline (Figure 6D, black bars). The upper layer waters at both locations were clearer (<1.3 FTU) and had twice the concentrations of chlorophyll a compared to the lower layer (Table 2 and Figure 6C).
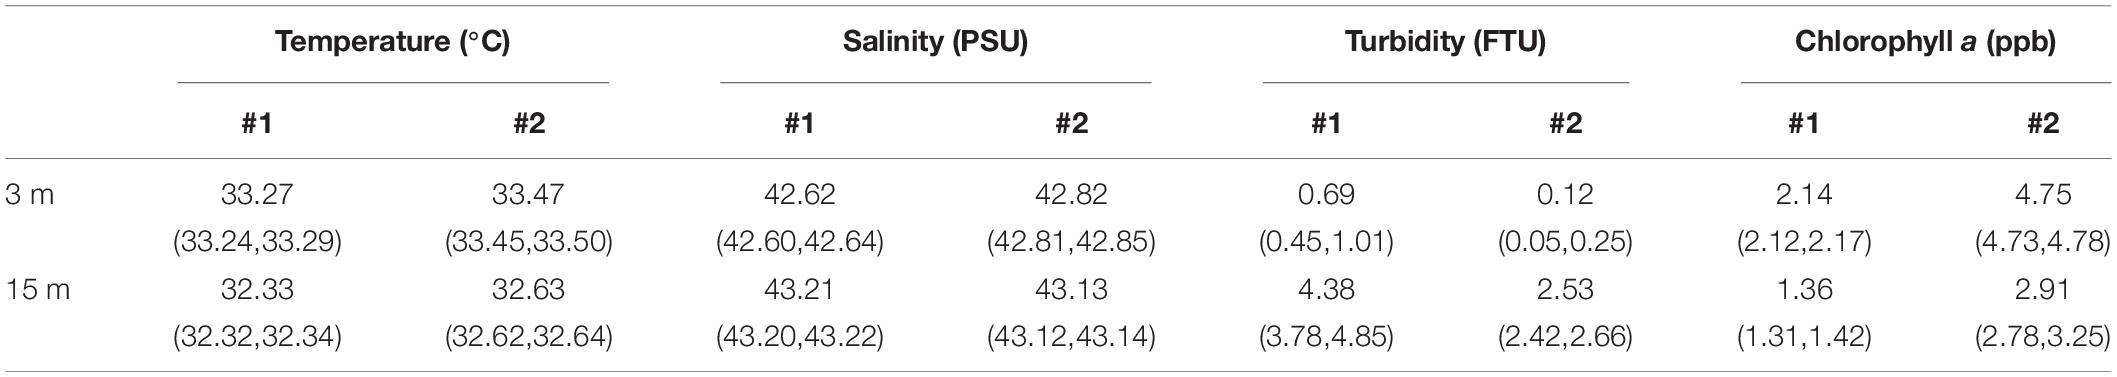
Table 2. Averaged seawater properties and 95% CI measured by the micro-CTD at both locations.
Bacterial Biofilms
Spatial Variations of Biofouling Communities
Visual observation of the acrylic panels deployed at the two different depths in #1 and #2 showed the development of mature biofouling communities. Barnacles were the most commonly encountered macrofouling organisms in all samples. The total biomass of the biofouling communities was significantly affected by both location and depth (Figure 8A, p < 0.007, ANOVA). The highest average biomass of 12.7 ± 5.7 g was recorded in the upper layer at 3 m depth, while the lowest average biomass value of <1 g was obtained from panels exposed in the lower layer at 15 m depth in #1. Location and depth also significantly influenced the total bacterial counts (Figure 8B, p < 0.001, ANOVA). Panels obtained from 3 and 15 m depths in #1 also showed the highest and lowest average bacterial counts, respectively (Figure 8B). Chlorophyll a concentrations within the biofouling communities were not significantly affected by location, but rather by depth (Figure 8C, p < 0.001, ANOVA). Panels from both locations exhibited higher concentrations at 3 m than at 15 m depth (Figure 8C).
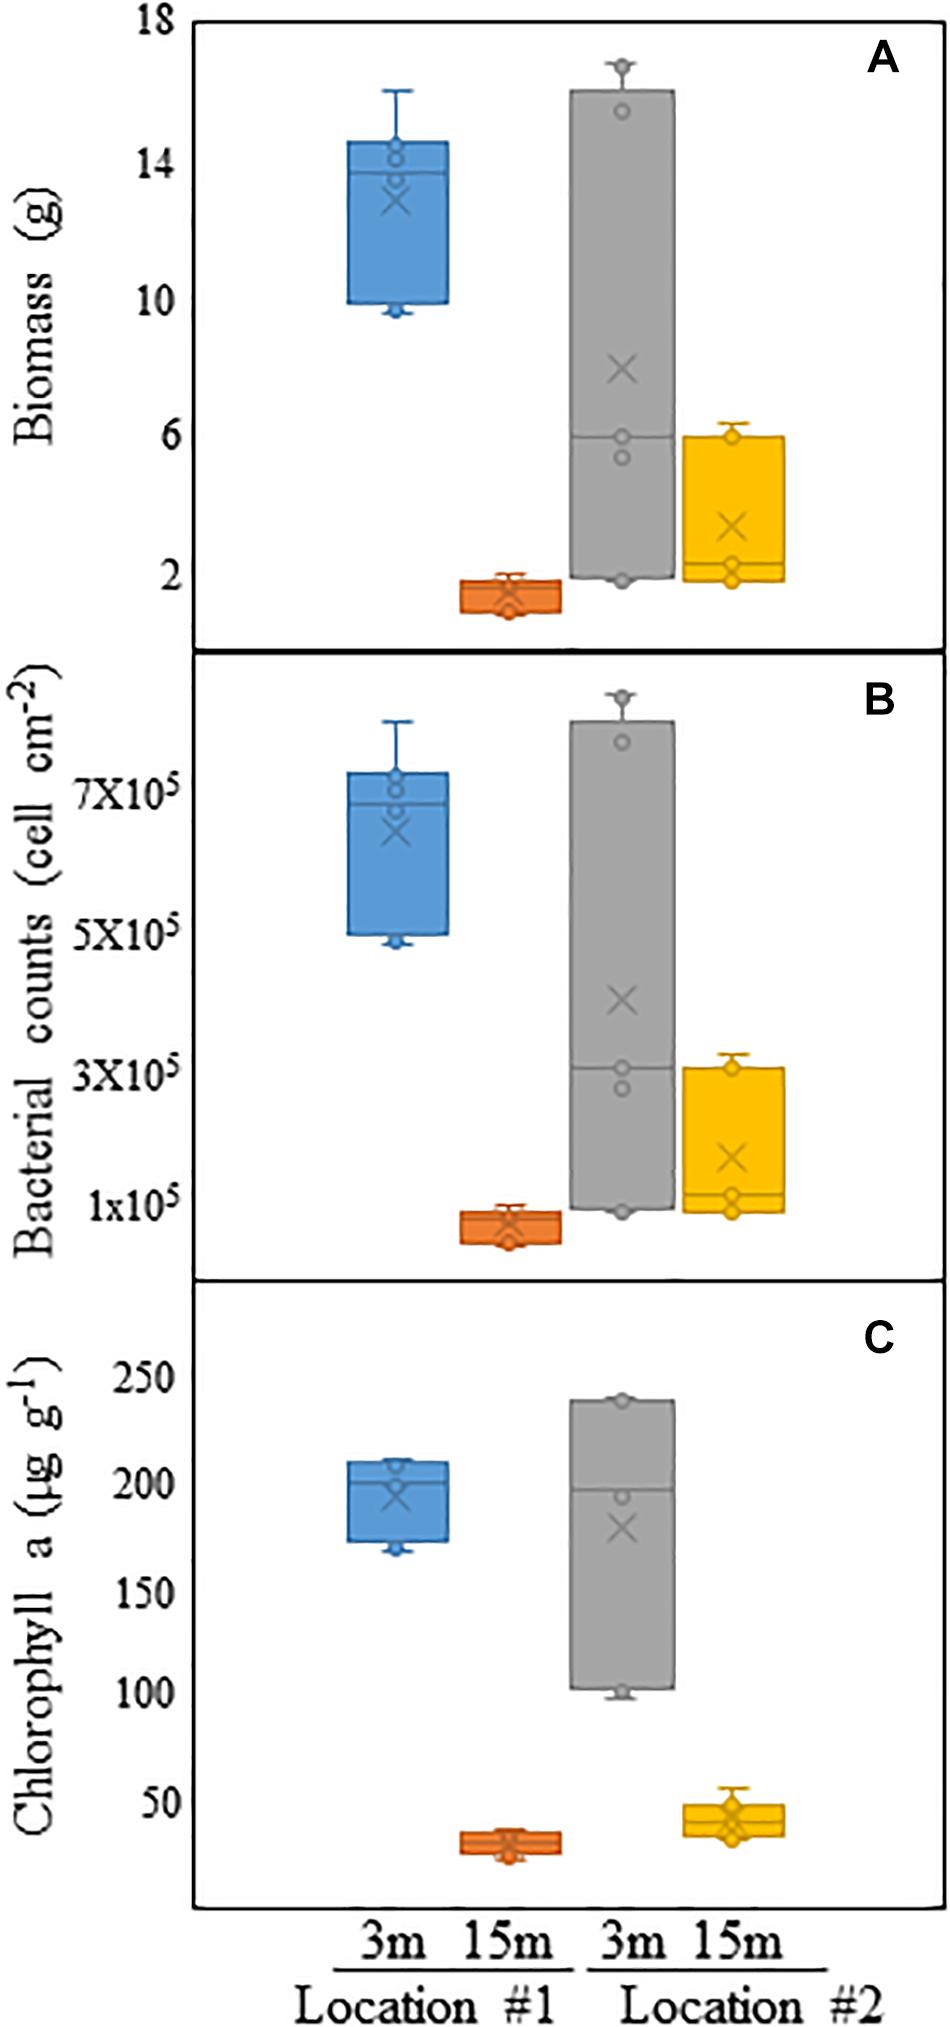
Figure 8. Comparison of (A) total biomass (in g), (B) bacterial counts (in cells cm–2) and (C) chlorophyll a concentration (in μg g–1) of biofouling communities developed on acrylic panels exposed at 3 and 15 m depth in Locations #1 and #2.
Diversity of Fouling Bacterial Communities
A total of 322,048 16S rRNA gene sequences were generated by Illumina MiSeq amplicon sequencing of the biofilm samples (Table 3). OTU richness and Chao 1 index reached 3861 ± 220 and 5706 ± 408 in #1 at 3 m depth, but these values were lower (i.e., 2887 ± 925 and 4166 ± 1332, respectively) in #2 at the same depth (Table 3). At 15 m, the OTU richness and Chao 1 index exhibited higher values in #2 than in #1 (Table 3). NMDS ordination based on location showed a partial overlap of fouling bacterial communities between the locations (ANOSIM R = 0.341, p = 0.011; Figure 9A). However, depth-based ordination revealed that the fouling bacterial communities developed at 3 m depth were significantly different from 15 m depth (ANOSIM R = 0.331, p = 0.007; Figure 9A). Comparison of the detected OTUs from all biofilm samples showed that the percentage of shared OTUs was ≤64% in all cases (Figure 9B). The highest percentage of shared OTUs (64%) was detected between 3 and 15 m depth samples in #1 (Figure 9B). A total of 21% of the detected OTUs were shared among all biofilm samples regardless of location or depth (Figure 9B).
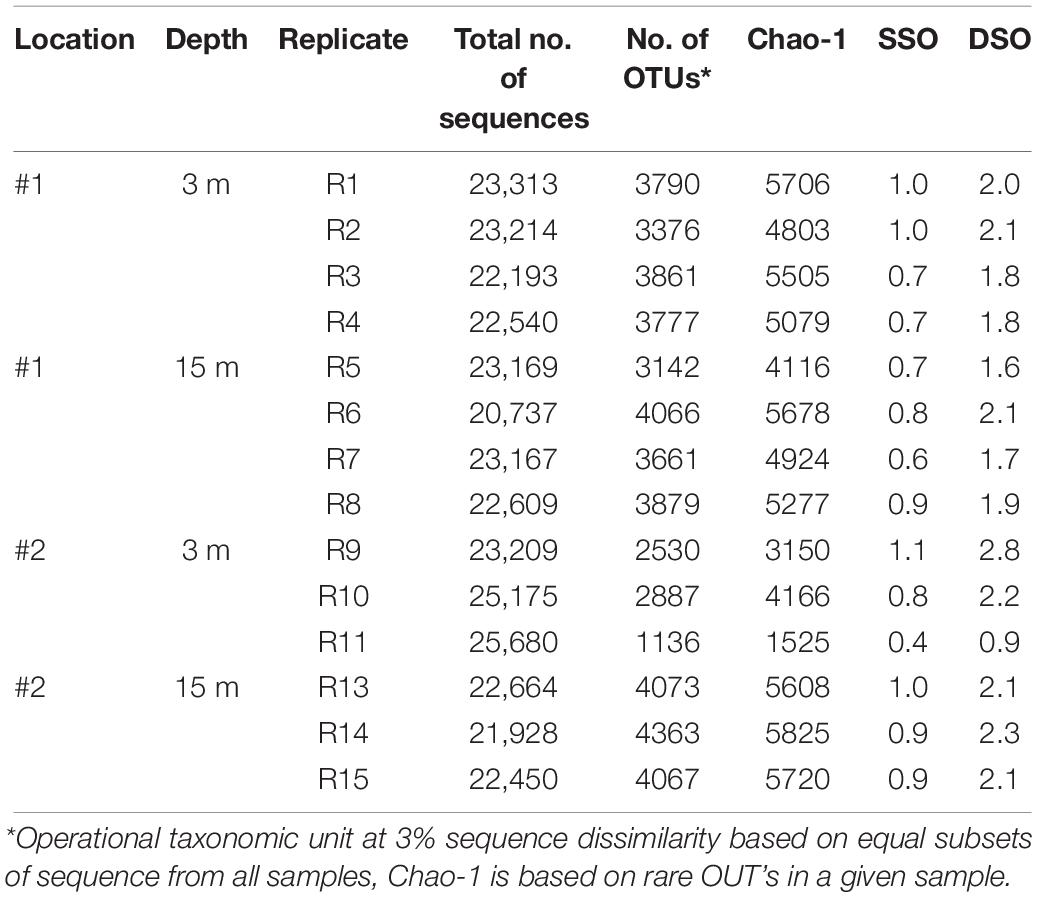
Table 3. MiSeq sequencing and diversity estimators of bacterial communities developed on acrylic panels deployed at two depths (3 and 15 m) at locations #1 and #2.
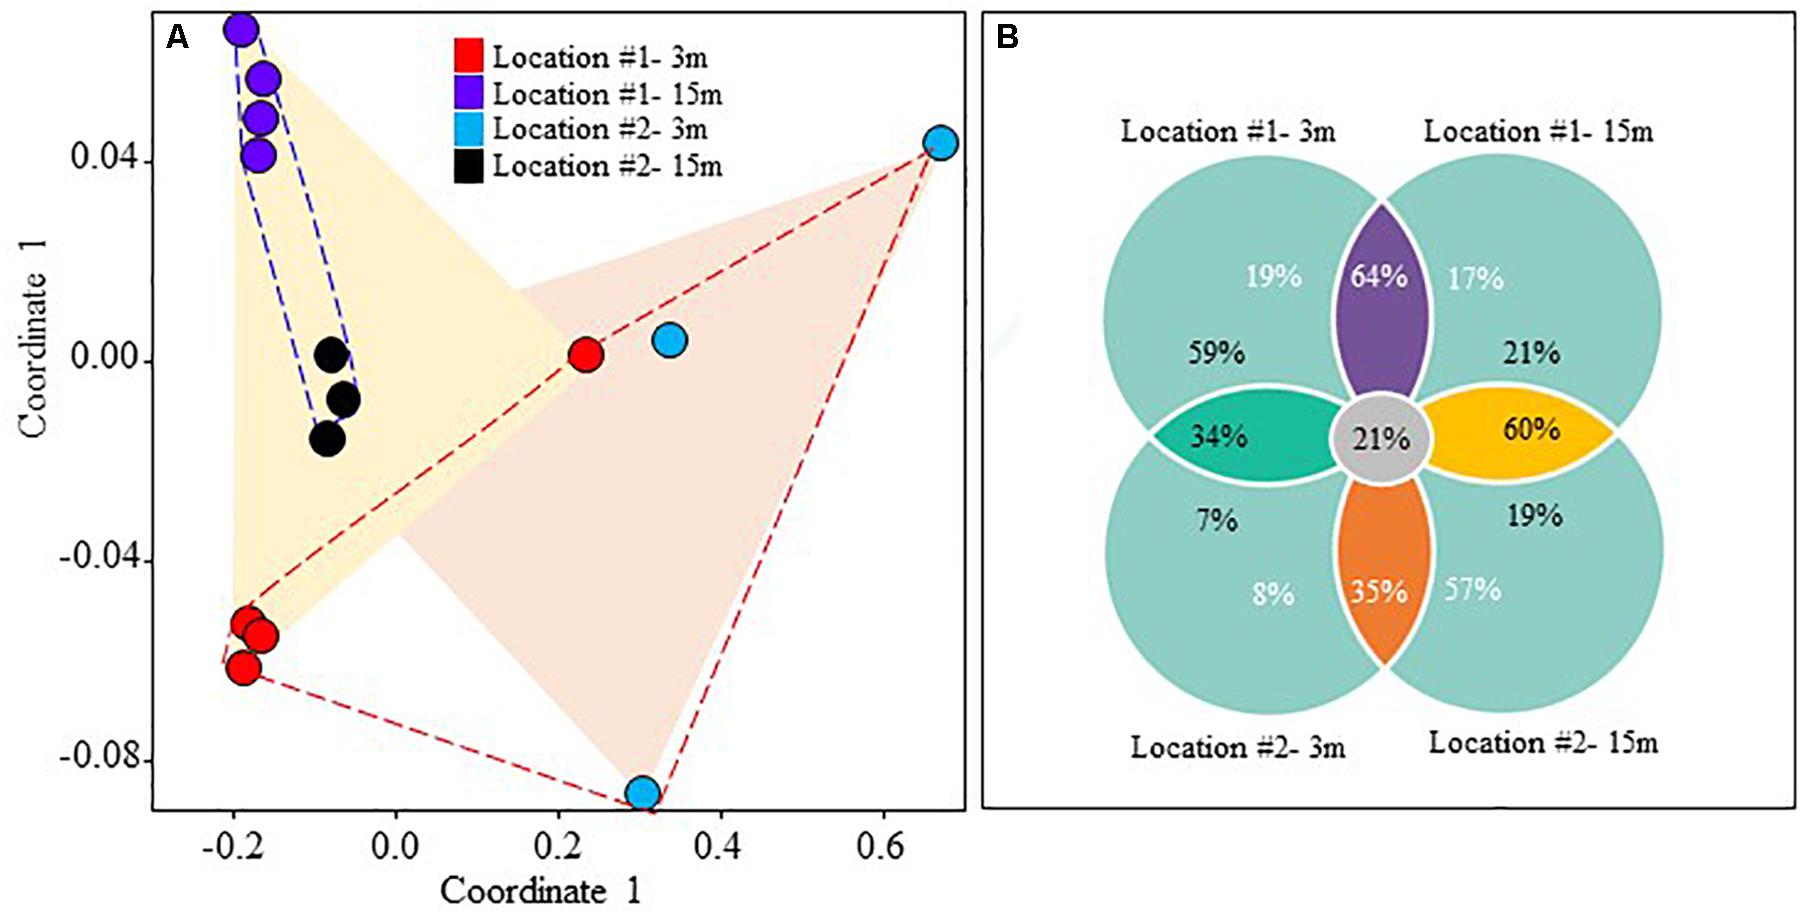
Figure 9. (A) Non-metric multidimensional scaling (NMDS) ordination plot of fouling bacterial communities based on location and depth, (B) percentage of shared OTUs between different locations and depths.
The MiSeq data analysis revealed clear differences in the bacterial fouling community structure depending on both location and depth. Alphaproteobacteria was the most dominant bacterial group constituting 22–49% of the total number of sequences in the whole dataset (Figure 10). In #1, Aestuariivita and Rhodobacteraceae-related genus were the most dominant alphaproteobacterial genera, each constituting an average of 3.4 ± 0.5 and 3.2 ± 0.7% of the total number of sequences at 3 and 15 m depth, respectively (Figure 10). In #2, Ruegeria and Rhodobacteraceae-related genus were the most dominant alphaproteobacterial genera, constituting an average of 8.5 ± 4.5 and 3.0 ± 0.5% of the total number of sequences at 3 and 15 m depth, respectively (Figure 10). However, certain alphaproteobacterial genera such as Ruegeria, Silicimonas, Pseudoceanicola, and Rhodovulum showed higher relative abundances at 3 m than at 15 m depth in both locations, in contrast to Thalassobius, which showed an opposite trend (Figure 10). Most of the dominant alphaproteobacterial genera detected in the current study belonged to the Rhodobacterales clade, which is known to be one of the key biofilm-forming species in coastal and offshore marine waters of temperate and polar regions of the world (Selje et al., 2004; Dang et al., 2008). However, not much has been reported on the detection or dominance of this bacterial clade in biofilms developed in offshore subtropical waters. Rhodobacterales constitute bacterial species possessing diverse physiological attributes including quorum-sensing, hydrocarbon degradation, production of secondary metabolites and gene transfer agents and carbon monoxide oxidation (Fu et al., 2013; Dang and Lovell, 2016). Although this marine bacterial clade is known to include tenacious surface colonizing species such as Ruegeria sp. and Aestuariivita sp., there is not much information available on the effect of depth on the relative abundances of these genera especially in offshore systems.
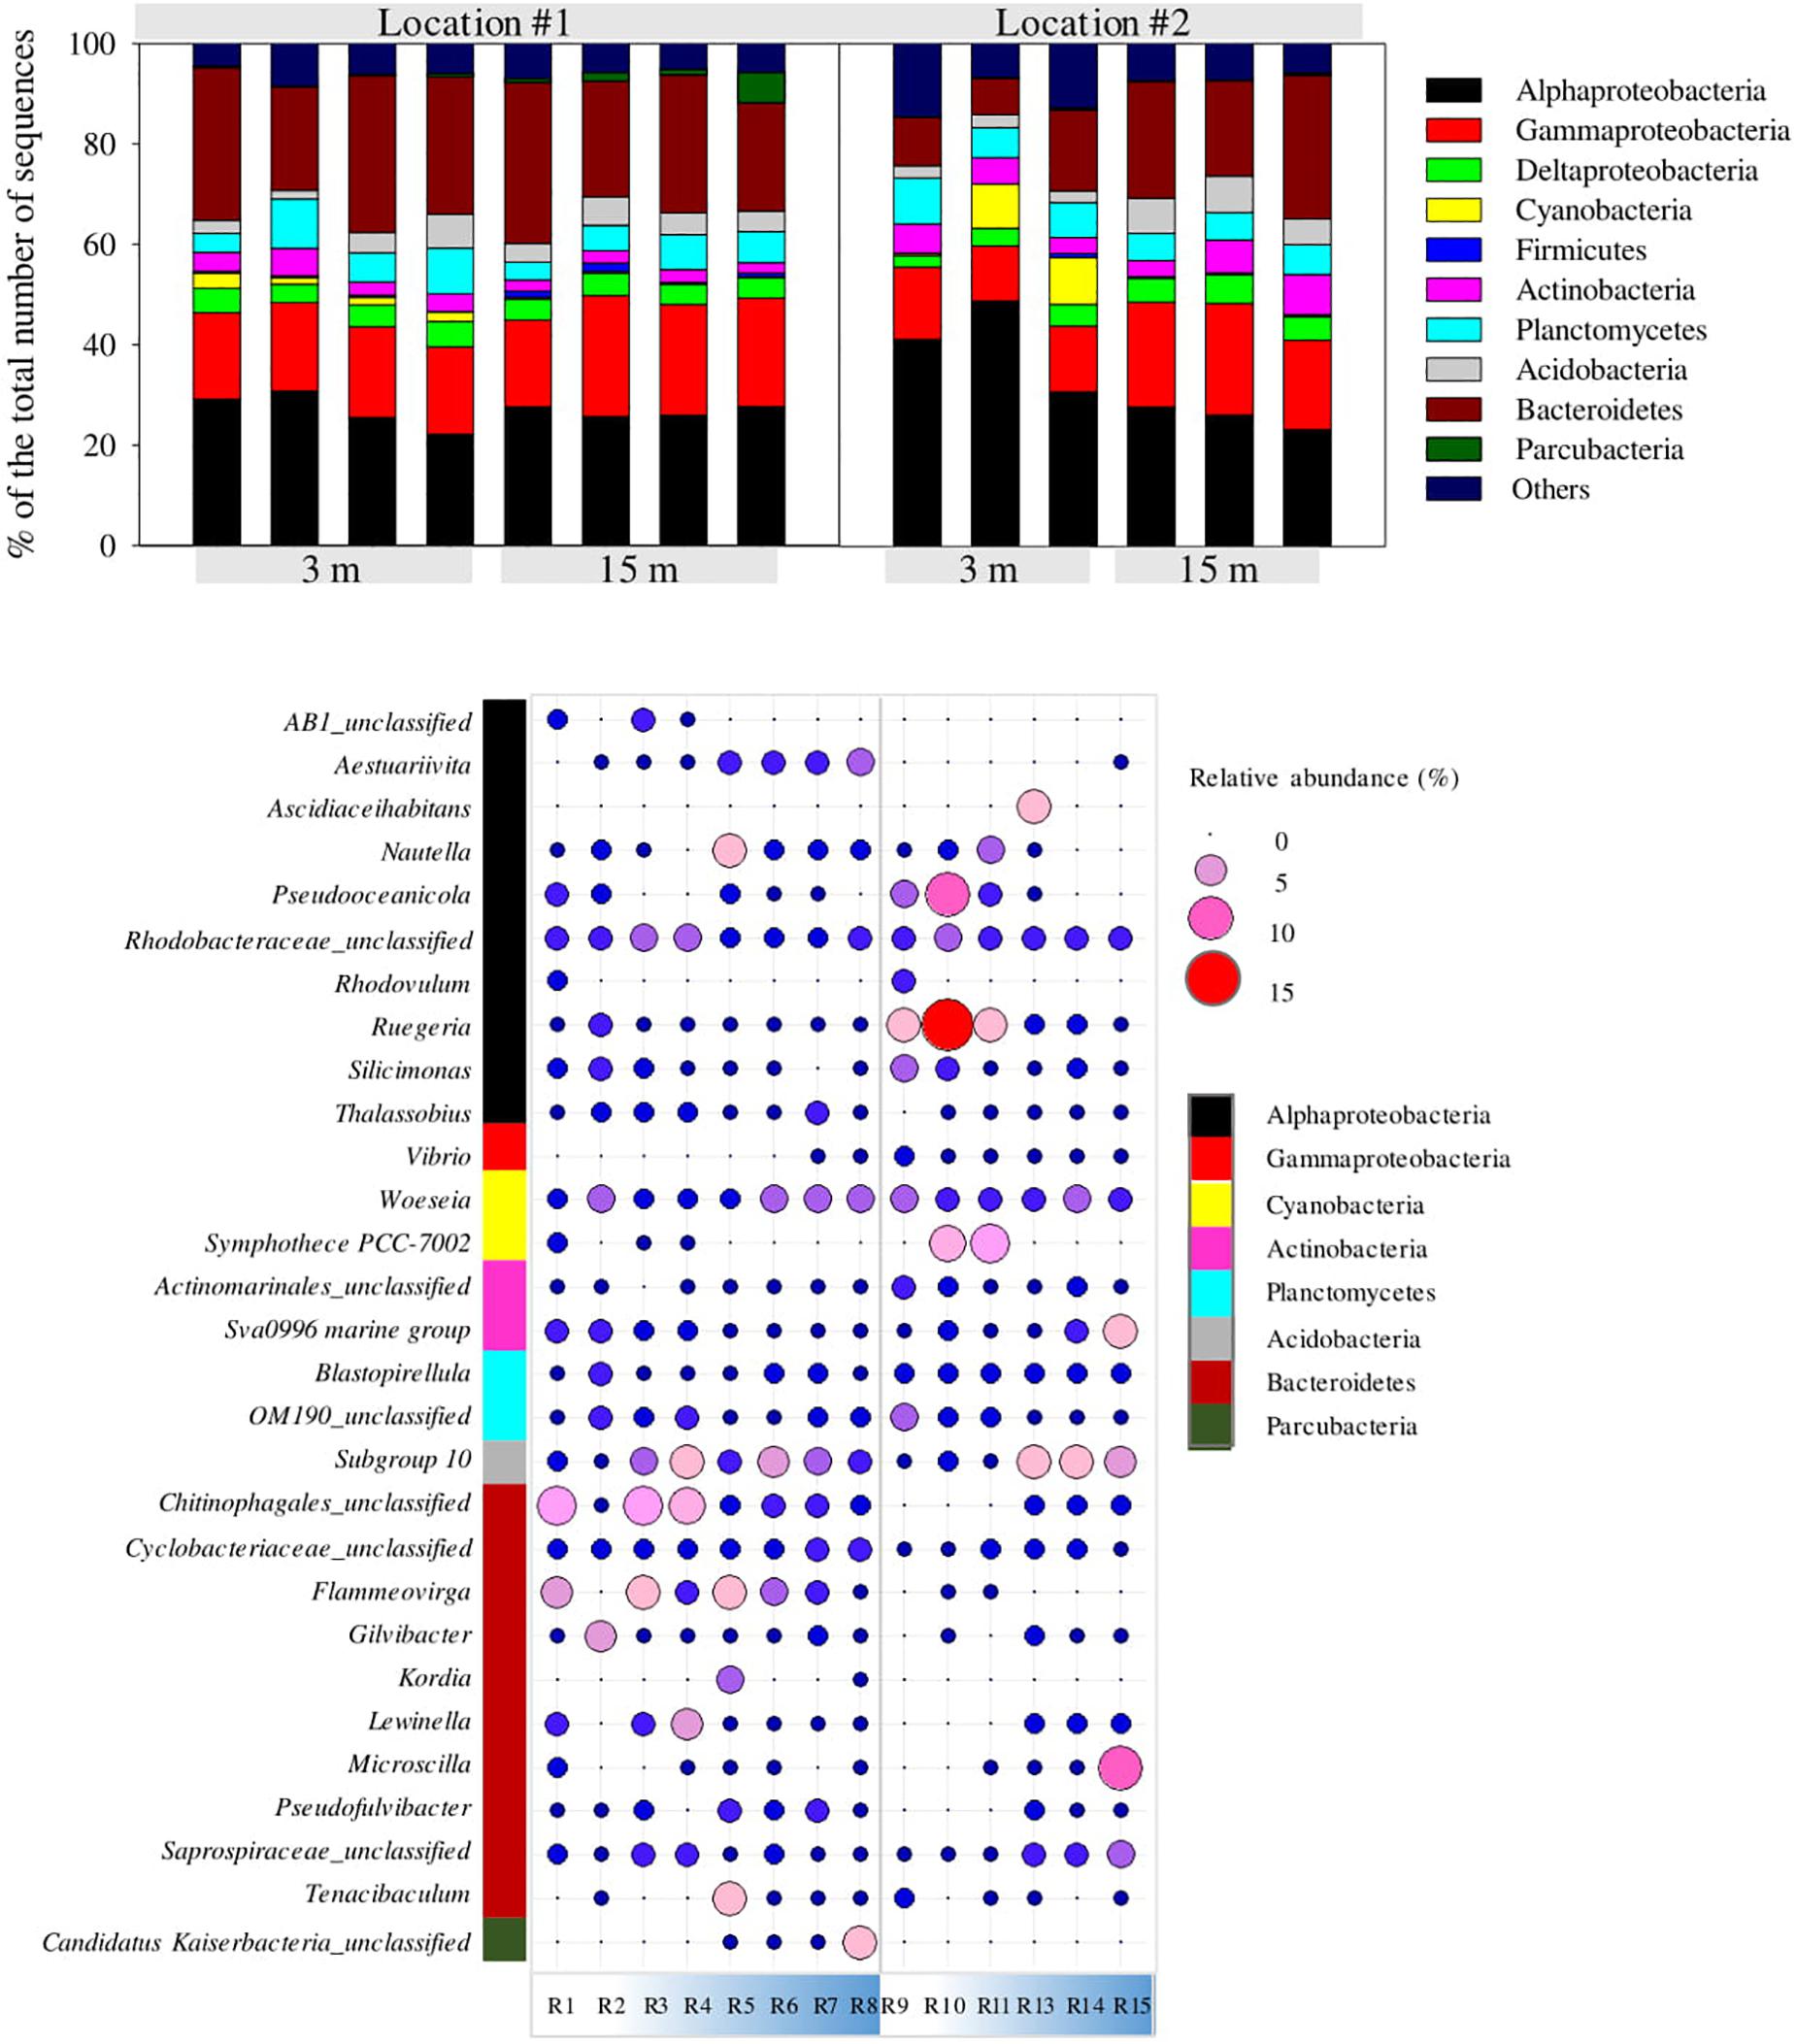
Figure 10. Changes in the relative abundances (% of total number of sequences) of the most dominant bacterial classes/phyla within the fouling bacterial communities developed on panels exposed at 3 and 15 m depths in both locations #1 and #2 (bar plot at top). Changes in the relative abundances of the most dominant bacterial genera within developed biofilms in locations #1 and #2 (bubble plot at bottom).
The bacterial groups Gammaproteobacteria and Bacteriodetes exhibited higher relative abundances in #1 than in #2, while Cyanobacteria showed an opposite trend (Figure 10). Most of the gammaproteobacterial sequences belonged to the genus Vibrio while the dominant Bacteroidetes-related sequences belonged to the genera Flammeovirga, Lewinella, Microscilla, Gilvibacter, and Tenacibaculum (Figure 10). Gammaproteobacteria and Bacteriodetes are among the pioneer biofilm-forming species in marine environments (Dang et al., 2011). For example, Vibrio spp. possess a two-component signal transduction system and are capable of producing exopolysaccharides (EPS) that facilitate not only bacterial attachment and biofilm formation but also antifouling activity (Jiang et al., 2011; Dang and Lovell, 2016). Similarly, bacterial species belonging to Bacteriodetes phylum are also highly adapted to surface-associated lifestyle and are quite abundant in organic-rich coastal waters. Some Bacteroidetes-related species are also known to secrete EPS-degrading enzymes and metabolites that can enable them to serve as predators on surface-associated bacteria and diatoms eventually leading to biofilm disruption (Dang and Lovell, 2016).
Moreover, depth-based shifts were detected in the relative abundances of certain bacterial genera belonging to the Bacteroidetes phylum depending on the location (Figure 10). For instance, the genera Lewinella, Microscilla, and Gilvibacter clearly showed a higher relative abundance at 3 m depth than at 15 m depth in #1 but vice-versa in #2 (Figure 10). On the other hand, the relative abundance of Cyanobacteria showed a clear reduction with increasing depth in both locations, mainly detectable in the genus Sympothece PCC-7002 (Figure 10). The remaining bacterial groups, namely Betaproteobacteria, Actinobacteria, Planctomycetia, Acidobacteria, Firmicutes, and Parcubacteria constituted each <6% of the total number of sequences.
Bacterial Biofilms and the Environment
Analysis of the current structure clearly showed the role of the semidiurnal (M2 and S2) and diurnal (K1 and O1) tide constituents. These tides elevated vertical velocity shear levels in the lower compared to the upper layer, likely the result of the interaction of the currents with the seabed (Salon et al., 2008). This produced twice the vertical velocity shear and turbulent mixing levels in the lower compared to the upper waters. The role of shear instabilities in inducing turbulence mixing are crucial as they altered the environmental conditions and could be reflected on the nature of biofouling bacterial communities on the deployed acrylic panels. Despite that the number of sites in the study is too low for statistical analysis, the results showed that the biofouling bacterial communities underwent quantitative and qualitative shifts depending on the depth of exposure and distance from the coastline. The significant decrease in the total biomass, bacterial counts and phototrophic biomass (as indicated by chlorophyll a concentrations) with increasing depth in both locations can be attributed to changes in the physical-chemical (mixing intensity, salinity, temperature, and turbidity) characteristics of the water column. This appears to be consistent with previous reports where physical-chemical characteristics were shown to induce a vertical zonation in the bacterial community structure (Treusch et al., 2009; Bellou et al., 2012; Aldunate et al., 2018). The influence of dynamic changes of parameters during the time on biofilm formation cannot be easily deduced from the endpoint measurements yet; the obtained data are essential in providing a more general view about the relation between biofilm bacterial and environmental parameters in the subtropical marine environment.
The NMDS analysis revealed that the composition of fouling bacterial communities was significantly affected by the depth of exposure. For example, the higher relative abundance of the bacterial group Bacteroidetes at 15 m than 3 m depth at #2 might be explained by the fact that the deeper panels were near the sediment at this location. Bacterial groups belonging to Bacteroidetes have been commonly encountered in coastal and offshore sediments (Fernández-Gomez et al., 2013; Gribben et al., 2017). Physical disturbances to the sediment due to vertical velocity shear led to instability and higher mixing levels that resulted in resuspension of sediment (as indicated by elevated turbidity levels) and microorganisms in the water column above the seabed. This explains the detection of these bacterial groups within the biofilms developed near the sediments in #2. However, an opposite trend in the relative abundances of the same Bacteroidetes groups in #1 can be attributed to the versatile ability of these bacterial groups to shift to waters with high concentrations of DO levels (Treusch et al., 2009; Bellou et al., 2012; Aldunate et al., 2018). Panels deployed at 15 m depth in #1 were farther from the sediment than those at the same depth in #2, due to the natural seabed slope. A larger vertical distance of the surface waters from the sediment may eventually result in the establishment of more DO deprived water in the lower layer, near the sediment, compared to the richer in DO near surface layer (Aldunate et al., 2018). This is further supported by the stronger stratification (>10–4 1/s2) observed at #1 at the pycnocline depth compared to the stratification levels observed at #2, which created a natural barrier preventing mixing of DO from the upper layer into the lower layer. Bacterial species belonging to Bacteroidetes are known to proliferate in waters with high concentrations of DO (≥70 μM) rather than in low DO waters, hence increasing their availability in subsurface waters within locations showing a larger depth gradient (Aldunate et al., 2018). This explains the higher relative abundance of these groups at 3 m than at 15 m depth in #1. Moreover, the relatively low abundances of Cyanobacteria at 15 m depth in both locations can also be attributed to the low DO and reduced light availability at these depths due to the high turbidity generated by the vertical velocity shear in the lower layers. In addition, the relatively higher abundance of Cyanobacteria at #2 compared to at #1 can also be explained by the variations in DO between both locations. The higher vertical shear at #2 produced mixing intensities that were ten folds those estimated at #1, despite the current being 15% slower. This in turn weakened stratification (<10–4 1/s2) observed at #2 and contributed to the increase in DO availability by higher mixing levels. In addition, the combination of higher chlorophyll a and cooler water (by ∼0.25°C) at #2 have also contributed to richer DO with an average concentration of 8.14 (8.12, 8.16) mg/l compared to 7.61 (7.59, 7.62) mg/l at #1. Although not much is known regarding the changes in cyanobacterial abundance within biofilms developed at different locations and depths of the sea (Bellou et al., 2012), the higher abundance of free-living Cyanobacteria in subsurface waters than in deeper waters has been demonstrated in previous studies (Treusch et al., 2009; Techtmann et al., 2015).
Conclusion
Our results shed light as well as serve to encourage future observational studies of bacterial communities in subtropical environmental conditions and regions. To the best of our knowledge, information pertaining to variability in the abundance and composition of bacterial communities on subtropical offshore platforms are rare. Despite the limitation in the number of the sites investigated and the inability to assess the influence of dynamic changes of environmental parameters during time on biofilm formation from the endpoint measurements, the current study presents key results of the effects of environmental changes in response to internal tides on the development and diversity of bacterial biofilms in the northern AG, off the coast of Kuwait. In summary, during the 13 days study period the results displayed a decrease in the total biomass, bacterial counts, phototrophic biomass as well as the variation in the bacterial community structure of biofilms with increasing depth at both offshore locations. These observations can be attributed to changes in the physical-chemical characteristics of the water column. The latter was naturally divided into two layers separated by a pycnocline that undulated between 6 and 15 m depths in response to the internal tides. The layer beneath the pycnocline was subjected to significant shear of the horizontal currents and turbulent mixing, which resulted in an increase in water turbidity, lower DO and lower chlorophyll a concentration compared to the upper layer. The observed physical-chemical differences between both layers contributed to the biofilm structure and further analysis revealed that biofouling bacterial communities shared OTUs ≤64% between both locations and both layers. Since microbial biofilms can influence the recruitment of macrofouling organisms, it is crucial that future research focuses on investigating biofilm development on offshore surfaces to allow the design of effective biofouling management strategies on offshore platforms serving windfarms, aquaculture systems, and the oil industry.
Data Availability Statement
The raw data supporting the conclusions of this article will be made available by the authors, without undue reservation, to any qualified researcher. The 16S datasets generated for this study can be found in the European Nucleotide Archive (ENA) https://www.ebi.ac.uk/ena/data/view/PRJEB36024.
Author Contributions
All authors listed have equally contributed in data collection, data analysis, and manuscript preparation, and approved the final manuscript for publication.
Funding
The microbiology part of the study was funded by the Gulf Cooperation Council (GCC) collaborative work between Kuwait University, Kuwait (grant #2017003) and Sultan Qaboos University, Oman (grant #SQU-GCC/CL/17/02). The environmental part was funded by the Kuwait Foundation for the Advancement of Sciences (grant #P21644SE01).
Conflict of Interest
The authors declare that the research was conducted in the absence of any commercial or financial relationships that could be construed as a potential conflict of interest.
Footnotes
- ^ www.mrdnalab.com
- ^ https://github.com/sestaton/Pairfq, date accessed December 23, 2019.
References
Abdelsalam, K. M., and Wahab, M. M. (2012). Effects of depth and orientation on marine fouling assemblages in the coastal waters of Abu Qir Harbor, Egypt. J King Abdulaziz Univ. 23:3. doi: 10.4197/mar.23-2.1
Al Senafi, F., and Anis, A. (2015). Shamals and climate variability in the Northern Arabian/Persian Gulf from 1973 to 2012. Int. J. Climatol. 35, 4509–4528. doi: 10.1002/joc.4302
Al Senafi, F., and Anis, A. (2020). Internal waves on the continental shelf of the Northwester Arabian Gulf. Front. Mar. Sci. 6:805. doi: 10.3389/fmars.2019.00805
Aldunate, M., De la Iglesia, R., Bertagnolli, A. D., and Ulloa, O. (2018). Oxygen modulates bacterial community composition in the coastal upwelling waters off central Chile. Deep Sea Res. II Top. Stud. Oceanogr. 156, 68–79. doi: 10.1016/j.dsr2.2018.02.001
Apel, J. R. (2002). Oceanic Internal Waves and Solitons, An Atlas of Oceanic Internal Solitary Waves, 189–206. Arlington, VA: Global Ocean Associates.
Bellou, N., Papathanassiou, E., Dobretsov, S., Lykousis, V., and Colijn, F. (2012). The effect of substratum type, orientation and depth on the development of bacterial deep-sea biofilm communities grown on artificial substrata deployed in the Eastern Mediterranean. Biofouling 28, 199–213. doi: 10.1080/08927014.2012.662675
Beukhof, E. D., Coolen, J. W., van der Weide, B. E., Cuperus, J., de Blauwe, H., and Lust, J. (2016). Records of five bryozoan species from offshore gas platforms rare for the Dutch North Sea. Mar. Biodivers. Rec. 9:91.
Bluteau, C. E., Jones, N. L., and Ivey, G. N. (2016). Estimating turbulent dissipation from microstructure shear measurements using maximum likelihood spectral fitting over the inertial and viscous subranges. J. Atmos. Ocean. Technol. 33, 713–722. doi: 10.1175/jtech-d-15-0218.1
Chao, S., Kao, T., and Al-Hajri, K. (1992). A numerical investigation of circulation in the Arabian Gulf. J. Geophys. Res. 97, 219–236.
Cordesman, A. (2007). Iran, Oil, and the Strait of Hormuz, Center for Strategic and International Studies. Washington, DC: CSIS.
Dang, H., Chen, R., Wang, L., Shao, S., Dai, L., Ye, Y., et al. (2011). Molecular characterization of putative biocorroding microbiota with a novel niche detection of Epsilon-and Zetaproteobacteria in Pacific Ocean coastal seawaters. Environ. Microbiol. 13, 3059–3074. doi: 10.1111/j.1462-2920.2011.02583.x
Dang, H., Li, T., Chen, M., and Huang, G. (2008). Cross-ocean distribution of Rhodobacterales bacteria as primary surface colonizers in temperate coastal marine waters. Appl. Environ. Microbiol. 74, 52–60. doi: 10.1128/aem.01400-07
Dang, H., and Lovell, C. R. (2016). Microbial surface colonization and biofilm development in marine environments. Microbiol. Mol. Biol. Rev. 1, 91–138. doi: 10.1128/mmbr.00037-15
Dobretsov, S., and Thomason, J. C. (2011). The development of marine biofilms on two commercial non-biocidal coatings: a comparison between silicone and fluoropolymer technologies. Biofouling 27, 869–880. doi: 10.1080/08927014.2011.607233
Fairall, C., Bradley, E., Hare, J., Grachev, A., and Edson, J. (2003). Bulk parameterization of air-sea fluxes: updates and verification for the COARE algorithm. J. Climate 16, 571–591. doi: 10.1175/1520-0442(2003)016<0571:bpoasf>2.0.co;2
Fernández-Gomez, B., Richter, M., Schüler, M., Pinhassi, J., Acinas, S. G., González, J. M., et al. (2013). Ecology of marine Bacteroidetes: a comparative genomics approach. ISME J. 7:1026. doi: 10.1038/ismej.2012.169
Fu, Y., Keats, K. F., Rivkin, R. B., and Lang, A. S. (2013). Water mass and depth determine the distribution and diversity of Rhodobacterales in an Arctic marine system. FEMS Microbiol. Ecol. 84, 564–576. doi: 10.1111/1574-6941.12085
Galperin, B., Sukoriansky, S., and Anderson, P. S. (2007). On the critical Richardson number in stably stratified turbulence. Atmos. Sci. Lett. 8, 65–69. doi: 10.1007/s10661-017-5797-6
Ghobashy, A. F., and El Komy, M. M. (1980). Fouling in the southern region of the Suez Canal. Aquat. Ecol. 14, 179–185. doi: 10.1007/bf02260119
Gribben, P. E., Nielsen, S., Seymour, J. R., Bradley, D. J., West, M. N., and Thomas, T. (2017). Microbial communities in marine sediments modify success of an invasive macrophyte. Sci. Rep. 7:9845. doi: 10.1038/s41598-017-10231-2
Head, R., Davenport, J., and Thomason, J. (2004). The effect of depth on the accrual of marine biofilms on glass substrata deployed in the Clyde Sea, Scotland. Biofouling 1, 177–180. doi: 10.1080/08927010400008571
Jiang, P., Li, J., Han, F., Duan, G., Lu, X., Gu, Y., et al. (2011). Antibiofilm activity of an exopolysaccharide from marine bacterium Vibrio sp. QY101. PLoS One 6:e18514. doi: 10.1371/journal.pone.0018514
Klindworth, A., Pruesse, E., Schweer, T., Peplies, J., Quast, C., Horn, M., et al. (2013). Evaluation of general 16S ribosomal RNA gene PCR primers for classical and next-generation sequencing-based diversity studies. Nucleic Acids Res. 41:e1. doi: 10.1093/nar/gks808
Lorenzen, C. J. (1967). Determination of chlorophyll and pheo-pigments: spectrophotometric equations. Limnol. Oceanogr. 12, 343–346. doi: 10.4319/lo.1967.12.2.0343
McCardell, G., O’Donnell, J., Souza, A., and Palmer, M. (2016). Internal tides and tidal cycles of vertical mixing in western Long Island Sound. J. Geophys. Res. Oceans 121, 1063–1084. doi: 10.1002/2015jc010796
Mohammad, M. B. M. (1976). Relationship between biofouling and growth of the pearl oyster, Pinctada fucafu (Gould) in Kuwait, Arabian Gulf. Hydrobiologica 51, 129–138. doi: 10.1007/bf00009828
Ramette, A., and Tiedje, J. M. (2007). Multiscale responses of microbial life to spatial distance and environmental heterogeneity in a patchy ecosystem. Proc. Natl. Acad. Sci. U.S.A. 104, 2761–2766. doi: 10.1073/pnas.0610671104
Reynolds, R. (1993). Physical oceanography of the Gulf, Strait of Hormuz, and the Gulf of Oman (Results from the Mt. Mitchell expedition). Mar. Pollut. Bull. 27, 35–59. doi: 10.1016/0025-326x(93)90007-7
Rezai, H., Wilson, S., Claerebolidt, M., and Rieg, B. (2004). Coral Reef Status in the ROPME Sea Area: Arabian/Persian Gulf, Gulf of Oman and Arabian Sea, in Status the Coral Reefs World. Fort Lauderdale: Nova Southeastern University.
Richards, C., Bourgault, D., Galbraith, P. S., Hay, A., and Kelley, D. E. (2013). Measurements of shoaling internal waves and turbulence in an estuary. J. Geophys. Res. Oceans 118, 273–286. doi: 10.1029/2012jc008154
Salon, S., Crise, A., and Loon, T. (2008). Dynamics of the bottom boundary layer. Dev. Sedimentol. 60, 83–97. doi: 10.1016/s0070-4571(08)10006-1
Sandholm, T., and Wirtanen, G. (1992). Biofilm formation in the industry: a review. Food Rev. Int. 8, 573–603. doi: 10.1080/87559129209540953
Sathe, P., Richter, J., Myint, M., Dobretsov, S., and Dutta, J. (2016). Self-decontaminating photocatalytic zinc oxide nanorod coatings for prevention of marine microfouling: a mesocosm study. Biofouling 32, 383–395. doi: 10.1080/08927014.2016.1146256
Selje, N., Simon, M., and Brinkhoff, T. (2004). A newly discovered Roseobacter cluster in temperate and polar oceans. Nature 427, 445–448. doi: 10.1038/nature02272
Stachowitsch, M., Kikinger, R., Herler, J., Zolda, P., and Geutebrück, E. (2002). Offshore oil platforms and fouling communities in the Southern Arabian Gulf (Abu Dhabi). Mar. Pollut. Bull. 44, 853–860. doi: 10.1016/s0025-326x(02)00085-1
Sultan, S. A. R., and Elghribi, N. M. (1996). Temperature inversion in the Arabian Gulf and the Gulf of Oman. Cont. Shelf Res. 16, 1521–1544. doi: 10.1016/0278-4343(95)00086-0
Swift, S. A., and Bower, A. S. (2003). Formation and circulation of dense water in the Persian/Arabian Gulf. J. Geophys. Res. 108:3004.
Techtmann, S. M., Fortney, J. L., Ayers, K. A., Joyner, D. C., Linley, T. D., Pfiffner, S. M., et al. (2015). The unique chemistry of eastern Mediterranean water masses selects for distinct microbial communities by depth. PLoS One 10:e0120605. doi: 10.1371/journal.pone.0120605
Thoppil, P., and Hogan, P. (2010). Persian Gulf response to a wintertime shamal wind event. Deep Sea Res. I Oceanogr. Res. Pap. 57, 946–955. doi: 10.1016/j.dsr.2010.03.002
Treusch, A. H., Vergin, K. L., Finlay, L. A., Donatz, M. G., Burton, R. M., Carlson, C. A., et al. (2009). Seasonality and vertical structure of microbial communities in an ocean gyre. ISME J. 3, 1148–1163. doi: 10.1038/ismej.2009.60
U. S. Energy Information Administration (2016). World Oil Transit Choke Points. Washington, D.C: U. S. Energy Information Administration.
Van der Stap, T., Coolen, J. W., and Lindeboom, H. J. (2016). Marine fouling assemblages on offshore gas platforms in the southern North Sea: effects of depth and distance from shore on biodiversity. PLoS One 11:e0146324. doi: 10.1371/journal.pone.0146324
Keywords: Arab (Persian) Gulf, bacterial biofilm, internal tides/waves, Kuwait, biofouling bacteria
Citation: Al Senafi F, Abed RMM, Muthukrishnan T, Anis A, Al Rawahi AN and Mahmoud H (2020) Development and Diversity of Bacterial Biofilms in Response to Internal Tides, a Case Study off the Coast of Kuwait. Front. Mar. Sci. 7:21. doi: 10.3389/fmars.2020.00021
Received: 29 October 2019; Accepted: 13 January 2020;
Published: 31 January 2020.
Edited by:
Hongyue Dang, Xiamen University, ChinaReviewed by:
Jürgen Tomasch, Helmholtz Association of German Research Centres (HZ), GermanyBernd Wemheuer, University of New South Wales, Australia
Copyright © 2020 Al Senafi, Abed, Muthukrishnan, Anis, Al Rawahi and Mahmoud. This is an open-access article distributed under the terms of the Creative Commons Attribution License (CC BY). The use, distribution or reproduction in other forums is permitted, provided the original author(s) and the copyright owner(s) are credited and that the original publication in this journal is cited, in accordance with accepted academic practice. No use, distribution or reproduction is permitted which does not comply with these terms.
*Correspondence: Fahad Al Senafi, ZmFoYWQuYWxzZW5hZmlAa3UuZWR1Lmt3