- Department of Biosciences, University of Oslo, Oslo, Norway
Nocturnal migration of mesopelagic fish into surface waters is well-documented. Yet, although there is increasing evidence of individual-based deviations from average population migrations and of the importance of small-scale individual behavior for predator-prey interactions and energetic cycling, little is known about what mesopelagic animals do when in upper waters. Using high-resolution data from an upward-facing, moored, split-beam echosounder we analyzed the night-time individual vertical swimming behavior of pearlsides (Maurolicus muelleri) over one winter. The population behavior is characterized by migration to the surface after sunset, “midnight-sinking” and another migration to the surface in the morning, followed by return to the daytime habitat. Focusing on individuals unveiled diverse behavioral patterns during different phases of the migration. After ascending to upper layers at dusk, M. muelleri leaves the surface waters, not by sinking, but by actively swimming in a step-wise pattern characterized by relocations alternated by pauses. Following the descent, vertical swimming is sustained at lower levels. Around midnight, the vertical swimming direction changes from predominantly downward to upward. Several hours before dawn, the fish start ascending toward the surface in a step-wise pattern. During population ascent in the afternoon and descent in the morning, some individuals at the fringes of schools migrate without intermittent pauses. This study documents the feasibility of using submerged, stationary echosounders in unveiling the individual behavior of mesopelagic fish.
Introduction
Large scale phenomena, such as diel vertical migration, are normally studied at the population and community level, and in situ studies of individual behavior are still scarce among plankton and micronekton (Pearre, 2003). Yet, populations consist of individuals of different states doing different things, many of which may or may not deviate from the average (Torgersen, 2001; Solberg and Kaartvedt, 2017). Understanding the behavior of individuals may improve our understanding of metabolic demands (Treberg et al., 2016), predator-prey interactions (O’Brien et al., 1990), and ultimately carbon flux (Pearre, 2003).
Animals engage in a range of behaviors related to foraging, mating, migrations, or resting. To date, especially the night time behavior of marine animals, such as fish, remains largely elusive, mostly due to methodological restrictions (Hammerschlag et al., 2017). Mesopelagic fish and other diel vertical migrants are usually expected to feed near the surface at night. How the organisms actually spend the night, though, varies between species (Simard et al., 1985; Giske et al., 1990; Balino and Aksnes, 1993; Pearre, 2003), seasons (Staby and Aksnes, 2011; Prihartato et al., 2015), and states (Simard et al., 1985; Pearre, 2003; Staby et al., 2012). Despite studies indicating this variability among mesopelagic fish (Torgersen, 2001; Kaartvedt et al., 2008; Olivar et al., 2017; Solberg and Kaartvedt, 2017), quantitative data of their individual behavior is largely lacking. We know next to nothing about what these fish do at night.
Twilight migrations, where animals ascend to the ocean surface around dusk and dawn, but return to intermediate depths during night (midnight sinking) are common among pelagic taxa and repeatedly documented for acoustic scattering layers (Tarling et al., 2002; Staby et al., 2011; Valle-Levinson et al., 2014). Potential reasons for such behavior are manifold, but include reduced activity after satiation (Cushing, 1951; Rudjakov, 1970), temperature selection for energy optimization (Giske and Aksnes, 1992), prey distribution (Torgersen et al., 1997; Valle-Levinson et al., 2014) and predator avoidance (Torgersen et al., 1997; Staby, 2010; Staby and Aksnes, 2011; Prihartato et al., 2015). Still, we know very little about the individual behavior and activities resulting in such commonly observed population distribution patterns.
One mesopelagic fish that is known for its twilight migrations is the small (<6 cm standard length; (Rasmussen and Giske, 1994; Goodson et al., 1995) Mueller’s pearlside (Maurolicus muelleri, Sternoptychidae). It forms the shallow-most mesopelagic scattering layers in Norwegian fjords (e.g., Giske et al., 1990; Staby and Aksnes, 2011). In winter, adult M. muelleri reside in a scattering layer at around 150–200 m depth throughout the diel cycle (Staby et al., 2011). The adult fish may rely on lipids built up over the summer and autumn (Falk-Petersen et al., 1986), but may also forage on overwintering Calanus during daytime (Bagøien et al., 2001). Juveniles (<1 year) instead maximize growth by feeding on plankton in shallower waters during twilight (Giske et al., 1990; Bagøien et al., 2001). The juveniles form a shallow scattering layer with a strong diel migration pattern with ascent to the surface in the afternoon, subsequent midnight-sinking during a non-feeding period at night (Giske and Aksnes, 1992; Bagøien et al., 2001) and a dawn ascent in the morning before returning to daytime depth (Staby and Aksnes, 2011; Prihartato et al., 2015). Juveniles are a main prey for e.g., blue whiting and saithe (Giske et al., 1990).
Here we explore the night-time behavior of juvenile Mueller’s pearlside throughout the winter (December 2010–March 2011) in a well-studied fjord system (e.g., Kaartvedt et al., 1988; Giske et al., 1990; Staby et al., 2011). We applied an upward-looking echosounder floating in an anchored rig enabling studies of individuals with a temporal resolution of 2 records s–1 throughout the study period. Based on their population averages (e.g., Staby et al., 2012; Prihartato et al., 2015), we hypothesized that activity of juveniles changes during the night, yet with higher variability in individual behavior than that predicted from average diel vertical migration patterns.
Materials and Methods
Location and Target Species
Masfjorden is a 20 km long fjord at the west coast of Norway (∼60°50’ N, ∼005°30’ E). It has a maximum depth of 494 m and a sill depth of 75 m bordering to Fensfjorden, which is connected to the coastal ocean (details in Kaartvedt et al., 1988). In Masfjorden, scattering layers shallower than 200 m are almost entirely formed by M. muelleri with juvenile fish in a shallow scattering layer (<100 m at night and ∼100 m during the day) and the adults in a deeper scattering layer (around 200 m) during autumn and winter (Giske et al., 1990; Staby et al., 2011). The two layers merge in spring (Staby et al., 2011). The glacier lanternfish Benthosema glaciale prevails below ∼200 m, with limited diel vertical migration in winter (Giske et al., 1990; Kaartvedt et al., 2009).
Dataset
Three upward facing stationary split-beam echosounders (EK60, Simrad) were deployed in Masfjorden between October 5–7, 2010 and recovered on August 17, 2011. Echosounders were moored at ∼370 m (38 kHz), ∼250 m (120 kHz), and ∼90 m depth (200 kHz) to enable high resolution of acoustic signals throughout the water column. The deepest echosounder was located at the bottom, the two shallower mounted in floating, anchored rigs in the same part of the fjord. The echosounders were cabled to shore and, with the exception of short periods of power failures, continuous recordings are available from all three frequencies for the entire study period. For further details about the setup of the echosounders see Prihartato et al. (2015). Here, we use data from the 200 kHz echosounder for the analysis of scattering layer depth and individual behavior. In addition, we consulted data from the deeper located 120 kHz echosounder for an overall assessment of the population behavior. This allowed to monitor the full diel migrating cycle including when juveniles migrated to below the 200 kHz echosounder (Figure 1), and also the largely non-migrating adults.
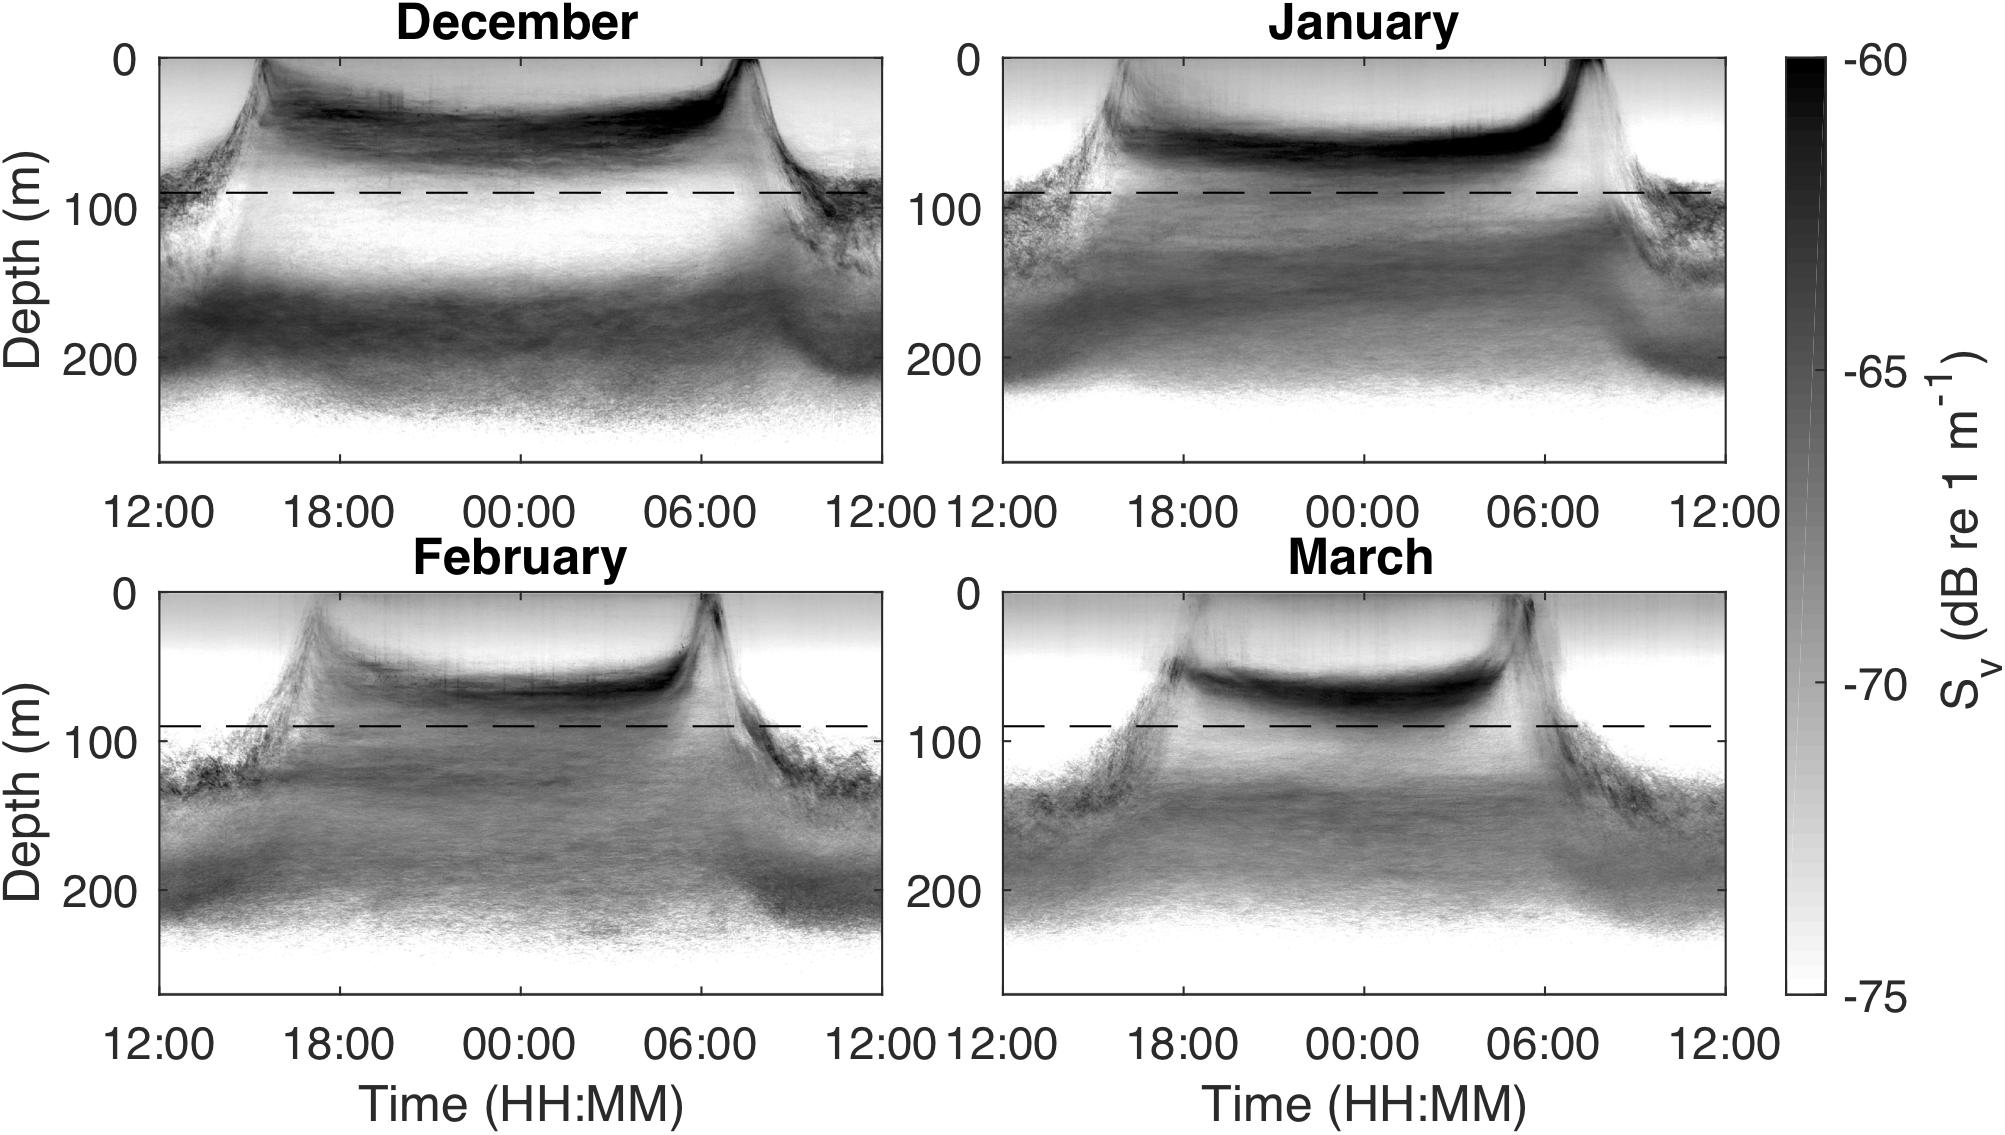
Figure 1. Monthly median echograms for December 2010–March 2011 from an upward-looking, stationary 120 kHz echosounder in Masfjorden, Norway, showing scattering layer movements in the upper 300 m. The shallow scattering layer (<150 m depth) consists mainly of juvenile Maurolicus muelleri, the targets of this study, while the deeper scattering layer (>150 m depth) is mainly composed of adult M. muelleri. The dashed horizontal line indicates the depth of the 200 kHz echosounder that was used for the tracking analysis.
We analyzed data from December 2010 to March 2011, which enabled detailed analysis of individual swimming behavior of juvenile M. muelleri without the inclusion of deeper-living targets that only to a limited degree migrated vertically during this period (see e.g., Prihartato et al., 2015). Echosounder data with a temporal resolution of ∼2 s–1 were available from 98 days. Surface light levels (2 m above water) were measured continuously after the end of December 2010, yet the sensitivity of the light meter was too low for winter night-time measurements (see Prihartato et al., 2015).
For information on approximate nocturnal light levels during the study period, we obtained cloud cover and precipitation data from the nearby (∼20 km) weather station Takle from https://seklima.met.no/observations/ (download on November 12, 2019) and moon phases from https://www.timeanddate.com/moon/phases/ (accessed on November 12, 2019). Night time cloud cover and precipitation were calculated by averaging data collected within 0.3 days around midnight on each day. Time of sunrise and sunset were calculated for each day using the function sunRiseSet1. All dates and times are presented in UTC (local time -1 h; maximum deviation from apparent solar time about 33 min on December 1, 2010).
Population Analysis
One aim of the study was to relate individual behavior to that of the M. muelleri population. Therefore, the location and migration velocity of the scattering layer formed by juvenile M. muelleri were determined. The raw EK60 data were reorganized into a three-dimensional grid, with a daytime (resolution of 90 s), depth (resolution of 0.3 m) and date dimension, in order to improve computation times and data accessibility. Each grid cell contained the average (calculated in the linear domain) volume backscattering strength (Sv, dB re 1 m–1 (MacLennan, 2002), in the following referred to as backscatter), calculated from the raw data of the given depth and time interval. The gridded backscatter data were used in all of the following population analyses. We calculated monthly median backscatter from the 120 kHz data by computing the median backscatter for each depth and daytime interval over all dates in the respective month.
Properties of Scattering Layers
The depth of the scattering layer was determined for each day of the study period using night time data (between sunset and sunrise) between 2 and 84 m depth. Data closer to the transducer could not be used due to noise (ping interference) at about 86 m depth. Between 0.1 day (144 min) after sunset and before sunrise, all values with depths < 19 m were excluded to reduce the inclusion of night time surface signals (Supplementary Figure S1). Backscatter values > −53 dB re 1 m–1 usually occurred due to extended surface signals or strong individual targets (potentially larger fish). These high backscatter values were thus not representative for the M. muelleri population and therefore excluded from the analysis. The thresholds for these data exclusions were determined empirically from the echograms. The remaining backscatter data were linearized to sv (m–1), the volume backscattering coefficient (MacLennan, 2002). For each time point, the cumulative sv over depth was calculated and the depth where the cumulative sv reached 50% of its maximum value was defined as the midpoint of the scattering layer. In some cases, the M. muelleri scattering layer could not be clearly identified due to low fish densities, which we defined as a cumulative sv < 5 × 10⁻⁶ m–1. Periods where the cumulative sv fell below this threshold were excluded from the scattering layer analysis. We calculated the vertical velocity of the scattering layer by applying a moving slope approach2 with a time window of 0.05 decimal days (72 min) on the scattering layer depth.
Delineating Dusk Descent and Dawn Ascent
Individual targets could not be resolved when in surface waters at dusk and dawn, and we here focus on the nocturnal behavior in-between these timepoints. The midnight sinking period was marked by the population starting to descend from the surface to deeper layers in the evening (from now on referred to as dusk descent) and the ascent to the surface in the morning (from now on dawn ascent). We used the location of the scattering layer to determine the start of the dusk descent and the end of the dawn ascent of the population (Figure 2). We chose the first time-point when the center of the scattering layer was at its shallowest depth in the afternoon and morning, respectively, as criteria. We also calculated the time spent in near-surface waters < 20 m depth at dusk and dawn for each day.
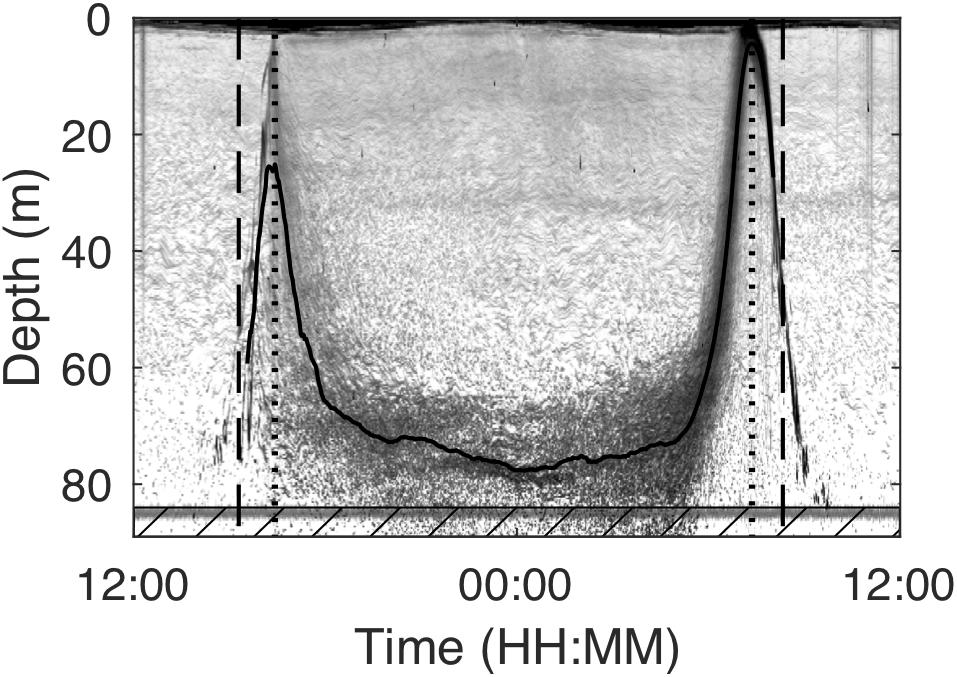
Figure 2. Example echogram from January 22, 2011 as recorded by a 200 kHz echosounder deployed at around 92 m depth in Masfjorden with annotations showing the results of the scattering layer description. The solid line indicates the depth of the middle of the scattering layer. Dashed lines indicate the start of the dusk descent (beginning of midnight sinking) and the end of the dawn ascent (end of midnight sinking). Interrupted lines show the time of sunset and sunrise on that day. The line at around 84 m depth is noise. Data in the hatched box in the lowest part of the echogram were not included in the scattering layer description due to that noise, but were included during target tracking.
Identification of Maurolicus muelleri and Description of Swimming Behavior
The proximity of the M. muelleri scattering layer to the 200 kHz transducer at night enabled the identification of night-time individual swimming behavior. Densities of fish in the core of the scattering layer were too high for separating individuals during some parts of the night and at long distance from the transducer (i.e., shallow depth), while individuals outside the core and during periods of lower density could be distinguished successfully. Types of swimming patterns were first visually identified from echograms in the Sonar5-Pro software (Balk and Lindem, 2017) on separate days and thereafter quantified using target tracking.
Target Tracking
Successive echoes of individual targets can be combined and thus the path of individuals over depth, time and in along and athwart direction can be followed (target tracking; Brede et al., 1990). We used target tracking to assess the individual vertical swimming of M. muelleri over the entire study period. Target tracking was performed in the software Sonar5-Pro (Version 6.0.4, Balk and Lindem, 2000, 2017). Prior to the tracking, the files were pre-processed by cross-filter detection (Balk and Lindem, 2001, 2017), a procedure which improves the detection of individual tracks in single echo detection mode. Default settings were selected for the cross-filter detection. The thus modified single echo detection echograms were then analyzed by automatic target tracking. We optimized the parameters for the target tracking (Table 1) beforehand by comparing manual and automatic tracking at different time points of the study period. We adjusted the tracking parameters depending on distance from the transducer (range), which reduces the uncertainties at longer ranges compared to when using a single set of parameters. Individuals were tracked between 5 and 85 m range (i.e., ∼9–89 m depth). The use of cross-filter detection introduces uncertainties. While enabling tracking at increased ranges and at higher densities (Balk and Lindem, 2002), it also increases the risk of multiple detections, increases ping gaps and introduces noise into the target strength (MacLennan, 2002) of tracks. Yet, we decided to accept these uncertainties to be able to analyze individual movements throughout most of the water column and with longer track durations that enabled the differentiation between behaviors. Only few individuals (∼3%) were tracked at ranges > 60 m (shallower than 34 m depth; Supplementary Figure S2). While these few individuals have limited influence on the overall results, they contribute information about processes and behavior in the upper water column.
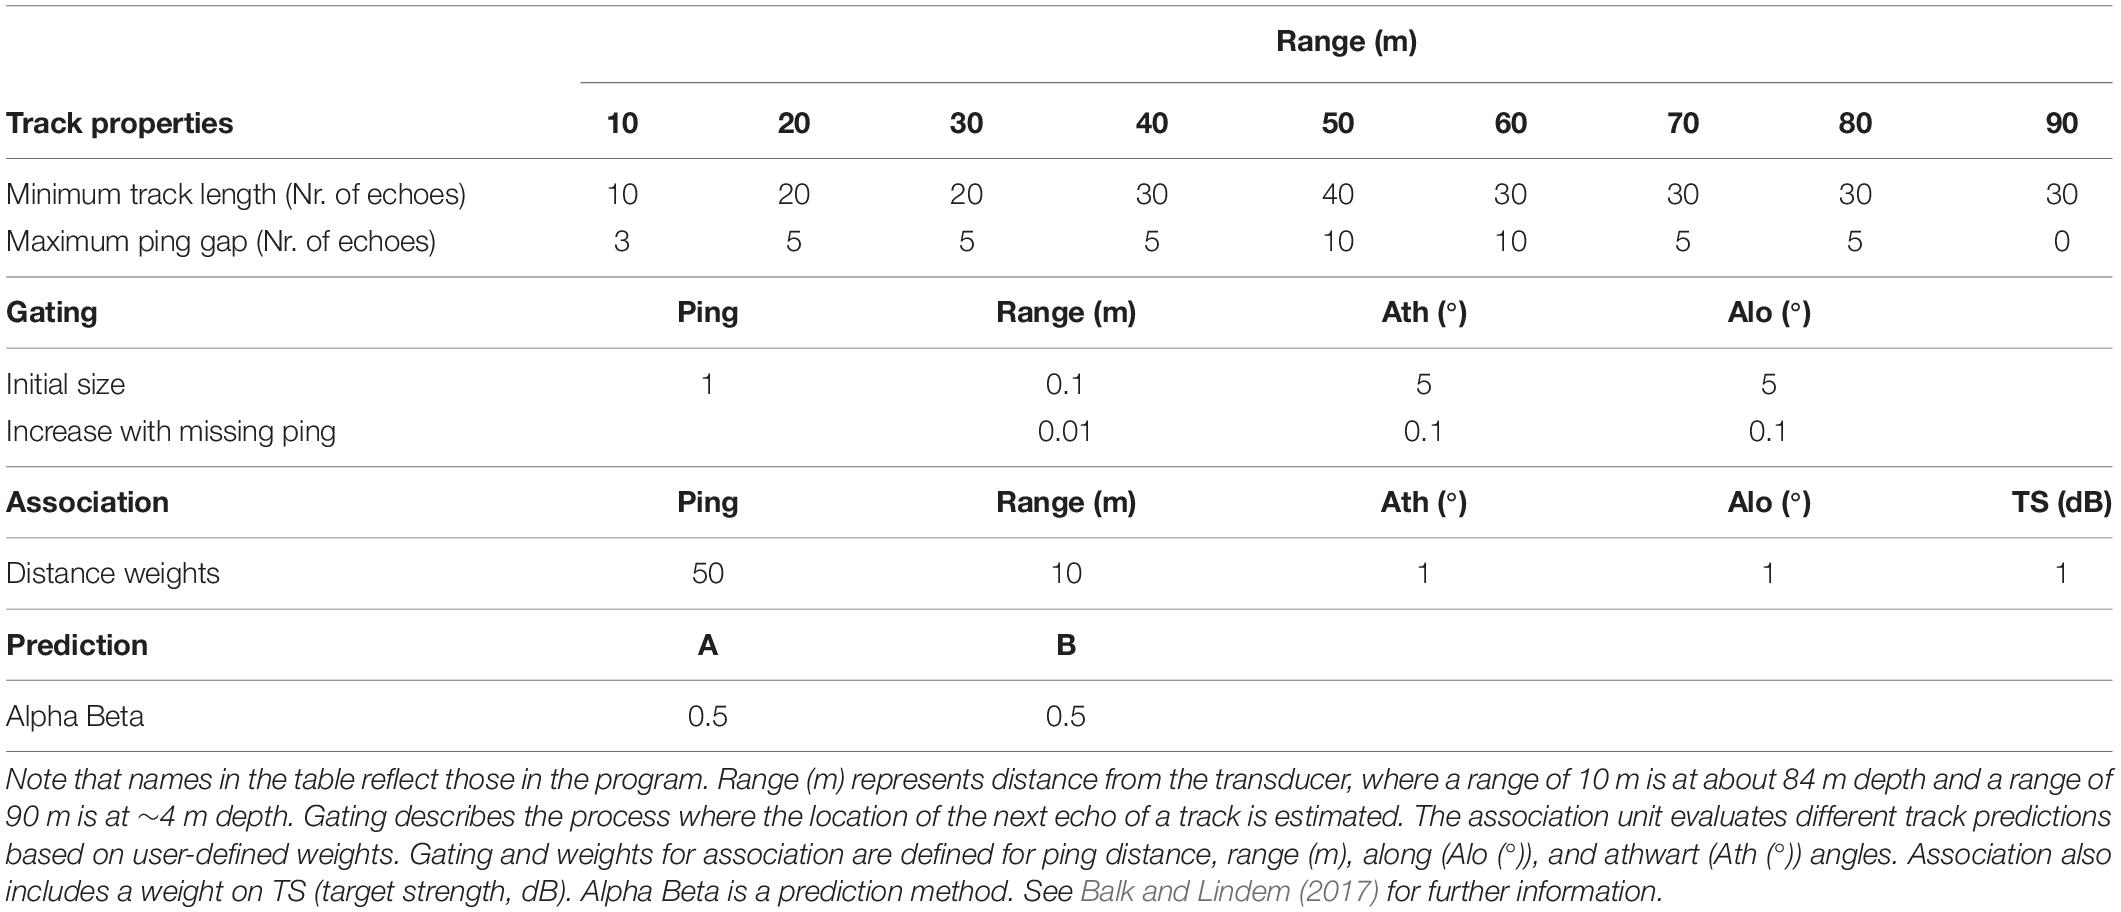
Table 1. Settings used in the automatic target tracking analysis in Sonar5-Pro (Balk and Lindem, 2017).
High population densities hamper individual tracking detection (Handegard, 2007). Correspondingly, individuals close to the transducer are tracked more effectively due to the higher resolution of targets. Differences in population densities over time, e.g., lower densities during the dusk descent, and distances to the transducer, e.g., shorter distances in the morning when many individuals already started descending, thus led to a higher number of descending tracks. Nevertheless, a visual comparison of the tracks and echograms indicated that the tracks’ position information and thus behavior of the individuals were represented well. This also makes us confident that we are not assessing the behavior of outliers with deviating behavior and that the large-scale picture of the behavioral repertoire observed here is representative.
Quantification of Tracks and Behavior
The workflow during track processing and filter criteria as outlined below are summarized in the Supplementary Figure S3. The data were processed and analyzed in Matlab (Mathworks; R2017b). We first applied a filter to exclude potential other targets than M. muelleri. This identity filter included a threshold in mean TS (Figure 3) and excluded daytime tracks from after sunrise and before sunset. We determined the TS thresholds by manually tracking M. muelleri individuals on one randomly selected day of each of the 4 months (about 800 tracks per day) and then identifying the TS range that included about 90% of the tracked individuals on these 4 days. Tracks with a mean TS outside the defined range were excluded from further analysis. This procedure allowed identification of M. muelleri with a reduced influence of tilt angles (Miyashita et al., 1996) as fish in all different angles were included during the manual tracking. A minimum track duration of 30 s was used. The first time-point of each track determined whether the tracks were within the defined night-time hours.
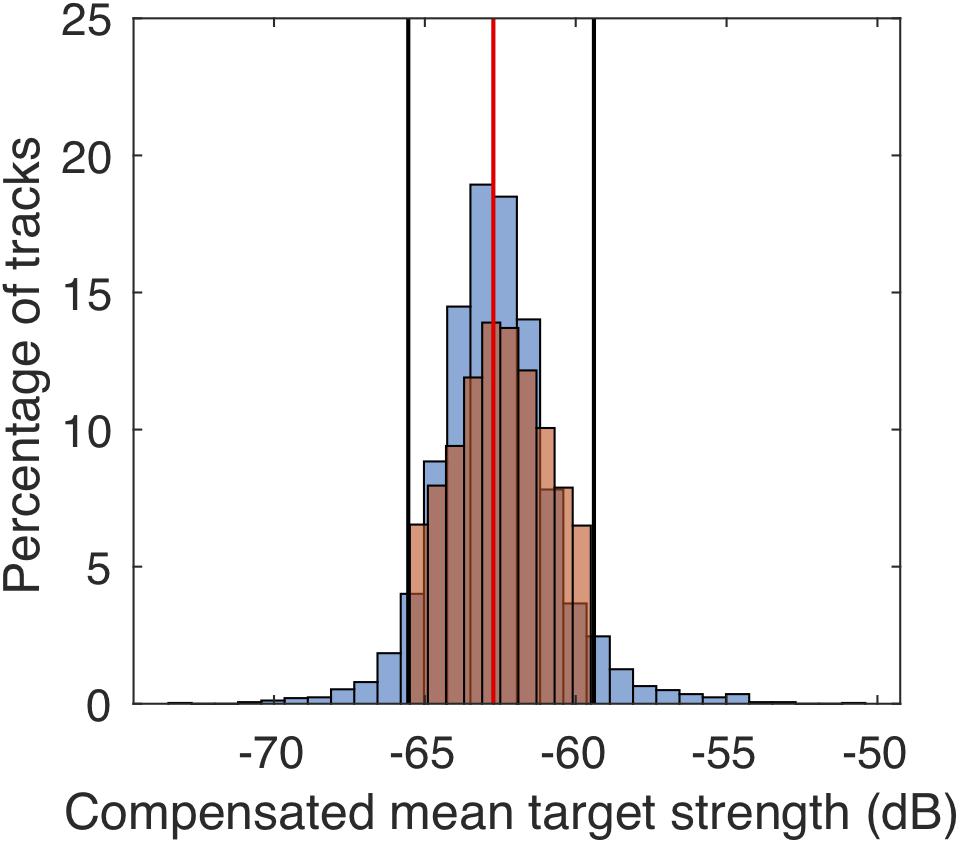
Figure 3. Comparison of target strengths of manually (blue bars) and automatically (orange bars) tracked individuals on four randomly selected dates (one from each month; December 10, 2010, January 8, 2011, February 24, 2011, and March 1, 2011). The red vertical line indicates the median target strength and the black lines the limits of the 90% distribution of target strengths which were used to filter automatically tracked M. muelleri tracks.
After applying the identity filter, 613003 tracks remained and were further processed. Depth outliers of each individual track
were removed by first calculating a running median as well as a running median absolute deviation (MAD) (each with a window of 10 echoes) of the track’s depths and then replacing depth values that deviated from the running median by more than the MAD × 10 by the running median. In the next step, a running mean (window size of 10 echoes) was applied to the depth values of each such treated track. We calculated net vertical displacement (m), track duration (s) and vertical velocity (vertical displacement divided by track duration; cm s–1) of each track. Each track was also examined for patterns of alternations between segments of active vertical ascent or descent, and pauses in which fish maintained a constant depth, although they might have been active in the horizontal plane (Supplementary Figure S4). We determined and subsequently counted the pauses in each track using thresholds. We defined parts of the tracks with depth changes < 0.01 m between at least four subsequent echoes, as pauses and those with larger depth changes as active phases. Single values of pauses or active phases were filled by the surrounding values. For example, when in the vector x = [0,0,0,1,0,0,1,1,1,1,0,0], the digit 1 stands for “pause” and 0 for “active phase,” then the resulting index vector of which echoes should be regarded as pause would look like this: y = [0,0,0,0,0,0,1,1,1,1,0,0]. The first and last segments (i.e., the first and last ascent, descent or pause) of each accepted track with more than two pauses were excluded in order to reduce errors from the target tracking, stemming from potentially overlapping tracks. Tracks with < 60 echoes were considered fragments and were therefore excluded from further analysis. The remaining 272290 tracks were used for behavioral analysis.
Based on net vertical displacement, number of pauses and track duration, the tracks were assigned to either of three main swimming patterns (Supplementary Figure S3):
1. Step-wise swimming: targets change depth by alternating active upward/downward swimming and pauses (Supplementary Figure S4).
2. Stationary: targets maintain a constant depth throughout the track.
3. Direct swimming: targets change depth without pauses.
We then calculated the average active swimming speed (swimming speed, cm s–1), i.e., the vertical velocity during active segments of each step-wise track. In stationary and direct tracks, the swimming speed equals the vertical velocity. Furthermore, we determined the proportion of the three different swimming patterns in relation to time from the start of the dusk descent and time to the end of the dawn ascent, in order to account for seasonal changes. We also calculated the proportion of ascending and descending step-wise tracks, as well as their average vertical velocities in relation to daytime and depth using data binned by depth (3 m intervals) and time (72 min). The proportion of ascending tracks for each bin was determined when more than five tracks were found in the respective bin.
Results
Population Migration
The vertical distribution of the scattering layer ascribed to juvenile M. muelleri differed distinctly between day and night and was characterized by short-term migrations to the surface at dusk and dawn (Figure 1). After the dusk ascent, the population returned to intermediate depths, deepening from an average of 60 m in December to 70 to 75 m in February and March. From mid-January, the vertical distribution changed continuously throughout the night, with the scattering layer moving deeper before midnight and reversing direction after midnight (Figure 4). The daytime distribution was generally deeper and below 100 m. The deeper scattering layer ascribed to the adults mostly stayed below 120 m depth throughout the diel cycle, but a small proportion of this adult population sometimes migrated to shallower depths at night (Figure 1).
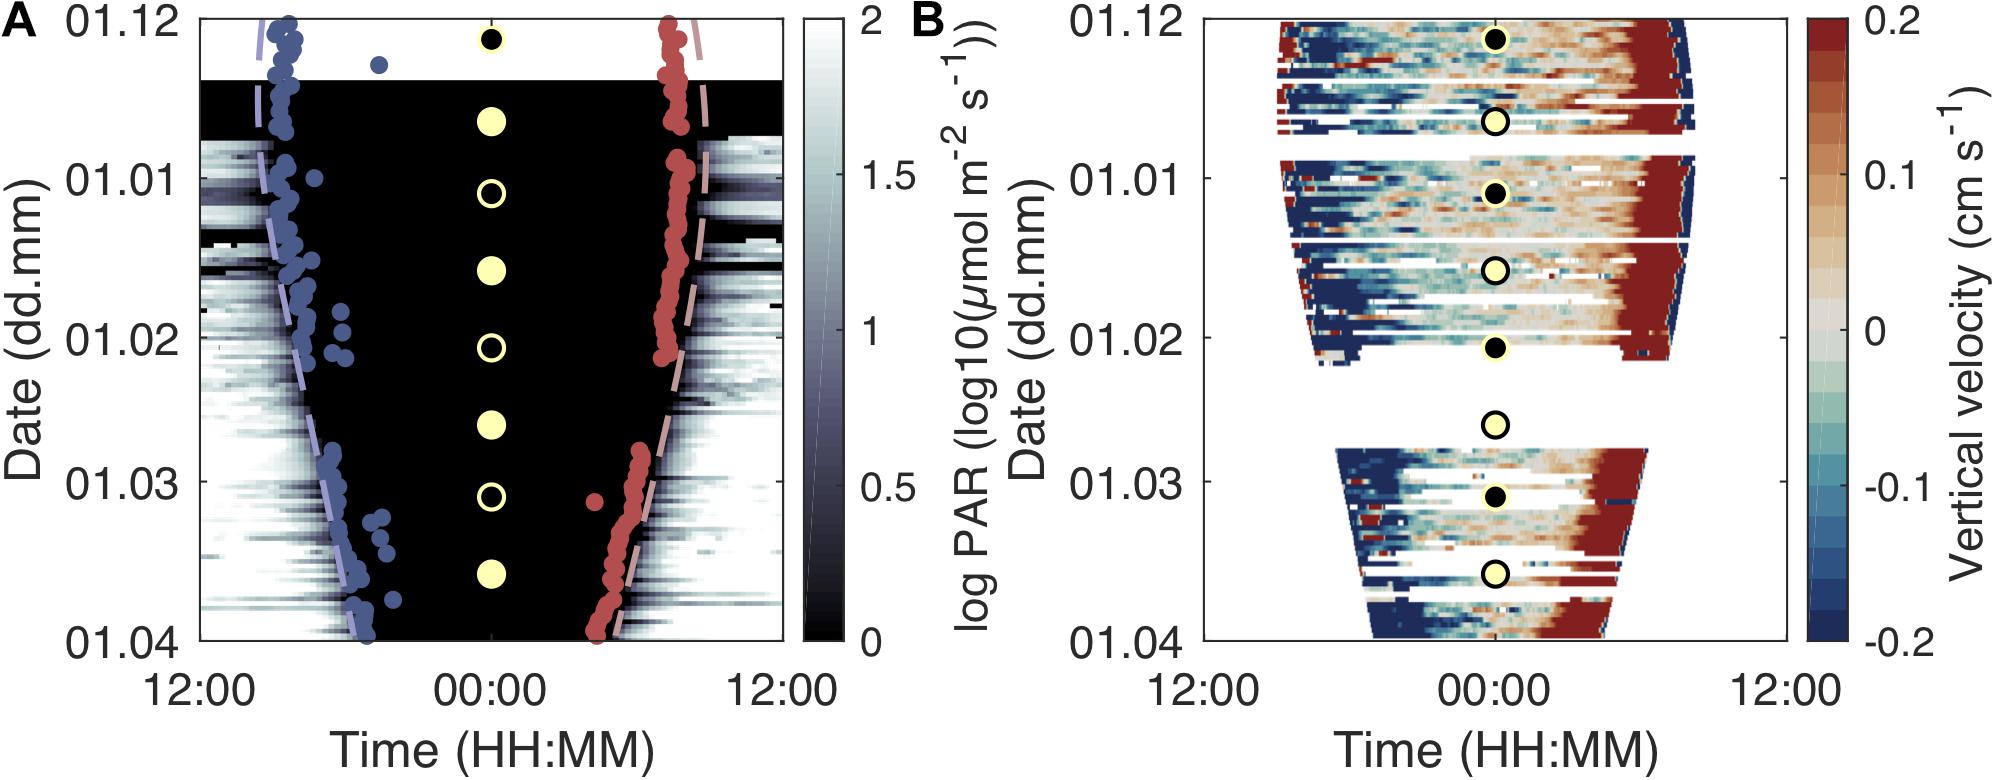
Figure 4. Development of migration timing and velocity over daytime and season. Light intensity and start of dusk descent (beginning of midnight sinking; blue dots) and end of morning ascent (end of midnight sinking; red dots) over the study period and daytime (A). The dashed lines indicate sunset (blue) and sunrise (red). Development of scattering layer vertical velocity over daytime and the study period (B). Warm colors denote upward movement of the scattering layer while cold colors show a downward movement. The circles indicate full moon (yellow fill) and new moon (black fill).
The timing of the dusk descent and dawn ascent of the juveniles changed over the study period in accordance with seasonal changes in sunrise and sunset (Figure 4A). The dusk descent from near-surface waters started about 20–70 min after sunset after the fish had spent around 20–40 min in waters shallower than 20 m. The dawn ascent ended around 40–70 min before sunrise on most days and the fish stayed in near-surface waters (<20 m) for about 40–60 min. The duration between these migrations and sunset/sunrise shortened over the study period (Figure 4A). On darker, foul weather days (e.g., March 20–25, 2011; Figure 4A), dusk descent started earlier and dawn ascent ended later. We did not find a clear relationship of population movement with moon phases (see Supplementary Figure S5 for a combination of Figure 4 with cloud cover and moon phase data). Interrupted upward migrations in the afternoon, where the majority of the population started descending again before reaching the surface, were observed on 39 out of 98 analyzed diel echograms.
Population descent velocities were highest ∼30 min after the start of the dusk descent, while ascent velocities were highest 30–40 min before reaching the surface layers in the morning (Figure 4B). The maximum velocity of the scattering layer during the dusk descent increased from ∼0.5 cm s–1 in December to ∼0.8 cm s–1 in March. The maximum velocity during the dawn ascent increased from ∼1 cm s–1 in December to ∼1.5 cm s–1 in March. On most days, the dawn ascent was faster than the dusk descent.
Individual Swimming Behavior
Of the 272290 tracks, 142547 were classified as step-wise swimming, with 56744 tracks ascending and 85803 descending (Table 2). In total 127221 tracks displayed no or little vertical movement and were classified as stationary. An additional 2522 tracks were directly ascending/descending without steps. Duration and net vertical displacement of individuals depended on the respective swimming pattern (Table 2 and Figure 5).

Table 2. Major track parameters obtained by automatic target tracking for the whole study period from December 1, 2010 to March 31, 2011 (92 days with tracking data).
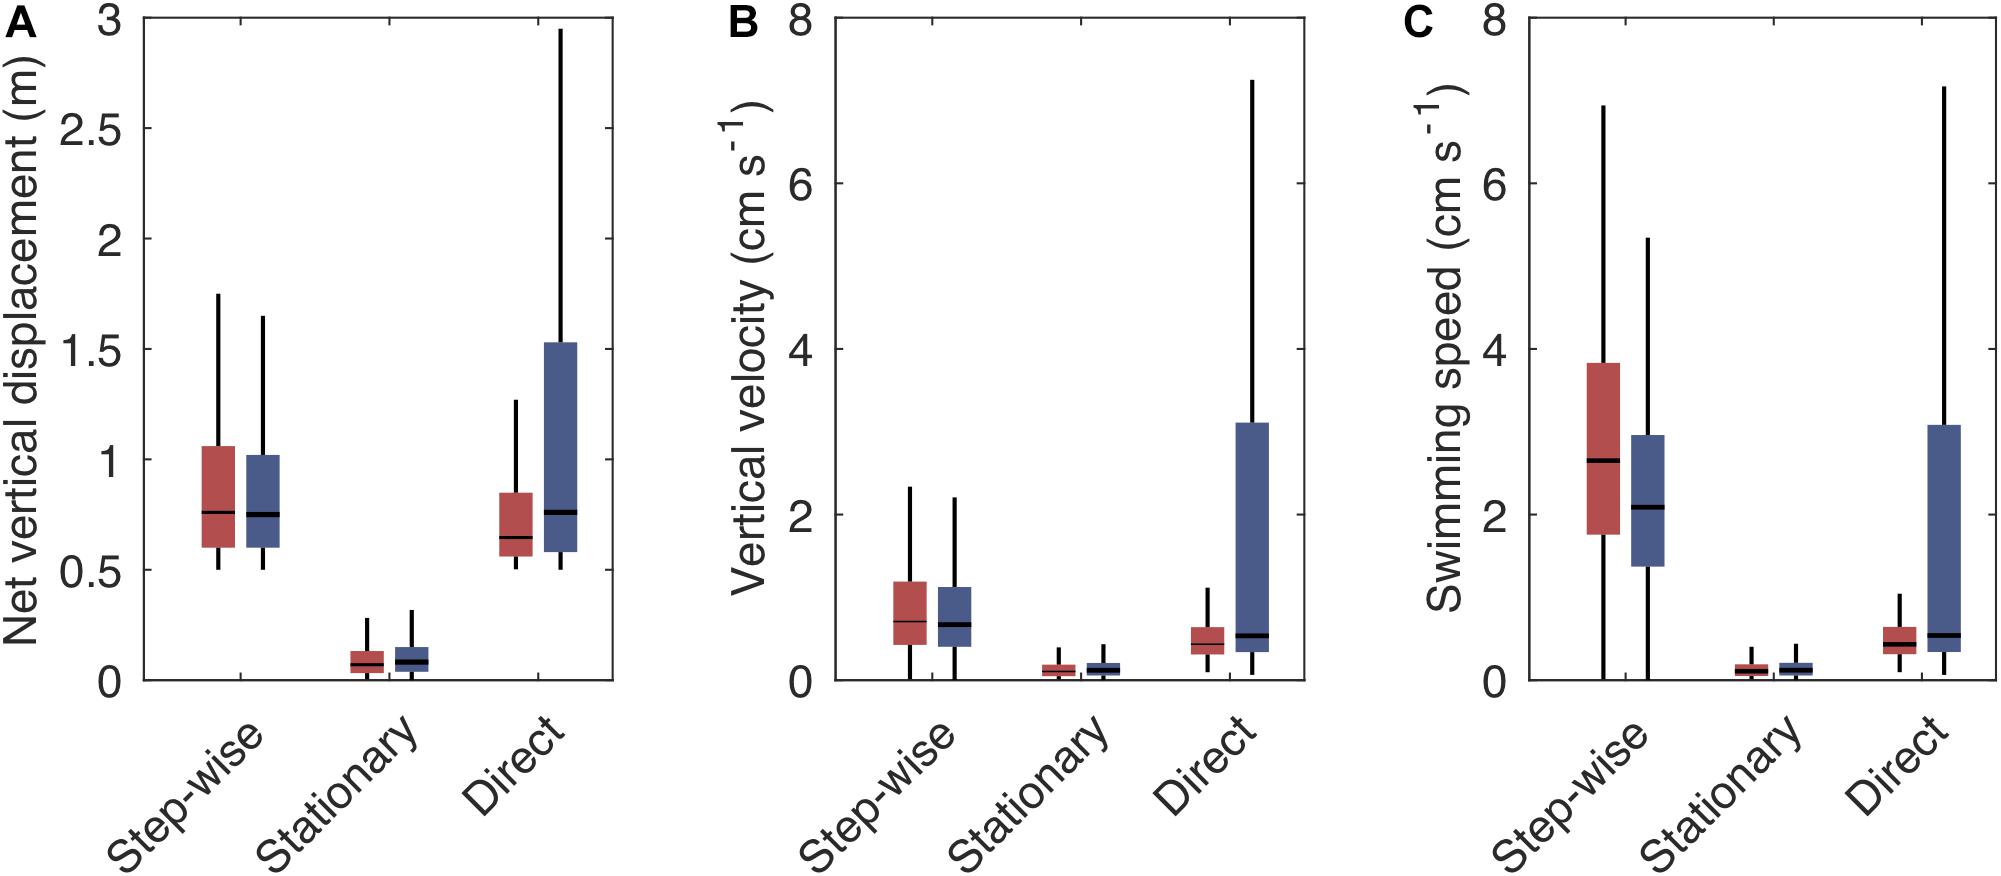
Figure 5. Boxplot showing the vertical swimming characteristics [net vertical displacement (A), vertical velocity (B), and swimming speed (C)] of step-wise, stationary and direct tracks when ascending (red boxes) or descending (blue boxes). Vertical velocity is the net vertical displacement over time, including pauses, while swimming speed is the average velocity during active phases. Boxes indicate the interquartile range, horizontal lines the median, vertical lines the first and fourth quartile. Outliers are not shown. For number of tracks with the respective swimming pattern see Table 2.
Step-wise swimming was especially prominent during the dusk and dawn migrations (Figures 6, 7). Around 75% of the fish swam step-wise around the start of the dusk descent. Although descending step-wise tracks dominated throughout this period of population descent, some ascending individuals were also recorded. During the latter part of the night, the proportion of step-wise swimming behavior increased (Figure 7), reaching a maximum of 87% at the end of the dawn ascent, but then also with a high proportion (>25%) of step-wise descending individuals. The net vertical relocation speed was ∼0.9 cm s–1, while the actual swimming speed during the vertical steps was ∼2–3 cm s–1 (Table 2).
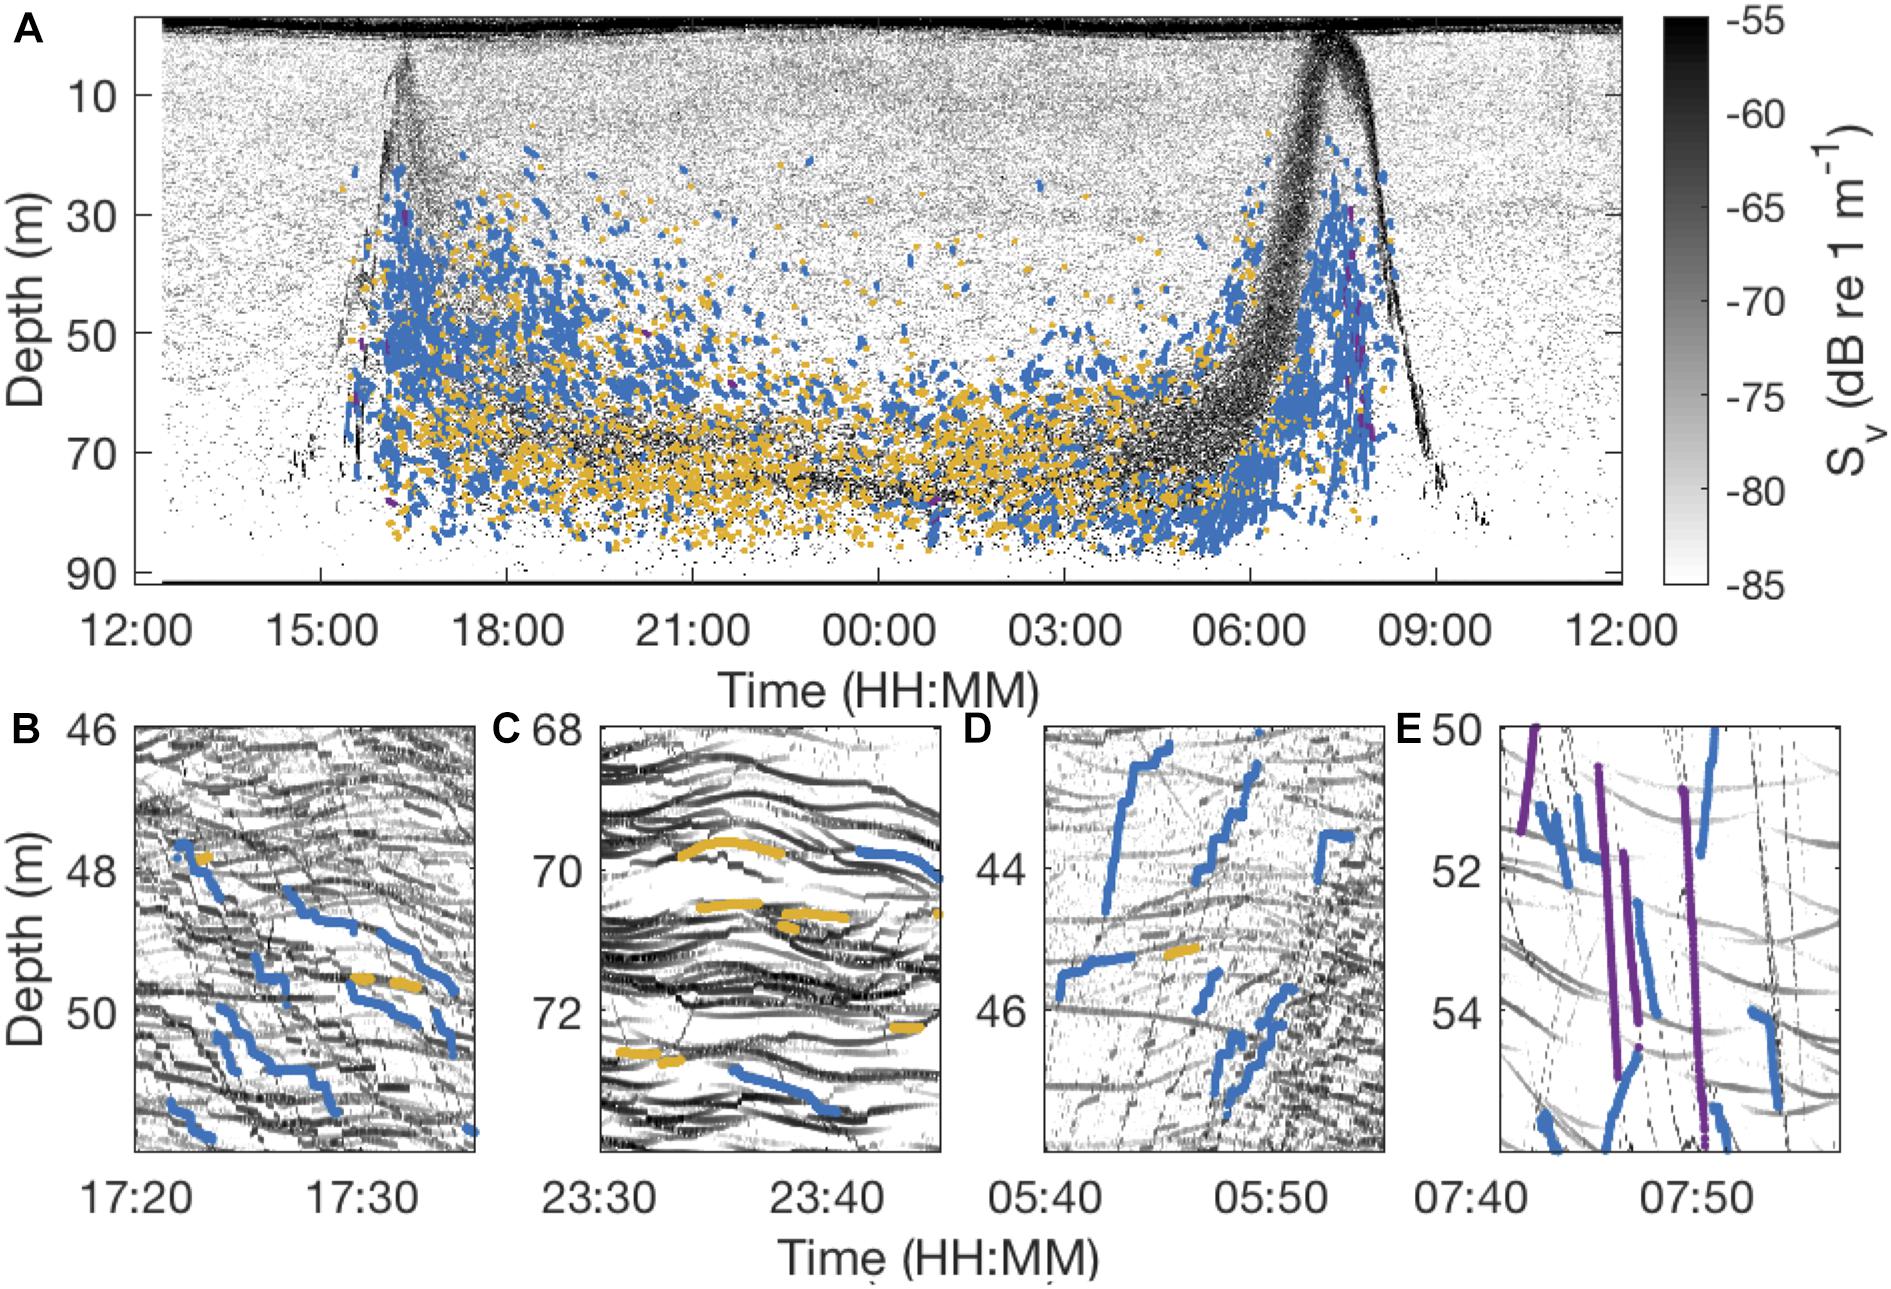
Figure 6. Echogram from January 22, 2011 recorded with a 200 kHz EK60 Echosounder (A) and zoomed into 15-min snapshots representing different periods of nocturnal behavior: the dusk descent (B), the middle of the night (C), the dawn ascent (D), and the dawn descent (E). Tracks representing different types of behaviors are depicted in colored lines with blue lines indicating step-wise swimming, yellow lines stationary behavior and purple lines direct ascents/descents.
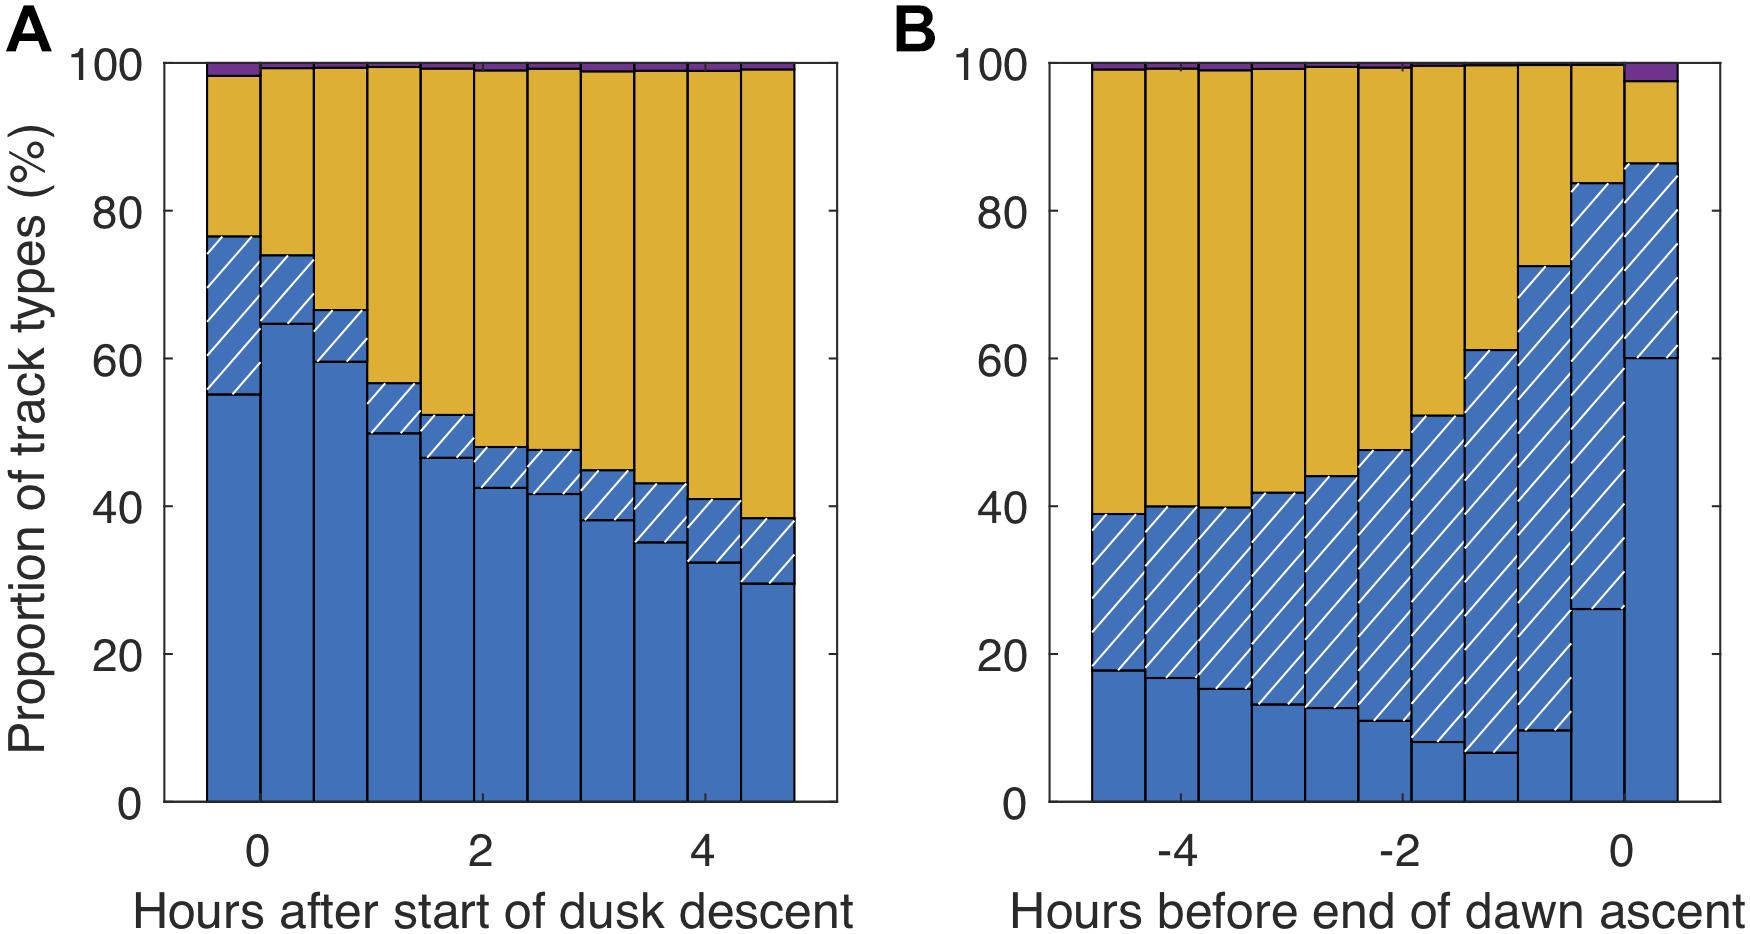
Figure 7. Proportion of different swimming patterns in relation to the start of the dusk descent (beginning of midnight sinking; A) and the end of the dawn ascent (end of midnight sinking; B). Blue (descending) and blue hatched (ascending) bars indicate staircasing behavior, yellow bars stationary swimming and purple bars direct ascent/descent behavior.
Vertically stationary tracks dominated (>50%) the nocturnal records throughout most of the night. These tracks usually lasted for > 1 min, with the track duration being restricted by the number of co-occurring tracks (Figure 6C). In most of the cases where M. muelleri relocated vertically, they moved step-wise (Figures 6, 7). Additional vertical displacement was caused by apparent internal waves. In a subsample of randomly selected days, internal wave amplitudes were around 0.7 m (range 0–1.8 m) and periods about 10 min (range 0–30 min). Internal waves led to vertical transitions of up to 0.6 cm s–1, but usually around 0.2 cm s–1, in otherwise stationary animals.
Even though there were main migration periods at dusk and dawn and dominance of stationary tracks at night, there was a clear pattern of the majority of step-wise relocating individuals descending before midnight and ascending after midnight (Figure 8). This pattern was accentuated toward the end of the study period (Figure 8A). The proportion of descending and ascending tracks depended on depth (Figure 8B). During the first half of the night, descending tracks dominated at all depths, nevertheless we observed the highest proportion of descending tracks in shallow layers of 20–40 m depth. In layers between 70 and 80 m, there always was a strong majority of ascending tracks subsequent to midnight. Correspondingly, the average displacement was downward before midnight and upward after midnight. Individual velocities reached > 1 cm s–1 during the dusk and dawn migrations, while velocities in the middle of the night were mostly lower. Maximum velocities increased over winter.
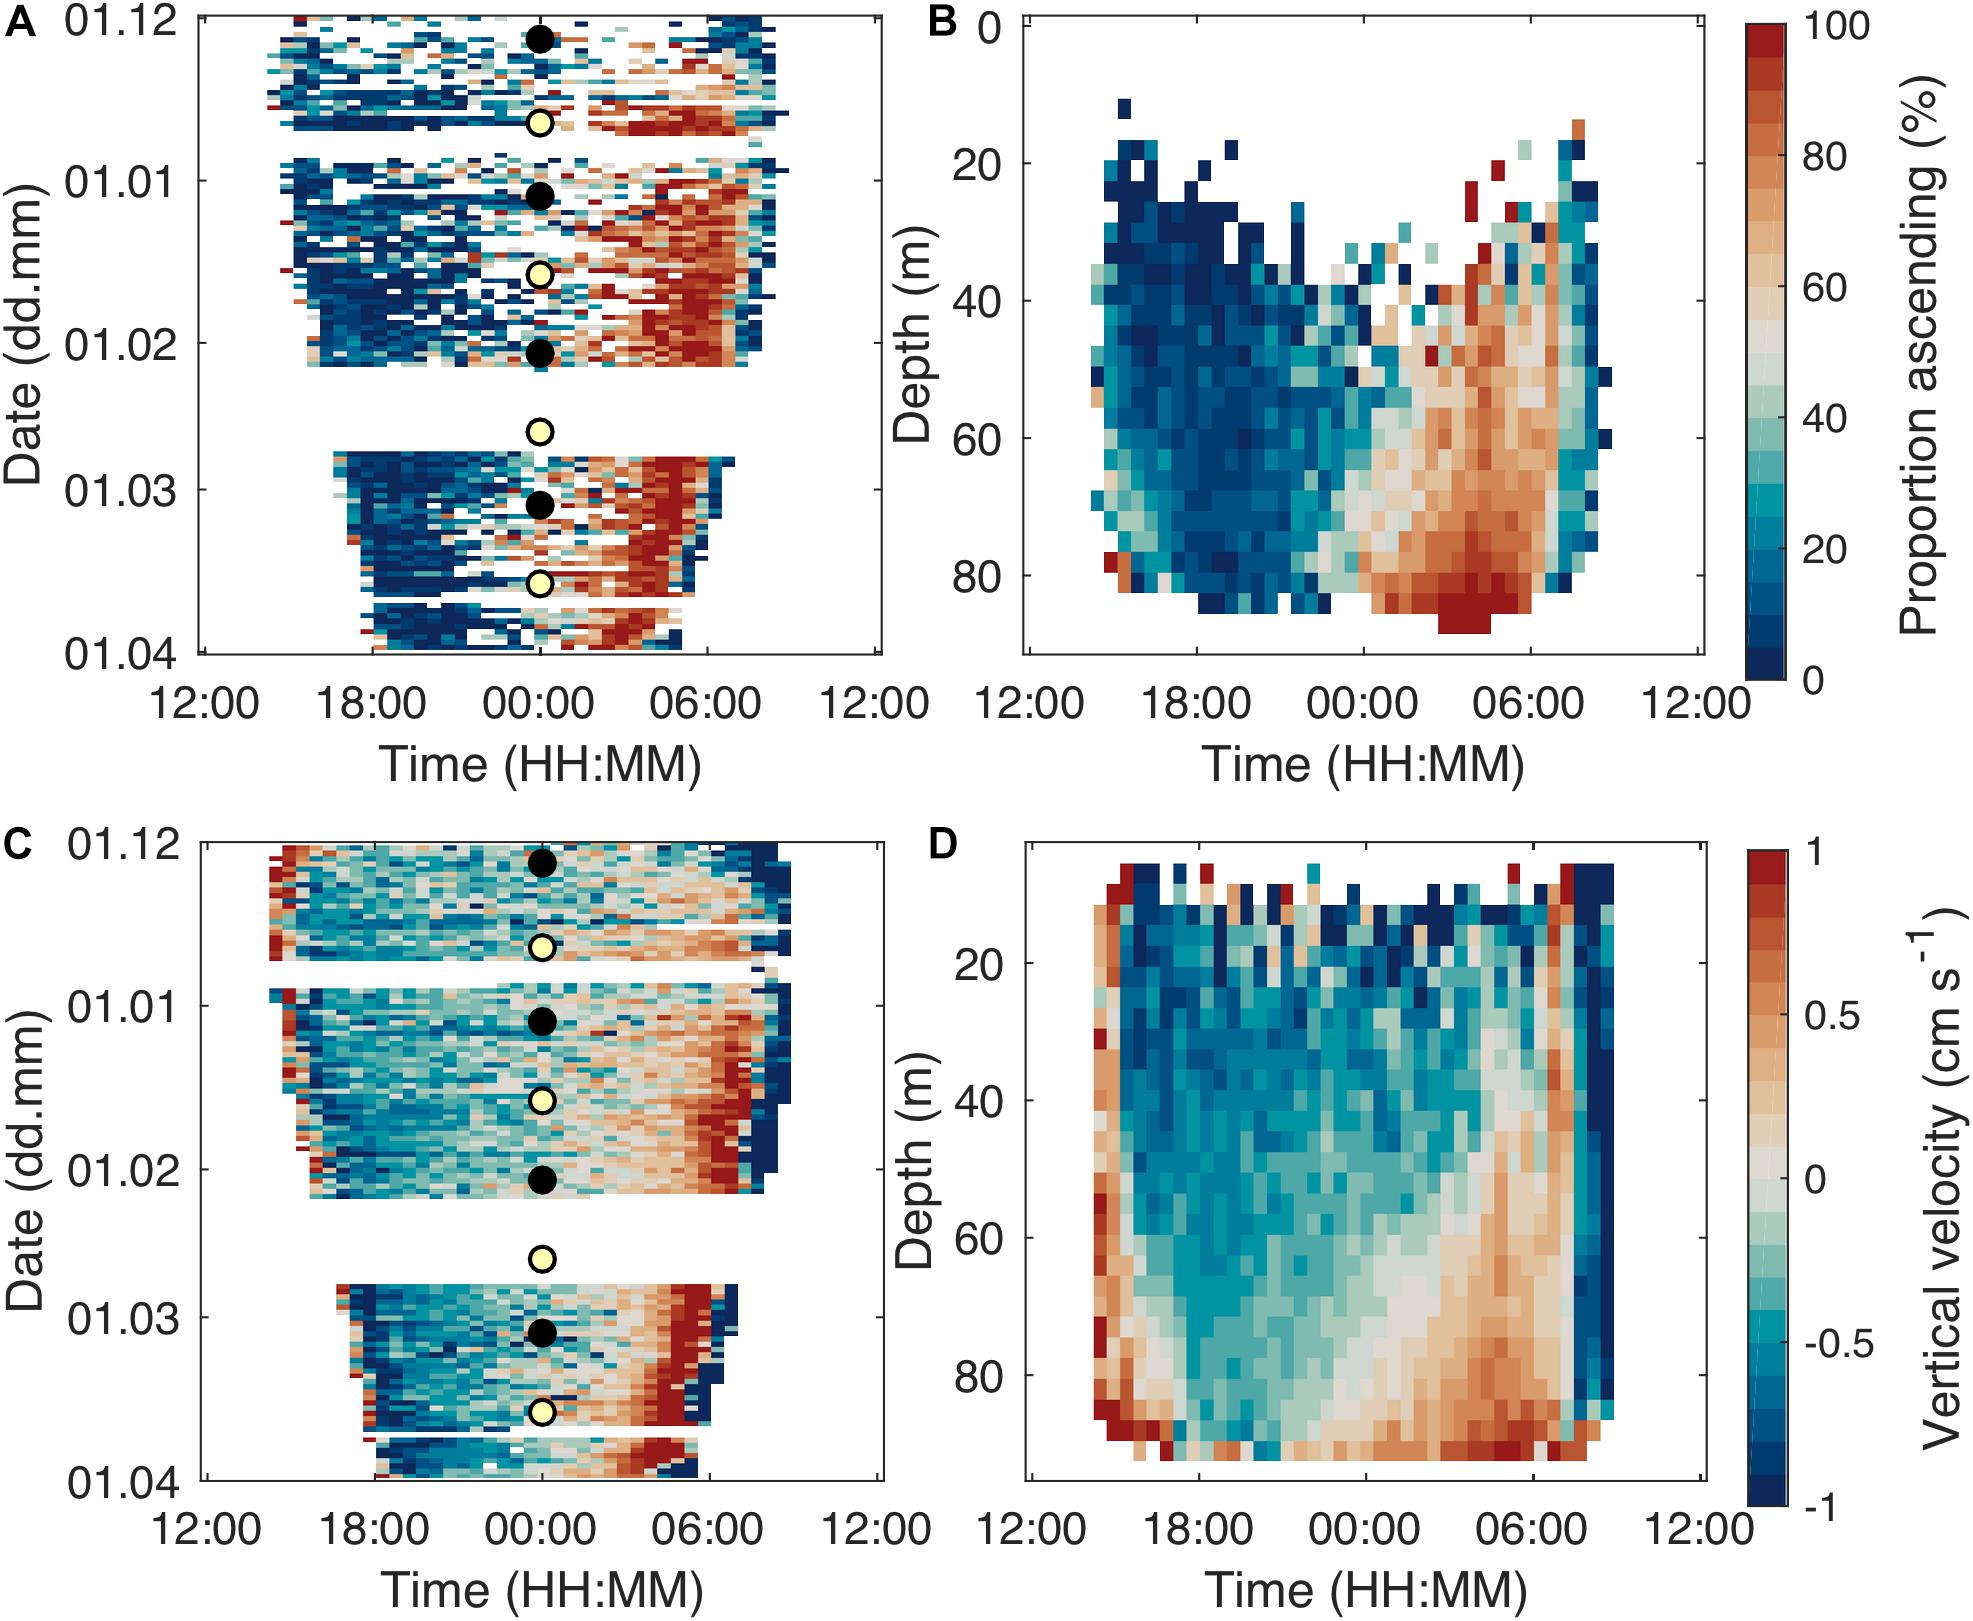
Figure 8. Proportion of (step-wise swimming) ascending tracks, integrated over the whole water column, over daytime and study period (A). Mean image of proportion of ascending stepping tracks over depth and daytime with data from the whole study period (B). Warm colors indicate a higher proportion of ascending individuals. Each bin contains data from at least five tracks. Average vertical velocity of step-wise swimming individuals integrated over depth (C) and study period (D). The circles in (A,C) indicate full moon (yellow fill) and new moon (black fill).
The individual behavior during the overall population’s upward migration in the afternoon and descent in the morning, differed from that observed at night. During these main migration periods, most pearlsides schooled and individuals could not be resolved. However, individuals could occasionally be detected close to these schools. The pause duration in these individuals was short and some of these individuals refrained from pausing altogether and either ascended or descended directly (Figure 8). The highest vertical velocities were achieved in such direct tracks, with means of 1.0 and 1.8 cm s–1 in ascending and descending tracks, respectively (Table 2).
Discussion
Our approach allowed for unique observations of the individual behavior of a mesopelagic fish. The long-term records, combined with high temporal resolution generated representative data for a whole winter period. We are confident in allocating the observed behavior to juvenile M. muelleri due to their well established and distinct vertical distribution pattern in this location (Giske et al., 1990; Staby and Aksnes, 2011; Staby et al., 2012; Prihartato et al., 2015) that was also confirmed by trawling at the initiation and termination of our campaign (own unpublished results). Figure 9 summarizes the typical population movement and the dominant individual swimming patterns of the juvenile M. muelleri population in Masfjorden during the winter of 2010/2011.
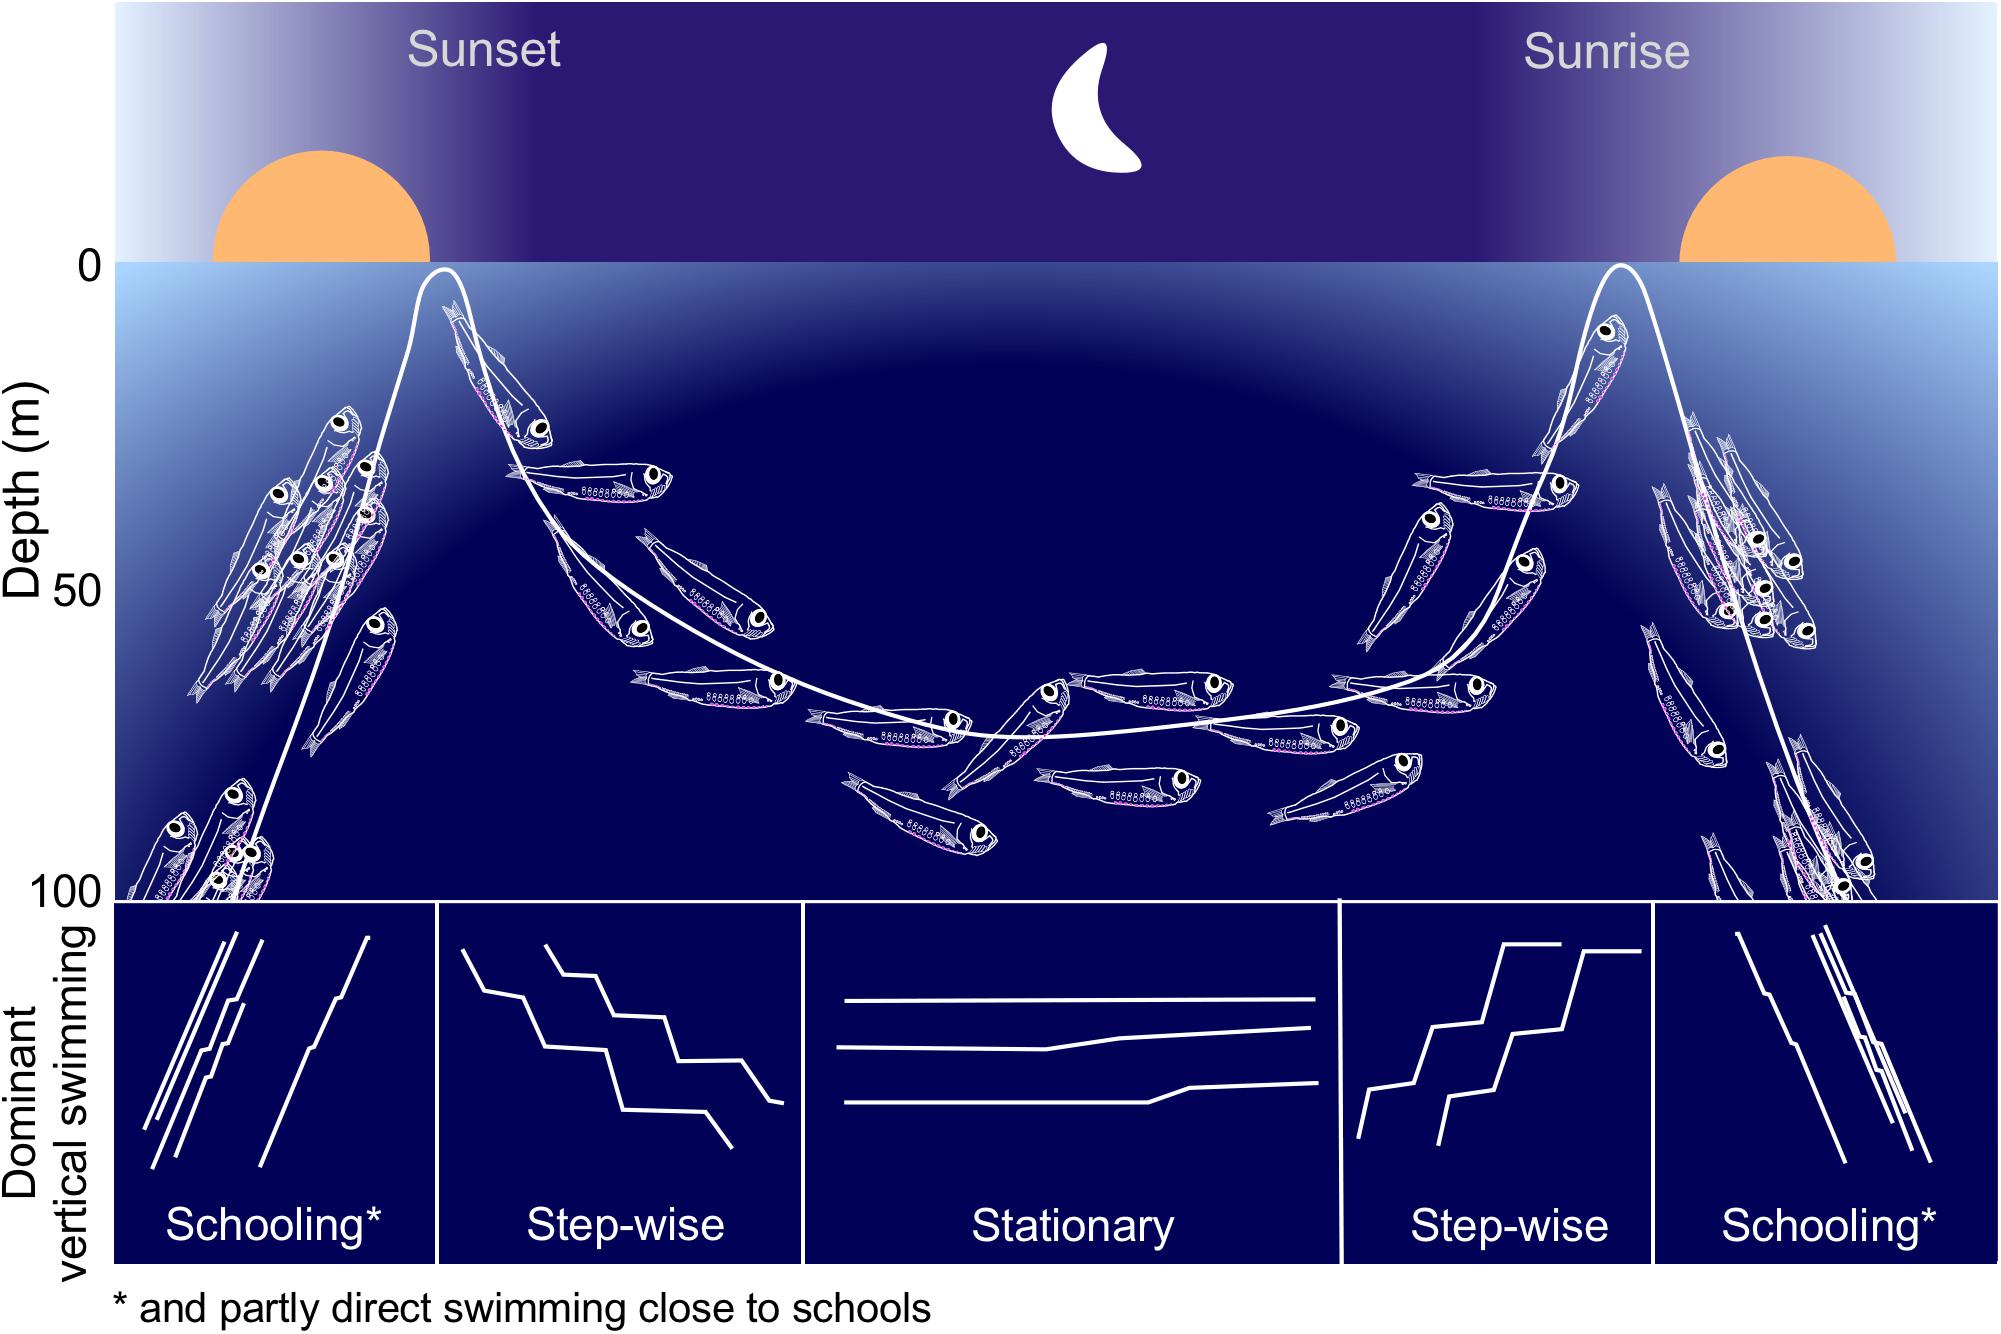
Figure 9. Schematic showing a typical night time distribution and behavior of M. muelleri juveniles in Masfjorden. The lower part of the figure indicates the dominant vertical swimming patterns during different parts of the night.
Also earlier short-term acoustic studies have revealed step-wise swimming in individual mesopelagic fish and preliminarily assigned the behavior to M. muelleri and B. glaciale (Torgersen, 2001; Kaartvedt et al., 2008). Our study using hundreds of thousands of tracks from a period of 4 months shows that M. muelleri juveniles consistently swim step-wise when changing depth at night. The dominance of step-wise swimming during the dusk descent – roughly mirroring the dawn ascent – indicates that midnight sinking is not “sinking,” but rather encompasses active behavior in M. muelleri. The fishes may have been slightly negatively buoyant during the descent as secretion of gas into the swim bladder takes time (Strand et al., 2005), and juveniles often seemed to slowly sink during pauses of their step-wise descent (average 0.25 cm s–1; preliminary results). Nevertheless, swimming speeds during active relocation were almost 10-fold higher.
To what extent midnight sinking represents sinking or an active behavior is often unknown (Pearre, 2003). The consistent active choice of deeper night-time distribution by M. muelleri underscores the biological significance of such behavior. Some visual predators are capable of nocturnal feeding also in low light levels (Ryer and Olla, 1999; Kaartvedt et al., 2019). This includes gadoids, which are main predators of M. muelleri in Masfjorden (Giske et al., 1990; Staby, 2010), and which indeed migrate to surface waters during winter nights (Staby, 2010). The predator distribution indicates that deeper would be safer. It also suggests that descending in a step-wise pattern may reflect some anti-predatory behavior (see below). Although the increase of the population’s night-time depth over winter could agree with a deepening of the temperature maximum in Masfjorden (c.f. Prihartato et al., 2015), the continuous relocation of individuals throughout the night indicates no particular temperature preference. This suggests that other factors than growth optimization in warmer temperatures (Wurtsbaugh and Neverman, 1988; Giske and Aksnes, 1992; Staby et al., 2011; Prihartato et al., 2015), play a role for nocturnal descent in M. muelleri.
After the dusk descent and through most of the night, the majority of the fish appeared to be neutrally buoyant, remaining relatively stationary, with short vertical relocations intermitted by long pauses. Such behavior may both save energy (Videler and Weihs, 1982; Torgersen, 2001) and reduce conspicuousness (O’Brien et al., 1990). Nevertheless, there was a small percentage of relocating individuals at all times, which is also reflected in the scattering layer not reaching a constant depth at night. It is intriguing that the shift from predominantly downward to upward swimming on most days took place many hours before dawn during the long winter nights (cf. Figures 4, 8; Staby et al., 2011). This suggests that internal processes, e.g., an internal clock determine the start of the ascent (Cohen and Forward, 2005; Sloman et al., 2005; Tosches et al., 2014; Häfker et al., 2017), while only the speed of the ascent is regulated by the change in light hours later.
The dawn ascent was usually faster than the dusk descent, both on population and individual levels. Although reflecting apparently similar behavior, dusk descent and dawn ascent occur under vitally different environmental conditions. During the dusk descent, the fish swim into darkening water after light levels at the surface have become too low for foraging (de Busserolles et al., 2017), so that the fish merely retreat to more favorable conditions to spend the hours of darkness. In contrast, the step-wise swimming toward increasing light during the dawn ascent initiates a foraging period.
The step-wise behavior observed for both situations, i.e., with and without foraging, contrasts suggestions that stepwise relocation in mesopelagic fish represents saltatory search for prey (Kaartvedt et al., 2008). The similar behavior at descent and ascent is probably also unrelated to swim-bladder adjustment (Mehner, 2006; Fujino et al., 2009), as filling the swim-bladder during descent is a considerably slower process than emptying it during ascent (ascent; Strand et al., 2005). Also, some individuals at the fringes of the schools swam without stepping, i.e., without apparent need for swim-bladder adjustment. Being relatively safe in the vicinity of a school of conspecifics may elicit a different swimming behavior than when swimming solitary, in concordance with a hypothesis of predator-avoidance by step-wise swimming (O’Brien et al., 1990).
Motility represents a balance between maximizing encounter with prey and mates and minimizing encounter with predators. The probability of detection by a predator is higher when moving (O’Brien et al., 1990), and the pauses during step-wise swimming can reduce detection by both visual (De Robertis, 2003; Kaartvedt et al., 2008) and tactile predators (Sørnes and Aksnes, 2004). Moreover, for M. muelleri, the intermittent stepping behavior may minimize periods of reduced protection associated with change in tilt. The pearlside is particularly well equipped with ventral photophores for counter illumination (Cavallaro et al., 2004), which are less effective at tilted angles, i.e., when moving vertically (Janssen and Harbison, 1986).
Individual behavior generally, but not always, concurred with the behavior of the scattering layer. For example, at times of fast, continuous scattering layer movements, we also recorded a high proportion of step-wise swimming. Similarly, mostly stationary fish made up the very slow population movements in the middle of the night. On the other hand, we demonstrate that actual swimming speeds during relocations cannot be inferred from the average population movement. Active swimming speeds reached about 1 body length s–1 (assuming a body length of about 2.6 cm; Goodson et al., 1995), while scattering layer and individual net velocities always remained well below this value. This may have implications for understanding the energetics of these fish (Giske and Aksnes, 1992; Staby et al., 2012), as energetic costs typically assume a non-linear dependency on speed (e.g., McKenzie, 2011), and energetic models often assume a speed of 1 body length s–1 (Staby et al., 2012). Furthermore, there were always individuals swimming in opposite direction to that of the main population, documenting a more diverse behavioral repertoire than that expressed by the main population results.
While the population behavior by necessity results from the cumulative of the individual behaviors, we document that it is not possible to infer individual behavior from the behavior of the average population. We observed intraspecific variability in swimming behavior, both on population level, e.g., in migration timing, and on individual level, e.g., vertical directionality and swimming pattern. Probably, variability in population behavior may best be explained by external factors generating reliable large-scale interpretable signals, as for example light conditions (Prihartato et al., 2015). Water column light levels depend strongly on weather and mesopelagic fish react directly to e.g., darkening caused by rainfall (Kaartvedt et al., 2017) or to moon light (Last et al., 2016; Prihartato et al., 2016). Moon light may deepen night time scattering layer depths (Prihartato et al., 2016) and delay vertical migrations. However, in the typically cloudy and rainy Western Norway and Masfjorden, clear full moon nights are rare, suggesting limited if any influence of moonlight on the behavioral variability in our study (s.a. Supplementary Figure S5).
The behavioral options of each individual are manifold, and reflect responses to a whole suite of more local sensory cues, e.g., from predators, prey and conspecifics, and behavior obviously also depends on individual state (Pearre, 2003; Sih et al., 2015). The observed variability in individual behavior suggests that although the vertical migration in M. muelleri is generally synchronized, the fishes may behave independent of the group. Whether these differently behaving individuals differ in size, metabolic demands or are otherwise distinguishable from the rest of the population remains unknown for now.
While we can still only speculate about why mesopelagic fish behave as they do, our study documents the feasibility of using a submerged, stationary echosounder in unveiling the individual behavior responsible for the large scale, more easily observed, scattering layer movements of mesopelagic fish. We demonstrate that midnight sinking is not sinking, but an active behavior. The behavioral repertoire of these fish changes not only during the crepuscular migrations, but also during the night at large, with consistent patterns throughout the winter, and with variations between the individuals within the population. Only with an increased understanding of what these fish actually do can we begin to estimate the ecological interactions involving the enormous amounts of small mesopelagic fish in the world’s oceans.
Data Availability Statement
All data supporting the conclusion of this manuscript will be made available upon request, to any qualified researcher.
Ethics Statement
The acoustic studies did not involve any animal treatment, handling, or experiments. Data and results were only obtained by remote, unobtrusive observation.
Author Contributions
SK designed the study and obtained the field data. SC organized and analyzed the data and wrote the manuscript. JT and SK contributed to the improvement of the analysis and writing of the manuscript. All authors contributed to manuscript revision.
Funding
The fieldwork was funded by the King Abdullah University of Science and Technology, Saudi Arabia.
Conflict of Interest
The authors declare that the research was conducted in the absence of any commercial or financial relationships that could be construed as a potential conflict of interest.
Acknowledgments
We thank Anders Røstad and Thor A. Klevjer for invaluable logistic help with the acoustic studies. We would like to thank Helge Balk for assistance with the Sonar5-Pro software. Comments from the two reviewers helped to improve the manuscript.
Supplementary Material
The Supplementary Material for this article can be found online at: https://www.frontiersin.org/articles/10.3389/fmars.2019.00787/full#supplementary-material
Footnotes
- ^ https://se.mathworks.com/matlabcentral/fileexchange/62180-sunriseset-lat-lng-utcoff-date-plot; downloaded on January 15, 2019.
- ^ https://se.mathworks.com/matlabcentral/fileexchange/16997-movingslope; downloaded on April 5, 2018.
References
Bagøien, E., Kaartvedt, S., Aksnes, D. L., and Eiane, K. (2001). Vertical distribution and mortality of overwintering Calanus. Limnol. Oceanogr. 46, 1494–1510. doi: 10.4319/lo.2001.46.6.1494
Balino, B. M., and Aksnes, D. L. (1993). Winter distribution and migration of the sound scattering layers, zooplankton and micronekton in Masfjorden, western Norway. Mar. Ecol. Prog. Ser. 95, 35–50. doi: 10.3354/meps095035
Balk, H., and Lindem, T. (2000). Improved fish detection in data from split-beam sonar. Aquat. Living Resour. 13, 297–303. doi: 10.1016/S0990-7440(00)01079-1072
Balk, H., and Lindem, T. (2001). Inventors; Bryns Patentkontor A/S P.O. Box 765, Sentrum N-0106. Patent No. PCT/NO2000/000288. Oslo, NO: University of Oslo.
Balk, H., and Lindem, T. (2002). “A new method for single target detection,” in Proceedings of the ICES 6th Symposium on Acoustics in Fisheries and Aquatic Ecology, Montpellier.
Balk, H., and Lindem, T. (2017). Sonar4 and Sonar5-Pro Post Processing Systems, Operator Manual Version 604. Oslo: CageEye AS.
Brede, R., Kristensen, F. H., Solli, H., and Ona, E. (1990). Target tracking with a split-beam echo sounder. Rapp. PV Reùn. Cons. Int. Explor. Mer. 189, 254–263.
Cavallaro, M., Mammola, C. L., and Verdiglione, R. (2004). Structural and ultrastructural comparison of photophores of two species of deep-sea fishes: Argyropelecus hemigymnus and Maurolicus muelleri. J. Fish Biol. 64, 1552–1567. doi: 10.1111/j.0022-1112.2004.00410.x
Cohen, J. H., and Forward, R. B. (2005). Diel vertical migration of the marine copepod Calanopia americana. II. Proximate role of exogenous light cues and endogenous rhythms. Mar. Biol. 147, 399–410. doi: 10.1007/s00227-005-1570-1574
Cushing, D. H. (1951). The vertical migration of planktonic Crustacea. Biol. Rev. 26, 158–192. doi: 10.1111/j.1469-185x.1951.tb00645.x
de Busserolles, F., Cortesi, F., Helvik, J. V., Davies, W. I. L., Templin, R. M., Sullivan, R. K. P., et al. (2017). Pushing the limits of photoreception in twilight conditions: the rod-like cone retina of the deep-sea pearlsides. Sci. Adv. 3:eaao4709. doi: 10.1126/sciadv.aao4709
De Robertis, A. (2003). Acoustic observations of the swimming behavior of the euphausiid Euphausia pacifica hansen. ICES J. Mar. Sci. 60, 885–898. doi: 10.1016/S1054-3139(03)00070-75
Falk-Petersen, I. B., Falk-Petersen, S., and Sargent, J. R. (1986). Nature, origin and possible roles of lipid deposits in Maurolicus muelleri (Gmelin) and Benthosema glaciale (Reinhart) from Ullsfjorden, Northern Norway. Polar Biol. 5, 235–240. doi: 10.1007/BF00446091
Fujino, T., Sadayasu, K., Abe, K., Kidokoro, H., Tian, Y., Yasuma, H., et al. (2009). swimbladder morphology and target strength of a mesopelagic fish, Maurolicus japonicus. J. Mar. Acoust. Soc. Jpn. 36, 241–249. doi: 10.3135/jmasj.36.241
Giske, J., and Aksnes, D. L. (1992). Ontogeny, season and trade-offs: vertical distribution of the mesopelagic fish Maurolicus muelleri. Sarsia 77, 253–261. doi: 10.1080/00364827.1992.10413510
Giske, J., Aksnes, D. L., Baliño, B. M., Kaartvedt, S., Lie, U., Nordeide, J. T., et al. (1990). Vertical distribution and trophic interactions of zooplankton and fish in Masfjorden, Norway. Sarsia 75, 65–81. doi: 10.1080/00364827.1990.10413442
Goodson, M. S., Giske, J., and Rosland, R. (1995). Growth and ovarian development of Maurolicus muelleri during spring. Mar. Biol. 124, 185–195. doi: 10.1007/BF00347122
Häfker, N. S., Meyer, B., Last, K. S., Pond, D. W., Hüppe, L., and Teschke, M. (2017). Circadian clock involvement in zooplankton diel vertical migration. Curr. Biol. 27, 2194–2201.e3. doi: 10.1016/j.cub.2017.06.025
Hammerschlag, N., Meyer, C. G., Grace, M., Kessel, S., Sutton, T., Harvey, E., et al. (2017). Shining a light on fish at night: an overview of fish and fisheries in the dark of night, and in deep and polar seas. BMS 93, 253–284. doi: 10.5343/bms.2016.1082
Handegard, N. O. (2007). Observing individual fish behavior in fish aggregations: tracking in dense fish aggregations using a split-beam echosounder. J. Acoust. Soc. Am. 122, 177–187. doi: 10.1121/1.2739421
Janssen, J., and Harbison, G. R. (1986). Hatchetfishes hold horizontal attitudes during diagonal descents. J. Mar. Biol. Ass. 66, 825–833. doi: 10.1017/S0025315400048451
Kaartvedt, S., Aksnes, D. L., and Aadnesen, A. (1988). Winter distribution of macroplankton and micronekton in Masfjorden, western Norway. Mar. Ecol. Prog. Ser. 45, 45–55. doi: 10.3354/meps045045
Kaartvedt, S., Langbehn, T. J., and Aksnes, D. L. (2019). Enlightening the ocean’s twilight zone. ICES J. Mar. Sci. 76, 803–812. doi: 10.1093/icesjms/fsz010
Kaartvedt, S., Røstad, A., and Aksnes, D. L. (2017). Changing weather causes behavioral responses in the lower mesopelagic. Mar. Ecol. Prog. Ser. 574, 259–263. doi: 10.3354/meps12185
Kaartvedt, S., Røstad, A., Klevjer, T. A., and Staby, A. (2009). Use of bottom-mounted echo sounders in exploring behavior of mesopelagic fishes. Mar. Ecol. Prog. Ser. 395, 109–118. doi: 10.3354/meps08174
Kaartvedt, S., Torgersen, T., Klevjer, T. A., Røstad, A., and Devine, J. A. (2008). Behavior of individual mesopelagic fish in acoustic scattering layers of Norwegian fjords. Mar. Ecol. Prog. Ser. 360, 201–209. doi: 10.3354/meps07364
Last, K. S., Hobbs, L., Berge, J., Brierley, A. S., and Cottier, F. (2016). Moonlight drives ocean-scale mass vertical migration of zooplankton during the arctic winter. Curr. Biol. 26, 244–251. doi: 10.1016/j.cub.2015.11.038
MacLennan, D. (2002). A consistent approach to definitions and symbols in fisheries acoustics. ICES J. Mar. Sci. 59, 365–369. doi: 10.1006/jmsc.2001.1158
Mehner, T. (2006). Individual variability of diel vertical migrations in European vendace (Coregonus albula) explored by stationary vertical hydroacoustics. Ecol. Freshw. Fish 15, 146–153. doi: 10.1111/j.1600-0633.2006.00137.x
Miyashita, K., Aoki, I., and Inagaki, T. (1996). Swimming behavior and target strength of isada krill (Euphausia pacifica). ICES J. Mar. Sci. 53, 303–308. doi: 10.1006/jmsc.1996.0039
O’Brien, W. J., Browman, H. I., and Evans, B. I. (1990). Search strategies of foraging animals. Am. Sci. 78, 152–160.
Olivar, M. P., Hulley, P. A., Castellón, A., Emelianov, M., López, C., Tuset, V. M., et al. (2017). Mesopelagic fishes across the tropical and equatorial Atlantic: biogeographical and vertical patterns. Prog. Oceanogr. 151, 116–137. doi: 10.1016/j.pocean.2016.12.001
Pearre, S. (2003). Eat and run? The hunger/satiation hypothesis in vertical migration: history, evidence and consequences. Biol. Rev. Camb. Philos. Soc. 78, 1–79. doi: 10.1017/S146479310200595X
Prihartato, P. K., Aksnes, D. L., and Kaartvedt, S. (2015). Seasonal patterns in the nocturnal distribution and behavior of the mesopelagic fish Maurolicus muelleri at high latitudes. Mar. Ecol. Prog. Ser. 521, 189–200. doi: 10.3354/meps11139
Prihartato, P. K., Irigoien, X., Genton, M. G., and Kaartvedt, S. (2016). Global effects of moon phase on nocturnal acoustic scattering layers. Mar. Ecol. Prog. Ser. 544, 65–75. doi: 10.3354/meps11612
Rasmussen, O. I., and Giske, J. (1994). Life-history parameters and vertical distribution of Maurolicus muelleri in Masfjorden in summer. Mar. Biol. 120, 649–664. doi: 10.1007/BF00350086
Rudjakov, J. A. (1970). The possible causes of diel vertical migrations of planktonic animals. Mar. Biol. 6, 98–105. doi: 10.1007/BF00347238
Ryer, C. H., and Olla, B. L. (1999). Light-induced changes in the prey consumption and behavior of two juvenile planktivorous fish. Mar. Ecol. Prog. Ser. 181, 41–51. doi: 10.3354/meps181041
Sih, A., Mathot, K. J., Moirón, M., Montiglio, P.-O., Wolf, M., and Dingemanse, N. J. (2015). Animal personality and state–behaviour feedbacks: a review and guide for empiricists. Trends Ecol. Evol. 30, 50–60. doi: 10.1016/j.tree.2014.11.004
Simard, Y., Lacroix, G., and Legendre, L. (1985). In situ twilight grazing rhythm during diel vertical migrations of a scattering layer of Calanus finmarchicus. Limnol. Oceanogr. 30, 598–606. doi: 10.4319/lo.1985.30.3.0598
Sloman, K. A., Balshine, S., and Wilson, R. W. (2005). Fish Physiology: Behaviour and Physiology of Fish. Cambridge, MA: Academic Press.
Solberg, I., and Kaartvedt, S. (2017). The diel vertical migration patterns and individual swimming behavior of overwintering sprat Sprattus sprattus. Prog. Oceanogr. 151, 49–61. doi: 10.1016/j.pocean.2016.11.003
Sørnes, T. A., and Aksnes, D. L. (2004). Predation efficiency in visual and tactile zooplanktivores. Limnol. Oceanogr. 49, 69–75. doi: 10.4319/lo.2004.49.1.0069
Staby, A. (2010). Seasonal Dynamics of the Vertical Migration Behavior of Mesopelagic Fish. Ph.D. thesis, University of Bergen, Bergen.
Staby, A., and Aksnes, D. L. (2011). Follow the light–diurnal and seasonal variations in vertical distribution of the mesopelagic fish Maurolicus muelleri. Mar. Ecol. Prog. Ser. 422, 265–273. doi: 10.3354/meps08938
Staby, A., Røstad, A., and Kaartvedt, S. (2011). Long-term acoustical observations of the mesopelagic fish Maurolicus muelleri reveal novel and varied vertical migration patterns. Mar. Ecol. Prog. Ser. 441, 241–255. doi: 10.3354/meps09363
Staby, A., Srisomwong, J., and Rosland, R. (2012). Variation in DVM behavior of juvenile and adult pearlside (Maurolicus muelleri) linked to feeding strategies and related predation risk. Fish. Oceanogr. 22, 90–101. doi: 10.1111/fog.12012
Strand, E., Jørgensen, C., and Huse, G. (2005). Modelling buoyancy regulation in fishes with swimbladders: bioenergetics and behavior. Ecol. Model. 185, 309–327. doi: 10.1016/j.ecolmodel.2004.12.013
Tarling, G. A., Jarvis, T., Emsley, S. M., and Matthews, J. (2002). Midnight sinking behavior in Calanus finmarchicus: a response to satiation or krill predation? Mar. Ecol. Prog. Ser. 240, 183–194. doi: 10.3354/meps240183
Torgersen, T. (2001). In situ swimming behavior of individual mesopelagic fish studied by split-beam echo target tracking. ICES J. Mar. Sci. 58, 346–354. doi: 10.1006/jmsc.2000.1016
Torgersen, T., Kaartvedt, S., Melle, W., and Knutsen, T. (1997). Large scale distribution of acoustical scattering layers at the Norwegian continental shelf and the Eastern Norwegian Sea. Sarsia 82, 87–96. doi: 10.1080/00364827.1997.10413642
Tosches, M. A., Bucher, D., Vopalensky, P., and Arendt, D. (2014). Melatonin signaling controls circadian swimming behavior in marine zooplankton. Cell 159, 46–57. doi: 10.1016/j.cell.2014.07.042
Treberg, J. R., Killen, S. S., MacCormack, T. J., Lamarre, S. G., and Enders, E. C. (2016). Estimates of metabolic rate and major constituents of metabolic demand in fishes under field conditions: methods, proxies, and new perspectives. Comp. Biochem. Physiol. Part A 202, 10–22. doi: 10.1016/j.cbpa.2016.04.022
Valle-Levinson, A., Castro, L., Cáceres, M., and Pizarro, O. (2014). Twilight vertical migrations of zooplankton in a Chilean fjord. Prog. Oceanogr. 129, 114–124. doi: 10.1016/j.pocean.2014.03.008
Videler, J. J., and Weihs, D. (1982). Energetic advantages of burst-and-coast swimming of fish at high speeds. J. Exp. Biol. 97, 169–178.
Keywords: individual behavior, nocturnal, target tracking, diel vertical migration, Maurolicus muelleri
Citation: Christiansen S, Titelman J and Kaartvedt S (2019) Nighttime Swimming Behavior of a Mesopelagic Fish. Front. Mar. Sci. 6:787. doi: 10.3389/fmars.2019.00787
Received: 09 October 2019; Accepted: 06 December 2019;
Published: 20 December 2019.
Edited by:
James Michael Sullivan, Florida Atlantic University, United StatesReviewed by:
Mike Jech, Northeast Fisheries Science Center (NOAA), United StatesSamuel S. Urmy, Monterey Bay Aquarium Research Institute (MBARI), United States
Copyright © 2019 Christiansen, Titelman and Kaartvedt. This is an open-access article distributed under the terms of the Creative Commons Attribution License (CC BY). The use, distribution or reproduction in other forums is permitted, provided the original author(s) and the copyright owner(s) are credited and that the original publication in this journal is cited, in accordance with accepted academic practice. No use, distribution or reproduction is permitted which does not comply with these terms.
*Correspondence: Svenja Christiansen, c3ZlbmphLmNocmlzdGlhbnNlbkBpYnYudWlvLm5v
 Svenja Christiansen
 Josefin Titelman
 Stein Kaartvedt