
94% of researchers rate our articles as excellent or good
Learn more about the work of our research integrity team to safeguard the quality of each article we publish.
Find out more
ORIGINAL RESEARCH article
Front. Mar. Sci. , 09 January 2020
Sec. Marine Biogeochemistry
Volume 6 - 2019 | https://doi.org/10.3389/fmars.2019.00776
 Marion Fourquez1,2,3*
 Matthieu Bressac2,4
 Stacy L. Deppeler1,5
 Michael Ellwood6
 Ingrid Obernosterer7
 Thomas W. Trull1,2,8
 Philip W. Boyd1,2
Iron (Fe) is a paradox in the modern ocean – it is central to many life-critical enzymes but is scarce across most surface waters. The high cellular demand and low bioavailability of Fe likely puts selective pressure on marine microorganisms. Previous observations suggest that heterotrophic bacteria are outcompeted by small diatoms for Fe supply in the subantarctic zone of Southern Ocean, thereby challenging the idea of heterotrophic bacteria being more competitive than phytoplankton in the access to this trace metal. To test this hypothesis, incubation experiments were carried out at the Southern Ocean Time Series site (March–April 2016). We investigated (a) whether dissolved organic carbon (DOC), dissolved Fe, or both limit the growth of heterotrophic bacteria and, (b) if the presence of potential competitors has consequences on the bacterial Fe acquisition. We observed a pronounced increase in both bulk and cell-specific bacterial production in response to single (+C) and combined (+Fe+C) additions, but no changes in these rates when only Fe was added (+Fe). Moreover, we found that +Fe+C additions promoted increases in cell-specific bacterial Fe uptake rates, and these increases were particularly pronounced (by 13-fold) when phytoplankton were excluded from the incubations. These results suggest that auto- and heterotrophs could compete for Fe when DOC limitation of bacterial growth is alleviated. Such interactions between primary producers and nutrient-recyclers are unexpected drivers for the duration and magnitude of phytoplankton blooms in the Southern Ocean.
Geological timescales have enabled microbes to develop adaptive solutions to an evolving environment, and iron (Fe) had a fundamental role in the metabolic pathways that emerged (Falkowski and de Vargas, 2004; Hunter and Boyd, 2007). As life appeared in an oxygen-free environment, the primordial ocean provided sufficient concentrations of readily available Fe (Hunter and Boyd, 2007). However, the concentration of dissolved Fe (DFe) decreased drastically after two major irreversible oxygenation events (∼2.4 billion years and ∼542 million years ago, Ilbert and Bonnefoy, 2013) and Fe is found at trace levels in most of today’s ocean surface (<0.5 nM, Johnson, 1997). Despite these changes, the Fe demand in marine microorganisms remained high. Nature retained this versatile metal, that can have a wide range of oxidation states, as an integral part for a wide range of proteins throughout evolution and many of these proteins are irreplaceable agents for vital cellular metabolic activities (oxygen transport, electron transport, DNA synthesis, etc., Morel and Price, 2003).
In phytoplankton, the photosynthetic transport chain is one of the most prominent Fe-dependent processes. One single copy of a photosystem requires 23–24 atoms of Fe, and overall 80% of Fe is allocated to the photosynthetic transport chain in a cell (Raven et al., 1999; Strzepek and Harrison, 2004; Behrenfeld et al., 2006). In heterotrophic bacteria the respiratory chain accumulates more than 90% of the intracellular Fe (Tortell et al., 1999; Andrews et al., 2003). Phytoplankton and bacteria play important roles in the ocean and have direct influence on global biogeochemical cycles. Considering that phytoplankton drive ocean CO2 sequestration via photosynthesis and downward export, while heterotrophic bacteria control much of the oceanic release of CO2 via respiration, the outcome of a competition for Fe could influence the direction and magnitude of carbon fluxes in the upper ocean.
Despite widespread interest in microbial Fe requirements (Sarthou et al., 2005; Twining and Baines, 2013; Blain and Tagliabue, 2016; Strzepek et al., 2019), there is no consensus regarding the minimum Fe requirements for phytoplankton or heterotrophic bacteria. There are two reasons to explain why this question has not been resolved. First, there have been few studies on the Fe requirements of heterotrophic bacteria compared with those for phytoplankton. Second, the wide range of Fe content relative to C biomass (Fe:C ratio) that exist for phytoplankton does not favor conclusive comparison (Blain and Tagliabue, 2016, and references herein). What is clear, however, is that DFe in the oceans is overwhelmingly complexed (99%, Rue and Bruland, 1997) by strong organic ligands with evidence of them containing Fe-binding functional groups consistent with biologically produced siderophores (Macrellis et al., 2001; Gledhill and Buck, 2012). Marine microbes have evolved different mechanisms to cope with the diversity of the Fe-binding ligand pool, and the capacity to acquire enough Fe for survival in a “highly diffusive” open ocean provides a competitive edge (Desai et al., 2012; Hopkinson and Barbeau, 2012; Toulza et al., 2012). The capacity to produce siderophores is generally confined to heterotrophic bacteria (Armstrong et al., 2004), but the ability to take up siderophores may be more widespread than previously thought, and extend to the phytoplanktonic realm (Hogle et al., 2016; Kazamia et al., 2018; McQuaid et al., 2018). Recent studies have revealed that distinct siderophores and strategies are being employed by heterotrophic bacteria (Boiteau et al., 2016, 2019; Bundy et al., 2018; Debeljak et al., 2019). But to date, no eukaryotic phytoplankton have been found to produce or release siderophores. For this reason heterotrophic bacteria are commonly reported as highly efficient competitors, especially in severely Fe-limited environments (Braun and Killmann, 1999).
The Southern Ocean is the largest High Nutrient, Low Chlorophyll (HNLC) region in the world ocean, mainly because of Fe limitation. In the Southern Ocean, chlorophyll levels remain low year-round, but phytoplankton blooms occur in areas in the vicinity of land masses (Blain et al., 2007). During austral spring 2011, the KEOPS2 project aimed at exploring different phytoplankton blooms east of Kerguelen island. Over the course of the bloom, the release of dissolved organic carbon (DOC) derived from primary production increased the Fe demand of heterotrophic bacteria (Fourquez et al., 2015) which were Fe-limited (Obernosterer et al., 2015). The availability of a labile C source may have led to a higher bacterial Fe demand. These findings raised the hypothesis that labile organic carbon exacerbated the potential competition between small-sized phytoplankton cells (pico- and nanophytoplankton) and heterotrophic bacteria for Fe (Fourquez et al., 2015). The present work aimed to test the above hypothesis. For this, our experimental design was based on the joint assumption that (1) heterotrophic bacteria are outcompeted for Fe by pico-and nanophytoplankton and (2) that DOC availability to heterotrophic bacteria influences the strength of this relationship.
This study was carried out as part of the V02-IN2016 voyage of the R. V. Investigator (March 11 to April 17, 2016). During the expedition, we visited on two occasions (March 19 and 29) the Southern Ocean Time Series (SOTS, 47°S, 142°E) site that is located within a low current region in the subantarctic Zone (SAZ) north of the subantarctic Front (SAF) that marks the northern edge of the Antarctic Circumpolar Current (Figure 1). This area represents a large portion of the total area of the Southern Ocean that serves as a strong sink for atmospheric CO2. Conditions at SOTS are typical and representative of the Indian sector SAZ, from ∼90 to 145°E. The absence of Fe is regarded as the primary cause that restricts primary production and constraints the biological pump in the area (Sedwick et al., 1997; Cassar et al., 2011; Trull et al., 2019). The relief of the Fe limitation can occur by aerosol Fe supply in summer in the region that differs in this way from mechanisms of deep mixing and/or sediment input/resuspension that enhances Fe concentrations in surface waters at the vicinity of subantarctic islands such as Kerguelen (Blain et al., 2008; Rembauville et al., 2015).
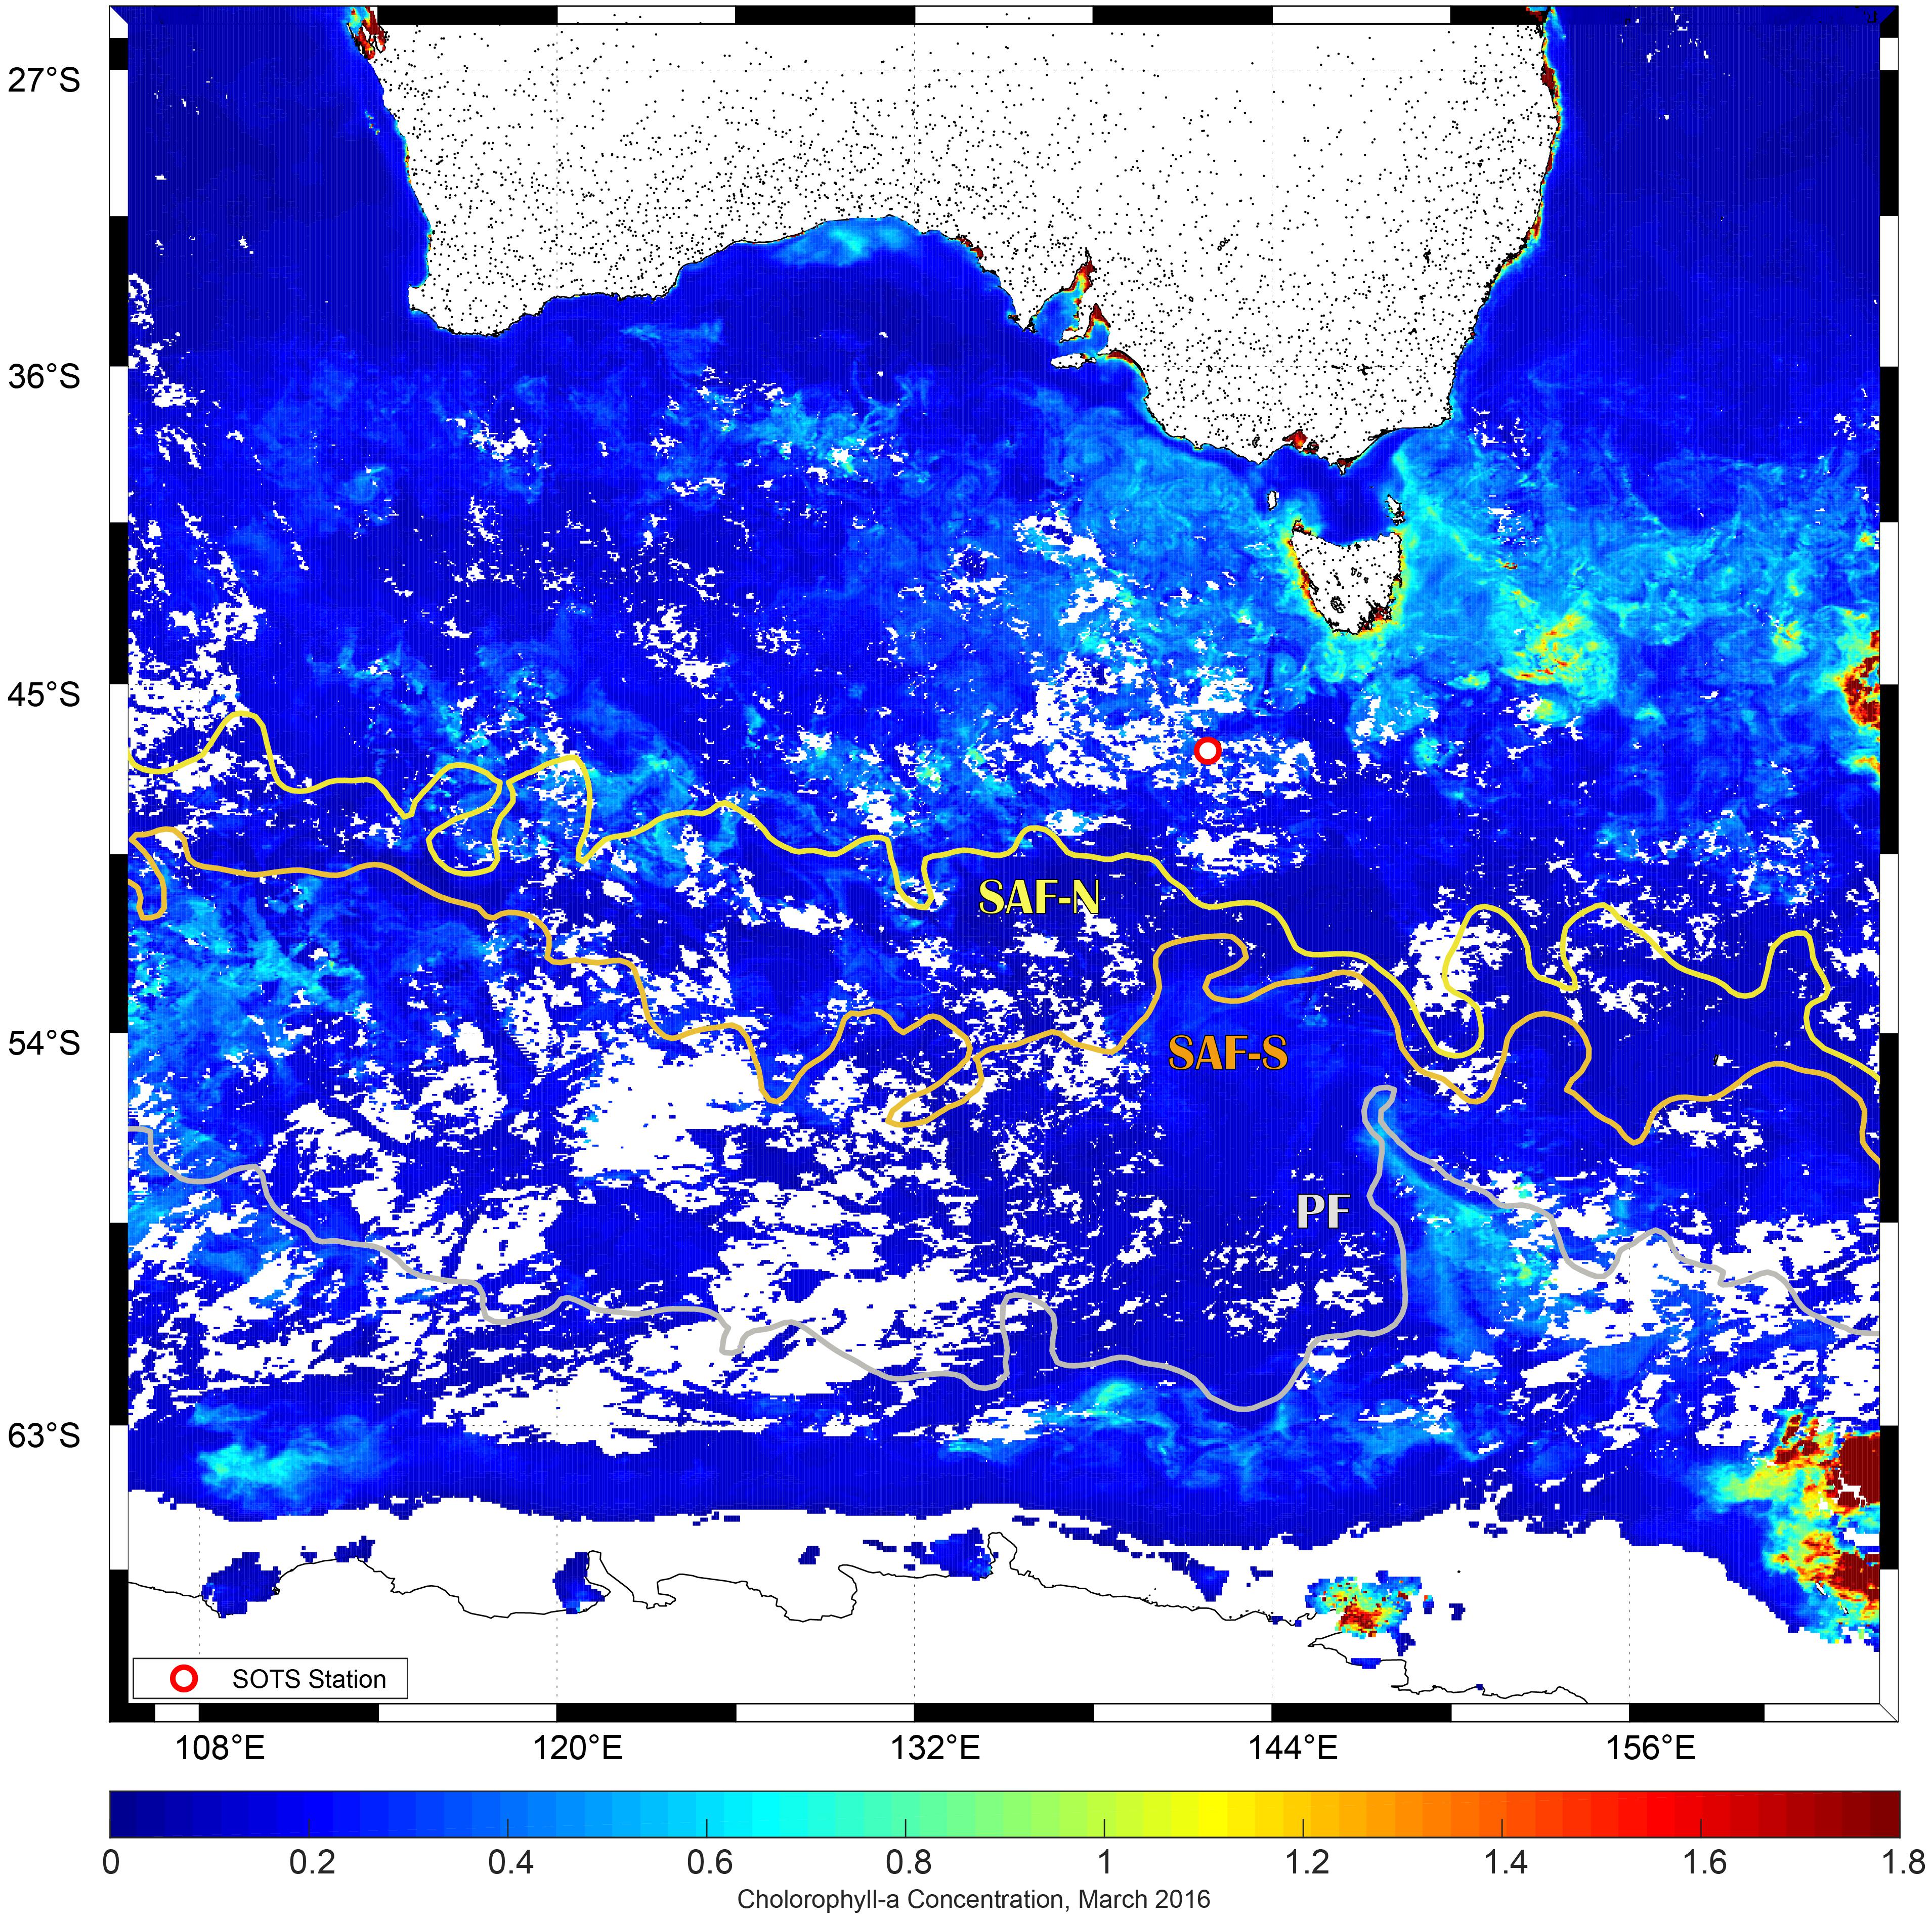
Figure 1. Study site of R/V Investigator voyage 02. Dot represents location of the SOTS site where experiments were conducted (42°S, 47°S, 51°S, and 54°S at 141°E). SOTS was visited on two occasions on 19 (Experiment 1) and March 29, 2016 (Experiment 2). SAF-N, SAF-S stands for the northern and southern branches of the subantarctic front, and PF for polar front, respectively. Sea surface height was used to characterize fronts position (AVISO Satellite Data Altimetry). Sea surface Chl a composite image for March 2016 was derived from the Moderate Resolution Imaging Spectroradiometer aboard NASA’s Aqua satellite and obtained from the ocean color data distribution site (https://oceandata.sci.gsfc.nasa.gov/MODIS-Aqua/Mapped/Monthly/4km/chlor_a/).
The study involved two separate sets of incubation experiments: Experiment 1 and 2 (Figure 2 and Supplementary Figure 1). Because there is a potentially confounding influence of Fe and C limitation on bacterial processes, the objective of Experiment 1 was to first determine whether Fe, C, or both are limiting or co-limiting factors at SOTS while the objective of Experiment 2 was to determine whether the presence of larger cells (especially pico- and nanoplankton) influences bacterial activities. In addition to the one control that consisted in unamended nutrient seawater (no addition), the following three treatments were prepared as triplicates: +Fe, +C, and +Fe+C. Iron (+Fe) was added as FeCl3 (final concentration of FeCl3 1 nM), and carbon (+C) was added as trace-metal clean glucose (final concentration of glucose 10 μmol L–1). Hence, the addition was 16.6 μmolFe molC–1 to attain the bacterial Fe quota observed in Fe-replete bacterial cultures (16.1 ± 2.3 μmolFe molC–1, Fourquez et al., 2014). For Experiment 1, incubations were performed directly on unfiltered seawater (bacteria were incubated with micro and pico-and nanoplankton communities). Additional incubations were performed on 20 μm-prefiltered seawater (<20 μm condition), and on 1 μm-prefiltered seawater (<1 μm condition) for Experiment 2. We use the term “condition” throughout the manuscript to refer to the different size fractionation treatments (summary in Table 1). The biological response of heterotrophic bacteria was monitored from sub-samples drawn from these incubation bottles, and analyzed for several parameters as described in sections below.
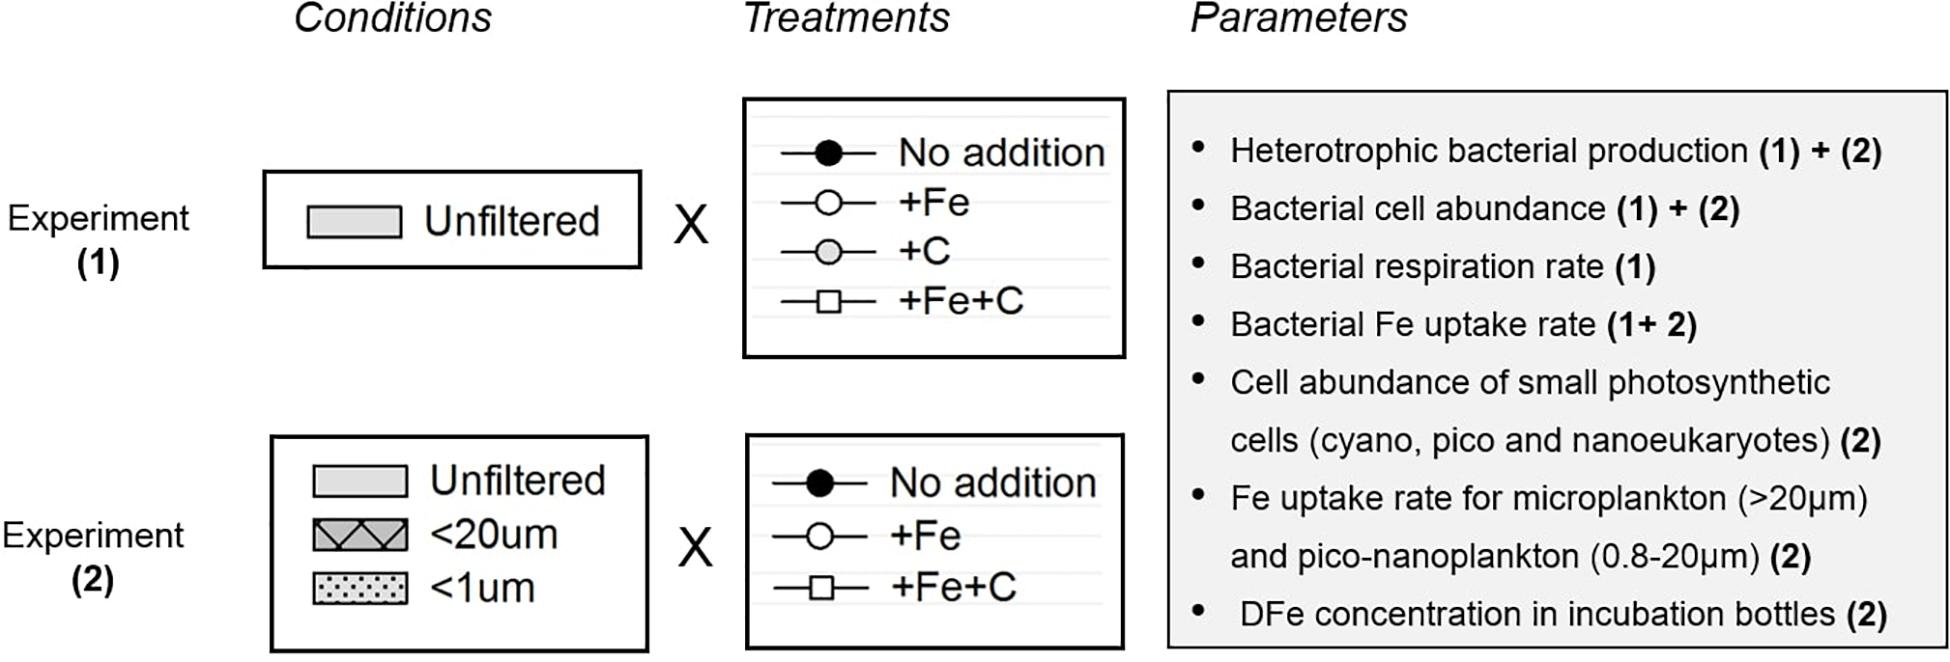
Figure 2. Overview of the setup experiments (1) and (2) respectively refer to Experiment 1 and Experiment 2 with water collected on the same site (SOTS).
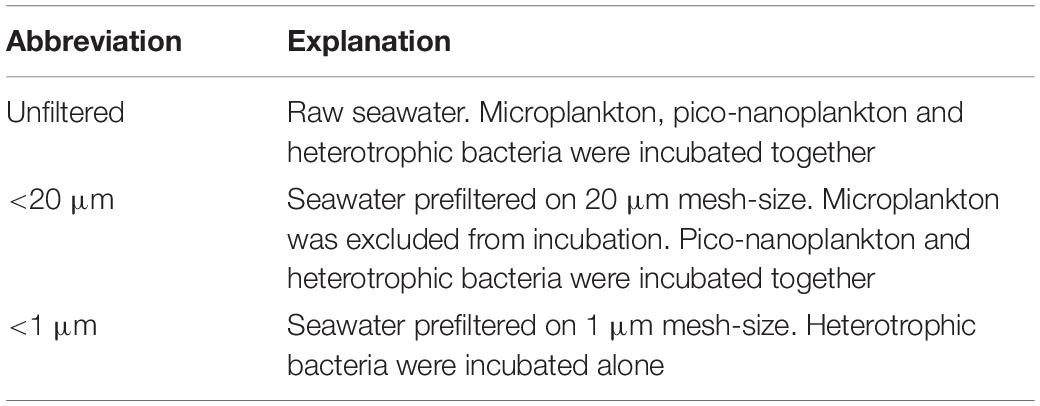
Table 1. List of abbreviations used.
Seawater was pumped from the surface ocean (∼5 m depth) using a trace metal clean towed fish sampler. Samples were collected directly into a trace metal clean laboratory (clean room, ISO5) where 300 mL of seawater was dispensed into 500 mL acid-washed polycarbonate (PC) bottles under a laminar flow hood (ISO class 5). Overall, 12 (for Experiment 1) and 54 (for Experiment 2) independent replicates were prepared in bottles capped and sealed with Parafilm. All plastic materials used were acid-washed following GEOTRACES procedures in our home laboratory (GEOTRACES cookbook Cutter et al., 2017). Briefly, PC bottles were soaked for 1 week in the alkaline detergent Decon 90, then rinsed four times with deionized water and three times with ultrapure water. They were subsequently filled with 10% hydrochloric acid (Suprapur, Merck) for 1 week. After that time, bottles were rinsed five times with highly purified water. The PC bottles were dried, and UV sterilized for 15–30 min under a laminar flow hood and then stored in triple plastic bag before being used.
To minimize risks of potential contamination of samples with metals or dissolved organic matter as an artifact of filtration in preparation for Experiment 2, seawater was filtered at very low pressure (<5 Hg). All incubations were performed at in situ temperature (13.5°C). Bottles were placed in a water bath within a controlled temperature room (13.5°C) to avoid temperature fluctuations. For Experiment 1, incubations were performed in total darkness. For Experiment 2, incubations were conducted under 12:12 light-dark condition, and we employed neutral density screens to attenuate the light intensity. Low levels of light can reduce rates of photosynthesis and the release of DOC associated and may alter Fe uptake rates in photosynthetic cells. Therefore, we opted to use low light intensity (average 4.5 μmol photon m–2 s–1, ∼1W) in Experiment 2 to (a) increase potential competition for Fe stocks between autotrophic pico- and nanoplankton cells and heterotrophic bacteria, and to (b) avoid stimulation of large phytoplankton growth and subsequent organic enrichment artifacts. For subsampling, incubation bottles were transferred to the clean container and opened under a laminar flow hood (ISO class 5). Subsamples from each triplicate for bacterial abundance and production were taken at T0, T1 (+24 h), T2 (+48 h), T3 (+72 h) and at T4 (+110 h) for Experiment 1 and at T0, T1 (+36 h), and T2 (+120 h) for Experiment 2. The time points for Experiment 2 were chosen following results collected during Experiment 1. For both experiments bacterial heterotrophic production, cell abundance, and Fe uptake were measured at several time points. We also measured heterotrophic bacterial respiration at the end of the incubation in Experiment 1 to estimate the bacterial growth efficiency in the different treatments (Figure 2). Methods for each parameter measured are detailed in sections below.
For each biological replicate, 4.5 mL subsamples were fixed with glutaraldehyde (0.5% final concentration), kept in the dark at 4°C for 20 min and then shock-frozen in liquid nitrogen. The samples were stored at −80°C until analyses by flow cytometry. Flow cytometry was performed following the protocols in Marie et al. (1997, 2005). Frozen samples were rapidly thawed in a water bath at 70°C for 3 min and aliquots taken for autotrophic and/or prokaryote cell counts. Sample aliquots were kept on ice in the dark and promptly analyzed on a Becton Dickinson FACScan flow cytometer fitted with a 488 nm laser. Ultrapure water was used as sheath fluid for all analyses. Before and after each run, samples were weighed to ± 0.0001 g to determine the volume of sample analyzed.
Samples for autotrophic cell abundance were prepared by aliquoting 998 μL of sample into a clean 5 mL polycarbonate tube, with 2 μL of PeakFlow Green 2.5 μL beads (Invitrogen) added as an internal fluorescence and size standard. Each sample was run for 5 min at a high flow rate of ∼40 μL min–1. Autotrophic cell populations were separated into regions based on their chlorophyll autofluorescence in red (FL3) versus orange (FL2) bivariate scatter plots. Synechococcus cells were determined from their high FL2 and low FL3 fluorescence. Pico- and nano-phytoplankton communities were determined from their relative cell size in side scatter (SSC) versus FL3 fluorescence bivariate scatter plots. Final cell counts in cells L–1 were calculated from event counts in the identified regions and analyzed volume.
Samples for prokaryote cell abundance were prepared by aliquoting 995 μL of sample to a clean 5 mL polycarbonate tube. Samples with high prokaryote cell counts were diluted to 1:10 with 0.2 μm filtered seawater (FSW) to remove underestimation of cell concentration from coincidence (100 μL sample in 900 μL FSW). Cells were stained for 20 min with 5 μL of SYBR Green I (Invitrogen) at a final dilution of 1:10,000. An additional 2 μL of PeakFlow Green 2.5 μL beads (Invitrogen) was added to the sample as an internal fluorescence and size standard. Each sample was run at a low flow rate of ∼12 μL min–1 for 3 min and prokaryote cell abundance was determined from bivariate scatter plots of SSC versus green (FL1) fluorescence. Final cell counts in cells L–1 were calculated from event counts in the identified regions and analyzed volume.
Bacterial production was estimated by [3H] leucine incorporation applying the centrifugation method (Martinez et al., 1996) as described in Obernosterer et al. (2008). Briefly, 1.5-mL samples were incubated with a mixture of radioactive leucine, L-[3,4,5-3H(N)] (PerkinElmer, specific activity 123.8 mCi.mol–1) and non-radioactive leucine at final concentrations of 20 nM. Duplicates plus one “killed sample” were incubated in the dark at the respective in situ temperatures for 2–3 h. Linearity of leucine incorporation over this time period was tested in parallel and at two occasions (at the beginning of Experiment 1 and 2). Incubations were terminated by the addition of trichloroacetic acid (TCA; Sigma) to a final concentration of 5%. To facilitate the precipitation of proteins, bovine serum albumin (BSA; Sigma, 100 mg L–1, final concentration) was added prior to centrifugation at 16,000 g for 10 min (Van Wambeke et al., 2002). After discarding the supernatant, 1.5 mL of 5% TCA solution was added and the samples were subsequently vigorously shaken on a vortex and centrifuged again. The supernatant was discarded again and 1.5 mL of UltimaGoldTM uLLt (PerkinElmer) was finally added. The radioactivity incorporated into bacterial cells was counted in Hidex 300SL Liquid Scintillation Counter. A factor of 1.55 kg C mol leucine–1 was used to convert the incorporation of leucine to carbon equivalents, assuming no isotope dilution (Kirchman et al., 1993). Isotopic dilution ranged from 1.0 to 1.3 as determined on three occasions using a kinetic approach.
Following the subsampling for bacterial production, Fe uptake experiments were initiated by adding 0.2 nmol L–1 at final concentration of 55Fe (as 55FeCl3, PerkinElmer specific activity 2.46 × 10³ Ci mol–1) after 36 and 120 h of incubations (independent replicates). After a 24-h incubation with 55Fe, microorganisms were filtered through a stack of nitrocellulose filters (Whatman) of 0.2 and 0.8 μm porosity, separated with 20 μm mesh filters. These filter porosities were chosen to separate phytoplankton (including Synechococcus, >0.8 μm) from heterotrophic bacteria (0.2–0.8 μm). Before running dry, the filters were rinsed with 0.2-μm filtered Ti(III) citrate EDTA solution (Tovar-Sanchez et al., 2003) for 2 min to dissolve any extracellular Fe, followed by three consecutives rinses with 5 mL of 0.2 μm filtered seawater for 1 min (Fourquez et al., 2012, 2015). The filters were placed into plastic vials and 10 mL of the scintillation cocktail Filtercount (Perkin Elmer) was finally added. Vials were agitated for 24 h before the radioactivity was counted with the Hidex 300SL scintillation counter. Radioactivity on filters was corrected for background (55Fe adsorbed into the filter and/or onto particles and not being efficiently washed out by the washing solution) using 55Fe-radiotracer medium with dead cells, also called “killed control”. Killed controls were treated the same as above but microorganisms were fixed with 1% of glutaraldehyde (left for 1 h at 4°C) prior addition of 55Fe. DFe concentration in each incubation bottle was also assessed prior incubation with 55Fe. Subsamples (∼40 mL) were measured by flow injection with online preconcentration and chemiluminescence detection (adapted from Obata et al., 1993). An internal acidified seawater standard was measured every day in order to control the stability of the analysis. The detection limit was 40 pmol kg–1 and the accuracy of the method was controlled by analyzing the SAFe S (0.110 ± 0.036 nmol kg–1 (n = 3); consensus value 0.093 ± 0.008 nmol kg–1), and SAFe D1 (0.66 ± 0.06 nmol kg–1 (n = 4); consensus value 0.67 ± 0.04 nmol kg–1) seawater standards. DFe concentration were employed to correct 55Fe uptake estimates from cold DFe present in incubation bottle at the time of the measurement. In incubation bottles, the DFe concentration changed over time also suggesting that there was remineralization taking place. To correct for this, we have multiplied the results from these experiments by the calculated proportion of 55Fe from the total DFe. Calculation details can be found in Fourquez et al. (2015).
Rates of respiration were determined from dissolved oxygen consumption in 24 h dark incubations at the end (T4, + 110 h) of Experiment 1 using Winkler titration method. In order to keep the bacteria only for the measurement, all samples were carefully pre-filtered onto 0.8 μm acid-washed PC filter. Two out of the three biological replicates belonging to each treatment (control, +Fe, +C, and +Fe+C) were used for measurement. Last replicate was employed as a T0 by adding manganese chloride followed by alkaline iodide prior incubation. To estimate the consumption in dioxygen (O2), the amount of O2 measured in bottles after 24 h of incubation was subtracted from T0 measurement. All incubation bottles were opened and gently shaken under flow laminar hood to optimize O2 level inside and homogeneity between treatments. After these steps, the samples were subsequently transferred into cleaned and acid-washed glass biological oxygen demand stoppered bottle. Incubations lasted for 24 h in the dark in a temperature-controlled incubator set at 13.5°C (in situ temperature). At the end of the incubation time, subsampling (1.8 mL) for flow cytometry analysis was taken quickly just prior to add the reactive. Dissolved oxygen concentration was measured based on the whole-bottle modified Winkler titration of Carpenter (1965) plus modifications by Culberson (1991). Bacterial respiration rates were normalized to C biomass by considering the bacterial cell abundance in each incubation bottle.
Direct carbon contents for pico-nanoplankton and microplankton were estimated from particulate organic carbon (POC) measurements. In total, 3 L of seawater sample were first filtered through 20 μm and subsequently passed through 1.2 μm (diameter 25 mm) Sterlitech silver membrane filters, and dried at 60°C. The samples were acidified, dried and analyzed by high-temperature combustion (1000°C) to determine POC. The analysis for total nitrogen, carbon, and hydrogen was determined using a Thermo Finnigan EA 1112 Series Flash Elemental Analyzer.
In parallel, the carbon content was also indirectly estimated using conversion factors. Photosynthetic pico-nanoplankton cell abundance was converted to carbon biomass using constant cell-to-carbon conversion factors based on the literature. Conversion factors used were, respectively 255 and 2590 fgC cell–1 for the cyanobacterium Synechococcus and for picoeukaryotes (Buitenhuis et al., 2012), and 183 fgC cell–1 for nanoeukaryotes (Caron et al., 1994, 2017). We assume the cyanobacterium Synechococcus represented the majority of the resident cyanobacteria. For heterotrophic bacteria, the carbon content was estimated using 12.4 fgC cell–1 as reported by Fukuda et al. (1998).
All statistical comparisons were performed using one-way analysis of variance (ANOVA) and a post hoc Tukey test. Differences were considered statistically significant at p < 0.05. To evaluate the differences between treatments, statistics were individually performed between nutrient unamended (control) and amended treatments (+Fe, +C, and +Fe+C). We also evaluated statistical differences between conditions by comparing unfiltered (control) to other conditions (<20 μm or <1 μm).
As is typical for HNLC regions, at SOTS site the C biomass was dominated by small cells (<20 μm) which represented 1.51 μmol L–1 of the 1.90 μmol L–1 total POC in surface waters. The concentration of DFe was 0.081 ± 0.02 nM at 5 m depth. Concentration of dissolved organic carbon (DOC) were not measured during the cruise. Nevertheless, the Southern Ocean surface waters exhibit a DOC concentration range of ∼40–50 μmolC L–1 (Hansell et al., 2009). If we consider the upper range of 50 μmolC L–1 to be representative of what can be found at SOTS, the resulting DFe:DOC molar ratio was ∼1.62 μmol mol–1.
In Experiment 1, we investigated the responses of bacteria to Fe, C and concomitant Fe and C additions. Sole additions of Fe did not result in any significant enhancement of bulk nor cell-specific BP (Figure 3). In accordance with these results, bacterial abundance in the Fe-amended treatment did not differ from the control (Figure 3A). However, single (+C) and combined (+Fe+C) additions of C significantly stimulated bulk and cell-specific BP. We note a pronounced response in cell-specific BP to single (+C) and combined (+Fe+C) additions of carbon over the time of the experiment (1.3–56-fold and 1.6–26-fold higher than control in +C and +Fe+C, respectively, Figure 3B). The results from treatments +Fe+C and +C were not statistically different from each other apart from T3 (+ 72 h, p = 0.012). The bacterial cell abundance also increased, however, the magnitude of the stimulation was less than that measured for the BP. Cell abundance is a complex function between growth and mortality rates; this decoupling is therefore not surprising. At the end of the experiment, the enhancement of these parameters was still detectable in the +C and +Fe+C treatments but a decrease in cell-specific BP was also observed after 72 h of incubation.
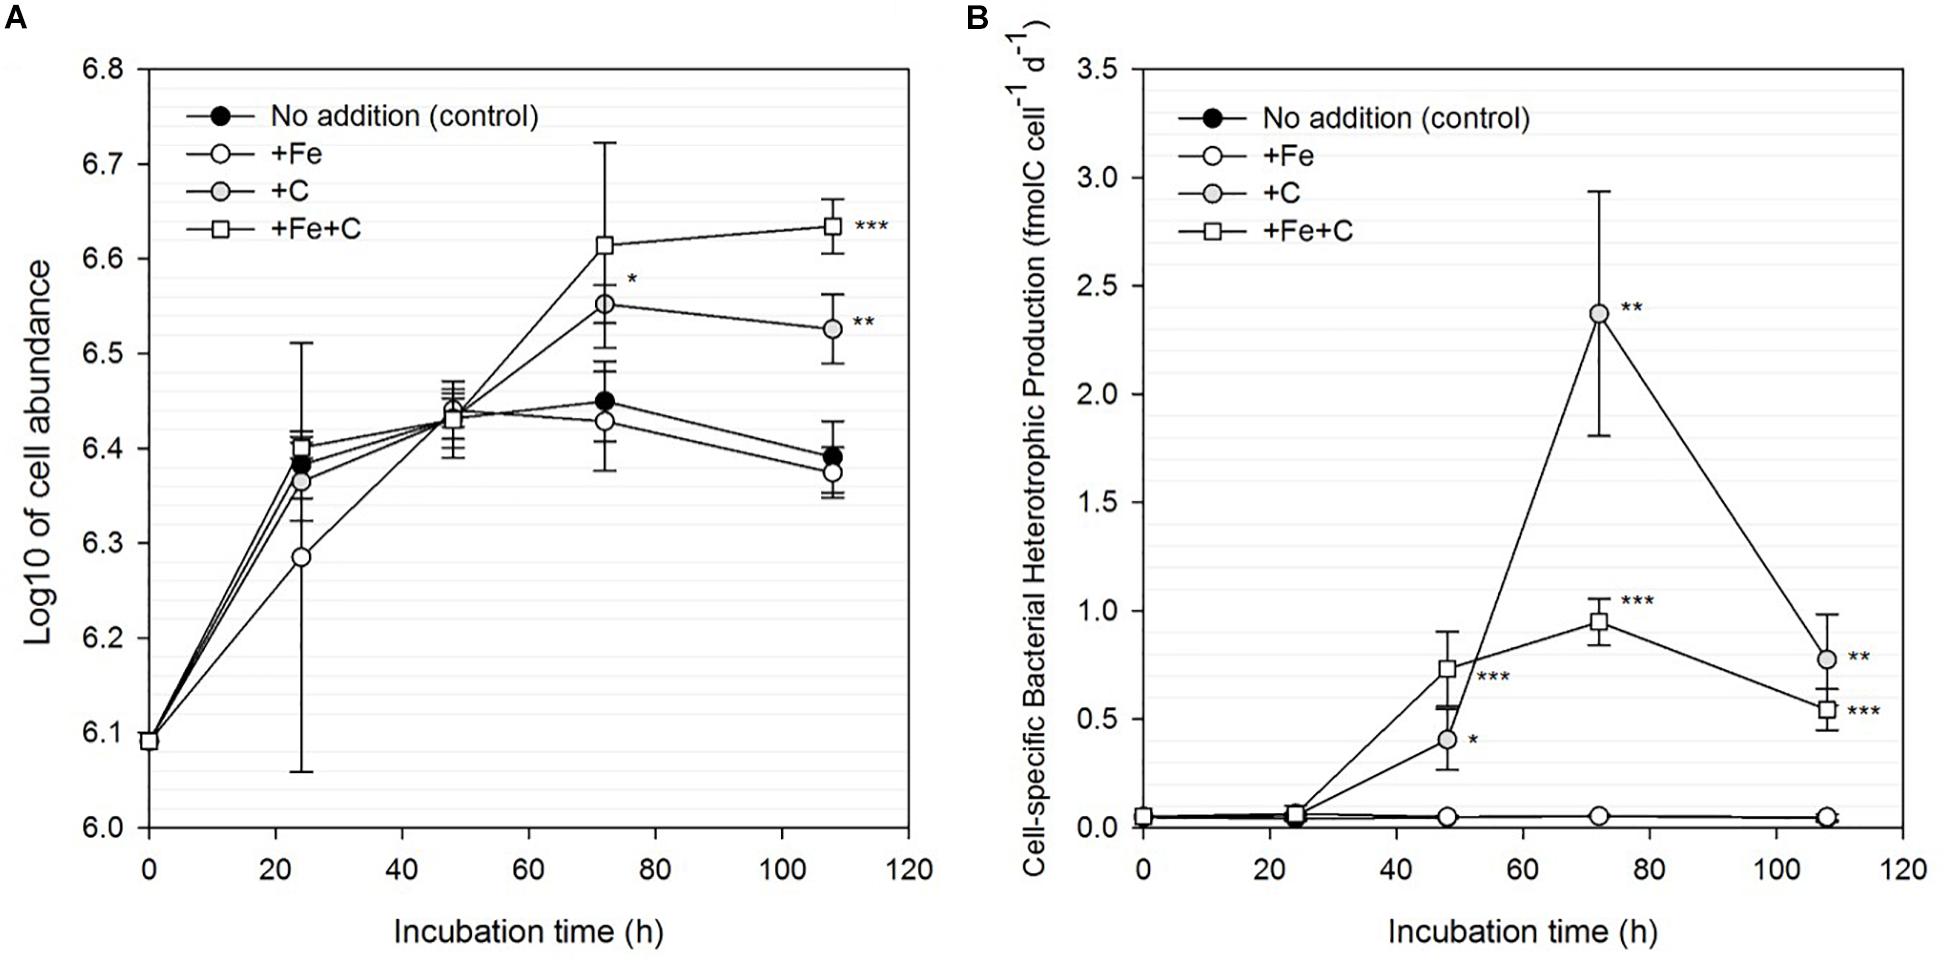
Figure 3. Changes in bacterial cell abundance (A) and cell-specific bacterial heterotrophic production (B) for unamended (control) and amended treatments (+Fe, +C, and both +Fe+C) over time for Experiment 1. Treatments with an asterisk are significantly different from the control (one-way analysis of variance (ANOVA) and post hoc Tukey test; ∗p < 0.05, ∗∗p < 0.01, ∗∗∗p < 0.001).
Bacterial respiration (BR) rates were measured at the end of the Experiment 1. BR varied from 0.39 ± 0.15 and 1.63 ± 0.34 fmolO2 cell–1 d–1 (standard error, SE; n = 2). It was intriguing to note that the highest BR rate was measured for +Fe addition alone, which shows also the lowest (3.2%) bacterial growth efficiency (BGE) due to low BP rate (Table 2). The highest BGE estimation was measured for the +Fe+C treatment with 57% (Table 2).
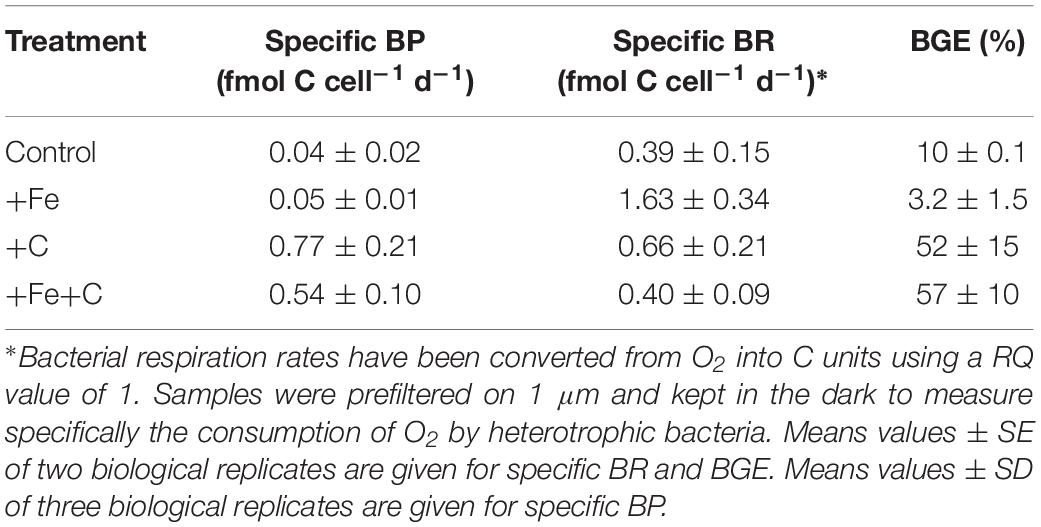
Table 2. Specific bacterial production, cell specific bacterial respiration, and bacterial growth efficiency at the end of the incubation (Experiment 1).
To make the section “Results” concise and easy to follow, all results presented in figures and text description correspond to the first time point for Experiment 2 (+ 36 h of incubation). Similar conclusions can be formulated from the second time point (+ 120 h of incubation) and data are accessible in the Supplementary Materials.
Cell-specific BP rates across all treatments and conditions are shown in Figure 4A. In the control treatment (no nutrient addition), the cell-specific BP ranged from 4 to 9 (×100 fmolC cell–1 d–1) and no significant difference was found between unfiltered and <20 μm nor <1 μm conditions, which is evidence that the presence of phytoplankton did not affect cell-specific BP. However, in the nutrient amended treatments two differences were significant: a decrease in BP in the +Fe treatment and an increase in the +Fe+C treatment, respectively. In the +Fe treatment, the cell-specific BP was highest when the whole community was present (unfiltered) and the lowest when bacteria were incubated solely with pico- and nanoplankton (<20 μm). The difference between these two conditions was significant (p = 0.04, Figure 4A). Cell-specific BP in +Fe+C treatment were higher than all other treatments, ranged from 19 to 48 (×100 fmolC cell–1 d–1) and was the highest when bacteria were incubated solo. Cell-specific BP was about two times higher in <1 μm compared to unfiltered condition, and this difference was highly significant (p = 0.005, Figure 4A).
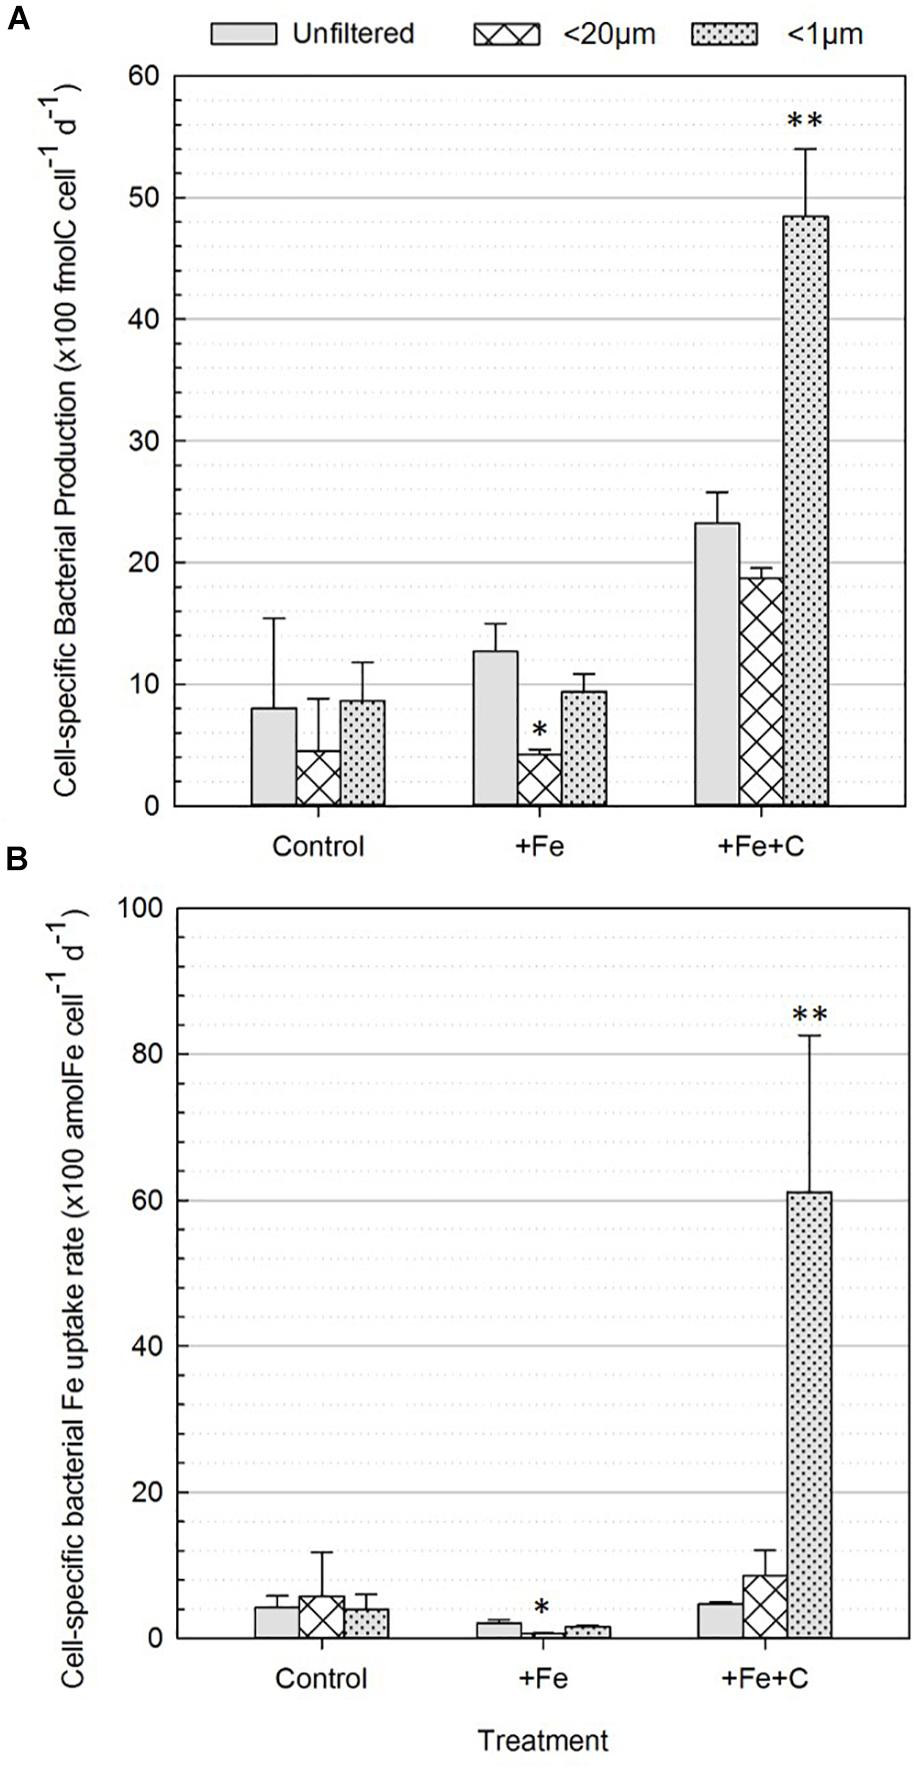
Figure 4. Cell-specific heterotrophic production (A) and Fe uptake (B) by bacteria (0.2–0.8 μm fraction-size) for the three different treatments (control, +Fe, +Fe+C) and conditions (unfiltered, <20 μm, <1 μm). Values represent average number of three biological replicates after 36 h incubation (Experiment 2). Error bars represent the standard deviation of the three biological replicates. Treatments with an asterisk are significantly different from the unfiltered condition (one-way analysis of variance (ANOVA) and post hoc Tukey test; ∗p < 0.05, ∗∗p < 0.01).
Significant differences were also found when comparing <20 μm and <1 μm conditions in +Fe and +Fe+C treatments. Indeed, the <1 μm condition showed significantly higher rates compared to the <20 μm condition with, respectively 9 ± 1 versus 4 ± 0.4 and 48 ± 6 versus 19 ± 1 (×100 fmolC cell–1 d–1) for +Fe and +Fe+C treatment. Overall, cell-specific BP was negatively affected by the presence of pico- and nanoplankton cells in the +Fe and +Fe+C treatments while no effect was found in the control (no addition) treatment.
To investigate whether heterotrophic bacteria compete for Fe with other members of the microbial community, the bacterial Fe uptake rates were determined for incubations where microplankton (<20 μm condition) or both micro- and pico- and nanoplankton (<1 μm condition) were excluded from incubation. Results were compared to the treatment where all the members of the microbial community were present (unfiltered condition). During Experiment 2, we also compared the contribution of two size-fractions to Fe uptake. Figure 4B shows results for bacteria on a cell-specific basis, and Figure 5 combines data for phytoplankton (<0.8 μm) and bacteria (0.2–0.8 μm) on the volumetric basis for better comparison. Data used to create Figure 5 can also be found in detail in Table 3.
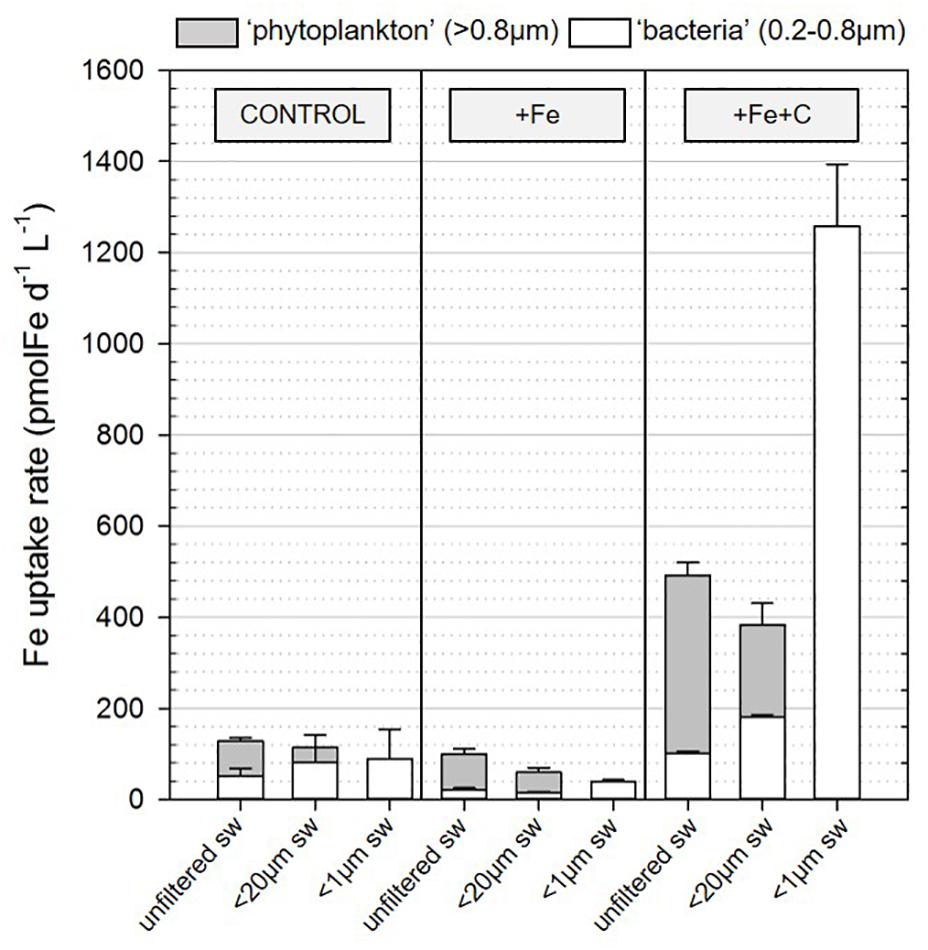
Figure 5. Contribution of the two size-fraction (>0.8 μm and 0.2–0.8 μm) to Fe uptake in incubation for the three conditions (unfiltered, and prefiltered on <20 μm or <1 μm seawater) and for the three treatments [control (no addition), +Fe, +Fe+C]. Bars and errors bars represent, respectively the average and the standard deviation of biological triplicates for the Fe uptake measured following 36 h (T1, Experiment 2) of incubation in conditions described in section “Materials and Methods.” sw, seawater.
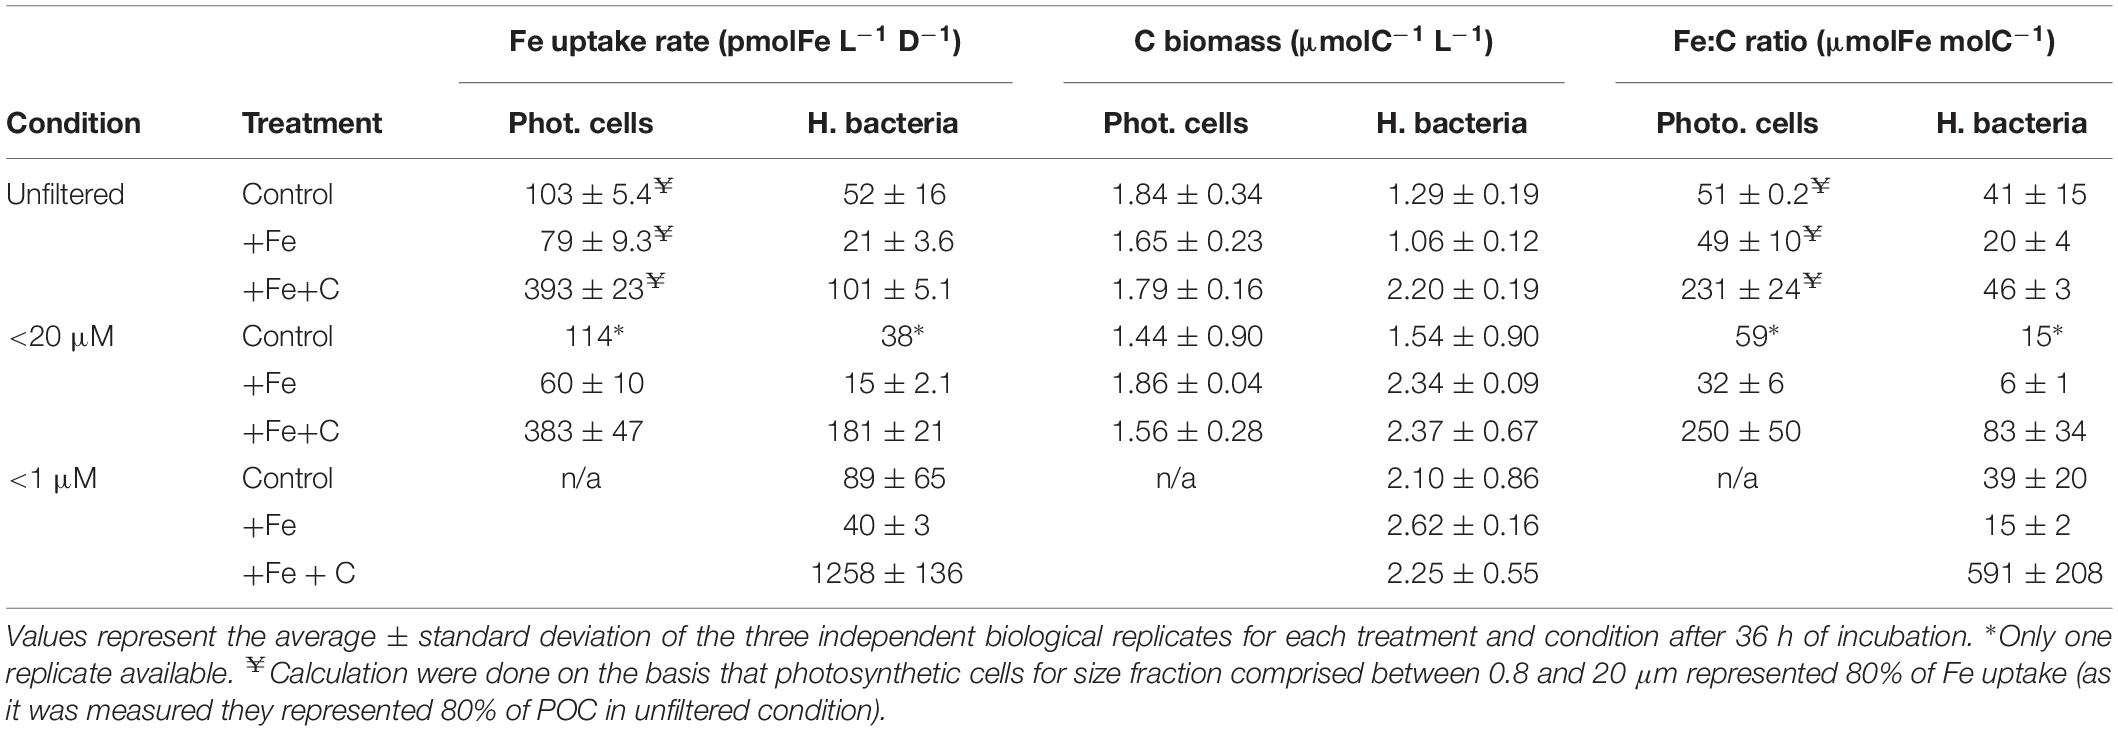
Table 3. Fe uptake rates, C biomass, and C-normalized Fe uptake rates (Fe:C ratio) of photosynthetic cells (cyanobacteria plus pico- and nanoeukaryotes) and heterotrophic bacteria.
The response of bacteria to size-fractionation (condition) and nutrients amendments (treatment) were overall similar for cell-specific Fe uptake to those presented for bacterial production (Figure 4). While no significant differences were found for the control treatment, the uptake of Fe by bacteria was, respectively lowered and enhanced in +Fe and +Fe+C treatments. In +Fe treatment, Fe uptake by bacteria is three times lower in presence of pico-nanoplankton (<20 μm condition) and decreased from 2.1 ± 0.5 to 0.6 ± 0.1 (×100 amolFe cell–1 d–1) compared to the unfiltered condition. This difference was significant (p = 0.006). Across all datasets, the Fe uptake by bacteria was the highest for the +Fe+C treatment and the <1 μm condition. This result makes precise the sense in which the availability of C together with the removal of potential competitors had the greatest effect on the uptake of Fe by bacteria. Interestingly, the concomitant addition of Fe and C did not enhance the bacterial Fe uptake for the other conditions (unfiltered and <20 μm). Values were, respectively 4.7 ± 0.3 and 8.5 ± 3.5 (×100 amolFe cell–1 d–1) for unfiltered and <20 μm conditions while it reached up to 61 ± 21 (×100 amolFe cell–1 d–1) for the <1μm condition. Considering all data together, the size fractionation used in the incubation (i.e., presence or absence of phytoplankton) had a greater effect than addition of growth-limiting nutrients.
Iron uptake by cells larger than 0.8 μm is presented as the Fe uptake by phytoplankton in Figure 5 and specific Fe uptake by pico-nanoplankton (0.8–20 μm) is given in Table 3. If we consider the unfiltered condition with no nutrient addition to be the closest representation of the natural system, phytoplankton contributed to 66 ± 6% of the total Fe uptake at the SOTS site. In terms of percentage contribution, phytoplankton Fe uptake increased to more than 80% when Fe or Fe plus C was added (82 ± 1% and 83 ± 1% for +Fe and +Fe+C treatment, respectively).
In the +Fe treatment, the Fe uptake by phytoplankton was slightly lower in <20 μm condition compared to unfiltered condition which is explained by the removal of about 20% of the phytoplankton initial biomass. However, the concomitant addition of Fe and C clearly led to the increase of Fe uptake by phytoplankton. As the Fe uptake is higher by 22% in unfiltered conditions compared to <20 μm, which is again explained by the removal of larger cells, we consider that the microphytoplankton also benefited from the +Fe+C treatment in some ways (e.g., Fe regenerated by bacteria).
We examined the carbon (C) biomass partitioning of the pico- and nanoplankton communities across treatments and size fractions, and in relation to the heterotrophic bacteria. First, we compare estimates of C biomass of small photosynthetic cells based on conversion factors and flow cytometry numbers with direct measurements of POC as described before. We found 1.49 ± 0.05 μmolC L–1 (estimate) versus 1.51 μmolC L–1 (measure). Given the comparable results we are confident in using conversion factors to investigate variations in carbon biomass in our incubation bottles.
Among the pico-and nanoplankton community, picoeukaryotic cells were the most abundant in surface waters at SOTS and represented 71 ± 0.2% (n = 9) of C biomass while cyanobacteria made up 26 ± 0.3% (n = 9) and photosynthetic nanoeukaryotes 2 ± 0.1% (n = 9). After 36 h of incubation, no notable differences in these contributions were found when comparing size fractions and treatments. In the case of total carbon biomass, heterotrophic bacteria were dominant (averaging 58%) at the start of the experiment, with values ranging from 1.85 to 2.33 μmol L–1.
In this section, we only consider values measured in <20 μm condition as we did not directly measure the carbon content of larger cells (microplankton) so that we cannot evaluate accurately their contribution. Heterotrophic bacteria represented about 52% (control), 56% (+Fe), and 59% (+Fe+C) of the total C biomass (Table 3). However, their contribution to the total uptake of Fe did not reflect this dominance (Figure 5). For the unfiltered condition, heterotrophic bacteria were only responsible for 25, 20, and 32% of the total Fe uptake in control, +Fe and +Fe+C treatments, respectively.
We normalized Fe uptake rate to carbon biomass and the resulting Fe:C ratio is presented in Table 3. Comparison of these Fe:C ratios for bacteria among the different treatment and condition indicate that heterotrophic bacteria had a higher Fe content in the +Fe+C treatment. However, this Fe:C ratio also varied from 46 to 591 μmolFe molC–1 (+Fe+C treatment, Table 3) which shows that heterotrophic bacteria can assimilate a substantial amount of Fe when phytoplankton is removed from the experiment. For instance, the Fe:C ratio of heterotrophic bacteria in the <20 μm condition was nearly twofold higher than in the unfiltered condition, and it was close to 13-fold higher in the <1 μm condition. These high Fe:C ratios also indicate that heterotrophic bacteria have rapidly upregulated their Fe acquisition machinery relative to C to acquire more dissolved Fe or that their uptake systems were already activated.
The Fe:C ratios were also estimated for photosynthetic pico- and nanoplankton cells (including cyanobacteria). As for heterotrophic bacteria, we observed a pronounced increase of Fe:C ratio in the +Fe+C treatment, but no notable difference between unfiltered and <20 μm condition (Table 3). These estimates ranged from 32 to 59 μmolFe molC–1 for both control and +Fe treatments considered versus a range of 231–250 μmolFe molC–1 in +Fe+C treatment.
Overall, our calculation of Fe:C ratios show that pico- and nanoplankton constitute a larger fraction of biogenic Fe compared to heterotrophic bacteria in all incubations. However, the highest Fe:C ratio measured in this study was when bacteria were incubated alone (591 ± 208, n = 3; +Fe+C treatment) and it was more than twofold higher than the maximum we calculated for pico-and nanoplankton (250 ± 50, n = 3; +Fe+C treatment for <20 μm condition).
In environmental science, the concept of bioavailability for one or several resources is generally associated with chemical features, in particular in the case of Fe. This micronutrient is present in multiple chemical forms and redox states (Morel and Price, 2003). However, we show here that biological interactions matter as well. To discuss the results of this study, we first comment on the concept of co-limitation. Next, we discuss the nature of the interspecific interactions that most likely explain our results. Finally, we close this section on implications for future perspectives of research.
One particular feature of the Southern Ocean is that both bioavailable Fe and organic carbon can be at growth-limiting concentrations for heterotrophic bacteria in surface waters (Church et al., 2000; Obernosterer et al., 2015). At first sight, our results suggest that heterotrophic bacteria were primarily limited by organic carbon at SOTS. Iron could have a role, however, in affecting BP and bacterial metabolism when the supply of organic carbon is adequate and Fe concentrations are low. Indeed, while these results lead us to the conclusion that heterotrophic bacteria were firstly C-limited, the argument for Fe limitation of heterotrophic bacteria is not so clear. A simple comparison between in situ molar DFe:DOC ratio (2.61 μmol mol–1) and Fe:C ratios of Fe-limited cultures (e.g., 0.43 ± 0.1 and 7.52 ± 1.65 μmolFe molC–1 for oceanic strains in Fourquez et al., 2014 and Tortell et al., 1996, respectively) would suggest that both nutrients may become limiting. In the present study, Fe alone had no effect on rates of BP or cell abundance. But Fe did affect these variables when added together with glucose.
Consistent with the hypothesis that bacteria may have been co-limited by Fe and C, we observed that cell-specific BP was positively correlated (r = 0.98, n = 6, p = 0.000373, Pearson correlation) with bacterial Fe uptake in the +Fe+C treatment. In contrast, there was no significant correlation in the control (r = −0.33, n = 6, p = 0.58), and in the +Fe treatment (r = 0.29, n = 6, p = 0.56). Such a high correlation in studies using natural communities is uncommon. An explanation for our results is that bacterial growth became Fe-limited, but only after C-limitation was alleviated by the addition of glucose. This can be explained by the increase in the C demand induced by cellular remodeling to support growth and maintenance under Fe stress conditions (Kirchman et al., 2000; Fourquez et al., 2014).
There is growing evidence that the expression of alternative pathways is a widespread strategy for heterotrophic bacteria in low Fe environments (Fourquez et al., 2014; Beier et al., 2015; Koedooder et al., 2018; Debeljak et al., 2019). A comparative proteomics approach revealed that Fe limitation leads cells to utilize C through the glyoxylate cycle (Fourquez et al., 2014). This alternative pathway not only bypasses two important Fe-containing enzymes in the Krebs’s cycle, but also the two steps where carbon is lost as CO2. Redirection of glucose into the Entner-Doudoroff pathway also allows Fe-limited cells to supply the Krebs’s cycle with substrates while bypassing the first step of glycolysis which is ATP-consuming (Fourquez et al., 2014). Other biomass recycling processes such as amino and organic acid catabolism contribute as well to the regulation of energy production (Fourquez et al., 2014). These underlying mechanisms may explain why BP was stimulated by C addition, strongly stimulated by concomitant Fe and C additions, but not stimulated by the addition of Fe alone in the present study. It also indicates that Fe–C co-limitation for heterotrophic bacterial growth is a predominant feature in the Southern Ocean, but that it can be masked by conventional experimental approaches.
In our study we explicitly examined the bacterial Fe uptake together with the BP. As we observed there is a good agreement in the trends for each response variable, bacterial growth and Fe uptake rates are likely to be related. However, the link between growth and nutrient uptake is not straightforward in natural communities, and variation in maximum growth rate and minimum cell quota can greatly complicate this relationship. Here we propose a threshold value to reconcile these two variables. Based on the correlation between cell-specific Fe uptake and BP, we derived a minimum Fe:C quota for heterotrophic bacteria of 37 μmolFe molC–1 that we propose as a threshold limit value to define Fe or C limitation (Supplementary Figure 2). Based on this assumption, Fe is the primary limiting element for a cellular quota that is below 37 μmolFe molC–1, and C is the primary limiting element for a quota above to this value. To understand the boundaries of implication for this threshold limit, it is important to consider how heterotrophic bacteria utilize Fe and organic substrates to gain energy. However, the vastness of biogeochemical gradients – both spatially and temporally – that govern the composition of microbial communities, and the plethora of metabolic strategies among taxa (Hopkinson and Barbeau, 2012; Hogle et al., 2016; Debeljak et al., 2019) require similar studies in other ocean regions in order to investigate the spectrum of heterotrophic bacterial Fe:C quotas.
When DOC is no longer a limiting resource, the competition for Fe between autotrophic pico- and nanoplankton and heterotrophic bacteria negatively affect the latter (Fourquez et al., 2015, this study). There were also intriguing results in the outcomes of the experiment regarding phytoplankton. In the present study, the uptake of Fe by phytoplankton was similar for the control and the +Fe treatment but increased by nearly five times in the +Fe+C treatment. We have two explanations for this intriguing finding.
Iron availability influences the growth and abundance of auto- and heterotrophic microorganisms, and heterotrophic bacteria can modify its speciation by the synthesis of organic ligands (Rue and Bruland, 1997; Gerringa et al., 2008). In this context, heterotrophic bacteria could act either as competitors with phytoplankton (Kirchman, 1994; Thingstad, 2000), or on the contrary, facilitate their assimilation of Fe in maintaining Fe solubility within the ecological niche they share (Amin et al., 2009; Hopkinson and Morel, 2009).
The high rates of BP in +Fe+C treatment could in part be due to remineralization of Fe during the incubation. The regenerated Fe may become available for phytoplankton. Since the DFe concentration was measured in the incubation bottles at the beginning, after + 36h and at the end of the incubation (120 h, Supplementary Figure 3), we were able to directly compare these values with total Fe uptake by microorganisms. The DFe concentrations decreased over time during the incubations (Supplementary Figure 3). We used a simple approach to (1) verify that remineralization occurred during the incubation and (2) to provide an estimate of the Fe regeneration rate. The regeneration rate of Fe was estimated by subtracting the amount of Fe consumed by the entire microbial community (phytoplankton and bacteria) from the initial Fe concentration as follows:
Where DFe initial is the concentration of DFe at the start of the experiment, Total Fe uptake is the amount of Fe consumed by phytoplankton and bacteria during the incubation, and DFe measured is the DFe concentration at the end of the incubation.
If we consider the amount of “missing” DFe as the regenerated Fe, we obtain rates of Fe regeneration of 0.48 to 0.92 nmolFe L–1 d–1 (respectively unfiltered and <1 μm condition, Supplementary Table 1).
Iron regeneration within the microbial loop (also termed the “ferrous wheel”; Kirchman, 1996) represents a key term in the Fe budget (Strzepek et al., 2005; Boyd and Ellwood, 2010). For instance, in the SAZ (FeCycle voyage, see Strzepek et al., 2005), it was found that between 30 and 100% of the microbial Fe demand could be met by Fe regeneration mediated by grazers (Boyd et al., 2005). In the naturally Fe fertilized waters off Kerguelen Island, Fe regeneration accounted for roughly 50% of the Fe demand (Sarthou et al., 2008). Heterotrophic bacteria and viruses contribute as much as grazers to Fe recycling (Poorvin et al., 2004; Obernosterer et al., 2008). Many of the metabolites originating from microorganisms can possess Fe-binding properties that can exert strong control on Fe speciation (Poorvin et al., 2004; Dalbec and Twining, 2009; Boyd et al., 2010). Unlike larger cells of phytoplankton (e.g., diatoms), pico- and nanoplankton are equally adept to heterotrophic bacteria at accessing either new or regenerated Fe (Boyd et al., 2012). Ultimately, niche differentiation of bacteria and phytoplankton related to Fe-speciation might act as a selection process (Hopkinson and Barbeau, 2012; Hogle et al., 2016; Debeljak et al., 2019).
Over the course of a phytoplankton bloom there is a transition from the utilization of new Fe (i.e., winter reserve Fe stocks) to regenerated Fe (Boyd et al., 2012) which maintains primary productivity. During this transition, rapidly growing heterotrophic bacteria may quickly shift to Fe limitation if phytoplankton-derived organic carbon is available, resulting in their enhanced ability to compete for Fe. As the bloom status moves toward senescence and cells exude DOC, competition between pico- and nanoplankton and heterotrophic bacteria may result in different amounts of Fe regenerated. Significantly, In the present study we calculated a Fe regeneration rate nearly twofold larger for the <1 μm (0.92 nmolFe L–1 d–1) versus <20 μm (0.53 nmolFe L–1 d–1) or in unfiltered seawater (0.48 nmolFe L–1 d–1). It is reported that organic Fe complexes are available to few phytoplankton species (Kranzler et al., 2011; Shaked and Lis, 2012; Lis et al., 2015). This could suggest that the bloom duration is primarily set by DOC availability and competition for DFe between heterotrophic bacteria and phytoplankton.
Many studies make operational distinctions based on size-fractionated samples. In the study of Strzepek et al., 2005 (FeCycle), flow cytometric analyses revealed that both picophytoplankton and eukaryotic phytoplankton were > 1 μm, and heterotrophic bacteria were submicron in size. We used the same size cutoffs of 1 μm to separate phytoplankton and heterotrophic bacteria in this study. It remains, however, difficult to draw clear distinctions between the size-fractionation and assigning microorganisms to eukaryotes or prokaryotes. At SOTS, most pico- and nanoplankton (70%) were cyanobacteria (most likely Synechococcus). Synechococcus is one of the most prominent genera of picoplanktonic marine cyanobacteria (Buitenhuis et al., 2012) that have particularly high Fe demands relative to heterotrophic bacteria and eukaryotic phytoplankton (Raven, 1990; Morrissey and Bowler, 2012; Lis et al., 2015). There is growing evidence of the ability of the genera of Synechococcus to assimilate organic nutrients (Yelton et al., 2016), and more broadly there are reports that suggest some of the photosynthetic picoeukaryotes are mixotrophs (Farnelid et al., 2016). Cyanobacteria may be responsible for an important part of the total Fe taken up by the phytoplankton fraction (>0.8 μm), and that due to their ability to take up organic compounds for their metabolism they may also have benefited from the +Fe+C treatment, as did their heterotrophic counterparts. In our experiment, cyanobacteria, but none of the pico- and nanoeukaryotes had significantly increased in cell abundance in the +Fe+C treatment (Supplementary Figure 4). This incubation was performed under very low light intensities which suggests a complementary mechanism such as mixotrophy. This raises the question of whether a mixotrophic capacity can become an advantageous for these microorganisms, and if they could become also competitors for C availability if this is proven.
Interactions between autotrophic and heterotrophic microbes could affect the dynamics of nutrient-limited phytoplankton blooms. This hypothesis originates from an investigation of what was initially perceived as an isolated event in the vicinity of the Kerguelen plateau (Fourquez et al., 2015). As we reached similar conclusions in the present study, these joint findings raise the issue of whether such interactions are widespread across the Southern Ocean?
One stand-out result of our study is the amount of Fe taken up by heterotrophic bacteria in the absence of competition. Our reported bacterial Fe uptake rates are well beyond the range of those previously reported for Southern Ocean microbes. For example, in comparison to the Fe uptake by the entire microbial community, the rate of heterotrophic bacteria alone is by 12-fold higher than that measured during FeCycle (HNLC waters southeast of New Zealand) and more than 100-fold higher than that measured above the Kerguelen plateau during summer (KEOPS2; Table 4). The observation of the present study underlines the potential of heterotrophic bacteria to control the decline of the bloom in the absence of competition with pico-and nanoplankton.
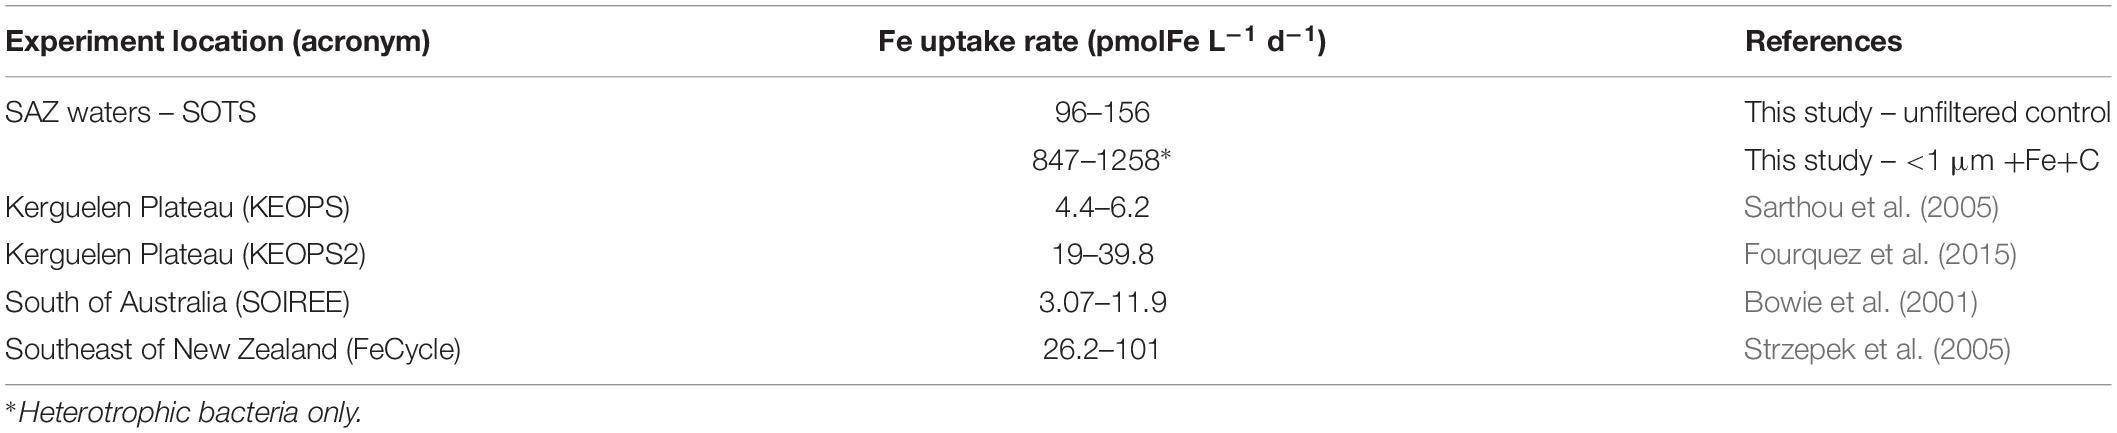
Table 4. Total intracellular Fe uptake rates in this study compared to published studies of natural and Fe-fertilized surface waters in the Southern Ocean.
It is only recently that the potential influence of the composition of phytoplankton community and its interactions with heterotrophic microbes has been taken into consideration (Lima-Mendez et al., 2015; Bunse et al., 2016; Farnelid et al., 2016; Zhou et al., 2018; Liu et al., 2019). For instance, Liu et al. (2019) showed a pronounced association between assemblages of diatoms and heterotrophic microbes at the onset of spring phytoplankton blooms occurring in the region off Kerguelen Island. The quality and quantity of DOC derived from phytoplankton exudates (Landa et al., 2015) and resource competition for Fe (Fourquez et al., 2015) are the two explanations put forward to explain how diatom assemblages shape the habitat type for their heterotrophic counterparts (Liu et al., 2019).
Uncertainties remain on the effects of climate change on the composition of phytoplankton assemblage; but there is compelling evidence that all regions of the Southern Ocean will encounter changes in phytoplankton community composition (Hays et al., 2005; Deppeler and Davidson, 2017). Models project that waters of the Southern Ocean will become warmer, and that rising temperatures will cause rates of grazing to increase more rapidly than rates of phytoplankton growth (Sarmento et al., 2010; Evans et al., 2011; Caron and Hutchins, 2012; Behrenfeld, 2014; Cael and Follows, 2016). Increasing temperature is also expected to increase bacterial respiration rates (Vázquez-Domínguez et al., 2007). Thus, phytoplankton standing stocks are likely to decline and the proportion of primary production respired in near-surface waters by heterotrophic bacteria will increase (Deppeler and Davidson, 2017; Cavan and Boyd, 2018; Cavan et al., 2019). The study of Cavan and Boyd (2018), which have predicted an increase in POC-normalized respiration, estimates that the biological pump efficiency (POC export scaled to primary production) would decrease by 17 ± 7% (SE) by 2100 for the subantarctic site SOTS. Such reports of increased rates in bacterial respiration are enzymatic reactions as the temperature increases, but are also supported by the enhanced release DOC-derived from phytoplankton at higher temperatures to support heterotrophic bacteria (Hutchins et al., 2019).
For microbial ecologists, the existence of interactions between primary producers and bacteria that shape the activity and the diversity of both partners is well recognized (Amin et al., 2015), but the mechanisms of such interactions remain mostly unknown. The term “interactive co-limitation” was first proposed by Bertrand et al. (2015) to describe scenarios in which at least two limiting “nutrients cycle are affected by one another through interactions among different microbial functional groups” (Bertrand et al., 2015). The findings of our study appear to be an example of interactive colimitation. Moreover, they expand on the emerging recognition that interaction between microorganisms is an ecological trait to be considered in the study of Fe and C biogeochemistry. As Fe sources – including the inputs, amounts and the nature of Fe – are often considered to be the primary drivers of Southern Ocean productivity, our study teaches us that Fe bioavailability for microorganisms is not a simple matter of chemistry.
All datasets generated for this study are included in the article/Supplementary Material.
MF conceived and conducted the study, and wrote the manuscript. MB contributed to the design of the study. MB, ME, and PB contributed to data collection at sea. SD contributed to the sample analysis. IO and TT contributed to data analysis and interpretation. PB acquired funding. All co-authors reviewed and edited this or previous versions of the manuscript and gave final approval for publication.
MF and PB were primarily supported by the Australian Research Council through a Laureate (FL160100131), and this research was also supported under the Australian Research Council’s Special Research Initiative for Antarctic Gateway Partnership (Project ID SR140300001). MB was funded from the European Union Seventh Framework Program (FP7/2007-2013) under grant agreement no. PIOF-GA-2012-626734 (IRON-IC project).
The authors declare that the research was conducted in the absence of any commercial or financial relationships that could be construed as a potential conflict of interest.
We sincerely thank the reviewers for their help and thorough reviews. We especially thank SH and RB for taking the time to thoroughly read the manuscript and offer tremendously valuable suggestions. We also wish to thank Alice Della Penna (CSIRO) who prepared filters for POC measurements, Diana Davies (CSIRO) who analyzed them, and Audrey Guéneuguès (LOMIC) for the preparation of the trace-metal clean stock solution of Glucose. We are also grateful to Robert Strzepek, Sam Eggins, and Cassie Schwanger (IMAS/CSIRO) for their valuable help at sea and Christel Hassler for her suggestions regarding the manuscript. Finally, we would also like to thank Laurent Besnard (IMOS) and Sébastien Moreau for Figure 1, Pierre Poisson (PLUM) for his encouragement in this work, and Andrew Davidson for his kindness in facilitating the use of the Australian Antarctic Division (AAD) facilities.
The Supplementary Material for this article can be found online at: https://www.frontiersin.org/articles/10.3389/fmars.2019.00776/full#supplementary-material
Amin, S. A., Green, D. H., Hart, M. C., Küpper, F. C., Sunda, W. G., Carrano, C. J., et al. (2009). Photolysis of iron – siderophore chelates promotes bacterial – algal mutualism. Proc. Natl. Acad. Sci. U.S.A. 106, 17071–17076. doi: 10.1073/pnas.0905512106
Amin, S. A., Hmelo, L. R., van Tol, H. M., Durham, B. P., Carlson, L. T., Heal, K. R., et al. (2015). Interaction and signalling between a cosmopolitan phytoplankton and associated bacteria. Nature 522, 98–101. doi: 10.1038/nature14488
Andrews, S. C., Robinson, A. K., and Rodríguez-Quiñones, F. (2003). Bacterial iron homeostasis. FEMS Microbiol. Rev. 27, 215–237. doi: 10.1016/S0168-6445(03)00055-X
Armstrong, E., Granger, J., Mann, E. L., and Price, N. M. (2004). Outer-membrane siderophore receptors of heterotrophic oceanic bacteria. Limnol. Oceanogr. 49, 579–587. doi: 10.4319/lo.2004.49.2.0579
Behrenfeld, M. J. (2014). Climate-mediated dance of the plankton. Nat. Clim. Chang. 4, 880–887. doi: 10.1038/nclimate2349
Behrenfeld, M. J., Worthington, K., Sherrell, R. M., Chavez, F. P., Strutton, P. G., McPhaden, M., et al. (2006). Controls on tropical Pacific Ocean productivity revealed through nutrient stress diagnostics. Nature 442, 1025–1028. doi: 10.1038/nature05083
Beier, S., Gálvez, M., Molina, V., Sarthou, G., Quéroué, F., Blain, S., et al. (2015). The transcriptional regulation of the glyoxylate cycle in SAR11 in response to iron fertilization in the Southern Ocean. Environ. Microbiol. Rep. 7, 427–434. doi: 10.1111/1758-2229.12267
Bertrand, E. M., McCrow, J. P., Moustafa, A., Zheng, H., McQuaid, J. B., Delmont, T. O., et al. (2015). Phytoplankton-bacterial interactions mediate micronutrient colimitation at the coastal Antarctic sea ice edge. Proc. Natl. Acad. Sci. U.S.A. 112, 9938–9943. doi: 10.1073/pnas.1501615112
Blain, S., Quéguiner, B., Armand, L., Belviso, S., Bombled, B., Bopp, L., et al. (2007). Effect of natural iron fertilization on carbon sequestration in the Southern Ocean. Nature 446, 1070–1074. doi: 10.1038/nature05700
Blain, S., Queguiner, B., and Trull, T. (2008). The natural iron fertilization experiment KEOPS (KErguelen Ocean and Plateau compared Study): an overview. Deep Sea Res. Part II Top. Stud. Oceanogr. 55, 559–565. doi: 10.1016/j.dsr2.2008.01.002
Blain, S., and Tagliabue, A. (2016). Iron Cycle in Oceans. Hoboken, NJ: John Wiley & Sons Incorporated.
Boiteau, R. M., Fansler, S. J., Farris, Y., Shaw, J. B., Koppenaal, D. W., Pasa-Tolic, L., et al. (2019). Siderophore profiling of co-habitating soil bacteria by ultra-high resolution mass spectrometry. Metallomics 11, 166–175. doi: 10.1039/C8MT00252E
Boiteau, R. M., Mende, D. R., Hawco, N. J., McIlvin, M. R., Fitzsimmons, J. N., Saito, M. A., et al. (2016). Siderophore-based microbial adaptations to iron scarcity across the eastern Pacific Ocean. Proc. Natl. Acad. Sci. 113, 14237–14242. doi: 10.1073/pnas.1608594113
Bowie, A. R., Maldonado, M. T., Frew, R. D., Croot, P. L., Achterberg, E. P., Mantoura, R. F. C., et al. (2001). The fate of added iron during a mesoscale fertilisation experiment in the Southern Ocean. Deep Sea Res. Part II Top. Stud. Oceanogr. 48, 2703–2743. doi: 10.1016/S0967-0645(01)00015-7
Boyd, P. W., and Ellwood, M. J. (2010). The biogeochemical cycle of iron in the ocean. Nat. Geosci. 3, 675–682. doi: 10.1038/ngeo964
Boyd, P. W., Law, C. S., Hutchins, D. A., Abraham, E. R., Croot, P. L., Ellwood, M., et al. (2005). FeCycle: attempting an iron biogeochemical budget from a mesoscale SF 6 tracer experiment in unperturbed low iron waters. Global Biogeochem. Cycles 19, 1–13. doi: 10.1029/2005GB002494
Boyd, P. W., Strzepek, R., Chiswell, S., Chang, H., DeBruyn, J. M., Ellwood, M., et al. (2012). Microbial control of diatom bloom dynamics in the open ocean. Geophys. Res. Lett. 39, 1–6. doi: 10.1029/2012GL053448
Boyd, P. W., Strzepek, R., Fu, F., and Hutchins, D. A. (2010). Environmental control of open-ocean phytoplankton groups: now and in the future. Limnol. Oceanogr. 55, 1353–1376. doi: 10.4319/lo.2010.55.3.1353
Braun, V., and Killmann, H. (1999). Bacterial solutions to the iron-supply problem. Trends Biochem. Sci. 24, 104–109. doi: 10.1016/s0968-0004(99)01359-6
Buitenhuis, E. T., Li, W. K. W., Vaulot, D., Lomas, M. W., Landry, M. R., Partensky, F., et al. (2012). Picophytoplankton biomass distribution in the global ocean. Earth Syst. Sci. Data 4, 37–46. doi: 10.5194/essd-4-37-2012
Bundy, R. M., Boiteau, R. M., McLean, C., Turk-Kubo, K. A., Mclvin, M. R., Saito, M. A., et al. (2018). Distinct siderophores contribute to iron cycling in the mesopelagic at station ALOHA. Front. Mar. Sci. 5:61. doi: 10.3389/fmars.2018.00061
Bunse, C., Bertos-Fortis, M., Sassenhagen, I., Sildever, S., Sjöqvist, C., Godhe, A., et al. (2016). Spatio-temporal interdependence of bacteria and phytoplankton during a Baltic Sea Spring Bloom. Front. Microbiol. 7:517. doi: 10.3389/fmicb.2016.00517
Cael, B. B., and Follows, M. J. (2016). On the temperature dependence of oceanic export efficiency. Geophys. Res. Lett. 43, 5170–5175. doi: 10.1002/2016GL068877
Caron, D. A., Connell, P. E., Schaffner, R. A., Schnetzer, A., Fuhrman, J. A., Countway, P. D., et al. (2017). Planktonic food web structure at a coastal time-series site: I. Partitioning of microbial abundances and carbon biomass. Deep Sea Res. Part I Oceanogr. Res. Pap. 121, 14–29. doi: 10.1016/J.DSR.2016.12.013
Caron, D. A., Dam, H. G., Kremer, P., Lessard, E. J., Madin, L. P., Malone, T. C., et al. (1994). The contribution of microorganisms to particulate carbon and nitrogen in surface waters of the Sargasso Sea near Bermuda. Limnol. Oceanogr. 44, 259–272.
Caron, D. A., and Hutchins, D. A. (2012). The effects of changing climate on microzooplankton grazing and community structure: drivers, predictions and knowledge gaps. J. Plankton Res. 35, 235–252. doi: 10.1093/plankt/fbs091
Carpenter, J. I. (1965). The accuracy of the Winkler method for dissolved oxygen analysis. Limnol. Oceanogr. 10, 135–140. doi: 10.4319/lo.1965.10.1.0135
Cassar, N., DiFiore, P. J., Barnett, B. A., Bender, M. L., Bowie, A. R., Tilbrook, B., et al. (2011). The influence of iron and light on net community production in the Subantarctic and Polar Frontal Zones. Biogeosciences 8, 227–237. doi: 10.5194/bg-8-227-2011
Cavan, E. L., and Boyd, P. W. (2018). Effect of anthropogenic warming on microbial respiration and particulate organic carbon export rates in the sub-Antarctic Southern Ocean. Aquat. Microb. Ecol. 82, 111–127. doi: 10.3354/ame01889
Cavan, E. L., Henson, S. A., and Boyd, P. W. (2019). The Sensitivity of subsurface microbes to ocean warming accentuates future declines in particulate carbon export. Front. Ecol. Evol. 6:230. doi: 10.3389/fevo.2018.00230
Church, M. J., Hutchins, D. A., and Ducklow, H. W. (2000). Limitation of bacterial growth by dissolved organic matter and iron in the Southern Ocean. Appl. Environ. Microbiol. 66, 455–466. doi: 10.1128/AEM.66.2.455-466.2000
Cutter, G., Sciences, A., Dominion, O., Casciotti, K., Croot, P., Sciences, O., et al. (2017). ). Sampling and Sample-handling Protocols for GEOTRACES Cruises. Copenhagen: ICES.
Dalbec, A., and Twining, B. (2009). Remineralization of bioavailable iron by a heterotrophic dinoflagellate. Aquat. Microb. Ecol. 54, 279–290. doi: 10.3354/ame01270
Debeljak, P., Toulza, E., Beier, S., Blain, S., and Obernosterer, I. (2019). Microbial iron metabolism as revealed by gene expression profiles in contrasted Southern Ocean regimes. Environ. Microbiol. 21, 2360–2374. doi: 10.1111/1462-2920.14621
Deppeler, S. L., and Davidson, A. T. (2017). Southern Ocean Phytoplankton in a Changing Climate. Front. Mar. Sci. 4:40. doi: 10.3389/fmars.2017.00040
Desai, D. K., Desai, F. D., and LaRoche, J. (2012). Factors influencing the diversity of iron uptake systems in aquatic microorganisms. Front. Microbiol. 3:362. doi: 10.3389/FMICB.2012.00362
Evans, C., Thomson, P. G., Davidson, A. T., Bowie, A. R., van den Enden, R., Witte, H., et al. (2011). Potential climate change impacts on microbial distribution and carbon cycling in the Australian Southern Ocean. Deep Sea Res. Part II Top. Stud. Oceanogr. 58, 2150–2161. doi: 10.1016/j.dsr2.2011.05.019
Falkowski, P. G., and de Vargas, C. (2004). Genomics and evolution. Shotgun sequencing in the sea: a blast from the past? Science 304, 58–60. doi: 10.1126/science.1097146
Farnelid, H. M., Turk-Kubo, K. A., and Zehr, J. P. (2016). Identification of Associations between Bacterioplankton and Photosynthetic Picoeukaryotes in Coastal Waters. Front. Microbiol. 7:339. doi: 10.3389/fmicb.2016.00339
Fourquez, M., Obernosterer, I., and Blain, S. (2012). A method for the use of the radiotracer 55Fe for microautoradiography and CARD-FISH of natural bacterial communities. FEMS Microbiol. Lett. 337, 132–139. doi: 10.1111/1574-6968.12022
Fourquez, M., Obernosterer, I., Davies, D. M., Trull, T. W., and Blain, S. (2015). Microbial iron uptake in the naturally fertilized waters in the vicinity of the Kerguelen Islands: phytoplankton–bacteria interactions. Biogeosciences. 12, 1893–1906. doi: 10.5194/bg-12-1893-2015
Fourquez, M., Schaumann, A., Gueneugues, A., Jouenne, T., and Obernosterer, I. (2014). Effects of iron limitation on growth and carbon metabolism in oceanic and coastal heterotrophic bacteria. Limnol. Oceanogr. 59, 1–14. doi: 10.4319/lo.2014.59.1.0000
Fukuda, R., Ogawa, H., Nagata, T., and Koike, I. (1998). Direct determination of carbon and nitrogen contents of natural bacterial assemblages in marine environments. Appl. Environ. Microbiol. 64, 3352–3358.
Gerringa, L. J. A., Blain, S., Laan, P., Sarthou, G., Veldhuis, M. J. W., Brussaard, C. P. D., et al. (2008). Fe-binding dissolved organic ligands near the Kerguelen Archipelago in the Southern Ocean (Indian sector). Deep Sea Res. Part II 55, 606–621. doi: 10.1016/j.dsr2.2007.12.007
Gledhill, M., and Buck, K. N. (2012). The organic complexation of iron in the marine environment: a review. Front. Microbiol. 3:69. doi: 10.3389/fmicb.2012.00069
Hansell, D. A., Carlson, C. A., Repeta, D. J., and Schlitzer, R. (2009). Dissolved organic matter in the Ocean carbon cycle. Oceanography 22, 202–211. doi: 10.1029/2015eo033011
Hays, G. C., Richardson, A. J., and Robinson, C. (2005). Climate change and marine plankton. Trends Ecol. Evol. 20, 337–344. doi: 10.1016/j.tree.2005.03.004
Hogle, S. L., Thrash, J. C., Dupont, C. L., and Barbeau, K. A. (2016). Trace metal acquisition by marine heterotrophic bacterioplankton with contrasting trophic strategies. Appl. Environ. Microbiol. 82, 1613–1624. doi: 10.1128/AEM.03128-15
Hopkinson, B. M., and Barbeau, K. A. (2012). Iron transporters in marine prokaryotic genomes and metagenomes. Environ. Microbiol. 14, 114–128. doi: 10.1111/j.1462-2920.2011.02539.x
Hopkinson, B. M., and Morel, F. M. M. (2009). The role of siderophores in iron acquisition by photosynthetic marine microorganisms. Biometals 22, 659–669. doi: 10.1007/s10534-009-9235-2
Hunter, K. A., and Boyd, P. W. (2007). Iron-binding ligands and their role in the ocean biogeochemistry of iron. Environ. Chem. 4, 221. doi: 10.3389/fmars.2016.00027
Hutchins, D. A., Jansson, J. K., Remais, J. V., Rich, V. I., Singh, B. K., and Trivedi, P. (2019). Climate change microbiology — problems and perspectives. Nat. Rev. Microbiol. 17, 391–396. doi: 10.1038/s41579-019-0178-5
Ilbert, M., and Bonnefoy, V. (2013). Insight into the evolution of the iron oxidation pathways. Biochim. Biophys. Acta Bioenerg. 1827, 161–175. doi: 10.1016/j.bbabio.2012.10.001
Johnson, K. (1997). What controls dissolved iron concentrations in the world ocean? Authors’ closing comments. Mar. Chem. 57, 181–186. doi: 10.1016/S0304-4203(97)00047-9
Kazamia, E., Sutak, R., Paz-Yepes, J., Dorrell, R. G., Vieira, F. R. J., Mach, J., et al. (2018). Endocytosis-mediated siderophore uptake as a strategy for Fe acquisition in diatoms. Sci. Adv. 4:eaar4536. doi: 10.1126/sciadv.aar4536
Kirchman, D. L. (1994). The uptake of inorganic nutrients by heterotrophic bacteria. Microb. Ecol. 28, 255–271. doi: 10.1007/BF00166816
Kirchman, D. L., Keil, R. G., and Simon, M. (1993). Biomass and production of heterotrophic bacterioplankton in the oceanic subarctic Pacific Samples for bacterial abundance and incorporation rates were taken from CTD Niskin bottles. These bottles all had silicone tubing during the cruises reported here. Deep. Res. 40, 967–988. doi: 10.1016/0967-0637(93)90084-g
Kirchman, D. L., Meon, B., Cottrell, M. T., Hutchins, D. A., Weeks, D., and Bruland, K. W. (2000). Carbon versus iron limitation of bacterial growth in the California upwelling regime. Limnol. Oceanogr. 45, 1681–1688. doi: 10.4319/lo.2000.45.8.1681
Koedooder, C., Guéneuguès, A., Van Geersdaële, R., Vergé, V., Bouget, F.-Y., Labreuche, Y., et al. (2018). The role of the glyoxylate shunt in the acclimation to iron limitation in marine heterotrophic Bacteria. Front. Mar. Sci. 5:435. doi: 10.3389/fmars.2018.00435
Kranzler, C., Lis, H., Shaked, Y., and Keren, N. (2011). The role of reduction in iron uptake processes in a unicellular, planktonic cyanobacterium. Environ. Microbiol. 13, 2990–2999. doi: 10.1111/j.1462-2920.2011.02572.x
Landa, M., Blain, S., Christaki, U., Monchy, S., and Obernosterer, I. (2015). Shifts in bacterial community composition associated with increased carbon cycling in a mosaic of phytoplankton blooms. ISME J. 10, 1–12. doi: 10.1038/ismej.2015.105
Lima-Mendez, G., Faust, K., Henry, N., Decelle, J., Colin, S., Carcillo, F., et al. (2015). Determinants of community structure in the global plankton interactome. Science 348, 1262073–1262073. doi: 10.1126/science.1262073
Lis, H., Shaked, Y., Kranzler, C., Keren, N., and Morel, F. M. M. (2015). Iron bioavailability to phytoplankton: an empirical approach. ISME J. 9, 1003–1013. doi: 10.1038/ismej.2014.199
Liu, Y., Debeljak, P., Rembauville, M., Blain, S., and Obernosterer, I. (2019). Diatoms shape the biogeography of heterotrophic prokaryotes in early spring in the Southern Ocean. Environ. Microbiol. 21, 1452–1465. doi: 10.1111/1462-2920.14579
Macrellis, H. M., Trick, C. G., Rue, E. L., Smith, G. J., and Bruland, K. W. (2001). Collection and detection of natural iron-binding ligands from seawater. Mar. Chem. 76, 175–187. doi: 10.1016/s0304-4203(01)00061-5
Marie, D., Partensky, F., Jacquet, S., and Vaulot, D. (1997). Enumeration and cell cycle analysis of natural populations of marine picoplankton by flow cytometry using the nucleic acid stain SYBR Green I. Appl. Environ. Microbiol. 63, 186–193.
Marie, D., Simon, N., and Vaulot, D. (2005). “Phytoplankton Cell Counting by Flow Cytometry,” in Algal Culturing Techniques, ed. R. A. Andersen, (London: Elsevier), 253–267. doi: 10.1016/b978-012088426-1/50018-4
Martinez, J., Smith, D. C., Steward, G. F., and Azam, F. (1996). Variability in ectohydrolytic enzyme activities of pelagic marine bacteria and its significance for substrate processing in the sea. Aquat. Microb. Ecol. 10, 223–230. doi: 10.3354/ame010223
McQuaid, J. B., Kustka, A. B., Oborník, M., Horák, A., McCrow, J. P., Karas, B. J., et al. (2018). Carbonate-sensitive phytotransferrin controls high-affinity iron uptake in diatoms. Nature 555, 534–537. doi: 10.1038/nature25982
Morel, F. M. M., and Price, N. M. (2003). The biogeochemical cycles of trace metals in the Oceans. Science 300, 944–947. doi: 10.1126/science.1083545
Morrissey, J., and Bowler, C. (2012). Iron utilization in marine cyanobacteria and eukaryotic algae. Front. Microbiol. 3:43. doi: 10.3389/fmicb.2012.00043
Obata, H., Karatani, H., and Nakayama, E. (1993). Automated determination of Iron in seawater by chelating resin concentration and chemiluminescence detection. Anal. Chem. 65, 1524–1528. doi: 10.1021/ac00059a007
Obernosterer, I., Christaki, U., Lefevre, D., Catala, P., Vanwambeke, F., and Lebaron, P. (2008). Rapid bacterial mineralization of organic carbon produced during a phytoplankton bloom induced by natural iron fertilization in the Southern Ocean. Deep Sea Res. Part II Top. Stud. Oceanogr. 55, 777–789. doi: 10.1016/j.dsr2.2007.12.005
Obernosterer, I., Fourquez, M., and Blain, S. (2015). Fe and C co-limitation of heterotrophic bacteria in the naturally fertilized region off the Kerguelen Islands. Biogeosciences 12, 1983–1992. doi: 10.5194/bg-12-1983-2015
Poorvin, L., Rinta-Kanto, J. M., Hutchins, D. A., and Wilhelm, S. W. (2004). Viral release of iron and its bioavailability to marine plankton. Limnol. Oceanogr. 49, 1734–1741. doi: 10.4319/lo.2004.49.5.1734
Raven, J. A. (1990). Predictions of Mn and Fe use efficiencies of phototrophic growth as a function of light availability for growth and of C assimilation pathway. New Phytol. 116, 1–18. doi: 10.1111/j.1469-8137.1990.tb00505.x
Raven, J. A., Evans, M. C. W., and Korb, R. E. (1999). The role of trace metals in photosynthetic electron transport in O2-evolving organisms. Photosynth. Res. 60, 111–150. doi: 10.1023/A:1006282714942
Rembauville, M., Salter, I., Leblond, N., Gueneugues, A., and Blain, S. (2015). Export fluxes in a naturally iron-fertilized area of the Southern Ocean – Part 1: seasonal dynamics of particulate organic carbon. Biogeosciences 12, 3153–3170. doi: 10.5194/bg-12-3153-2015
Rue, E. L., and Bruland, K. W. (1997). The role of organic complexation on ambient Fe chemistry in the equatorial Pacific Ocean and the response of a mesoscale Fe addition experiment. Limnol. Oceanogr. 42, 901–910. doi: 10.4319/lo.1997.42.5.0901
Sarmento, H., Montoya, J. M., Vázquez-Domínguez, E., Vaqué, D., and Gasol, J. M. (2010). Warming effects on marine microbial food web processes: how far can we go when it comes to predictions? Philos. Trans. R. Soc. Lond. B. Biol. Sci. 365, 2137–2149. doi: 10.1098/rstb.2010.0045
Sarthou, G., Timmermans, K. R., Blain, S., and Tréguer, P. (2005). Growth physiology and fate of diatoms in the ocean: a review. J. Sea Res. 53, 25–42. doi: 10.1016/j.seares.2004.01.007
Sarthou, G., Vincent, D., Christaki, U., Obernosterer, I., Timmermans, K. R., and Brussaard, C. P. D. (2008). The fate of biogenic iron during a phytoplankton bloom induced by natural fertilisation: impact of copepod grazing. Deep Sea Res. Part II 55, 734–751. doi: 10.1016/j.dsr2.2007.12.033
Sedwick, P. N., Edwards, P. R., Mackey, D. J., Griffithst, F. B., and Parslow, J. S. (1997). Iron and manganese in surface waters of the Australian subantarctic region. Deep Sea Res. Part I 44, 1239–1253. doi: 10.1016/s0967-0637(97)00021-6
Shaked, Y., and Lis, H. (2012). Disassembling iron availability to phytoplankton. Front. Microbiol. 3:123. doi: 10.3389/fmicb.2012.00123
Strzepek, R. F., Boyd, P. W., and Sunda, W. G. (2019). Photosynthetic adaptation to low iron, light, and temperature in Southern Ocean phytoplankton. Proc. Natl. Acad. Sci. U.S.A. 116, 4388–4393. doi: 10.1073/pnas.1810886116
Strzepek, R. F., and Harrison, P. J. (2004). Photosynthetic architecture differs in coastal and oceanic diatoms. Nature 403, 689–692. doi: 10.1038/nature02954
Strzepek, R. F., Maldonado, M. T., Higgins, J. L., Hall, J., Safi, K., Wilhelm, S. W., et al. (2005). Spinning the “Ferrous Wheel”: the importance of the microbial community in an iron budget during the FeCycle experiment. Global Biogeochem. Cycles 19, 1–14. doi: 10.1029/2005GB002490
Thingstad, T. (2000). Elements of a theory for the mecanisms controlling abundance, diversity, and biogeochemical role of lytic bacterial viruses in aquatic systems. Limnol. Oceanogr. 45, 1320–1328. doi: 10.4319/lo.2000.45.6.1320
Tortell, P. D., Maldonado, M. T., Granger, J., and Price, N. M. (1999). Marine bacteria and biogeochemical cycling of iron in the oceans. FEMS Microbiol. Ecol. 29, 1–11. doi: 10.1111/j.1574-6941.1999.tb00593.x
Tortell, P. D., Maldonado, M. T., and Price, N. M. (1996). The role of heterotrophic bacteria in iron-limited ocean ecosystems. Nature 383, 330–332. doi: 10.1038/383330a0
Toulza, E., Tagliabue, A., Blain, S., and Piganeau, G. (2012). Analysis of the global ocean sampling (GOS) project for trends in iron uptake by surface ocean microbes. PLoS One 7:e30931. doi: 10.1371/journal.pone.0030931
Tovar-Sanchez, A., Sanudo-Wilhelmy, S. A., Garcia-Vargas, M., Weaver, R. S., Popels, L. C., and Hutchins, D. A. (2003). A trace metal clean reagent to remove surface-bound iron from marine phytoplankton. Mar. Chem. 82, 91–99. doi: 10.1016/S0304-4203(03)00054-9
Trull, T. W., Jansen, P., Schulz, E., Weeding, B., Davies, D. M., Bray, S. G., et al. (2019). Autonomous multi-trophic observations of productivity and export at the Australian Southern Ocean time series (SOTS) reveal sequential mechanisms of physical-biological coupling. Front. Mar. Sci. 6:529. doi: 10.3389/fmars.2019.00525
Twining, B. S., and Baines, S. B. (2013). The trace metal composition of marine phytoplankton. Ann. Rev. Mar. Sci. 5, 191–215. doi: 10.1146/annurev-marine-121211-172322
Van Wambeke, F., Heussner, S., Diaz, F., Raimbault, P., and Conan, P. (2002). Small-scale variability in the coupling/uncoupling of bacteria, phytoplankton and organic carbon fluxes along the continental margin of the Gulf of Lions, Northwestern Mediterranean. Sea. J. Mar. Syst. 3, 411–429. doi: 10.1016/S0924-7963(02)00069-6
Vázquez-Domínguez, E., Vaqué, D., and Gasol, J. M. (2007). Ocean warming enhances respiration and carbon demand of coastal microbial plankton. Glob. Chang. Biol. 13, 1327–1334. doi: 10.1111/j.1365-2486.2007.01377.x
Yelton, A. P., Acinas, S. G., Sunagawa, S., Bork, P., Pedrós-Alió, C., and Chisholm, S. W. (2016). Global genetic capacity for mixotrophy in marine picocyanobacteria. ISME J. 10, 2946–2957. doi: 10.1038/ismej.2016.64
Keywords: iron, carbon, Southern Ocean, competition, heterotrophic bacteria, pico-nanoplankton, Fe uptake, bacterial production
Citation: Fourquez M, Bressac M, Deppeler SL, Ellwood M, Obernosterer I, Trull TW and Boyd PW (2020) Microbial Competition in the Subpolar Southern Ocean: An Fe–C Co-limitation Experiment. Front. Mar. Sci. 6:776. doi: 10.3389/fmars.2019.00776
Received: 13 June 2019; Accepted: 02 December 2019;
Published: 09 January 2020.
Edited by:
Marius Nils Müller, Federal University of Pernambuco, BrazilReviewed by:
Shane Hogle, University of Turku, FinlandCopyright © 2020 Fourquez, Bressac, Deppeler, Ellwood, Obernosterer, Trull and Boyd. This is an open-access article distributed under the terms of the Creative Commons Attribution License (CC BY). The use, distribution or reproduction in other forums is permitted, provided the original author(s) and the copyright owner(s) are credited and that the original publication in this journal is cited, in accordance with accepted academic practice. No use, distribution or reproduction is permitted which does not comply with these terms.
*Correspondence: Marion Fourquez, bWFyaW9uLmZvdXJxdWV6QGdtYWlsLmNvbQ==
Disclaimer: All claims expressed in this article are solely those of the authors and do not necessarily represent those of their affiliated organizations, or those of the publisher, the editors and the reviewers. Any product that may be evaluated in this article or claim that may be made by its manufacturer is not guaranteed or endorsed by the publisher.
Research integrity at Frontiers
Learn more about the work of our research integrity team to safeguard the quality of each article we publish.