 Cemal Turan1*
 Petya Pavlova Ivanova2
 Violin Stoyanov Raykov2
 Mevlut Gurlek3
 Deniz Erguden3
 Deniz Yaglioglu4
 Serpil Karan3
 Servet Ahmet Dogdu3
 Ali Uyan3
 Bayram Ozturk5Venelin Nikolov2Ivan Dobrovolov2†
 Antonina Khanaychenko6
 Vitaly Giragosov6
- 1Marine Science Department, Iskenderun Technical University, Hatay, Turkey
- 2Marine Biology and Ecology Department, Institute of Oceanology, Bulgarian Academy of Sciences, Varna, Bulgaria
- 3Fisheries Sciences Department, Iskenderun Technical University, Hatay, Turkey
- 4Department of Biology, Duzce University, Düzce, Turkey
- 5Faculty of Fisheries, Istanbul University, Istanbul, Turkey
- 6Department of Aquaculture and Marine Pharmacology, Institute of Biology of the Southern Seas, Sevastopol, Russia
Introduction
The turbot, Scophthalmu maximus, is a commercially important flatfish and has remarkable attention with respect to fisheries and aquaculture (Iyengar et al., 1999) from Northeast Atlantic to the Arctic Circle and commonly found in the Baltic and some part of north Mediterranean including the Marmara and the Black Sea, but the Aegean Sea (Turan et al., 2007). S. maximus has restricted spatial migrations and live at depth of 20 up to 100 m, predate on the small fish, crustaceans and other benthic marine animals (Karapetkova, 1980; Ivanov and Beverton, 1985). The turbot is considered as vulnerable (VU) under the current IUCN Red List criteria (IUCN, 2019). The natural populations of turbot are subject to strong anthropogenic pressure.
The species in the Black Sea is under catch quota following the multiannual management plan for turbot fisheries in the Black Sea. A total allowable catch (TAC) is set at 644 tons for 2018–2019, and each authorized vessel shall not exceed a maximum number of 180 fishing days per year. In addition, the status of the turbot stock must be regularly assessed and the level of current fishing mortality established. Hence, the implementation of a TAC, assuming a 100% curb of IUU fishing, would allow the stock to quickly recover to large biomass values with a relatively low probability of SSB falling below BLIM (11.6% in 2030). These results provide grounds for the continuation of fishing activities at levels that are acceptable for both the population and the fishery, provided the adequate management measures are adopted (FAO, 2018). The total turbot catches in the Black Sea accounted for 661, 1,444 tons IUU included (GFCM, 2018), the prevailing landings belong to Russia and Turkey for 2016. Despite its economic importance and wide range of distribution, limited literature is available on the population structure of S. maximus using molecular markers (Atanassov et al., 2011; Nikolov et al., 2015).
Over-exploitation of this resource is a factor for the complete disappearance of local fish populations worldwide (Dulvy et al., 2003). Therefore, globally increased level of exploitation of fisheries resources requires urgent measures to establish the impact on the genetic diversity and population genetic structure of commercial populations in order to improve the strategy for long-term management, which would ensure the conservation of fisheries resources (Karahana et al., 2014).
The genetic tools deliver significant advances for fisheries management in the short term that the determination of fishery stock structure is important for defining stock boundaries to underpin sustainable fishery management that is one of the priority areas relevant for fisheries management under the E.U. Common Fisheries (Ovenden et al., 2015). The suggestions mentioned above are based on the immediate needs emerging from the CFP regulation (EC, 2013) and genetic approaches that appear to be feasible, practicable and cost-efficient (Casey et al., 2016).
Microsatellite markers have been determined in a large variety of fish species and are commonly used in population genetic studies (Iyengar et al., 2000). Recently, microsatellite markers have progressively been used to get knowledge on population structure and interaction between populations of a given species (Chen et al., 2017). Due to its maternal inheritance mode and relative lack of recombination, mitochondrial DNA symbolizes a useful marker system for use in population genetic studies (Hurst et al., 1999).
Numerous studies of the genetic structure of turbot have been conducted on North-eastern Atlantic and western Mediterranean countries (Pardo et al., 2005), however, there has been limited study conducted on genetic structure of that species in the Black Sea. Therefore, there is a need for elucidation of the population genetic structure of turbot to find appropriate management strategies for Black Sea countries.
Therefore, the aim of this study is to elucidate population genetic structure of turbot (S. maximus) from the Black and Marmara Seas and to implement it into management strategies as a key element for rational exploitation and conservation of fish populations.
Materials and Methods
Sample Collection
S. maximus samples (fin clips) from 50 individuals in total (10 from each site) were collected at fishing ports (commercial landings) from Turkish marine waters [Trabzon (TRB), Duzce (DUZ), and Marmara Sea (MAR)], from Bulgaria-Varna coastal waters (VAR) and from Russia Sevastopol coastal waters (SVT) between 2013 and 2015 (Figure 1). The samples were taken to the laboratory and frozen at −30°C until DNA extraction.
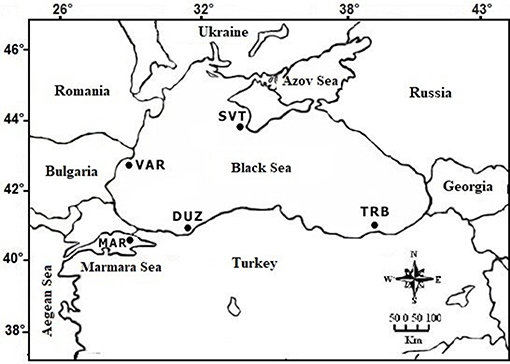
Figure 1. Locations of S. maximus sampling sites: TRB (Trabzon coast); DUZ (Duzce coast); VAR (Bulgarian Varna coast); SVT (Russian Sevastopol coast); MAR (the Marmara Sea coast).
DNA Extraction
The total DNA was isolated by using a phenol–chloroform method (Sambrook et al., 1989). After DNA extractions, DNA product was visualized in 0.7% agarose gels and quantitation of the DNA was completed using a spectrophotometer.
Microsatellites
Gel Analyzer 2010a (1-D Gel Analysis) software was applied to score alleles visualized by electrophoresis. Five microsatellite primers originally developed for S. maximus (Table 1) were applied after the optimization and determination of polymorphisms. A Polymerase Chain Reaction (PCR) was carried out using reaction volume of 15 μl including 1 U Taq polymerase (Thermo scientific), 2 μM of each primer, 200 mM dNTPs, 25 mM MgCl2, 10 mM Tris-HCI pH 8.8, 50 mM KCI, and 1 μl template DNA (≈10–25 ng). It was performed with two stages: pre-denaturation at 95°C for 1 min followed by five denaturation cycles at 94°C for 20 s, annealing at 55 s, extension at 72°C for 2 s that was followed by the second stage of 25 denaturation cycles in 20 s at 94°C and final extension in 20 s at 72°C.

Table 1. Set of primers and amplification conditions for the 5th microsatellite loci and universal COIII primers of mtDNA.
Statistical Analyses
Deviations of Hardy–Weinberg genotypic distributions (HWE), observed (HO), and expected (HE) heterozygosities were analyzed with Arlequin v3.5.1.3 (Excoffier and Lischer, 2010) to test for excess heterozygosity and deficiency of microsatellite data. A stepwise mutational model based on allelic identity (FST) was used to elucidate genetic differentiation between populations while the estimation of allelic size (RST) is less reliable than FST when <20 microsatellite loci are used (Gaggiotti et al., 1999). The Sequential Bonferroni technique was applied for detected significance levels with multiple tests (Rice, 1989). The Garza–Williamson Index (GWI), which measures the ratio of the observed number of alleles relative to the total number of possible allelic states at the locus over the allelic range, was used to detect bottlenecks (Garza and Williamson, 2001). PCAGEN, SPSS, and SYSTAT software were used for Principal Component Analysis (PCA) and Discriminant Function Analysis (DFA) of microsatellite data. A neighbor-joining dendrogram (Saitou and Nei, 1987) was constructed to reveal genetic relationships among the populations (Cavalli-Sforza and Edwards, 1967) with PHYLIP 3.57 (Felsenstein, 1989). Pairwise genetic distance matrices (FST) and geographic distance (km) were tested whether gene flow was geographically restricted and followed the isolation-by-distance model using the Mantel test (Mantel, 1967).
mtDNA Sequence Analysis
The complete mtDNA COIII gene region was amplified via PCR reactions, which was carried out according to the protocol given by Turan et al. (2019). The mitochondrial cytochrome c oxidase subunit III (COIII) gene was amplified using the universal primers (Table 1). The mtDNA sequence analysis was performed according to Sanger et al. (1977) on ABI 3130 XL genetic analyzer.
Statistical Analyses
After sequence alignment, the best model for sequence divergences were calculated using Mega v5, and the molecular phylogenetic tree was also constructed using MEGA v5 (Tamura et al., 2011). Neighbor joining (NJ) tree (Saitou and Nei, 1987) was applied to visualize relationship among the populations. The statistical robustness in the nodes of the resulting tree was determined by 1,000 bootstrap replicates. Tajima's D test (Tajima, 1989) was carried out to tests the conformity of DNA sequence evolution to neutrality. The sequences have been deposited in the GenBank with accession numbers, MN062299—MN062348.
Results
Microsatellite
In the microsatellite analysis, a total of 108 alleles were detected from five microsatellite loci and the allele numbers for each microsatellite locus within the S. maximus populations ranged from 3 to 14. The expected and observed heterozygosity in S. maximus populations varied between 0.32 and 0.88 and 0.07 and 1.00, respectively. The genotypic structuring at overall loci revealed statistically significant deviation from HWE (P < 0.001). The highest expected heterozygosity was 0.88 at 3/9CA15 locus while the lowest expected heterozygosity was 0.32 at Sma02 locus. Alleles numbers within samples at each microsatellite locus ranged from 3 at locus B12-I GT14 and 3/9CA15 in TRB, DUZ, and MAR sample to 14 at locus Sma02 and 3/9CA15 in VAR and DUZ samples (Table 2).
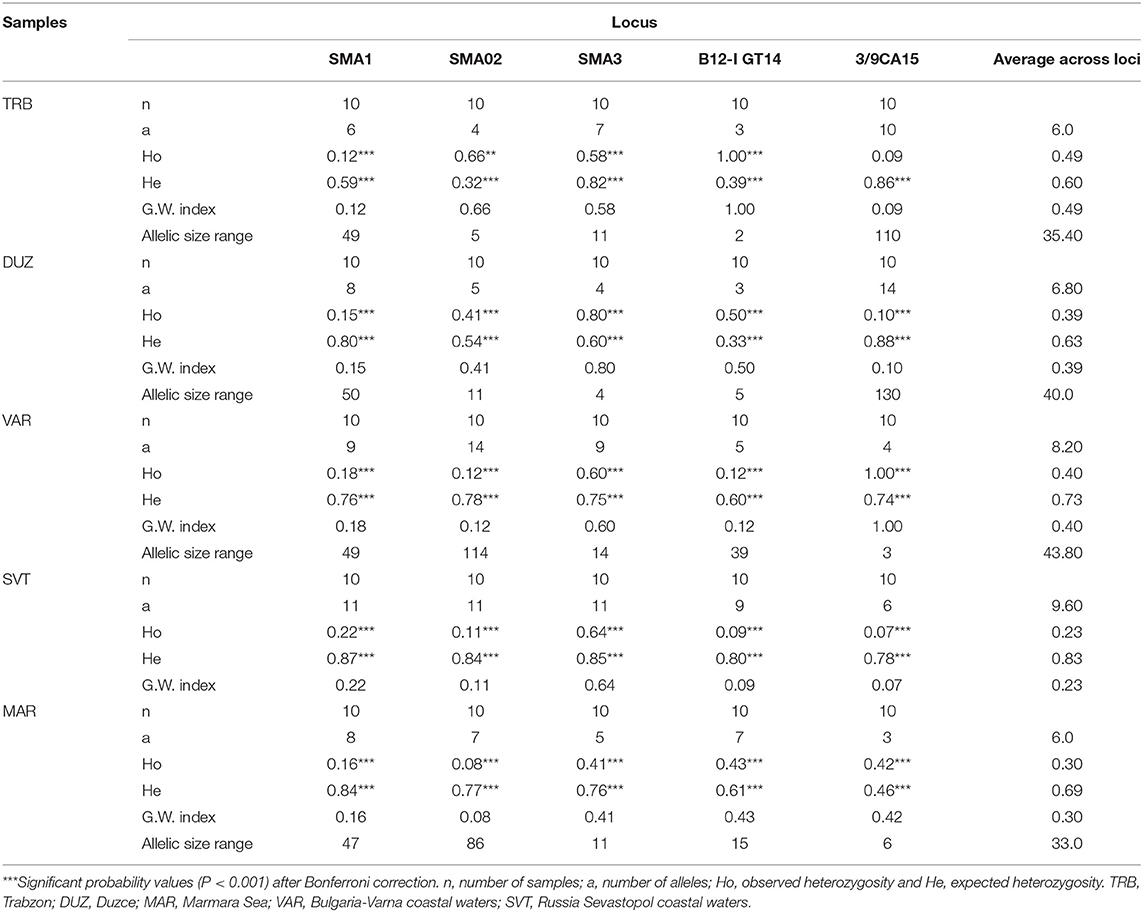
Table 2. Descriptive statistics for five microsatellite loci between the turbot populations.
Average alleles number overall loci ranged from 6.0 at the TRB and MAR populations to 9.60 at the SVT population with an average allele number of 7.32. The Garza-Williamson index was found as the lowest at 3/9CA15 locus in the SVT population, and the highest at B12-I GT14 and 3/9CA15 loci in the TRB and VAR populations, respectively (Table 2). The average GWI across loci was highest at the TRB population and lowest at the SVT population, indicating a possible bottleneck effect.
Genetic diversity values based on microsatellites within populations was the lowest in the TRB population (3.00735). However, the highest genetic diversity was observed in the SVT population (4.17306). Genetic diversity for mtDNA was zero in TRB and DUZ populations (0.0).
The mean pairwise differentiation (FST) within population was found to be the lowest in the Trabzon population and the highest in the Sevastopol population (Table 3). In pairwise comparison of populations, the FST values ranged from 0.08792 to 0.36059 with an average value 0.249246 (Table 3). The Varna and Sevastopol samples showed the lowest genetic distance (0.08792), whereas the Trabzon and Marmara samples showed the highest, 0.36059. The pairwise FST values showed that all samples were significantly distinct from each other (P < 0.001). The Mantel test showed non-significant (P > 0.05, r = 0.43) isolation-by-distance for the geographically separated turbot populations.
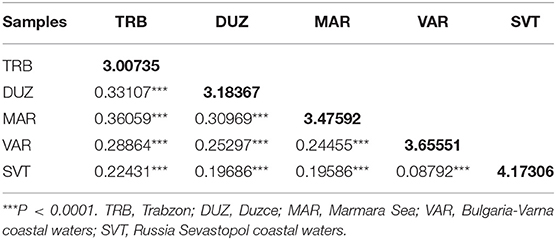
Table 3. Values of microsatellite pairwise FST (below diagonal) and average number of pairwise differences within population (diagonal elements).
Principal component analysis of microsatellite data revealed five principal components (PCs) of which 31 and 24% of genetic variation were presented in the first and second PCs. Plotting the first two PCs (Figure 2) revealed that B12-I GT14 showed highest contribution on population differentiation on the first PC, and Sma02 and Sma03 highly contributed on population differentiation on the second PC. The use of five PCs in DFA revealed overlapping distribution of 95% confidence ellipses of populations (Figure 3). The Russia and Marmara populations were overlapped on all the populations, but the Trabzon and Duzce populations clearly separated from each other.
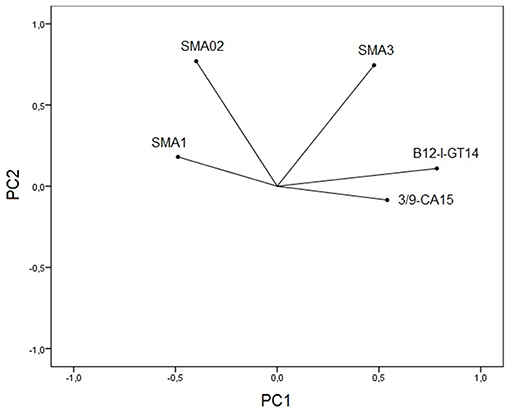
Figure 2. Plotting first two principal component scores shows contribution of five microsatellite loci for population differentiation.
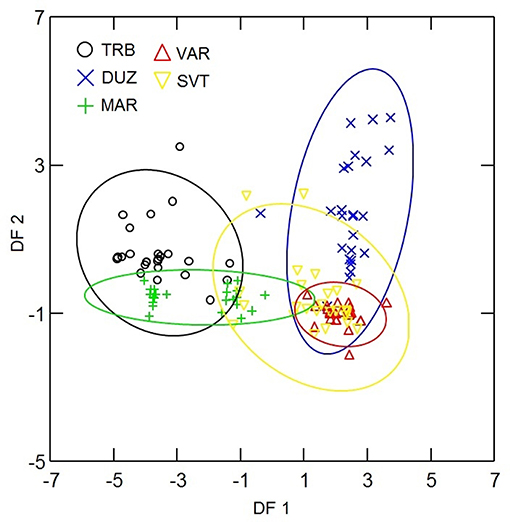
Figure 3. Ninety-five percent confidence ellipses of DFA scores for microsatellite analysis of populations. The abreviations of the samples were given in Figure 1.
On the other hand, the Neighbor-Joining tree demonstrated that population structuring is associated with geographic separations. The Bulgaria and Russia populations were clustered close to each other (Figure 4) while the Marmara Sea population showed the most distinguishing population.
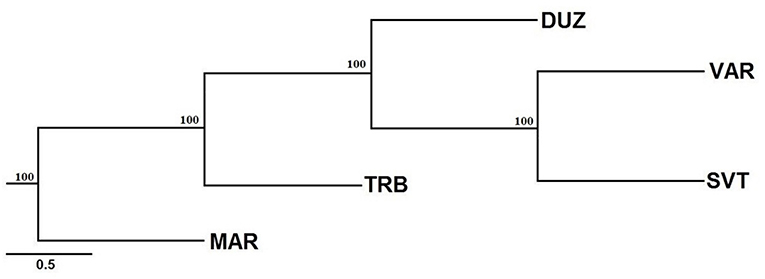
Figure 4. Neighbor-joining tree based on microsatellite variation. Bootstrap values of 1,000 replications are given on nodes in percentages. The abreviations of the samples were given in Figure 1.
mtDNA Sequencing
After alignment, the COIII region consisted of 565 bp fragments which were contained 2 bp parsimony informative sites. The mean composition of nucleotides for thymine (T), cytosine (C), adenine (A), and guanine (G) were as 28.7, 28.6, 23.0, and 20.5%, respectively. Jukes and Cantor model (Jukes and Cantor, 1969) was chosen as the best method for intra and interspecific variations on our dataset after running ModelTest (Posada and Crandall, 1998). DNA sequencing of the COIII exhibited four different haplotypes. The result of mean haplotype diversity between populations was 0.380 (Table 4). The average intra-population genetic diversity was found to be 0.000204. The detected genetic divergence between populations are given in Table 5. Average genetic divergence was found to be 0.00081. According to the NJ tree, Trabzon and Duzce populations clustered together as one group with sister clustering the Sevastopol and Varna, respectively. The Marmara population was different from all other populations (Figure 5). Tajima's D for the populations of S. maximus was found to be 0.045756 (Table 6) which indicate that the expected heterozygosity is lower than that observed.
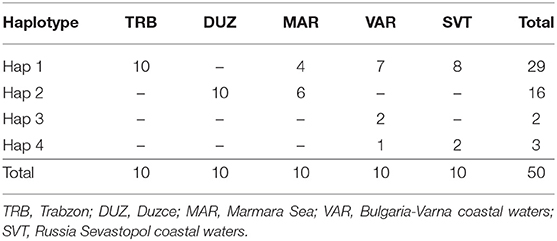
Table 4. Distribution and frequency of COIII haplotypes of S. maximus populations.
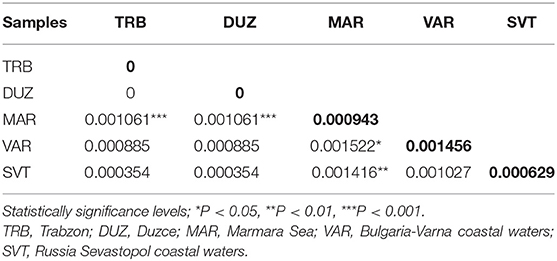
Table 5. Pairwise genetic distance based on sequence analysis of the COIII region between populations of S. maximus (below diagonal), and genetic diversity within samples (transversal diagonal as given in bold).
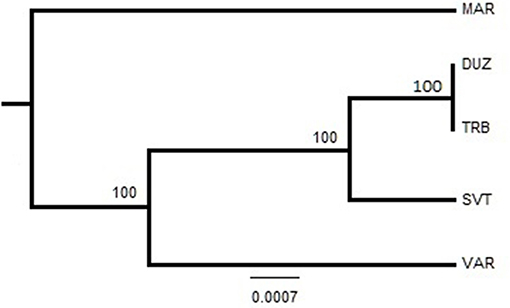
Figure 5. Neighbor-Joining tree based on sequence analysis of the COIII region. Bootstrap values of 1,000 replications are given on nodes in percentages. The abreviations of the samples were given in Figure 1.
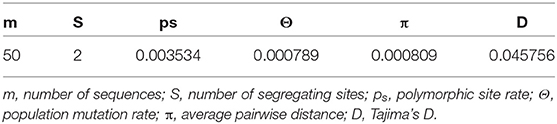
Table 6. Neutrality tests and the estimated parameters of mismatch distribution for populations of S. maximus from Turkish waters.
Discussion
In this study, genetic analysis of S. maximus populations in the Black and Marmara Seas was investigated by using microsatellite and mtDNA sequencing analysis. On the bases of the two molecular markers, S. maximus can be divided into genetically separated populations. For microsatellite analysis, all the geographically separated populations revealed genetic differences from each other. For mtDNA sequencing analysis, only the Marmara Sea (MS) population constitute a genetic unit, while the others comprise genetically different second unit. There is a contradiction between the markers, but the genetic differentiation of the Marmara Sea population was supported by the microsatellite and mtDNA sequencing analyses.
Microsatellite and mtDNA markers indicated that there are restricted gene flows between populations which indicate ongoing processes of genetic differentiation. The Mantel test indicated that the genetic heterogeneity was not related to geographic proximity of the samples for both molecular markers.
Marine species are generally genetically more adaptable than anadromous and freshwater species (DeWoody and Avise, 2000), and therefore, have less genetic differentiation between populations (Ward, 2002). This is thought to mirror their higher effective population size and less restricted migration (DeWoody and Avise, 2000). In the present microsatellite analysis, a total of 108 alleles ranging from 3 to 14 for each locus were detected within the S. maximus populations which were similar to the previous studies (Pardo et al., 2005; Florin and Höglund, 2007; Navajas-Pérez et al., 2012). Karan (2015) examined the number of alleles per locus for S. maeoticus populations and found to be the lowest in the 3/9CA15 locus as four and the highest in Sma1 locus as 11. Rodríguez-Ramilo et al. (2007) observed that allele number of Sma1 locus was eight in S. maximus populations. Moreover, pairwise FST analysis demonstrated that the lowest genetic distance between Sevastopol (SVT) and Varna (VAR) populations for microsatellite (0.08792), whereas mtDNA pairwise genetic differences analysis indicated that the highest genetic distance (0.001522) between the Bulgarian and Marmara populations. Karan (2015) analyzed S. maeoticus populations with microsatellite marker and stated that the lowest genetic distance was between the Duzce and Marmara Sea populations (0.19549), whereas the highest was between the Trabzon and Marmara Sea populations (0.21755). Nielsen et al. (2004) reported that the largest pairwise FST value of S. maximus populations between any of the pooled samples was 0.032 (between North Sea and Northern Baltic Sea) even though there was no significant differentiation between the Northern Baltic and the Southern Baltic samples. Florin and Höglund (2007) reported the highest pairwise FST of P. maxima populations in the Baltic Sea as 0.0156 between the Åland and Gotland populations.
The detected expected and observed heterozygosity in each microsatellite locus of S. maximus populations are also reported by similar studies, having more sample size (from 22 to 48) than that in our study (Liu and Cordes, 2004; Pardo et al., 2005; Florin and Höglund, 2007; Rodríguez-Ramilo et al., 2007; Navajas-Pérez et al., 2012). Karan (2015) reported that expected and observed heterozygosity of S. maeoticus populations varied from 0.64 to 0.88 and from 0.08 to 0.72, respectively.
In the mtDNA sequencing analysis of COIII region, the detected haplotype diversity of S. maximus in our study showed four different haplotypes and was found low. Suzuki et al. (2004) found 28 haplotypes for the phylogeographic analysis of Psetta maxima. Atanassov et al. (2011) detected 36 haplotypes with average haplotypes diversity of 0.47 among Psetta maxima populations from Bulgarian and Romanian in the Black Sea. Karan (2015) identified 10 haplotypes with average haplotype diversity of 0.6345 between S. maeoticus populations from the Trabzon, Duzce and Marmara.
The lowest genetic distance (0.0) was detected between the Duzce and Trabzon populations, and the highest value (0.001522) was found between Bulgarian and Marmara populations based on mtDNA analyses. In the pairwise comparison of the genetic differences of the samples, only the Marmara sample differed significantly from all other samples with different levels of significance (Table 5) which is also supported by NJ tree. However, the pairwise FST and DFA of the microsatellite data indicated genetic separation of Trabzon and Duzce populations (Figure 3), and B12-I GT14 locus plays an important role in this differentiation (Figure 2). Moreover, small sized 95% confidence ellipses of the Bulgarian population also indicate its' very low genetic diversity (Figure 3) that be important for management purposes. Tajima's D (Tajima, 1989) for the S. maximus populations was found to 0.045756, indicating that the observed heterozygosity is higher than that expected (Table 6). The detected rare alleles at low frequencies may indicate that the populations were undergone a balancing selection and sudden population contractions. Karan (2015) found Tajima's D for S. maeoticus populations as−2.114293 which was related to a recent bottleneck effect while the rare alleles were found at high occurrences. The positive and low D value in the present study may indicate low levels of both low and high frequency polymorphisms, indicating a decrease in population size and/or balancing selection for S. maximus.
The overfishing drives the decay of genetic diversity across a wide range of marine fishes (Pinsky and Palumbi, 2014). Reduced population size enhances genetic drift, which in turn causes a higher loss of genetic variability per generation. Increased genetic drift augments the loss of variability and the ability of adaptation (Hauser et al., 2002; Spielman et al., 2004, according to Madduppa et al., 2018). Reductions of genetic diversity in some of the world's most abundant species may lead to a long-term impact of fishing on their evolutionary potential, particularly if abundance remains low and diversity continues to decay (Pinsky and Palumbi, 2014). Therefore, the low genetic diversity observed for both markers may be explained with excessive fishing pressure on Trabzon population and high geographic separation of this population from the other populations which may cause limited interspecific gen flow. Moreover, this case has pointed out possibility of which these populations could have gone through a bottleneck in the recent past.
In the present study, microsatellite and mtDNA results were not congruent to indicate same pattern of differences between the populations which can be explained that mtDNA and microsatellite markers may show different temporal genetic patterns due to differences in their rate and pattern in mutation (Suzuki et al., 2004), and based on the allele frequency distributions, the differences of microsatellite and mtDNA results may be caused by the using of single marker of mtDNA vs. five markers of microsatellite (Larssoni et al., 2009). The results of the present study support restricted gene flow between populations. On the other hand, based on both microsatellite and mtDNA analysis, two major genetic breaks were observed for S. maximus; the TRB, DUZ, the VAR, and SVT populations constitute one genetic unit and the MAR population is the second genetically different unit. Different rates of gene flow, mutation or natural selection of mtDNA and microsatellites also could give rise to greater differentiation of microsatellites than mtDNA. Different parts of mtDNA evolve at different rates, thus different parts of mitochondrial DNA could be considered for future studies to find higher-level population differentiation (Avise, 1992).
The current status of the turbot populations in the Black Sea characterize the stocks as unsustainably exploited and at risk of collapse and “overexploited” and “in overexploitation” (GFCM, 2018). The conservation and sustainability of the turbot populations requires knowledge for the population genetic structure and constant monitoring of its biodiversity. Turbot stock identification and stock boundaries are still not well defined and for the time being the turbot population in the Black Sea is assessed as a single stock (GFCM, 2018). According to the GFCM (2018), an adequate scientific monitoring of the status of turbot and associated species in GSA 29 should be provided. Because, data collection is limited in scope and the national systems in the Black Sea region lack of harmonization, existing gaps (GFCM, 2018) including those covering turbot population-genetic monitoring should be appraised.
The results from the present study show consistency of the detected differentiation that may reflect its temporal and spatial integrity and thus would also require its consideration as separate populations for the fishery management purposes. Based on that, we propose to include the genetic population data analyses as a new indicator of biological monitoring.
Genetic approaches to detect stock structure will continue to be an indispensable part of fisheries management. Some developments in this field will increase the analytical power by boosting sample sizes and numbers of DNA markers. In the future, there is likely to be a shift in emphasis toward greater integration of genetics into multidisciplinary assessments of stock structure (Ovenden et al., 2015). The approaches described in the present paper can be of value to the effective integration of genetic information into the fisheries management decision-making process.
Data Availability Statement
The datasets generated for this study can be found in GenBank with accession numbers MN062299 - MN062348.
Ethics Statement
Ethical review and approval was not required for the animal study, because, the turbot (Scophthalmus maximus) is considered as Vulnerable (VU) under the current IUCN Red List criteria. The species in the Black Sea is under catch quota following the multiannual management plan for turbot fisheries in the Black Sea, approved in 2017 by the General Fisheries Commission for the Mediterranean (GFCM), (COM/2018/710 final). The study was based on landings sampling of species. The tissues needed for genetical analyses were obtained non lethally (e.g., fin clipping) and with minimal handling. No other authorization or ethics board approval was required to conduct the study.
Author Contributions
All authors listed have made a substantial, direct and intellectual contribution to the work, and approved it for publication.
Funding
This research was supported by the Scientific & Technological Research Council of Turkey (TUBITAK-112O920), Bulgarian Academy of Sciences (BAS).
Conflict of Interest
The authors declare that the research was conducted in the absence of any commercial or financial relationships that could be construed as a potential conflict of interest.
References
Atanassov, I., Ivanova, P., Panayotova, M., Tsekov, A., and Rusanov, K. (2011). Mitochondrial control region DNA variation in turbot populations from the Bulgarian and Romanian Black Sea coasts. Biotechnol. Biotechnol. Equip. 25, 2627–2633. doi: 10.5504/BBEQ.2011.0068
Avise, J. C. (1992). Molecular population structure and the biogeographic history of a regional fauna: a case history with lessons for conservation biology. Oikos 63, 62–76. doi: 10.2307/3545516
Bouza, C., Presa, P., Castro, J., Sánchez, L., and Martínez, P. (2002). Allozyme and microsatellite diversity in natural and domestic populations of turbot (Scophthalmus maximus) in comparison with other Pleuronectiformes. Can. J. Fish. Aquat. Sci. 59, 1460–1473. doi: 10.1139/f02-114
Casey, J., Jardim, E., and Martinsohn, J. T. H. (2016). The role of genetics in fisheries management under the E.U. common fisheries policy. J. Fish Biol. 89, 2755–2767. doi: 10.1111/jfb.13151
Cavalli-Sforza, L. L., and Edwards, A. W. (1967). Phylogenetic analysis: models and estimation procedures. Evolution 21, 550–570. doi: 10.1111/j.1558-5646.1967.tb03411.x
Chen, F. F., Ma, C. Y., Yan, L. P., Zhang, H., Wang, W., Zhang, Y., et al. (2017). Isolation and characterization of polymorphic microsatellite markers for the chub mackerel (Scomber japonicus) and cross-species amplification in the blue mackerel (S. australasicus). Genet. Mol. Res. 16:gmr16039712. doi: 10.4238/gmr16039712
DeWoody, J. A., and Avise, J. C. (2000). Microsatellite variation in marine, freshwater and anadromous fishes compared with other animals. J. Fish Biol. 56, 461–473. doi: 10.1111/j.1095-8649.2000.tb00748.x
Dulvy, N. K., Sadovy, Y., and Reynolds, J. D. (2003). Extinction vulnerability in marine populations. Fish Fish. 4, 25–64. doi: 10.1046/j.1467-2979.2003.00105.x
EC (2013). REGULATION (EU) No 1380/2013 OF THE EUROPEAN PARLIAMENT AND OF THE COUNCIL of 11 December 2013 on the Common Fisheries Policy, Amending Council Regulations (EC) No 1954/2003 and (EC) No 1224/2009 and repealing Council Regulations (EC) No 2371/2002 and (EC) No 639/2004 and Council Decision 2004/585/EC. Brussels.
Estoup, A., Gharbi, K., SanCristobal, M., Chevalet, C., Haffray, P., and Guyomard, R. (1998). Parentage assignment using microsatellites in turbot (Scophthalmus maximus) and rainbow trout (Oncorhynchus mykiss) hatchery populations. Can. J. Fish. Aquat. Sci. 55, 715–725. doi: 10.1139/f97-268
Excoffier, L., and Lischer, H. E. (2010). Arlequin suite ver 3.5: a new series of programs to perform population genetics analyses under Linux and Windows. Mol. Ecol. Res. 10, 564–567. doi: 10.1111/j.1755-0998.2010.02847.x
FAO (2018). The State of Mediterranean and Black Sea Fisheries. Rome: General Fisheries Commission for the Mediterranean.
Florin, A. B., and Höglund, J. (2007). Absence of population structure of turbot (Psetta maxima) in the Baltic Sea. Mol. Ecol. 16, 115–126. doi: 10.1111/j.1365-294X.2006.03120.x
Gaggiotti, O. E., Lange, O., Rassmann, K., and Gliddon, C. (1999). A comparison of two indirect methods for estimating average levels of gene flow using microsatellite data. Mol. Ecol. 8, 1513–1520. doi: 10.1046/j.1365-294x.1999.00730.x
Garza, J. C., and Williamson, E. G. (2001). Detection of reduction in population size using data from microsatellite loci. Mol. Ecol. 10, 305–318. doi: 10.1046/j.1365-294x.2001.01190.x
Hauser, L., Adcock, G. J., Smith, P. J., Bernal Ramiréz, J. H., and Carvalho, G. R. (2002). Loss of microsatellite diversity and low effective population size in an overexploited population of New Zealand snapper (Pagrus auratus). Proc. Natl. Acad. Sci. U.S.A. 99, 11742–11747. doi: 10.1073/pnas.172242899
Hurst, C. D., Bartlett, S. E., Davidson, W. S., and Bruce, I. J. (1999). The complete mitochondrial DNA sequence of the Atlantic salmon, Salmo salar. Gene 239, 237–242. doi: 10.1016/S0378-1119(99)00425-4
IUCN (2019). The IUCN Red List of Threatened Species. Version 2019-2. http://www.iucnredlist.org.
Ivanov, L., and Beverton, R. J. H. (1985). The fisheries resources of the Mediterranean, Part 2: Black Sea, GFCM. Stud. Rev. 60:135.
Iyengar, A., Piyapattanakorn, S., Stone, D. M., Heipel, D. A., Howell, B. R., Baynes, S. M., et al. (2000). Identification of microsatellite repeats in turbot (Scophthalmus maximus) and Dover sole (Solea solea) using a RAPD-based technique: characterization of microsatellite markers in Dover sole. Mar. Biotechnol. 2, 49–56. doi: 10.1007/s101269900007
Iyengar, B., Roote, J., and Campos, A. R. (1999). The tamas gene, identified as a mutation that disrupts larval behavior in Drosophila melanogaster, codes for the mitochondrial DNA polymerase catalytic subunit (DNApol-γ125). Genetics 153, 1809–1824.
Jukes, T. H., and Cantor, C. R. (1969). “Evolution of protein molecules,” in Mammalian Protein Metabolism, ed. H. N. Munro (New York, NY: Academic), 121–132.
Karahana, A., Borsab, P., Gucua, A. C., Kandemirc, I., Ozkand, E., Oreka, Y. A., et al. (2014). Geometric morphometrics, Fourier analysis of otolith shape, andnuclear-DNA markers distinguish two anchovy species (Engraulis spp.) in the Eastern Mediterranean Sea. Fish. Res. 159:45–55 doi: 10.1016/j.fishres.2014.05.009
Karan, S. (2015). Evaluation of Molecular and Phenotypic Markers for Phylogeographic Analysis of Black Sea Turbot Scopthalmus maeoticus (Master's thesis), Mustafa Kemal University, Hatay, Turkey.
Karapetkova, M. (1980). Distribution and Migration of the Turbot Along the Bulgarian Coast of the Black Sea. Sofia: Bulletin de L'Institut de Zoologire et Musee, Tome XVI (in Bulgarian).
Larssoni, L. C., Charlier, J., Laikre, L., and Ryman, N. (2009). Statistical power for detecting genetic divergence–organelle versus nuclear markers. Conserv. Genet. 10, 1255–1264. doi: 10.1007/s10592-008-9693-z
Liu, Z. J., and Cordes, J. F. (2004). DNA marker technologies and their applications in aquaculture genetics. Aquaculture 238, 1–37. doi: 10.1016/j.aquaculture.2004.05.027
Madduppa, H. H., Timm, J., and Kochzius, M. (2018). Reduced genetic diversity in the clown anemonefish Amphiprion ocellaris in exploited reefs of apermonde Archipelago, Indonesia. Front. Mar. Sci. 5:80. doi: 10.3389/fmars.2018.00080
Mantel, N. (1967). Ranking procedures for arbitrarily restricted observation. Biometrics 23, 65–78. doi: 10.2307/2528282
Navajas-Pérez, R., Robles, F., Molina-Luzón, M. J., De La Herran, R., Álvarez-Dios, J. A., Pardo, B. G., et al. (2012). Exploitation of a turbot (Scophthalmus maximus L.) immune- related expressed sequence tag (EST) database for microsatellite screening and validation. Mol. Ecol. Res. 12, 706–716. doi: 10.1111/j.1755-0998.2012.03126.x
Nielsen, E. E., Nielsen, P. H., Meldrup, D., and Hansen, M. M. (2004). Genetic population structure of turbot (Scophthalmus maximus L.) supports the presence of multiple hybrid zones for marine fishes in the transition zone between the Baltic Sea and the North Sea. Mol. Ecol. 13, 585–595. doi: 10.1046/j.1365-294X.2004.02097.x
Nikolov, V., Ivanova, P., Dzhembekova, N., Panayotova, M., Raykov, V., and Dobrovolov, I. (2015). Application of allozyme markers for screening of turbot populations along Western Black Sea coast. ZooNotes 79, 1–15.
Ovenden, J. R., Berry, O., Welch, D. J., Buckworth, R. C., and Dichmont, C. M. (2015). Ocean's eleven: a critical evaluation of the role of population, evolutionary and molecular genetics in the management of wild fisheries. Fish Fish. 16, 125–159. doi: 10.1111/faf.12052
Pardo, G. B., Casas, L., Fortes, G. G., Bouza, C., Martínez, P., Clark, M. S., et al. (2005). New microsatellite markers in turbot (Scophthalmus maximus) derived from an enriched genomic library and sequence databases. Mol. Ecol. Notes 5, 62–64. doi: 10.1111/j.1471-8286.2004.00834.x
Pinsky, M. L., and Palumbi, S. R. (2014). Meta-analysis reveals lower genetic diversity in overfished populations. Mol. Ecol. 23, 29–39. doi: 10.1111/mec.12509
Posada, D., and Crandall, K. A. (1998). Modeltest: testing the model of DNA substitution. Bioinformatics 14, 817–818. doi: 10.1093/bioinformatics/14.9.817
Rice, W. R. (1989). Analyzing tables of statistical tests. Evolution 43, 223–225. doi: 10.1111/j.1558-5646.1989.tb04220.x
Rodríguez-Ramilo, S. T., Toro, M. A., Caballero, A., and Fernández, J. (2007). The accuracy of a heritability estimator using molecular information. Conserv. Genet. 8, 1189–1198. doi: 10.1007/s10592-006-9273-z
Saitou, N., and Nei, M. (1987). The neighbor-joining method: a new method for reconstructing phylogenetic trees. Mol. Biol. Evol. 4, 406–425.
Sambrook, J., Fritsch, E. F., and Maniatis, T. (1989). Molecular Cloning: A Laboratory Manual, 2nd Edn. Cold Spring Harbor, NY: Cold Spring Harbor Laboratory Press.
Sanger, F., Nicklen, S., and Coulson, A. R. (1977). DNA sequencing with chain-terminating inhibitors. PNAS 74, 5463–5467. doi: 10.1073/pnas.74.12.5463
Spielman, D., Brook, B. W., and Frankham, R. (2004). Most species are not driven to extinction before genetic factors impact them. Proc. Natl. Acad. Sci. U.S.A. 101, 15261–15264. doi: 10.1073/pnas.0403809101
Suzuki, N., Nishida, M., Yoseda, K., Ustundag, C., Sahin, T., and Amaoka, K. (2004). Phylogeographic relationships within the Mediterranean turbot inferred by mitochondrial DNA haplotype variation. J. Fish Biol. 65, 580–585. doi: 10.1111/j.0022-1112.2004.00433.x
Tajima, F. (1989). Statistical method for testing the neutral mutation hypothesis by DNA polymorphism. Genetics 123, 585–595.
Tamura, K., Peterson, D., Peterson, N., Stecher, G., Nei, M., and Kumar, S. (2011). MEGA5: molecular evolutionary genetics analysis using maximum likelihood, evolutionary distance, and maximum parsimony methods. Mol. Biol. Evol. 28, 2731–2739. doi: 10.1093/molbev/msr121
Turan, C., Ivanova, P., Gurlek, M., Yaglioglu, D., Erguden, D., Karan, S., et al. (2019). Phylogenetic relationships of turbot species (Scophthalmidae) inferred from the mitochondrial COIII gene and morphological characters. NESciences 4, 28–41. doi: 10.28978/nesciences.522593
Turan, C., Ozturk, B., Erguden, D., Gurlek, M., Yaglioglu, D., and Uygur, N. (2007). “Atlas of marine bony fishes of Turkey,” in Atlas of Marine Bony Fishes of Turkey, ed C. Turan (Adana: Nobel Publishing House), 83–485.
Valles-Jiménez, R. (2005). Estudios sobre la estructura genética del camarón blanco (Litopenaeus vannamei), del Pacífico Oriental inferidos del análisis de microsatélites y ADN mitocondrial (Ph.D. thesis). Centro de Investigaciones Biológicas Del Noroeste, S.C., Mexico.
Keywords: mtDNA, microsatelite, turbot, Scophthalmus maximus, population genetics
Citation: Turan C, Ivanova PP, Raykov VS, Gurlek M, Erguden D, Yaglioglu D, Karan S, Dogdu SA, Uyan A, Ozturk B, Nikolov V, Dobrovolov I, Khanaychenko A and Giragosov V (2019) Genetics Structure Analysis of Turbot (Scophthalmus maximus, Linnaeus, 1758) in the Black and Mediterranean Seas for Application of Innovative Management Strategies. Front. Mar. Sci. 6:740. doi: 10.3389/fmars.2019.00740
Received: 29 May 2019; Accepted: 13 November 2019;
Published: 28 November 2019.
Edited by:
Ivan Viegas, University of Coimbra, PortugalReviewed by:
Türker Bodur, Akdeniz University, TurkeyYusuf Bektaş, Recep Tayyip Erdoğan University, Turkey
Copyright © 2019 Turan, Ivanova, Raykov, Gurlek, Erguden, Yaglioglu, Karan, Dogdu, Uyan, Ozturk, Nikolov, Dobrovolov, Khanaychenko and Giragosov. This is an open-access article distributed under the terms of the Creative Commons Attribution License (CC BY). The use, distribution or reproduction in other forums is permitted, provided the original author(s) and the copyright owner(s) are credited and that the original publication in this journal is cited, in accordance with accepted academic practice. No use, distribution or reproduction is permitted which does not comply with these terms.
*Correspondence: Cemal Turan, dHVyYW5jZW1hbEB5YWhvby5jb20=
†Deceased