- 1Laboratory of Molecular Ecology, Genomics, and Evolutionary Studies, Department of Biology, University of Santiago de Chile, Santiago, Chile
- 2Facultad de Medicina, Centro de Investigación Biomédica, Universidad Diego Portales, Santiago, Chile
- 3Fish Vet Group, Puerto Montt, Chile
- 4Instituto de Ciencias Marinas y Limnológicas, Fondap-IDEAL, Universidad Austral de Chile, Valdivia, Chile
- 5Seabass Chile, Puerto Montt, Chile
Patagonian toothfish (Dissostichus eleginoides) is a hefty notothenioid fish and a key species within the marine ecosystem with a high migratory capacity across sub-Antarctic and south American Pacific oceans. Transcriptome characterization and molecular markers associated with micro and macro-evolutionary studies are not available, which in turn limits the gain of knowledge about the genetic basis of this species. Therefore, in the present study, a de novo transcriptome from eight tissue and an embryonic state of Patagonian toothfish was developed, using the Illumina Hiseq 4000 platform. A total of 233,424 superTranscripts were assembled and 37,446 annotated against public databases. Moreover, we identified 71,107 expressed sequence tag-simple sequence repeats (EST-SSRs), with an average number of 0.3 SSRs per superTranscripts and one SSR per 1.12 kB. The most abundant SSR type was repeated dinucleotide (53.67%), followed by trinucleotide (13.73%) repeats. From the total of EST-SSRs identified, 34,196 primer pairs were properly designed and a subset of 25 immune loci were selected for its evaluation as potential EST-SSR population markers. Of this subset, 11 proved to have good technical features and were evaluated in 64 animals from four Patagonian toothfish populations. A number of 63 alleles were identified, with a mean of 4.9 alleles per locus and a polymorphism information content ranging from 0.224 to 0.591, with a mean of 0.50. Significant (FST, range 0.082–0.117 and , range 0.069–0.291) genetic differentiation (P < 0.05) was determined among the populations analyzed. Therefore, the results presented here represent a relevant genetic resource for biological studies on evolution, conservation, genetic diversity, population structure, and genetic management of breeding stocks of this important species.
Introduction
Patagonian toothfish (Dissostichus eleginoides) is a relevant member of the family Nototheniidae. Its distribution is fundamentally sub-Antarctic, inhabiting the southern shelves and slopes of South America and around the sub-Antarctic islands of the Southern Ocean (between latitudes 10°S – Peruvian coasts – up to 75°S – in the Ross Sea) (Collins et al., 2010; Aramayo, 2016). The geographical distribution of Patagonian toothfish implies that this species has an important potential to bear a wide range of temperature and oxygen concentration. Besides, because of its size and nutritional features, it is an edible species with significant economic values, both in the domestic markets and abroad (Grilly et al., 2015). Furthermore, the biological characteristics of Patagonian toothfish such as a long-life span, a delayed onset of reproductive maturity and a relatively small numbers of eggs, make it highly vulnerable to overfishing. In fact, the fishery of this species is categorized – depending of the nation – from exhausted to regulated (Marko et al., 2011; Reyes et al., 2012; Subpesca, 2018).
Currently, it is widely accepted that the application of genetic knowledge is essential for the conservation and sustainable use of natural resources (Supple and Shapiro, 2018). However, and in contrast with the ecological, evolutionary, and economic importance of this species, the number of studies focused on the evaluation of genetic aspects of Patagonian toothfish are limited and isolated (Smith and McVeagh, 2000; Shaw et al., 2004; Rogers et al., 2006; Toomey et al., 2016; Canales-Aguirre et al., 2018). These studies have used either mitochondrial DNA or a very limited number of microsatellite (simple sequence repeat, SSR) markers. The constant interaction of metazoans with the dynamic environmental implicates the presence of several behavioral and physiological phenotypes (Kültz et al., 2013), which are developed in a short period and dependent on genetic variants among populations. Therefore, a clear conclusion suggested by several authors is that both approaches, population genetics and transcriptomic, will be very successful in the area of conservation of natural resources (Huete-Pérez and Quezada, 2013; He et al., 2016; Connon et al., 2018; Filho, 2018). In this context, an evident reason for the limitation of population genetics and functional transcriptome studies in Patagonian toothfish is the scarce number of genetic resources developed for this species (Garcia et al., 2019). In the field of genetics and molecular biology, high-throughput sequencing (HTS) technologies are a fundamental tool that permits the sequencing of genomes and transcriptomes of any organism in an efficient fashion (Seeb et al., 2011). RNA-seq is considered one of the most used strategies of HTS technology for transcriptome sequencing and the discovery of molecular markers associated, such as SSRs. SSRs are the most widely used molecular markers in population genetic studies, because of their high levels of polymorphism and codominance (Li et al., 2002). Normally, SSR markers can be divided into genomic SSRs (gSSR), associated with arbitrary genomic sequences and expressed sequence tag (EST) SSRs, associated with transcribed RNA sequences (Chistiakov et al., 2006).
In the present study, we conducted transcriptome analysis using various tissues of Patagonian toothfish via the Illumina sequencing platform. The transcriptomic reads were de novo assembled and annotated, and immune-associated EST-SSR markers were developed. The immune system is a key component of micro and macro-evolutionary process of a species; therefore, concentrating on immune-associated markers will provide valuable features on a population study (Avtalion and Clem, 1998; Bowden, 2008; Rouge, 2016). Concretely, the aims of this investigation were (1) to characterize the transcriptome of Patagonian toothfish and (2) to develop immune-associated EST-SSR markers and examine its level of polymorphism and utility as population markers. Our results would be very useful for future studies on genomics, evolution, conservation, genetic diversity, and population structure of Patagonian toothfish.
Materials and Methods
RNA Extraction, cDNA Library, and High-Through Sequencing
Four adult individuals of Patagonian toothfish were obtained from commercial fisheries (56°25′92.0″S, 70°16′91.0″W). Total RNA was extracted from eight tissue (muscle, gills, heart, kidney, liver, testicle, ovary, and spleen) of each of the individual sampled and from four independent embryonic state – morula – obtained from Chilean Seabass Aquaculture Company1, using Trizol (Invitrogen, CA, United States) and RNeasy Mini kit (Qiagen, United States), according to the manufacturer’s instructions. All the RNA extracts were quantified using the Qubit 3.0 Fluorometer (Life Technologies, CA, United States), with the Qubit RNA Assay kit and the Bioanalyzer 2100 system, using the RNA Nano 6000 Assay Kit (Agilent Technologies, CA, United States), in order to determining RNA purity, concentration, and RNA integrity number (RIN). The individual extracted RNAs (total 36) (RIN > 8.5 and A260/A280 ratio = 1.8–2.0) were pooled according to each of the tissues and embryonic state analyzed, amounting nine pooled RNAs. Five micrograms of each pool was used for the step of library construction using the TruSeq RNA Library Prep Kit (Illumina). The nine libraries were sequenced on the HiSeq 4000 platform with 150 paired-end cycles.
De novo Assembly
The quality of the sequences of each library was evaluated using the FastQC v-0.11.6 (Andrews, 2010) software. Trimmomatic v-0.38 software (Bolger et al., 2014) (with a Q-value of ≥30) was used to low-quality sequence filtering, elimination, and filtering of reads <100 bp. Most sequences (>85%) were of high quality. Sequences filtered from all the tissues were used as input to generate a single reference transcriptome. Initially, transcripts were assembled with Trinity v-2.7.0 (Grabherr et al., 2011), using default parameters. Then, a clusterization of highly similar transcripts was performed with CD-Hit v-4.7 (Li and Godzik, 2006). Finally, a single linear representation of the transcriptome was constructed generating superTranscripts (Davidson et al., 2017).
Functional Annotation
The superTranscripts annotation obtained was carried out through local alignments with the Basic Local Alignment Search Tool (BLAST) program (Camacho et al., 2009), against the non-redundant (NR) protein database of the National Center for Biotechnology Information (NCBI) (O’Leary et al., 2016), the UniProtKB, and SwissProt database (Consortium, 2017), with an expected E-value of 1 × E–6. To validate the assembly quality of the superTranscripts obtained, we used QUAST v-5.0.2 (Gurevich et al., 2013), BUSCO (Benchmarking Universal Single-Copy Orthologs) v-2.0 (eukaryota_odb9 lineage) (Waterhouse et al., 2017), and DOGMA (Domain-Based General Measure for Transcriptome and Proteome Quality Assessment) v-3.4 (Dohmen et al., 2016). To know the functional roles of the protein-coding genes list obtained, an enrichment analysis was performed on Gene Ontology (GO) terms and Kyoto Encyclopedia of Genes and Genomes (KEGG) pathways with ShinyGO v-0.512 and KOBAS v-3.0 (Chen et al., 2011), respectively. GO terms and KEGG pathways were considered significant with a Benjamini and Hochberg correction of false discovery rate (FDR) < 0.05.
Patterns of Gene Tissue Expression
To categorize the expression patterns of each tissue analyzed a principal component analysis (PCA) was performed with the pcaExplorer package in R (Marini and Binder, 2019) with superTranscripts read counts normalized to fragments per kilobase of exon per million reads mapped (FPKM) (Trapnell et al., 2010). Only superTranscripts with ≥1 FPKM were considered. Moreover, to gain insights about Patagonian toothfish gene expression tissue-specificity, the specific measure (SPM) concept (Xiao et al., 2010) was applied. Genes tissue-specific was defined as those with FPKM ≥ 1 and SPM > 0.9.
Identification of EST-SSRs
Identification of EST-SSRs in Patagonian toothfish superTranscripts was predicted using the Perl script MIcroSAtellite identification tool (MISA)3, with default parameters (Thiel et al., 2003) and with the following search criteria: (i) dinucleotide repeats ≥6 and (ii) trinucleotide to hexanucleotide repeats ≥5.
Sample Collection and Processing for Fragment Analysis
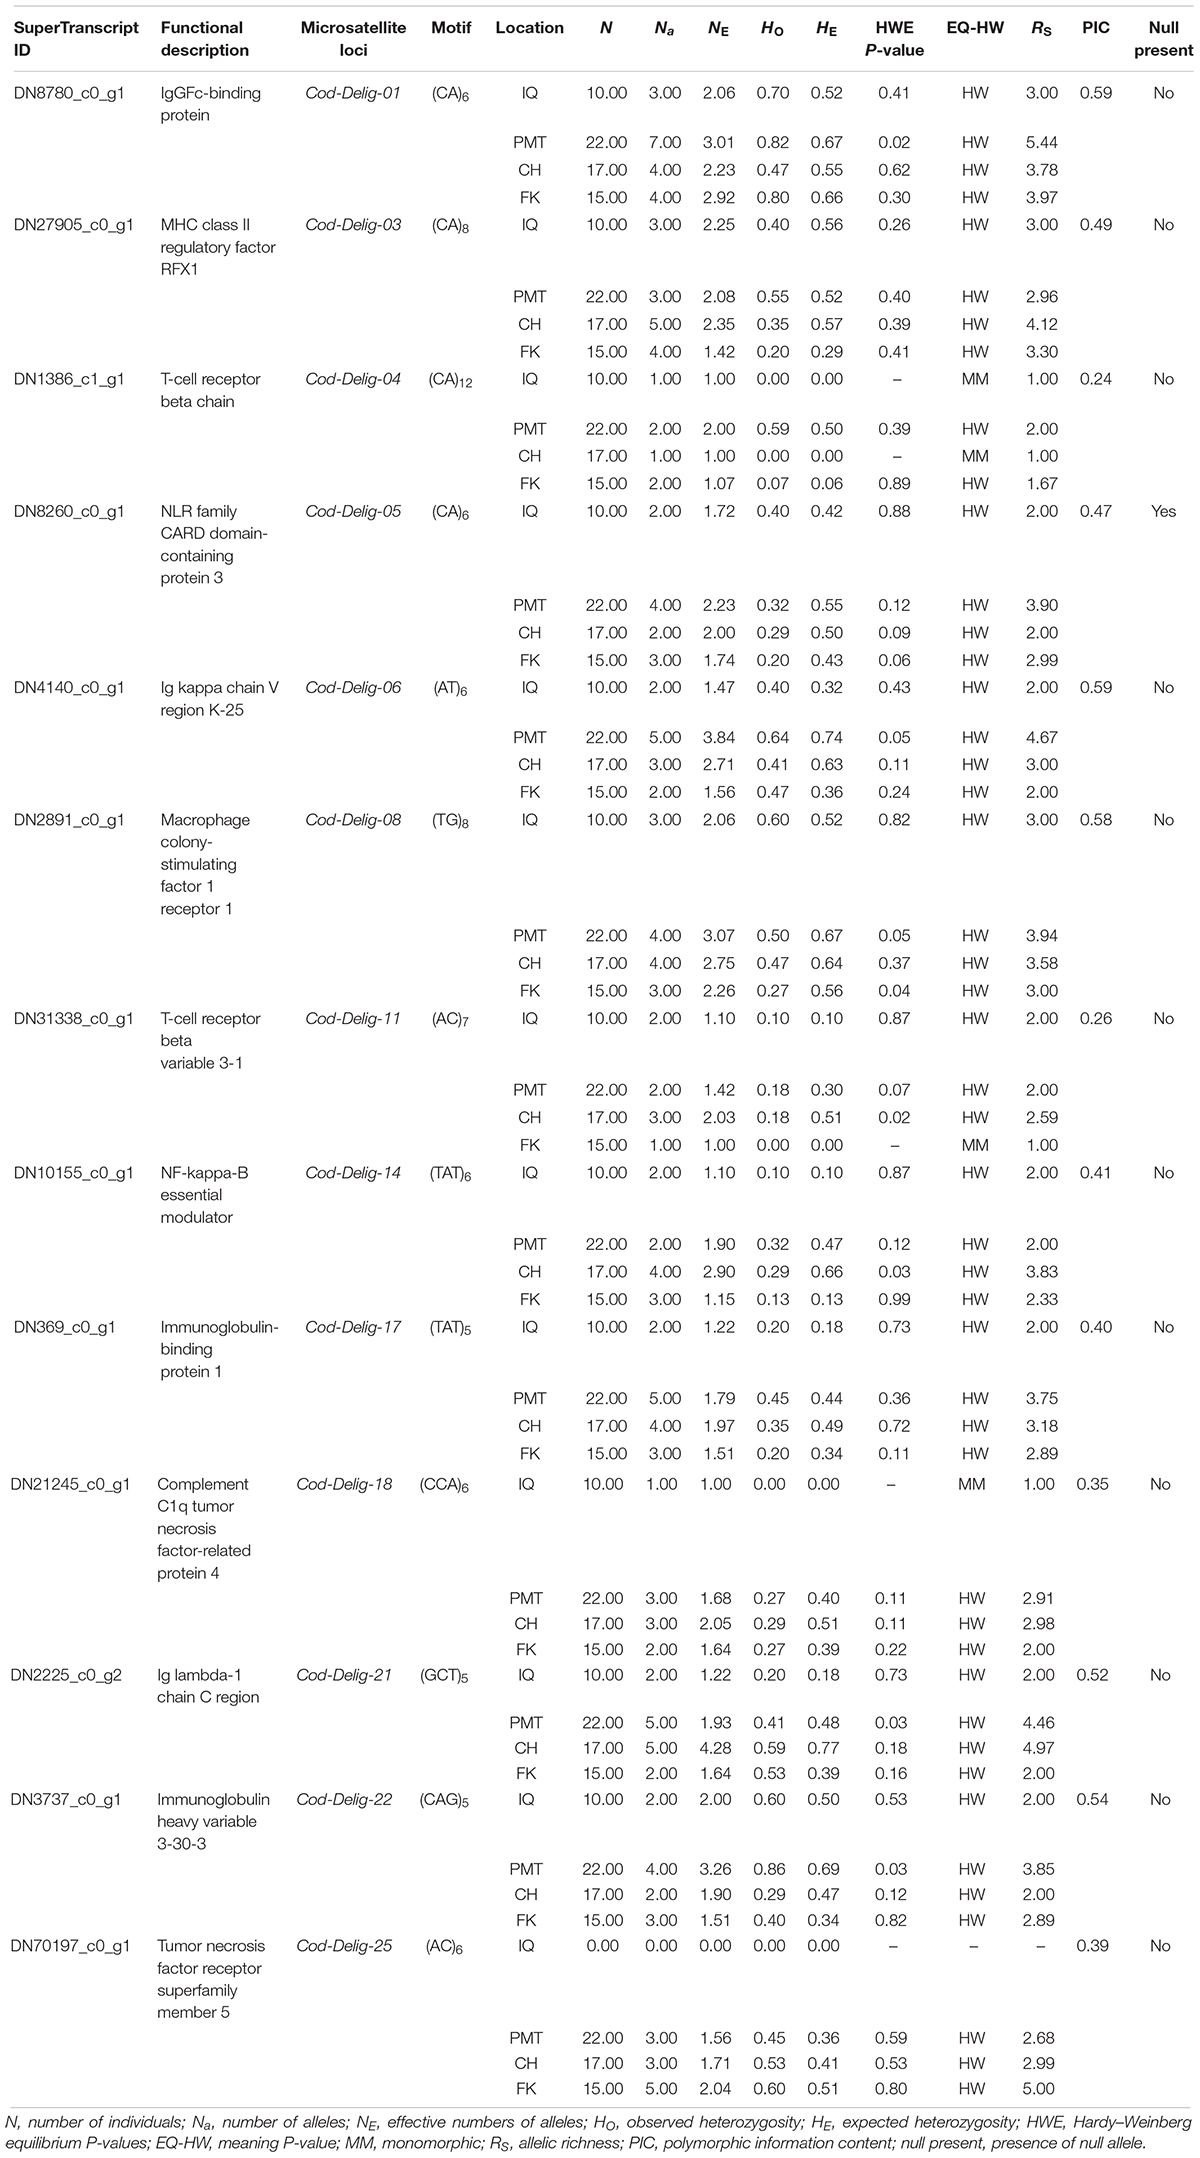
To evaluate polymorphism and assess the genetic diversity of each locus, we collected 64 muscle samples of adult Patagonian toothfish from four populations: Iquique (IQ), Puerto Montt (PMT), Cape Horn (CH), and Falkland Island (FK) (Table 1). All of the samples were gathered through commercial fisheries. Total DNA was isolated using a phenol–chloroform extraction protocol (Sun, 2010) and quantified using the Qubit® 20 (Invitrogen, CA, United States) fluorometric method and its quality was assessed with horizontal-agarose electrophoresis.

Table 1. Geographical coordinates and number of individuals sampled in four Patagonian toothfish populations.
PCR and Fragment Analysis
Primer 3 software was used for the design of primers for EST-SSRs (Koressaar and Remm, 2007; Untergasser et al., 2012). From the total of SSRs identified with properly designed primers (34,196) a subset of SSRs, associated with immune genes, was selected for its evaluation as potential EST-SSR population markers. This subset of immunological genes were selected from all the superTranscripts annotated that contained the GO term “immune system process” (GO:0002376). Then, the matched immunological genes were ranked according to its proper primer thermodynamic features (such as GC content, length, melting temperature, secondary structures, etc.). The top 25 SSRs primers were selected to be synthesized. For these SSRs, the reverse primers were synthesized with a pigtail (5′-GTTTCTT-3′) to minimize stutter and the forward primers included an extra 21 bp tail-sequence (5′-GCCTCGTTTATCAGATGTGGA-3′). A third primer, with the 21 bp 5′-tail sequence, was labeled with 6-FAM fluorescent dye. PCR amplifications were conducted in 20 μl reaction including 0.2 μM of both forward-6′-FAM and universal-forward primers, and 0.1 μM of reverse primer. 0.5 mg/ml of BSA, 2 U of Paq5000 DNA polymerase, and 0.5 ng/μl of sample DNA. PCR was designed with initial denaturation at 94°C for 5 min, followed by 30 cycles of 40 s at 94°C denaturation, 40 s at 58°C annealing, 30 s at 72°C extension, followed by 8 cycles of 40 s at 94°C denaturation, 40 s at 54°C annealing, 30 s at 72°C extension, and a final extension of 10 min at 72°C. PCR products were processed for fragment analysis using 600Liz standard in a SeqStudio Genetic Analyzer (Applied BiosystemsTM). Fsa data with peak values were processed and analyzed in Genemarker v-2.4 from SoftGenetics, Inc. (State College, PA, United States).
Statistical Data Analysis
Initially, MICRO-CHECKER v-2.2.3 program (Van Oosterhout et al., 2004) (with 1,000 randomizations) was utilized to evaluate the presence of PCR artifacts (e.g., large allele dropout, stuttering) for each EST-SSRs locus. The frequency of null alleles, per locus and population, was obtained with FreeNA (Chapuis and Estoup, 2006), using 25,000 replicates. Canonical population-level parameters, including observed (HO) and expected (HE) heterozygosities, number of alleles per locus, deviations from the Hardy–Weinberg equilibrium (HWE), and linkage equilibrium (LE) were obtained utilizing the program GENEPOP v-1.1.2 in R (Rousset, 2008). Significance values of HWE and LE were adjusted with Myriads (Carvajal-Rodríguez, 2017), using the Benjamini–Hochberg correction (Benjamini, 2010). The mean polymorphic information content (PIC) per locus were obtained with CERVUS v-3.0.3 (Kalinowski et al., 2007). The sample size normalized measure of genetic diversity, allelic richness (Rs), was obtained using FSTAT v-2.9.3.2 (Goudet, 1995). To evaluate the variation of the levels of genetic diversity (Rs and HE) among the populations sampled, a Kruskal–Wallis test was realized in R (R Core Team, 2016) (P < 0.05).
Selection Data Analysis
To test the presence of selection across our EST-SSRs markers, the software BayeScan v-2.1 (Foll and Gaggiotti, 2008) was utilized. Default chain parameters were used, with 60,000 iterations and a value of 10 prior odds for the neutral model with 5% of FDR.
Population Genetic Structure Analysis
The potential relatedness among individuals can bias the results of population structure analysis (Wang, 2018); therefore, we used COANCESTRY50 (Wang, 2011) with the Wang estimator (Wang, 2017) to determinate the possible relationship among the Patagonian toothfish animals sampled. Pairwise genetic contrast among individuals from IQ, PMT, CH, and FK were evaluated using two statistical methods: (i) pairwise FST (Weir and Cockerham, 1984) estimated with GENEPOP v-1.1.2 in R (10,000 replicates) and (ii) pairwise (Hedrick, 2005) estimated with the R package mmod4. Moreover, to determine the most probable number of genetically distinct clusters (populations), the individual-based Bayesian clustering software STRUCTURE v-2.3.4 (Pritchard et al., 2000) was utilized with the following parameters: (i) 10 runs per each assumed K-value (K = 1–5), (ii) each run encompassed a total of 50,000 MCMC iterations, including 5,000 burn-in iterations, and (iii) admixture, correlated allele frequencies, and location prior models incorporated. The software CLUMPAK v-1.1 (default setting) (Kopelman et al., 2015) was used to evaluate the STRUCTURE results and estimate the best K, utilizing the Evanno (Evanno et al., 2005) and Pritchard (Pritchard et al., 2000) methods.
Data Records
Transcriptome data and assembly sequence file was deposited in the NCBI Sequence Read Archive (SRA) database5 and GenBank6, respectively.
Results
Transcriptome Sequencing and Functional Annotation
A total of 1,354,663,698 raw reads were generated by Illumina sequencing. After removing low-quality sequences, sequence size filtering, and adapter elimination, 875,285,006 clean reads were obtained. A total of 233,424 superTranscripts were produced with an average length of 743 nt, N50 of 1,434 nt, and a total length of 173 Mb. About 16% of the superTranscripts (37,446) were aligned to the protein databases NR at NCBI, SwissProt, and UniProt (Table 2 and Supplementary Table S1). Most of the superTranscripts annotated (67.97%) matched to teleost fish, such as Notothenia coriiceps (4,758, 12.71%), Danio rerio (4,047, 10.81%), and Oncorhynchus mykiss (2,068, 5.52%) (Figure 1 and Supplementary Table S2). The completeness assessment of the reference transcriptome assembled, using the pipelines of BUSCO and DOGMA, showed coverage of 78.92% of essential eukaryotic genes (Table 3) and 83.26% of conserved domains arrangements, respectively. Additionally, on average the 88.08% of the reads were back mapped to the reference transcriptome. A total of 37,446 superTranscripts were annotated to 1,285 GO classification terms. The GO enrichment analysis of these revealed that regulation of biological processes, response to stimulus, and biological regulation were the most abundant significantly enriched categories of biological process. To the cellular component category, the most abundant significantly enriched categories were cell, cell component, and organelle. In the case of the molecular function category, cellular process, multicellular organismal process, and developmental process were the most abundant (Figure 2). An enrichment analysis of KEGG metabolic pathway showed that a total of 227 statistically enriched pathways were detected. The top five KEGG pathways, with the highest number of members annotated, matched to metabolic pathways, axon guidance, tight junction, pathways in cancer, and MAPK signaling pathway (Supplementary Table S3).
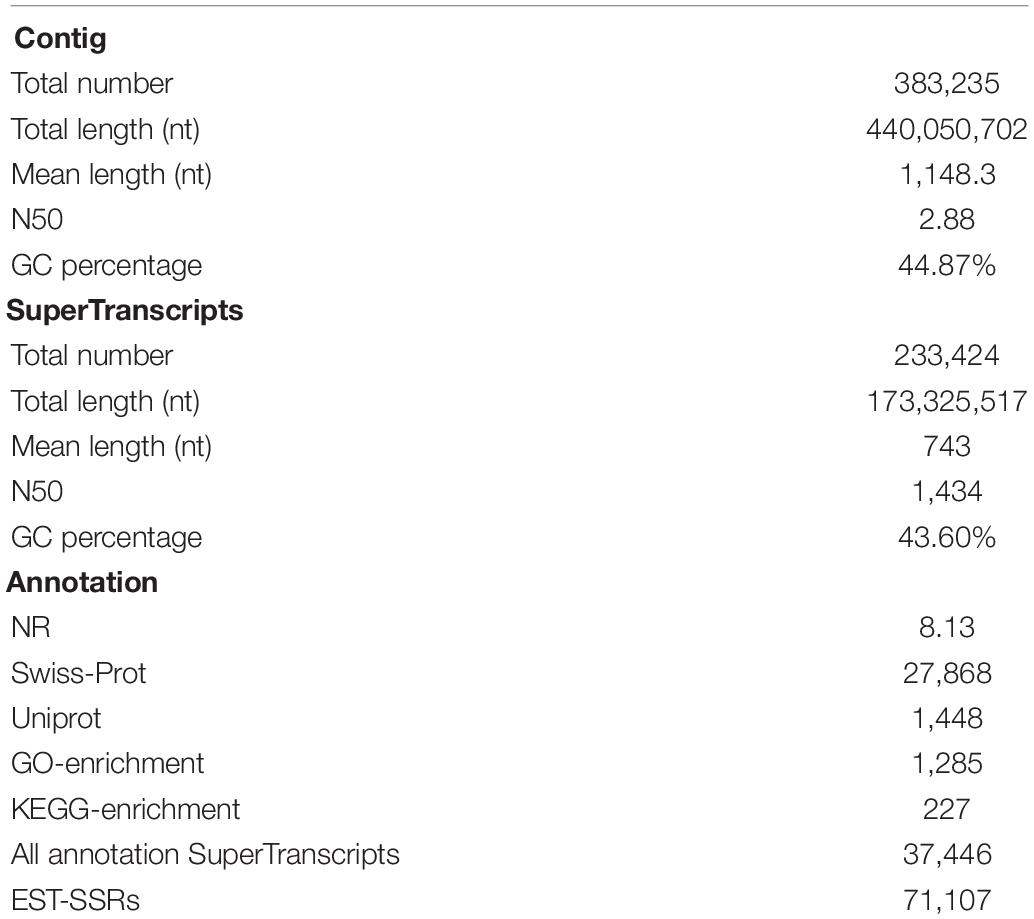
Table 2. Summary statistical of assembly, annotation steps, and molecular markers for Patagonian toothfish.
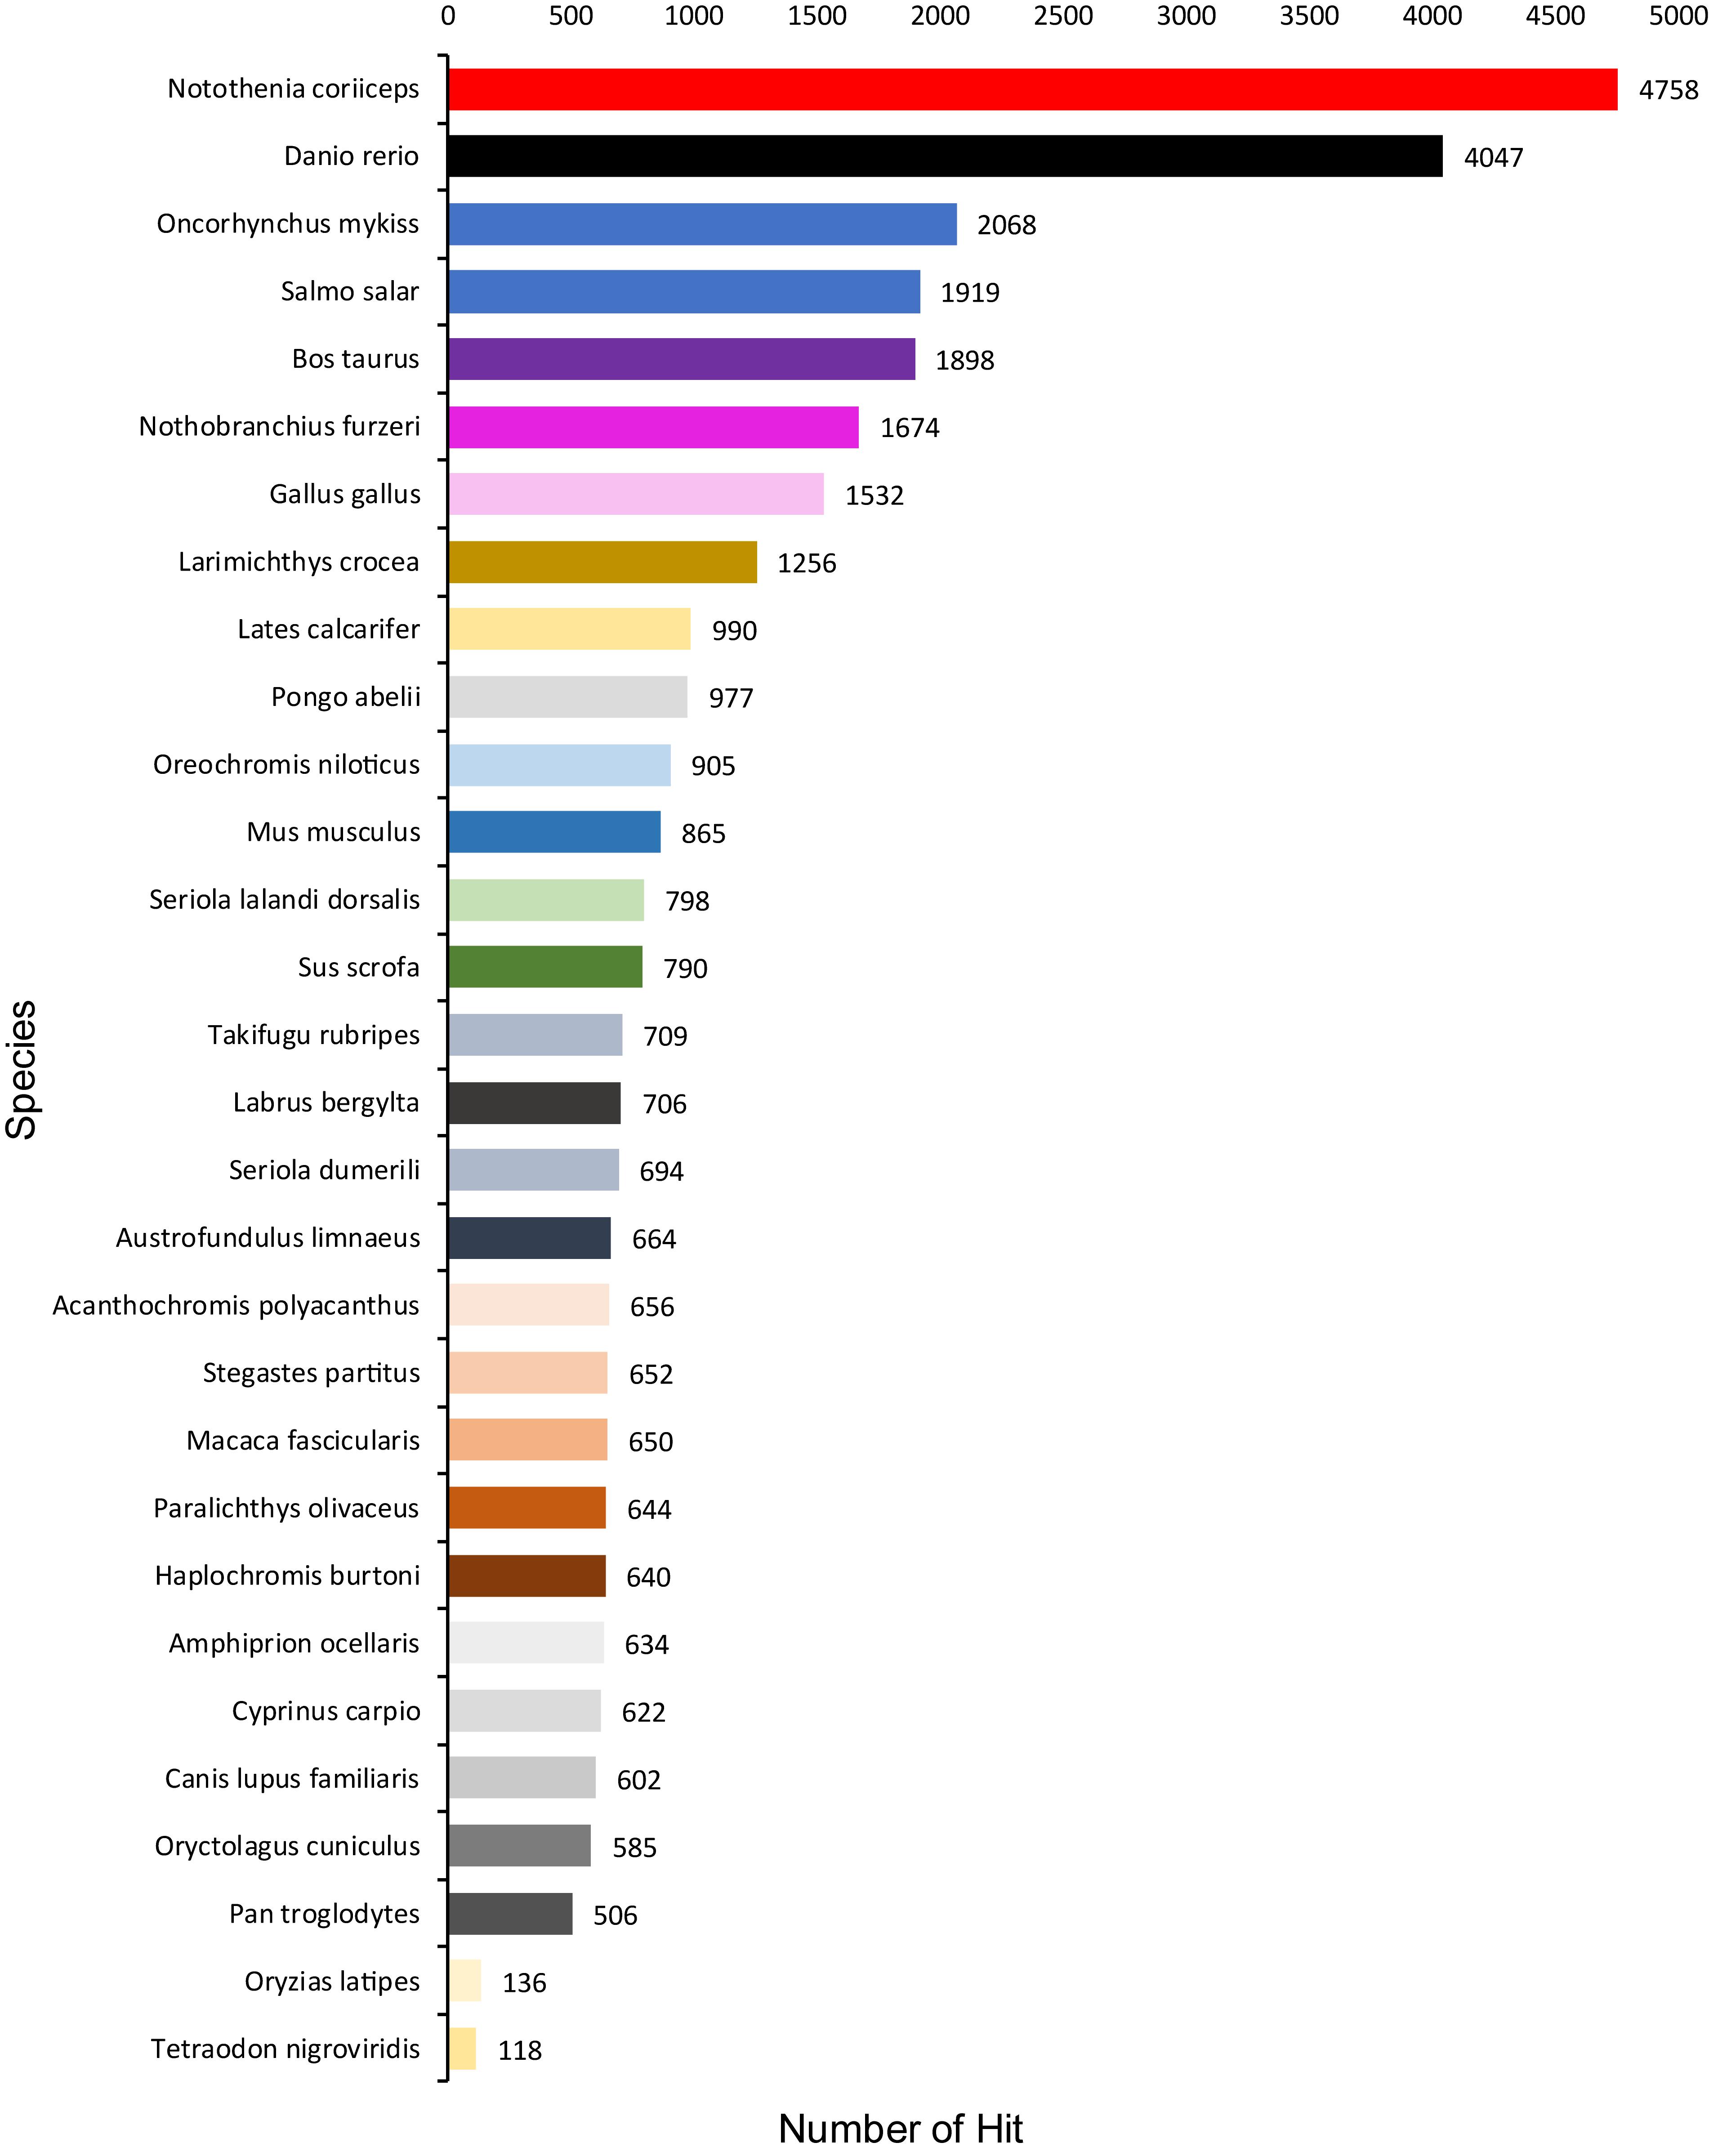
Figure 1. Species that match the annotated sequences of Patagonian toothfish. Species distribution of the top BLAST hits for all homologous sequences.

Table 3. Sequencing, BUSCO, and mapping statistics of de novo reference transcriptome of Patagonian toothfish.
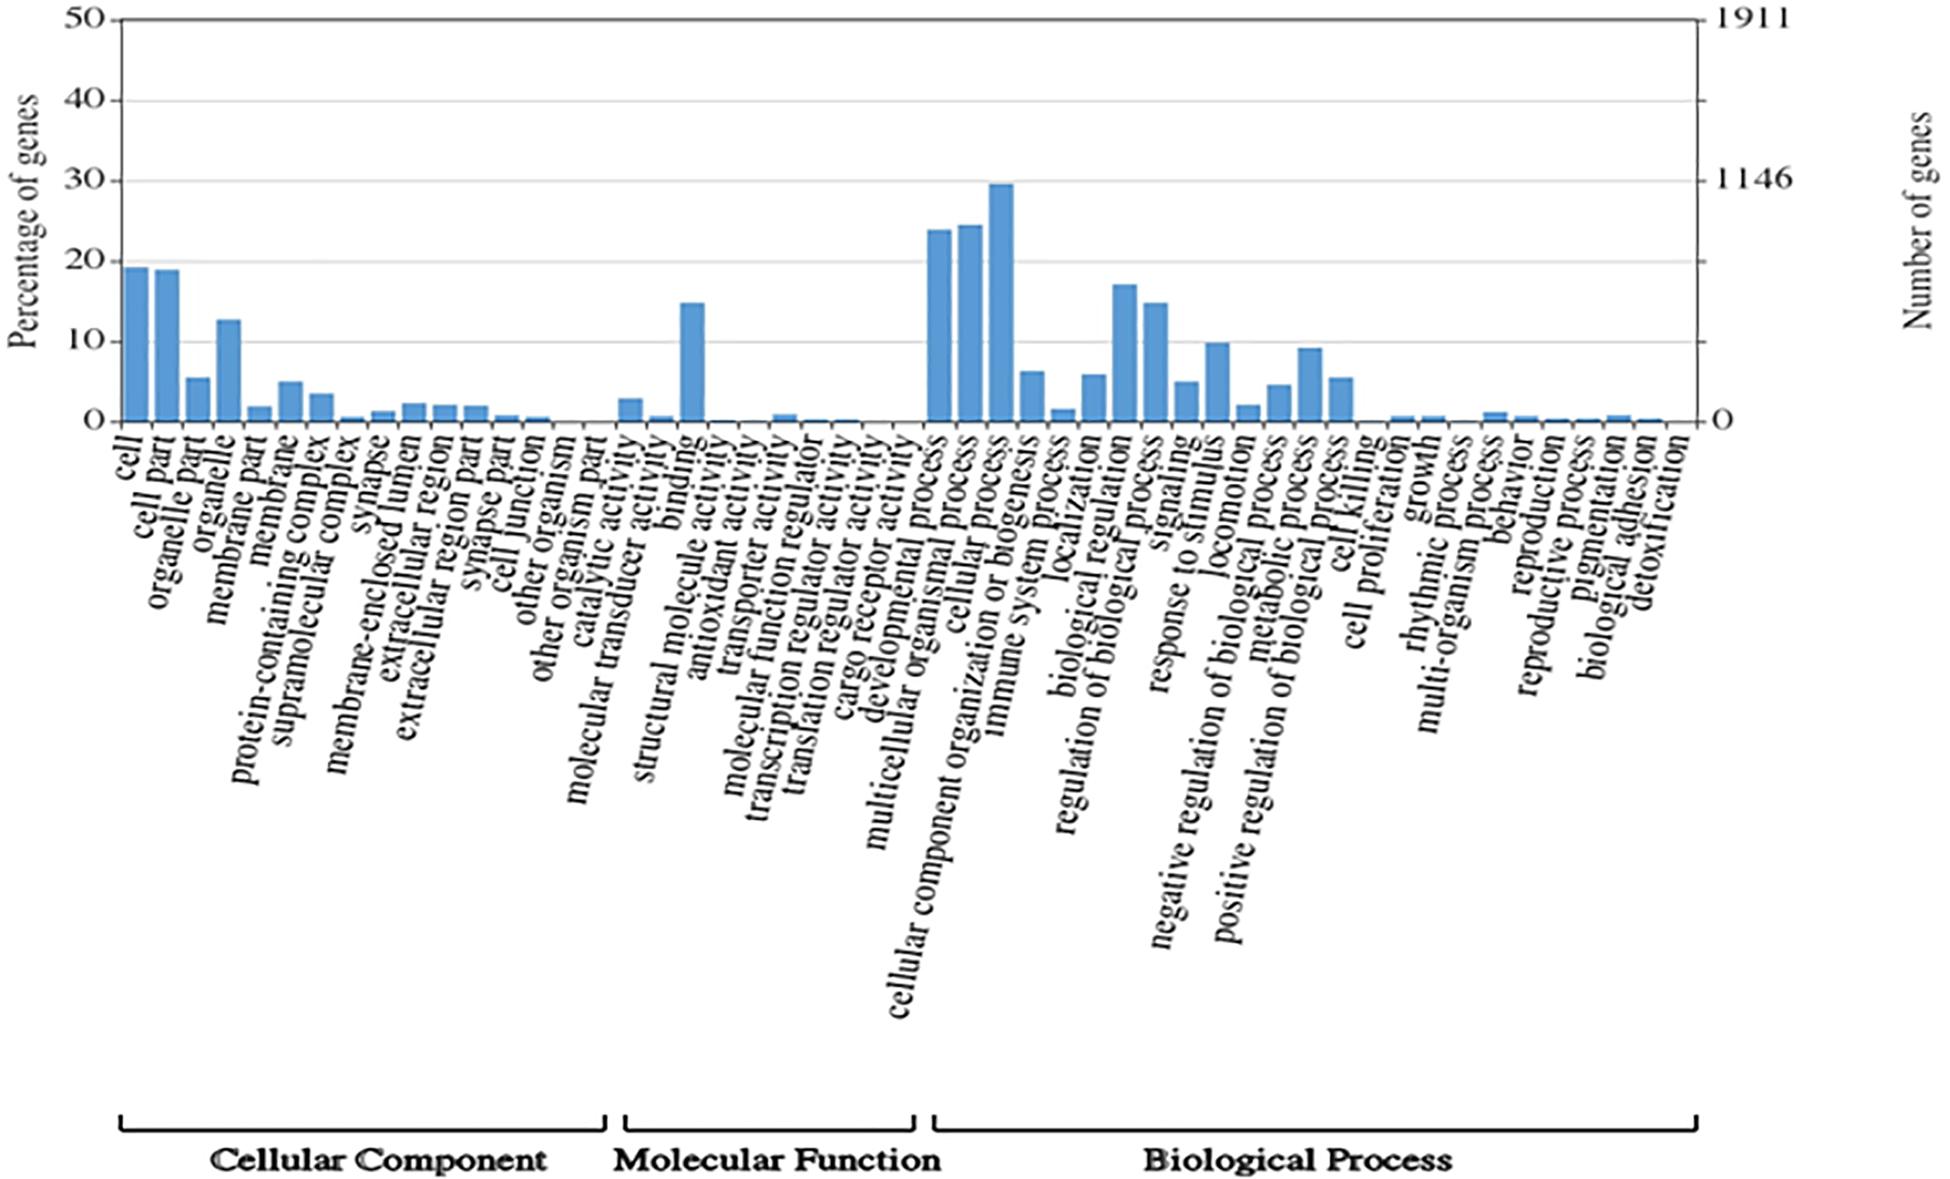
Figure 2. Histogram of GO enrichment classifications (in level 2) of Patagonian toothfish genes. The results are summarized for three main domain components: cell component, molecular function, and biological process.
Patterns of Gene Expression
Specific patterns of gene expression versus tissue can provide relevant knowledge about the developing of specific tissue in Patagonian toothfish. The PCA performed showed that the tissue/pair heart/muscle and gills/kidney share a similar pattern of gene expression. The liver and spleen seem to be the tissue with the gene expression profiles more differentiated (Figure 3). Moreover, the SPM algorithm (>0.9) together with the criteria of FPKM defined revealed that ovary and liver were the tissues that presented the highest number of tissue-specific genes and that heart tissue not presented none (Supplementary Table S4 and Figure 3).
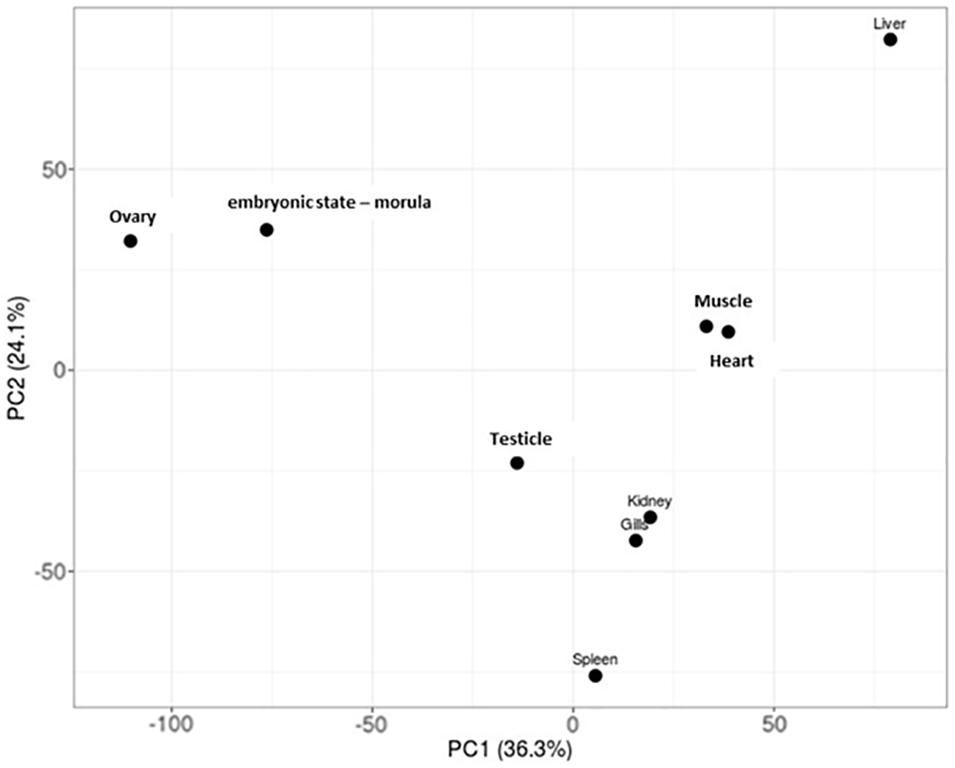
Figure 3. PCA plots of log2-normalized FPKM of eight tissue and an embryonic state – morula – of Patagonian toothfish superTranscripts.
Identification of SSRs
From the total of superTranscripts assembled, a total of 71,107 EST-SSRs were obtained (Supplementary Table S5) with a number approximate of 0.3 SSR per superTranscript and with an average frequency of one SSR per 1.12 kB. 43,119 sequences containing one SSR, 14,486 sequences containing more than one SSR, and 11,001 sequences containing complex SSRs. Among these, 38,163 (53.67%) SSRs were dinucleotide sequence motifs, 9,764 (13.73%) were trinucleotide sequence motifs, 1,870 (2.63%) were tetranucleotide sequence motifs, 173 (0.24%) were pentanucleotide sequence motifs, and 125 (0.18%) were hexanucleotide sequence motifs. Of the total of identified dinucleotide SSRs, the motif AC/GT had the highest frequency of occurrence (77.46%) (Figure 4).
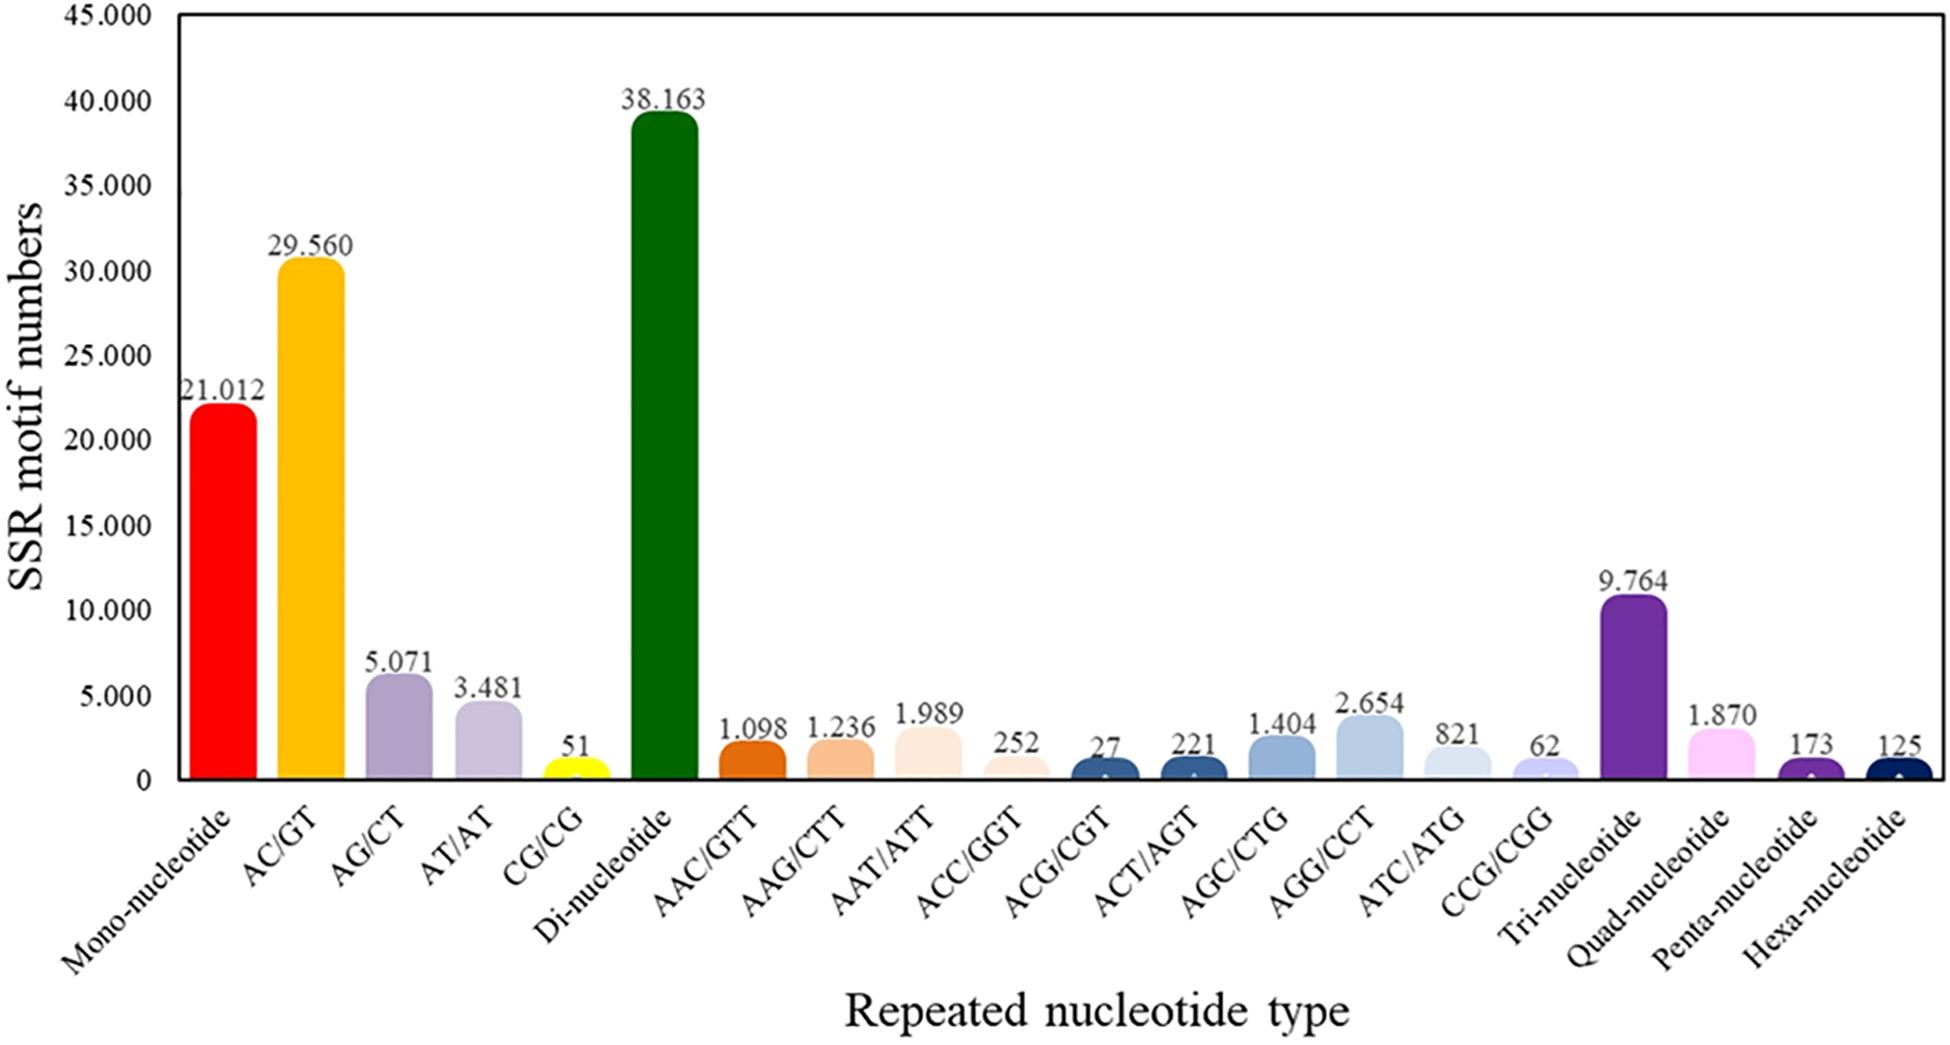
Figure 4. Quantity statistics of EST-SSRs classification. The X-axis is the repeat times of repeat units. The Y-axis is the number of SSR of Patagonian toothfish.
Microsatellite Survey
Of the total of EST-SSRs identified, 34,196 primer pairs could be properly designed (Supplementary Table S6). A subset of 25 associate immunological EST-SSRs was selected for its evaluation as potential population markers, in 10 random Patagonian toothfish samples (Supplementary Table S7). From these selected loci, 13 (including 12 di-, 11 tri-, and 2 tetranucleotides) proved to have the right technical features (e.g., showed single or double PCR product and did not present a significant amount of stuttering) and were evaluated in 64 animals sampled from four Patagonian toothfish populations (Table 4). Globally, a number of 63 alleles were identified with an average of 4.9 alleles by locus (ranging from 2 to 7 alleles), a PIC of 0.50 (ranging from 0.224 to 0.591), and 0.60 and 4.16 total values for HE and Rs, respectively. The mean levels of HE and Rs in IQ, PMT, CH, and FK populations were 0.26 and 2.10 (range 0.0–0.56 and 1.0–3.0), 0.52 and 3.50 (range 0.0–0.74 and 1.99–5.55), 0.52 and 3.09 (ranges 0.0–0.78 and 1.00–4.97), and 0.34 and 2.53 (range 0.0–0.66 and 1.67–3.97), respectively. Within the IQ, PMT, CH, and FK populations, the mean alleles per locus was of 2.08 (range 1–3; excluding the locus Cod-Delig-25), 3.73 (range 2–7), 3.31 (range 1–5), and 2.85 (range 1–5), respectively. Although the genetic diversities metrics were consistently higher to PMT and CH populations in comparison with IQ and FK, statistical analyses (Kruskal–Wallis test) revealed only statistical significance (P < 0.05) in RS comparisons, among IQ/PMT populations and in HE comparisons, among/PMT and IQ/CH populations. The full amount of populations and loci fit to HWE and LE, after multiple pairwise test adjusting. BayeScan analysis do not show any loci under selection (q-value < 0.05). Only a locus, Cod-Delig-05, showed evidence of null allele presence (frequency > 5%). Moreover, and interesting, one locus (Cod-Delig-25) showed an anomalous behavior, where the totality of the animals sampled from the IQ population failed to amplify PCR product; however, the rest of animals sampled presented normal PCR products in the locus. In consideration of these results, both loci (Cod-Delig-05 and Cod-Delig-25) were eliminated from the subsequent analysis.
Population Genetic Structure
The COANCESTRY average relatedness, among pairs of Patagonian toothfish animals sampled within populations, was of −0.25 (P > 0.05), indicated no evidence of relatedness. Therefore, all the animals were included in the analysis of population genetic structure. Consistently the totality of pairwise population comparisons, evaluated by the metrics of population divergence FST and , revealed statistical significant genetic differences among them (Table 5). The populations with higher and lower genetic differences were IQ/CH and IQ/FK, respectively. The STRUCTURE evaluation, from the 11 immune EST-SSRs database, revealed as the best number of population cluster a K = 3. In this K-value, membership coefficients (q) clearly distinguished a first cluster, lumping together the populations of IQ and FK, a second cluster that represents Patagonian toothfish from PMT and a third mixed cluster that include Patagonian toothfish from PMT and CH (Figure 5).
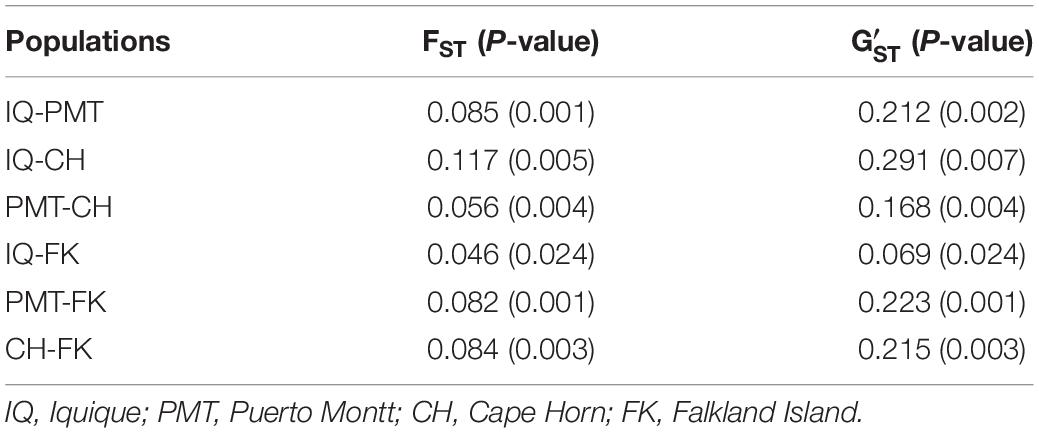
Table 5. Pairwise, populations level estimates of genetic differentiation (FST and ) for Patagonian toothfish populations.
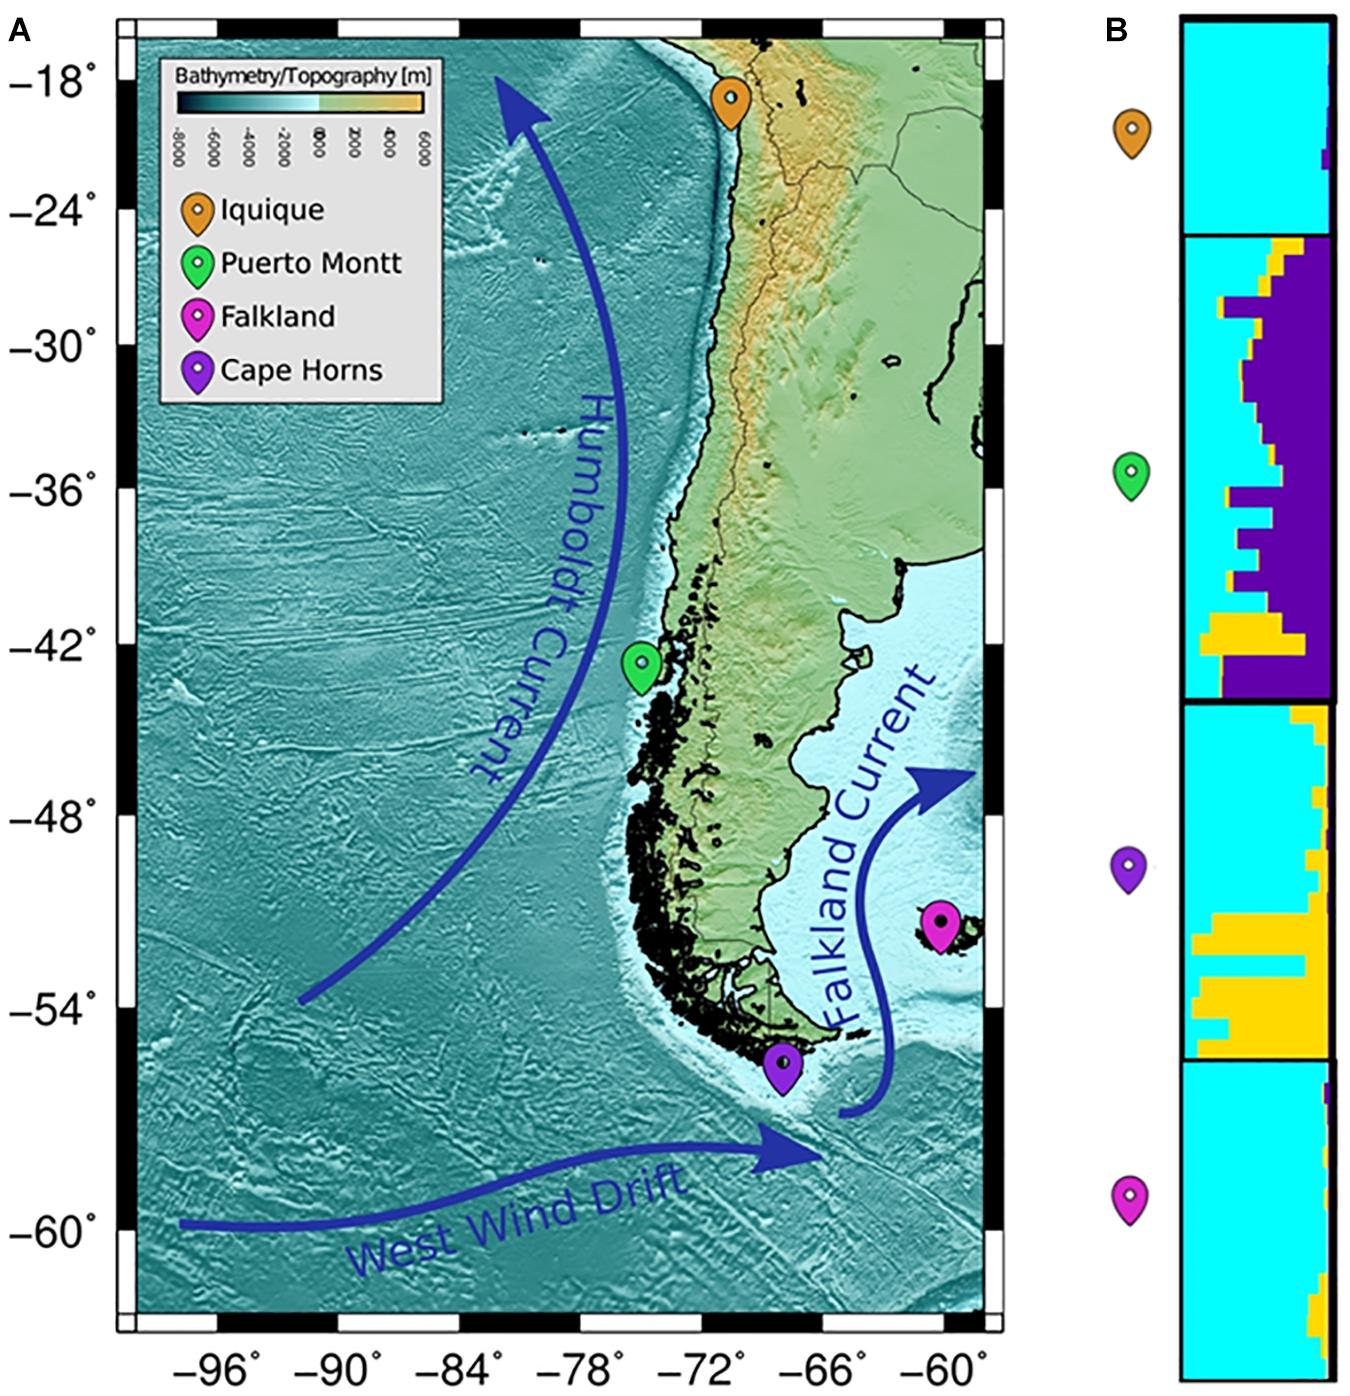
Figure 5. Population samples of sites across the Pacific and Atlantic Ocean. (A) Wide panorama of distance between both pacific and Atlantic Ocean populations utilized for sample collecting. (B) Plots of membership coefficients (q) for K = 2 clusters generated using the correlated allele frequency models in STRUCTURE for Patagonian toothfish genotypes in the four different populations.
Discussion
Transcriptome Assembly and EST-SSR Identification
Genetic resources for Patagonian toothfish are very limited, therefore in the present study, we have applied HTS technology for the annotation of its transcriptome and discovery and characterization of molecular markers associated. In the absence of a reference genome and/or transcriptome for this species or a closely related, we performed a de novo transcriptome from eight different tissues (muscle, gills, heart, kidney, liver, testicle, ovary, spleen) and an embryonic state – morula. Although currently there are several bioinformatics packages that can perform de novo assembly, Trinity package (Grabherr et al., 2011) and superTranscript options were selected, because this produces the best assemblies based on the quality of the assemblies [e.g., fewer transcripts, N50 increased and larger size of transcripts (Amin et al., 2014; Li et al., 2018)]. The metrics of the Patagonian toothfish assembled de novo transcriptome, such as the N50, were similar to those obtained for other transcriptomes encoding non-model fish species (Pérez-Portela et al., 2016; Reyes et al., 2016; Krabbenhoft and Turner, 2018). Moreover, we determined coverage of 78.92% of essential eukaryotic genes (BUSCO) and 83.26% of conserved domain arrangements (DOGMA) and showed that 88.08% of the reads were mapped to the reference transcriptome. Therefore, these results suggest that the Patagonian toothfish reference transcriptome obtained corresponds to a transcriptome of adequate quality. Our results showed that of 233,424 possible genes, 37,446 (16.04%) were blasted to known protein sequences in public databases. Therefore, exist a great potential for the discovery of new genes in this species. The functional annotation of these genes allowed the identification of genomic regions responsible for ontogenetic development processes, biological regulation, the immune system, and regions involved in processes of growth and reproduction. Therefore, the de novo transcriptome developed here can be used as the basis of further biological micro- or macro-evolutionary studies. Moreover, the EST-SSRs discovered and described in this study represent relevant information. Our results showed an approximate rate of 0.30 SSRs by superTranscript with an average frequency of one SSR per 1.12 per kB. These results are coherent with the report by Papetti et al. (2016) to another Nototheniidae member, Lepidonotothen nudifrons, with a rate of 0.38 SSRs by transcript and an average frequency of one SSR per 2.9 kB. Generally the frequency of SSRs with different motifs and sizes are not distributed homogeneously in metazoans. Preceding studies have showed that dinucleotides, followed by trinucleotides, are the most frequent EST-SSR types in teleost, including members of the family Nototheniidae and that dinucleotides motif AC/GT is the one the most frequent motif (Chistiakov et al., 2006; Papetti et al., 2016; Chen et al., 2019). Our results confirm these findings, revealing that of the total of EST-SSR type discovered, 53.67% corresponded to dinucleotides and that within and that the SSR repeat motif AC/GT was the more representative (77.46%).
EST-SSR Genetic Diversity and Population Structure in Patagonian Toothfish
In areas of conservation and aquaculture, the utility of EST-SSRs has been widely demonstrated in a wide range of teleost (Chistiakov et al., 2006; Ma et al., 2016; Jorge et al., 2018; Zhang et al., 2019). For example, Almuly et al. (2005) demonstrated that specific EST-SSR markers may be correlated with interesting productive traits, such as growth performance, in Gilthead seabream (Sparus aurata). In another study, Portnoy et al. (2014) suggested that the analysis of the genetic variation in both, gSSRs and immune-associated EST-SSRs, are a convenient approach in monitoring the impact of diseases in aquaculture species such as Atlantic salmon (Salmo salar). However, the association of EST-SSRs to functional genes can implicate that some of these loci may be under selective forces or show reduced levels of variability, diminishing its potential utility as molecular population markers. Although our results do not support an effect of selective forces acting over the loci analyzed, it shows that the EST-SSRs levels of genetic diversity are lower than those reported in other Patagonian toothfish studies, utilizing gSSRs. For example, Garcia et al. (2019) using 22 gSSRs reported average levels of PIC and HE of 0.748 (range 0.374–0.937) and 0.66 (range 0.11–0.90), respectively. Likewise, Canales-Aguirre et al. (2018) utilizing six gSSRs reported a value of HE of 0.72 (range 0.033–0.953). Nevertheless, the levels of genetic diversity (HE and RS), genetic differentiation (FST and ), and STRUCTURE analyses, obtained in this study, are consistent in suggesting that there is a genetic structure of Patagonian toothfish inhabiting the South American continental shelf (ranging from IQ to FK). These results do not agree with those reported by Canales-Aguirre et al. (2018), who suggest only one panmictic population of Patagonian toothfish, inhabiting the South American continental shelf (ranging from Perú to FK). In the particular case of fish species with higher capacity of migration, normally associated with populations with reduced genetic differentiation (Hauser and Carvalho, 2008), the lower level of within-group genetic variance of EST-SSRs may represent a relevant advantage to highlight genetic structure or local adaptation. However, future studies with higher sizes of sampling are necessary to confirm this.
Final Considerations
Notwithstanding the ecological, evolutionary, and economical importance of Patagonian toothfish, the number of studies focused on the evaluation of genetic aspects of Patagonian toothfish is scarce. In the present study, we report the first de novo reference transcriptome from eight tissue and one embryonic state of Patagonian toothfish. Moreover, many potential EST-SSRs markers were identified from the assembled transcriptome. The general characterization of the tissues assembled and the over-represented GO categories and KEGG pathways give us valuable clue of important categories to be targeted for futures studies. Furthermore, population genetics analysis of 11 immune associate EST-SSRs markers suggest a genetic structure of Patagonian toothfish inhabiting the South American continental shelf (ranging from IQ to FK). Taken together, our results represent a significant genomic resource for Patagonian toothfish and will be very suitable for micro- and macro-evolutionary and conservation projects for this species and comparative genomics studies in the Nototheniidae family.
Data Availability Statement
The datasets generated for this study can be found in the Transcriptome data and assembly sequence file was deposited in the NCBI Sequence Read Archive (SRA) database (https://www.ncbi.nlm.nih.gov/sra/?term=PRJNA511578) and GenBank (https://trace.ncbi.nlm.nih.gov/Traces/study/?acc=PRJNA511578&go=go), respectively.
Ethics Statement
The animal study was reviewed and approved by the Comité Ética Institucional, Universidad de Santiago.
Author Contributions
RV conceived and designed the experiments. JT, KG, and SB performed the experiments, analyzed the data, helped with statistical analysis, and corrected English writing. JT and KG wrote the manuscript. RV and LV-C revised the manuscript. AR helped in collecting samples. FL participated in the study designing and coordinating, and also helped with genomic analysis and manuscript drafting. All authors critically read and approved the final manuscript.
Funding
This work was supported by the Strategic Technological Program of Aquaculture Diversification of Chile, CORFO-PTEC (15PTEC-47685). KG would like to thank the Universidad de Santiago for their support through the project USA 1899.
Conflict of Interest
JM was employed by company Fish Vet Group SpA.
The remaining authors declare that the research was conducted in the absence of any commercial or financial relationships that could be construed as a potential conflict of interest.
Acknowledgments
Special thanks to Miguel Medina, M.S. for designing geographical map.
Supplementary Material
The Supplementary Material for this article can be found online at: https://www.frontiersin.org/articles/10.3389/fmars.2019.00720/full#supplementary-material
Footnotes
- ^ http://chileanseabass.cl/
- ^ http://bioinformatics.sdstate.edu/go51/
- ^ http://pgrc.ipk-gatersleben.de/misa
- ^ https://github.com/dwinter/mmod
- ^ https://www.ncbi.nlm.nih.gov/sra/?term=PRJNA511578
- ^ https://trace.ncbi.nlm.nih.gov/Traces/study/?acc=PRJNA511578&go=go
References
Almuly, R., Poleg-Danin, Y., Gorshkov, S., Gorshkova, G., Rapoport, B., Soller, M., et al. (2005). Characterization of the 5′ flanking region of the growth hormone gene of the marine teleost, gilthead sea bream Sparus aurata: analysis of a polymorphic microsatellite in the proximal promoter. Fish. Sci. 71, 479–490. doi: 10.1111/j.1444-2906.2005.00991.x
Amin, S., Prentis, P. J., Gilding, E. K., and Pavasovic, A. (2014). Assembly and annotation of a non-model gastropod (Nerita melanotragus) transcriptome: a comparison of de novo assemblers. BMC Res. Notes 7, 1–8. doi: 10.1186/1756-0500-7-488
Andrews, S. (2010). FastQC A Quality Control Tool for High Throughput Sequence Data. Available at: http://www.bioinformatics.babraham.ac.uk/projects/fastqc/
Aramayo, V. (2016). Breve síntesis sobre el recurso bacalao de profundidad Dissostichus eleginoides en Perú. Rev. Biol. Mar. Oceanogr. 51, 229–239. doi: 10.4067/S0718-19572016000200002
Avtalion, R. R., and Clem, L. W. (1998). Environmental control of the immune response in fish. C R C Crit. Rev. Environ. Control 11, 163–188. doi: 10.1080/10643388109381687
Benjamini, Y. (2010). Discovering the false discovery rate. J. R. Stat. Soc. Ser. B 72, 405–416. doi: 10.1111/j.1467-9868.2010.00746.x
Bolger, A. M., Lohse, M., and Usadel, B. (2014). Trimmomatic: a flexible trimmer for ILLUMINA sequence data. Bioinformatics 30, 2114–2120. doi: 10.1093/bioinformatics/btu170
Bowden, T. J. (2008). Modulation of the immune system of fish by their environment. Fish Shellf. Immunol. 25, 373–383. doi: 10.1016/j.fsi.2008.03.017
Camacho, C., Coulouris, G., Avagyan, V., Ma, N., Papadopoulos, J., Bealer, K., et al. (2009). BLAST +: architecture and applications. BMC Bioinformatics 9:1–9. doi: 10.1186/1471-2105-10-421
Canales-Aguirre, C. B., Ferrada-Fuentes, S., Galleguillos, R., Oyarzun, F. X., and Hernández, C. E. (2018). Population genetic structure of patagonian toothfish (Dissostichus eleginoides) in the southeast pacific and Southwest Atlantic Ocean. PeerJ 6:e4173. doi: 10.7717/peerj.4173
Carvajal-Rodríguez, A. (2017). Myriads: P-value-based multiple testing correction. Bioinformatics 34, 1043–1045. doi: 10.1093/bioinformatics/btx746
Chapuis, M.-P., and Estoup, A. (2006). Microsatellite null alleles and estimation of population differentiation. Mol. Biol. Evol. 24, 621–631. doi: 10.1093/molbev/msl191
Chen, L., Lu, Y., Li, W., Ren, Y., Yu, M., Jiang, S., et al. (2019). The genomic basis for colonizing the freezing Southern Ocean revealed by antarctic toothfish and patagonian robalo genomes. GigaScience 112, 561–588. doi: 10.1093/gigascience/giz016
Chen, X., Mao, X., Huang, J., Ding, Y., Wu, J., Dong, S., et al. (2011). KOBAS 2.0: a web server for annotation and identification of enriched pathways and diseases. Nucleic Acids Res. 39, W316–W322. doi: 10.1093/nar/gkr483
Chistiakov, D. A., Hellemans, B., and Volckaert, F. A. M. (2006). Microsatellites and their genomic distribution, evolution, function and applications: a review with special reference to fish genetics. Aquaculture 255, 1–29. doi: 10.1016/j.aquaculture.2005.11.031
Collins, M. A., Brickle, P., Brown, J., and Belchier, M. (2010). The Patagonian Toothfish. Biology, Ecology and Fishery, 1st Edn. Amsterdam: Elsevier Ltd.
Connon, R. E., Jeffries, K. M., Komoroske, L. M., Todgham, A. E., and Fangue, N. A. (2018). The utility of transcriptomics in fish conservation. J. Exp. Biol. 221:jeb148833. doi: 10.1242/jeb.148833
Consortium, T. U. (2017). UniProt: the universal protein knowledgebase. Nucleic Acids Res. 45, D158–D169. doi: 10.1093/nar/gkw1099
Davidson, N. M., Hawkins, A. D. K., and Oshlack, A. (2017). SuperTranscripts: a data driven reference for analysis and visualisation of transcriptomes. Geno. Biol. 18:148. doi: 10.1186/s13059-017-1284-1281
Dohmen, E., Kremer, L. P., Bornberg-Bauer, E., and Kemena, C. (2016). DOGMA: domain-based transcriptome and proteome quality assessment. Bioinformatics 32, 2577–2581. doi: 10.1093/bioinformatics/btw231
Evanno, G., Regnaut, S., and Goudet, J. (2005). Detecting the number of clusters of individuals using the software STRUCTURE: a simulation study. Mol. Ecol. 14, 2611–2620. doi: 10.1111/j.1365-294X.2005.02553.x
Filho, V. A. M. (2018). “Genetic applications in the conservation of neotropical freshwater fish,” in Biological Resources of Water, ed. M. V. Freitas, (Rijeka: IntechOpen)
Foll, M., and Gaggiotti, O. (2008). A genome-scan method to identify selected loci appropriate for both dominant and codominant markers: a bayesian perspective. Genetics 180, 977–993. doi: 10.1534/genetics.108.092221
Garcia, K. K., Touma, J., Bravo, S., Leiva, F., Vargas-Chacoff, L., Valenzuela, A., et al. (2019). Novel microsatellite markers discovery in Patagonian toothfish (Dissostichus eleginoides) using high-throughput sequencing. Mol. Biol. Rep. 46, 5525–5530. doi: 10.1007/s11033-019-04912-4916
Goudet, J. (1995). FSTAT (Version 1.2): a computer program to calculate F-Statistics. J. Heredity 86, 485–486. doi: 10.1093/oxfordjournals.jhered.a111627
Grabherr, M. G., Haas, B. J., Yassour, M., Levin, J. Z., Thompson, D. A., Amit, I., et al. (2011). Full-length transcriptome assembly from RNA-Seq data without a reference genome. Nat. Biotechnol. 29, 644–652. doi: 10.1038/nbt.1883
Grilly, E., Reid, K., Lenel, S., and Jabour, J. (2015). The price of fish: A global trade analysis of Patagonian (Dissostichus eleginoides) and Antarctic toothfish (Dissostichus mawsoni). Mar. Policy 60, 186–196. doi: 10.1016/j.marpol.2015.06.006
Gurevich, A., Saveliev, V., Vyahhi, N., and Tesler, G. (2013). QUAST: quality assessment tool for genome assemblies. Bioinform. Appl. Note Genom. Anal. 29, 1072–1075. doi: 10.1093/bioinformatics/btt086
Hauser, L., and Carvalho, G. R. (2008). Paradigm shifts in marine fisheries genetics: ugly hypotheses slain by beautiful facts. Fish Fish. 9, 333–362. doi: 10.1111/j.1467-2979.2008.00299.x
He, X., Johansson, M. L., and Heath, D. D. (2016). Role of genomics and transcriptomics in selection of reintroduction source populations. Conserv. Biol. 30, 1010–1018. doi: 10.1111/cobi.12674
Hedrick, P. W. (2005). A standardized genetic differentiation measure. Evolution 59, 1633–1638. doi: 10.1111/j.0014-3820.2005.tb01814.x
Huete-Pérez, J. A., and Quezada, F. (2013). Genomic approaches in marine biodiversity and aquaculture. Biol. Res. 46, 353–361. doi: 10.4067/s0716-97602013000400007
Jorge, P. H., Mastrochirico-Filho, V. A., Hata, M. E., Mendes, N. J., Ariede, R. B., de Freitas, M. V., et al. (2018). Genetic characterization of the fish piaractus brachypomus by microsatellites derived from transcriptome sequencing. Front. Genet. 9:46. doi: 10.3389/fgene.2018.00046
Kalinowski, S. T., Taper, M. L., and Marshall, T. C. (2007). Revising how the computer program cervus accommodates genotyping error increases success in paternity assignment. Mol. Ecol. 16, 1099–1106. doi: 10.1111/j.1365-294X.2007.03089.x
Kopelman, N. M., Mayzel, J., Jakobsson, M., Rosenberg, N. A., and Mayrose, I. (2015). Clumpak: a program for identifying clustering modes and packaging population structure inferences across K. Mol. Ecol. Resour. 15, 1179–1191. doi: 10.1111/1755-0998.12387
Koressaar, T., and Remm, M. (2007). Enhancements and modifications of primer design program Primer3. Bioinformatics 23, 1289–1291. doi: 10.1093/bioinformatics/btm091
Krabbenhoft, T. J., and Turner, T. M. (2018). Comparative transcriptomics of cyprinid minnows and carp in a common wild setting: a resource for ecological genomics in freshwater communities. DNA Res. 25, 11–23. doi: 10.1093/dnares/dsx034
Kültz, D., Clayton, D. F., Robinson, G. E., Albertson, C., Carey, H. V., Cummings, M. E., et al. (2013). New frontiers for organismal biology. BioScience 63, 464–471. doi: 10.1525/bio.2013.63.6.8
Li, L., Li, M., Qi, X., Tang, X., and Zhou, Y. (2018). De novo transcriptome sequencing and analysis of genes related to salt stress response in Glehnia littoralis. PeerJ 6:e5681. doi: 10.7717/peerj.5681
Li, W., and Godzik, A. (2006). Cd-hit: a fast program for clustering and comparing large sets of protein or nucleotide sequences. Bioinformatics 22, 1658–1659. doi: 10.1093/bioinformatics/btl158
Li, Y.-C., Korol, A. B., Fahima, T., Beiles, A., and Nevo, E. (2002). Microsatellites: genomic distribution, putative functions and mutational mechanisms: a review. Mol. Ecol. 11, 2453–2465. doi: 10.1046/j.1365-294x.2002.01643.x
Ma, D., Ma, A., Huang, Z., Wang, G., Wang, T., Xia, D., et al. (2016). Transcriptome analysis for identification of genes related to gonad differentiation, growth, immune response and marker discovery in the turbot (Scophthalmus maximus). PLoS One 11:e0149414. doi: 10.1371/journal.pone.0149414
Marini, F., and Binder, H. (2019). pcaExplorer: an R/Bioconductor package for interacting with RNA-seq principal components. BMC Bioinformatics 20:331. doi: 10.1186/s12859-019-2879-1
Marko, P. B., Nance, H. A., and Guynn, K. D. (2011). Genetic detection of mislabeled fish from a certified sustainable fishery. Curr. Biol. 21, R621–R622. doi: 10.1016/j.cub.2011.07.006
O’Leary, N. A., Wright, M. W., Brister, J. R., Ciufo, S., Haddad, D., McVeigh, R., et al. (2016). Reference sequence (RefSeq) database at NCBI: current status, taxonomic expansion, and functional annotation. Nucleic Acids Res. 44, D733–D745. doi: 10.1093/nar/gkv1189
Papetti, C., Harms, L., Jürgens, J., Sandersfeld, T., Koschnick, N., Windisch, H. S., et al. (2016). Microsatellite markers for the notothenioid fish lepidonotothen nudifrons and two congeneric species. BMC Res. Notes 9:238. doi: 10.1186/s13104-016-2039-x
Pérez-Portela, R., Turon, X., and Riesgo, A. (2016). Characterization of the transcriptome and gene expression of four different tissues in the ecologically relevant sea urchin Arbacia lixula using RNA-seq. Mol. Ecol. Resour. 16, 794–808. doi: 10.1111/1755-0998.12500
Portnoy, D. S., Hollenbeck, C. M., Vidal, R. R., and Gold, J. R. (2014). A comparison of neutral and immune genetic variation in atlantic salmon, salmo salar L. in chilean aquaculture facilities. PLoS One 9:1–8. doi: 10.1371/journal.pone.0099358
Pritchard, J. K., Stephens, M., and Donnelly, P. (2000). Inference of population structure using multilocus genotype data. Genetics 155, 945–959.
R Core Team (2016). R: A Language and Environment for Statistical Computing [Computer Software Manual]. Vienna: R Core Team.
Reyes, A., Kido, R., Moreno, C. A., Educación, C., De Araucana, L., and Montt, P. (2012). Captura y mantención de Dissostichus eleginoides para conformar un plantel de reproductores Capture and maintenance of Dissostichus eleginoides to establish a broodstock group. Latin Am. J. Aqua. Res. 40, 1066–1071.
Reyes, D., Gold, J., González, R., and Vidal, R. (2016). De novo assembly, characterization and functional annotation of southern hake (Merluccius australis) transcriptome. Front. Mar. Sci. 3:216. doi: 10.3389/fmars.2016.00216
Rogers, A. D., Morley, S., Fitzcharles, E., Jarvis, K., and Belchier, M. (2006). Genetic structure of Patagonian toothfish (Dissostichus eleginoides) populations on the patagonian shelf and atlantic and western Indian Ocean sectors of the Southern Ocean. Mar. Biol. 149, 915–924. doi: 10.1007/s00227-006-0256-x
Rouge, B. (2016). Population genetic inferences using immune gene SNPs mirror patterns inferred by microsatellites. Mol. Ecol. Resour. 17, 481–491. doi: 10.1111/1755-0998.12591
Rousset, F. (2008). genepop’007: a complete re-implementation of the genepop software for Windows and Linux. Mol. Ecol. Resour. 8, 103–106. doi: 10.1111/j.1471-8286.2007.01931.x
Seeb, J. E., Pascal, C. E., Grau, E. D., Seeb, L. W., Templin, W. D., Harkins, T., et al. (2011). Transcriptome sequencing and high-resolution melt analysis advance single nucleotide polymorphism discovery in duplicated salmonids. Mol. Ecol. Resour. 11, 335–348. doi: 10.1111/j.1755-0998.2010.02936.x
Shaw, P. W., Arkhipkin, A. I., and Al-Khairulla, H. (2004). Genetic structuring of Patagonian toothfish populations in the Southwest Atlantic Ocean: the effect of the antarctic polar front and deep-water troughs as barriers to genetic exchange. Mol. Ecol. 13, 3293–3303. doi: 10.1111/j.1365-294X.2004.02327.x
Smith, P., and McVeagh, M. (2000). Allozyme and microsatellite DNA markers of toothfish population structure in the Southern Ocean. J. Fish Biol. 57, 72–83. doi: 10.1006/jfbi.2000.1612
Subpesca (2018). Estado de situación de las principales pesquerías chilenas, año 2017. Subsecretaría Pesca Acuicultura 94, 35–47.
Sun, W. (2010). “Nucleic extraction and amplification,” in Molecular Diagnostics Techniques and Applications for the Clinical Laboratory, eds W. W. Grody, R. M. Nakamura, F. Kiechle, and C. Strom, (Cambridge, MA: Academic Press), 35–47. doi: 10.1016/b978-0-12-369428-7.00004-5
Supple, M. A., and Shapiro, B. (2018). Conservation of biodiversity in the genomics era. Genom. Biol. 19:131. doi: 10.1186/s13059-018-1520-1523
Thiel, T., Michalek, W., Varshney, R. K., and Graner, A. (2003). Exploiting EST databases for the development and characterization of gene-derived SSR-markers in barley (Hordeum vulgare L.). TAG. Theor. Appl. Genet. Theor. Angewandte Genetik 106, 411–422. doi: 10.1007/s00122-002-1031-1030
Toomey, L., Welsford, D., Appleyard, S. A., Polanowski, A., Faux, C., Deagle, B. E., et al. (2016). Genetic structure of Patagonian toothfish populations from otolith DNA. Antarctic Sci. 28, 347–360. doi: 10.1017/S0954102016000183
Trapnell, C., Williams, B. A., Pertea, G., Mortazavi, A., Kwan, G., van Baren, M. J., et al. (2010). Transcript assembly and abundance estimation from RNA-Seq reveals thousands of new transcripts and switching among isoforms. Nat. Biotechnol. 28, 511–515. doi: 10.1038/nbt.1621
Untergasser, A., Cutcutache, I., Koressaar, T., Ye, J., Faircloth, B. C., Remm, M., et al. (2012). Primer3–new capabilities and interfaces. Nucleic Acids Res. 40:e115. doi: 10.1093/nar/gks596
Van Oosterhout, C., Hutchinson, W. F., Wills, D. P., and Shipley, P. (2004). micro-checker: software for identifying and correcting genotyping errors in microsatellite data. Mol. Ecol. Notes 4, 535–538. doi: 10.1111/j.1471-8286.2004.00684.x
Wang, J. (2011). coancestry: a program for simulating, estimating and analysing relatedness and inbreeding coefficients. Mol. Ecol. Resour. 11, 141–145. doi: 10.1111/j.1755-0998.2010.02885.x
Wang, J. (2017). Estimating pairwise relatedness in a small sample of individuals. Heredity 119:302. doi: 10.1038/hdy.2017.52
Wang, J. (2018). Effects of sampling close relatives on some elementary population genetics analyses. Mol. Ecol. Resour. 18, 41–54. doi: 10.1111/1755-0998.12708
Waterhouse, R. M., Seppey, M., Simao, F. A., Manni, M., Ioannidis, P., Klioutchnikov, G., et al. (2017). BUSCO applications from quality assessments to gene prediction and phylogenomics. Mol. Biol. Evol. 35, 543–548. doi: 10.1093/molbev/msx319
Weir, B. S., and Cockerham, C. C. (1984). Estimating F-Statistics for the Analysis of Population Structure. Evolution 38, 1358–1370. doi: 10.2307/2408641
Xiao, S.-J., Zhang, C., Zou, Q., and Ji1, Z.-L. (2010). TiSGeD: a database for tissue-specific genes. Bioinformatics 26, 1273–1275. doi: 10.1093/bioinformatics/btq109
Keywords: Patagonian toothfish, NGS, transcriptome, EST-SSR, genetic diversity
Citation: Touma J, García KK, Bravo S, Leiva F, Moya J, Vargas-Chacoff L, Reyes A and Vidal R (2019) De novo Assembly and Characterization of Patagonian Toothfish Transcriptome and Develop of EST-SSR Markers for Population Genetics. Front. Mar. Sci. 6:720. doi: 10.3389/fmars.2019.00720
Received: 02 September 2019; Accepted: 06 November 2019;
Published: 29 November 2019.
Edited by:
Simone Libralato, Istituto Nazionale di Oceanografia e di Geofisica Sperimentale (OGS), ItalyCopyright © 2019 Touma, García, Bravo, Leiva, Moya, Vargas-Chacoff, Reyes and Vidal. This is an open-access article distributed under the terms of the Creative Commons Attribution License (CC BY). The use, distribution or reproduction in other forums is permitted, provided the original author(s) and the copyright owner(s) are credited and that the original publication in this journal is cited, in accordance with accepted academic practice. No use, distribution or reproduction is permitted which does not comply with these terms.
*Correspondence: Rodrigo Vidal, cnViZW4udmlkYWxAdXNhY2guY2w=
 Jorge Touma
 Killen Ko García1
 Alberto Reyes
 Rodrigo Vidal