 Dennis Bunke1*†
 Thomas Leipe1
 Matthias Moros1
 Claudia Morys2†Franz Tauber1
 Joonas J. Virtasalo3
 Stefan Forster2
 Helge W. Arz1
- 1Department of Marine Geology, Leibniz Institute for Baltic Sea Research Warnemünde (IOW), Rostock, Germany
- 2Department of Marine Biology, Institute of Biological Sciences, University of Rostock, Rostock, Germany
- 3Marine Geology, Geological Survey of Finland (GTK), Espoo, Finland
Natural and anthropogenic sediment mixing can significantly impact the fidelity of sedimentary records of climate and environmental variability and human impact. This can lead to incorrect interpretations of the previous state(s) of a given ecosystem, its forcing mechanisms, and its future development. Here, natural and anthropogenic sediment mixing processes (i.e., bioturbation, hydroturbation and direct anthropogenic impact) are investigated in the south-western Baltic Sea by sedimentological, ichnological, geochemical, and radionuclide analyses to assess their impact on time-marker profiles and sediment deposition. Depth profiles of mercury and caesium-137 display a varyingly strong disturbance down to 5–25 cm. The deviations from undisturbed profiles can be used to estimate the relative degree of sediment mixing. Sedimentary fabric analysis of high-resolution X-radiographs provides further insight into bioturbation. Ichnofossils identified in short sediment cores suggest that the primary sedimentary structure is partly overprinted by burrowing organisms living in the upper 5–7 cm of sediment. Meteorological and hydrological data from automated measuring stations combined with results from resuspension experiments show that hydrodynamic events, such as storms and saline water inflows from the North Sea, have the potential to resuspend and laterally transport sediment particles in the south-western Baltic Sea. Partially graded layers in the scale of mm to cm in the investigated cores are likely associated with such hydrodynamic events. Multiple generations of linear traces on the seafloor are made visible through sidescan-sonar mapping and document a strong anthroturbation in the muddy sediments of the Mecklenburg Bight and the Arkona Basin, e.g., by bottom trawling. Depending on the core location and assumed mixing depth, determined mean net linear sedimentation rates range between 0 and 3.5 mm/a and reconstructed net mass accumulation rates range between 0 and 1.86 kg/m2/a in the mud basins. The calculable inventory of anthropogenic contaminants in the sediments illustrates the important, at least temporary storage function of the mud basins and of the adjacent sandy areas over industrial times. The findings of this study help identify the influence of natural and anthropogenic mixing on sediment profiles, and demonstrates the use of mixed sediment profiles for inferring information about past environmental conditions and anthropogenic impact.
Introduction
Shallow-water coastal and marginal seas – such as the south-western Baltic Sea – serve as natural reaction sites for the turnover and accumulation of land-derived inputs. Accordingly, one important aspect in the evaluation of their service functions is the role as intermediate storage or final sink of imported material, such as nutrients and contaminants. Moreover, measured profiles of various anthropogenically introduced contaminants may serve as markers for stratigraphic purposes. In the muds of the Baltic Sea, some useful time markers are (i) the exceedance of mercury (Hg) over natural background levels at around 1900, (ii) the maximum Hg contents at around 1970, and (iii) the sharp caesium-137 (137Cs) activity increase due to the Chernobyl nuclear disaster in 1986 (Moros et al., 2017). However, this event stratigraphy is only reasonable in areas with continuous sediment deposition and limited post-depositional disturbance like the Gotland Basin, where it is also possible to date the sediments via unsupported lead-210 (210Pb). The influx of old re-worked sediment dilutes the artificial signals and dampens the radionuclide activity (Moros et al., 2017). Hence, a detailed examination of the natural and anthropogenic sediment mixing processes is required to assess their impact on sediment deposition and contaminant accumulation in the south-western Baltic Sea.
Naturally occurring processes include both biogenic and hydrodynamic sediment mixing. Biogenic mixing or bioturbation in aquatic environments is caused by benthic fauna living on and in the surface sediment, mainly through foraging and construction of burrows (Meysman et al., 2010; Kristensen et al., 2012). It comprises particle reworking (displacement or biomixing of particles) as well as burrow ventilation (displacement or bioirrigation of water). Biomixing occurs either by frequent and random particle displacements over short distances (cryptic bioturbation) analogous to diffusion, or over longer distances in discrete steps (burrow-mottling) analogous to advection (Boudreau, 1986a, b; Boudreau and Imboden, 1987). The same also applies to bioirrigation (Shull et al., 2009), but is not further investigated within this study, although it is clear that moving water can also move particles and vice versa (Kristensen et al., 2012). Cryptic bioturbation is caused by small-sized fauna, the so-called local biodiffusors, and occurs mainly within the uppermost sediment layer, where it may disturb or completely erase pre-existing structures (Pemberton et al., 2008). Cryptic bioturbation leads to a more or less homogeneous or biodeformed sedimentary fabric (Wetzel, 1981; Werner, 2002; Virtasalo et al., 2011). Burrow-mottling is caused by infaunal macrozoobenthos such as burrowing polychaetes and bivalves that leave behind traces and structures according to their living and feeding behaviour. Recent macrozoobenthic studies in the south-western Baltic Sea have compiled and analysed the present organisms and their bioturbation potential (Schiele et al., 2015; Gogina et al., 2017; Morys et al., 2017). Hydrodynamic mixing or hydroturbation refers to all sediment mixing and transport processes that are induced by water movements caused by wind and currents. In the south-western Baltic Sea these are triggered, e.g., by storms and saline water inflows from the North Sea, and can also leave traces in the sedimentary fabric (Milkert and Werner, 1996; Nittrouer et al., 1998; Kersten et al., 2005). The influence of tides is negligible in the Baltic Sea due to its minor connection to the world ocean. On the other hand, anthropogenic mixing or anthroturbation in aquatic environments refers to the disturbance of sediments by human activities such as bottom trawling, construction, dredging, dumping and anchoring as well as sediment sampling (Berner, 1976; Soulsby et al., 2007). While the latter five activities have a potentially strong but local impact, bottom trawling affects wide areas of the Baltic Sea floor (HELCOM, 2010). During the past decades, extensive studies have been conducted on the diverse impacts of bottom trawling on the seafloor (Krost et al., 1990; Werner et al., 1990; Smith et al., 2003) and on benthic communities (Jennings et al., 2001; Duplisea et al., 2002; Rosenberg et al., 2003) in the Baltic Sea. However, only a few actually dealt with effects on biogeochemical processes and element fluxes (Krost, 1990).
In this study, 21 short sediment cores have been analysed from the south-western Baltic Sea, covering the most important sediment types (mud, silt, sand) in the region. First, Hg content and 137Cs activity were determined to examine the relative degree of sediment disturbance. Second, high-resolution X-radiographs were taken to investigate the sedimentary fabric that provides insight into bio- and hydroturbation. Third, resuspension experiments were conducted and the results were compared to meteorological and hydrological data from automated measuring stations to assess the hydroturbation potential of storms and saline water inflows. Finally, side-scan sonar images of the seafloor and bottom-trawl effort data were evaluated for anthropogenic impact. The overall aim was to investigate the contributions of these natural and anthropogenic processes to sediment mixing and how they affect time-marker profiles as well as sediment accumulation.
Study Area
The south-western Baltic Sea consists of several basins of different depths, separated by shallower submarine sills that restrict the lateral water exchange between the basins as well as with the North Sea. The Baltic Sea is connected to the North Sea via the three narrow Danish Straits (Little Belt, Great Belt, and Sound) and the Kattegat as a transition zone. The Little Belt and the Great Belt merge via the Fehmarn Belt into the Mecklenburg Bight that has a maximum depth of about 25 m. The Mecklenburg Bight and the Sound adjoin the 18 m deep Darss Sill and the 8 m deep Drodgen Sill, respectively, where they open into the Arkona Basin with a maximum depth of about 50 m. The Arkona Basin is connected to the up to 100 m deep Bornholm Basin by the Bornholmsgat without a significant sill.
The restricted water exchange with the North Sea together with a freshwater surplus from the large catchment area leads to brackish water conditions, a strong lateral salinity gradient and a permanent density stratification of the water column that hampers the vertical water exchange. In general, there is a surface layer of low saline water (6–8 PSU) flowing out into the North Sea and a compensation current in the deep layer that follows the bathymetry and transports more saline water (10–14 PSU) into the Baltic Sea, producing a pycnocline. Occasionally, larger volumes (100–250 km3) of highly saline (17–25 PSU) and oxygenated water – so called Major Baltic Inflows (MBIs) – enter the Baltic Sea under certain meteorological and oceanographic conditions (HELCOM, 2002; Lass and Matthäus, 2008). As a result, the local hydrodynamic bottom regime is highly variable in terms of flow direction and intensity (Fennel and Sturm, 1992; Siegel et al., 2005).
The recent distribution of surface sediments in the south-western Baltic Sea (Figure 1) reflects the integrated effects of hydrodynamics, the initial glacial sediment distribution, and the post-glacial morphological development (Björck, 1995; Lemke, 1998; Leipe et al., 2008). There are areas of erosion with glacial till outcrops and gravelly, so-called lag sediments that can be found where fine-grained material has been removed by waves and currents, e.g., in the Fehmarn Belt. Transitional areas comprise highly dynamic plains of fine sand – the Falster-Rügen sand plain as well as the Oder Bank in the Pomeranian Bight – that are subject to recurrent reworking. Finer material is passing through these areas to be deposited as organic-rich mud at greater depths (depositional areas), e.g., in the Mecklenburg Bight and the Arkona Basin. Besides coastal erosion and atmospheric deposition, land-derived material to a large extent enters the south-western Baltic Sea via the Oder River after passing the Oder Lagoon in the south-east (Christiansen et al., 2002; Emeis et al., 2002). Furthermore, bottom inflows of saline water deliver suspended matter from the North Sea (Gingele and Leipe, 2001; Leipe and Gingele, 2003). The Sassnitz Channel is a former riverbed from the Oder that drained further north, when the sea level was lower, and is still a pathway for river discharge into the Arkona Sea during easterly winds (Pohl et al., 1998; Siegel et al., 2005).
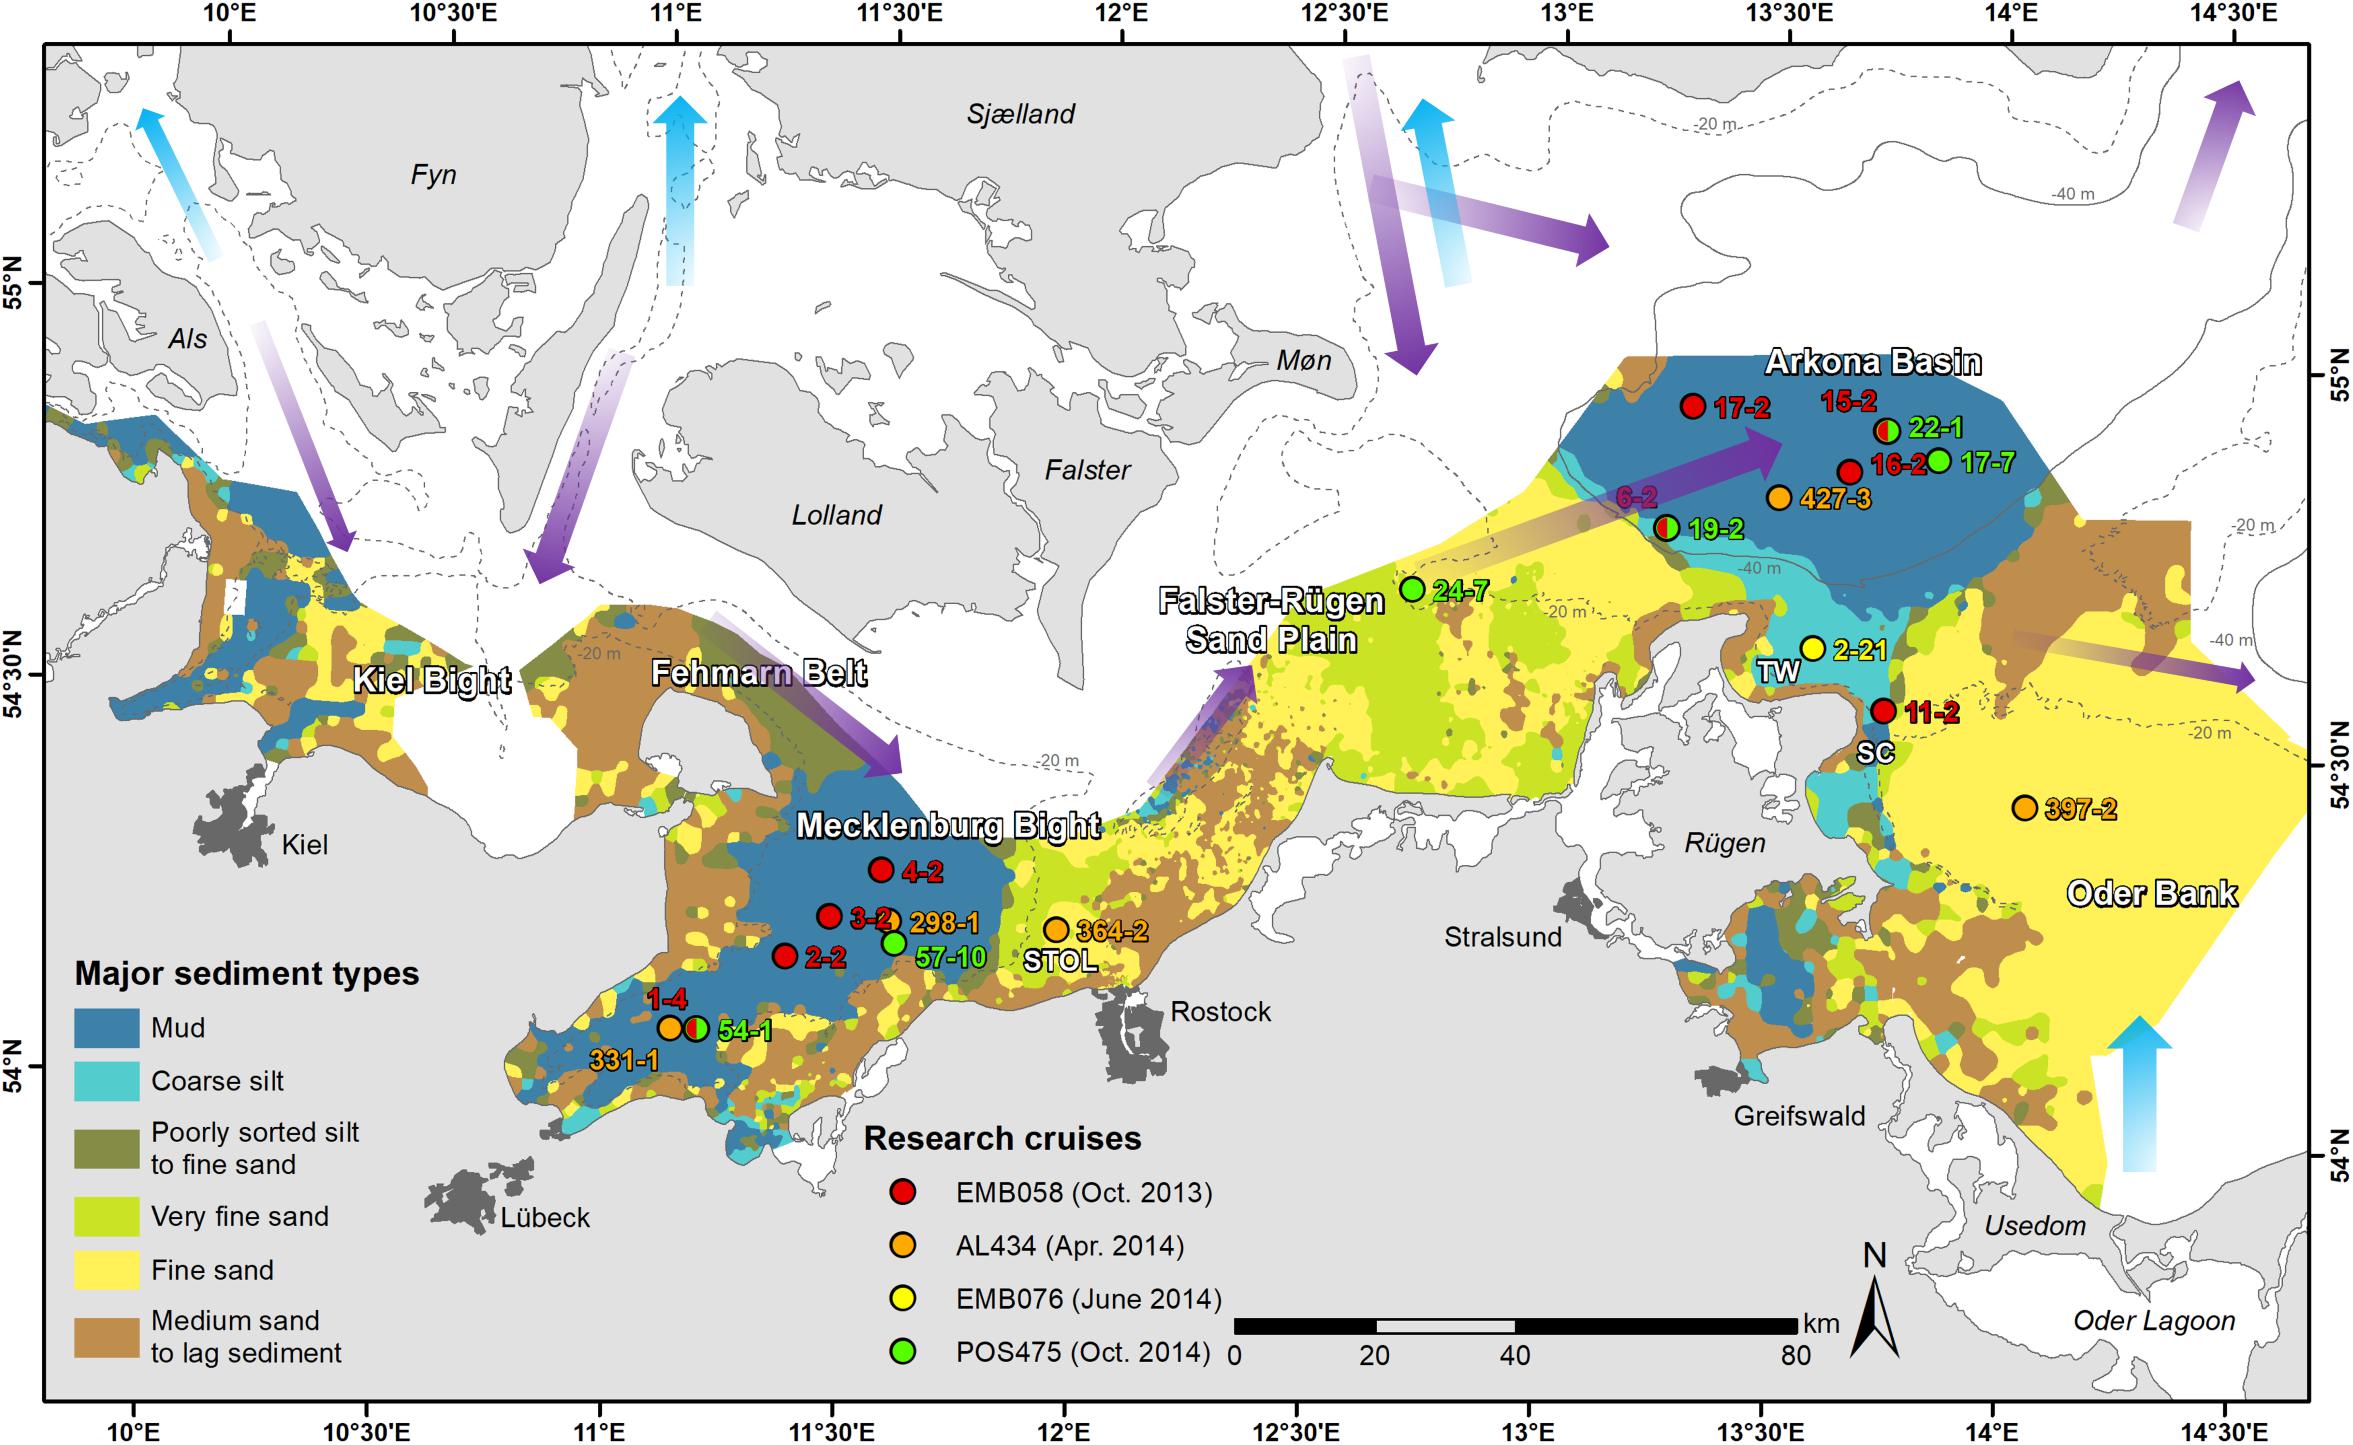
Figure 1. Distribution map of the major sediment types in the German Baltic Sea area after Tauber (2014) with indicated coring locations (coloured circles) as well as simplified current pattern of surficial freshwater outflow (light blue) and near-ground saltwater inflow (purple). AL: R/V Alkor, EMB: R/V Elisabeth Mann Borgese, POS: R/V Poseidon, SC: Sassnitz Channel, STOL: Stoltera, TW: Tromper Wiek.
Anthropogenic Pressure
The Baltic Sea is surrounded by nine highly industrialised countries and is therefore under strong anthropogenic pressure. Apart from direct impact by commercial use (fishery, maritime traffic, and construction activities), industry and agriculture are still the main sources of contamination through river discharge and air pollution.
Contamination
The Baltic Sea is particularly sensitive to contamination of different kinds due to the restricted water exchange with the North Sea, the resulting long water residence time of around 30 years within the Baltic Sea and the vertical stratification of the water column (Nausch et al., 2008; HELCOM, 2010, 2011). Mercury is a good example for the widespread pollution during the industrial period (last circa 150 years). It has the highest enrichment factor in anthropogenic contaminated sediments (compared to other heavy metals) and is one of the most sensitive elements for environmental studies. It has a high affinity to organic material and thus enriches in the natural food chain, while being highly toxic to organisms. The natural occurrence of Hg is limited to local Hg-rich ores and volatile outcrops of active volcanic zones, which results in a very low natural geogenic background. In Baltic Sea sediments, this pre-industrial background persisted until around 1900, even though industrialisation started around 1850 (Hylander and Meili, 2003; Leipe et al., 2005, 2013). Anthropogenic sources include (i) fossil fuel combustion, (ii) the production of steel and other metals, as well as cement, (iii) mercury, gold and silver mines, smelters and chemical industries, (iv) agriculture and wood industries (e.g., pesticides, paper mills), and (v) batteries, thermometers and lamps. The commercial use peaked in 1970 and has declined sharply since then due to environmental measures (Leipe et al., 2013; Horowitz et al., 2014). However, Hg has a long residence time in the environment and its recent contents in the sediments are still much higher than the natural background levels. The main pathways into the Baltic Sea are via (i) atmospheric deposition, (ii) riverine input, (iii) coastal industrial point sources, and (iv) historical dumping sites as local pollution hot spots (Leipe et al., 2013). In the south-western Mecklenburg Bight, industrial waste from a smelter was dumped near the city of Lübeck in the 1960s, and presumably military waste from World War II was dumped in the western Arkona Basin (Hallberg, 1991; Leipe et al., 2005, 2013).
Another contaminant is the artificial radionuclide 137Cs that is formed by nuclear fission and has a half-life of 30.17 years. 82.61% of the 137Cs in the Baltic Sea originates from the Chernobyl accident on 26 April 1986, which started a worldwide tracer experiment and affected the Baltic and Black Seas the most (Povinec et al., 1996; HELCOM, 2013). 13.22% originates from atmospheric nuclear weapons tests in the 1950–1980s. The first widespread dispersal and fallout of 137Cs occurred in November 1952 and was first detected in the atmosphere in 1954, while the maximum deposition in the Northern Hemisphere prior to Chernobyl was in 1963 (Pennington et al., 1973; Appleby et al., 1991; HELCOM, 2013). The Baltic Sea lies within the zone of most intense global fallout between 40° to 60°N (Nies et al., 1995). 4.13% originates from discharges by nuclear reprocessing plants outside the Baltic Sea (mostly United Kingdom and France) and only 0.04% from nuclear discharges directly into the Baltic Sea. The impact of non-nuclear facilities (e.g., hospitals, industry) on the radioactivity is negligible and the fallout from the Fukushima accident in March 2011 is not detectable in the Baltic Sea (Ilus and Ilus, 2000; HELCOM, 2013). 137Cs has a tendency to bind to fine and organic particles, thus 70% of 137Cs in the Baltic Sea is found in sediments (Ikäheimonen et al., 2009). Its total activity in 2010 was still eight to nine times higher than the pre-Chernobyl level in 1980 and the downward diffusion of Chernobyl 137Cs has often obliterated the weapons-testing 137Cs signal (Appleby et al., 1991; HELCOM, 2013).
Bottom Trawling
Among the direct impacts especially bottom trawling stands out due to its far-reaching influence on the sediments in the Baltic Sea. Figure 2 illustrates the bottom-trawl effort in the south-western Baltic Sea during the first quarter of 2013, the main fishing season for that gear (von Dorrien et al., 2013; ICES, 2015). In the 3 months, the complete Arkona Basin and most parts of the Mecklenburg Bight were influenced by bottom trawling for 15–150 h measured in cells of about 18 km2. Most of the cores studied within this project were taken in these areas.
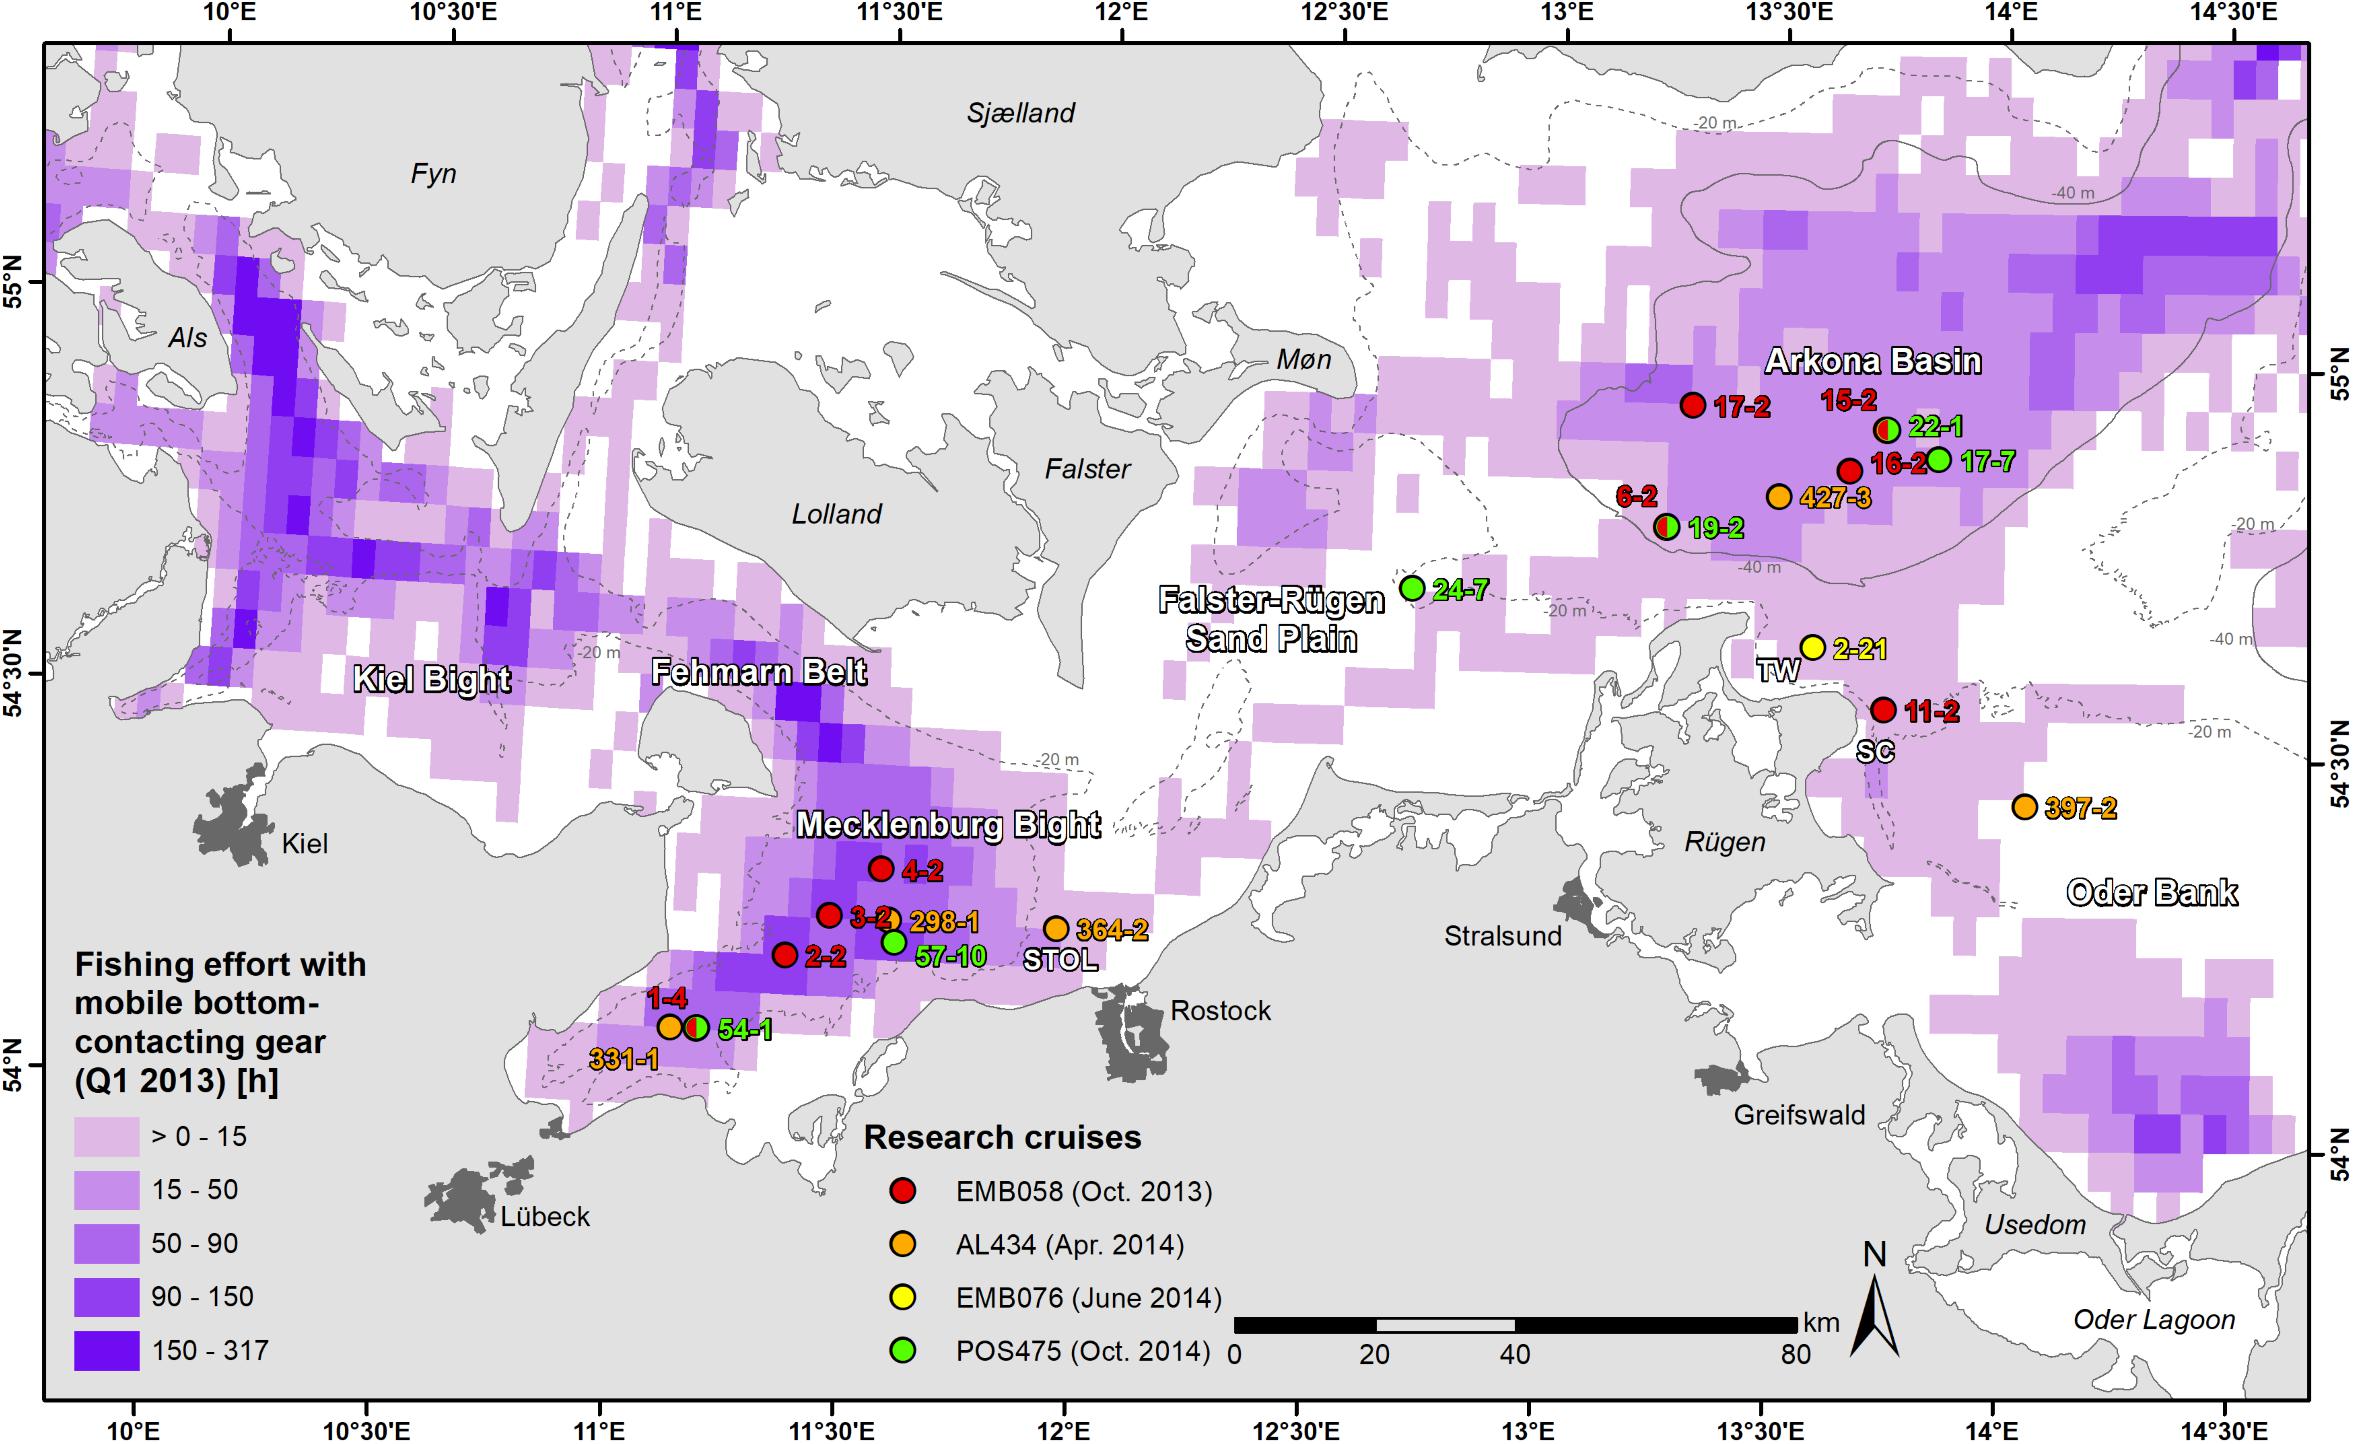
Figure 2. Map of the south-western Baltic Sea showing the fishing effort with mobile bottom-contacting gear in the first quarter of 2013 and coring locations (coloured circles). Dataset from ICES (2015) based on vessel monitoring system (VMS) and logbook data. AL: R/V Alkor, EMB: R/V Elisabeth Mann Borgese, POS: R/V Poseidon, SC: Sassnitz Channel, STOL: Stoltera, TW: Tromper Wiek.
Besides the intended and incidental extraction of benthic fauna, bottom trawling has several direct physical effects depending on gear weight (up to several 100 kg), towing speed, sediment type and strength of currents (Jones, 1992). Especially the otter boards leave distinct traces by scraping and ploughing. They disturb the benthic communities and resuspend and mix the sediment (Krost, 1990; Krost et al., 1990; Jennings et al., 2001; Duplisea et al., 2002; Rosenberg et al., 2003). The resulting furrows range in width from approximately 0.2–2 m and reach a penetration depth of up to 30 cm (Krost et al., 1990). Werner et al. (1990) calculated that a 0.5 m wide track suspended a layer of mud with a thickness of at least 1 cm. Furthermore, they provided evidence for the remobilisation of nutrients, complete perturbation of the age sequences and chemical concentration profiles as well as the destruction of original sedimentary fabric down to the mean penetration depth of 15 cm (maximal 23 cm).
In shallow sandy areas, trawl tracks only have a short preservation period due to a low penetration depth as well as stronger rearrangement by waves and currents (Krost, 1990). In deeper muddy areas, they can persist for a much longer time. Ecological investigations in the context of the construction of the Nord Stream gas pipeline from the Bornholm Basin to the Greifswald Lagoon had shown that in deep areas (below 20 m water depth) the marks and traces of the workings on the seafloor were readily recognisable and almost unchanged 3 years after the construction. An otter-board track in the sandy mud of the Eckernförde Bay (western Kiel Bight) could be identified for almost 5 years in an area with minor fishing activity (Bernhard, 1989; Krost et al., 1990). An old track in the very fine sand of the eastern Mecklenburg Bight at ∼19 m water depth, which existed already before a dumping test during the DYNAS project (Dynamics of Natural and Anthropogenic Sedimentation) in 2001 (Tauber, 2009), was clearly recognisable in 2014 and still had a furrow depth of approximately 8 cm (Jörn Kurth, IOW, personal communication). The main features of the dumping mounds were still visible after 13 years. Erosion, flattening or transportation of the dumped material, e.g., by bottom currents, had not been completed.
Materials and Methods
Sediment Coring and Subsampling
Sediment sampling was performed during cruises with R/V Elisabeth Mann Borgese (EMB058, EMB076) in 2013 and 2014, R/V Alkor (AL434) and with R/V Poseidon (POS475) in 2014 (Table 1). The focus was on the major sediment types with the largest areal coverage in the German Baltic Sea area (Figure 1). This includes the muds of the Mecklenburg Bight and the Arkona Basin as well as the fine to very fine sands of Stoltera, the Falster-Rügen sand plain and the Oder Bank. Two additional cores were taken in the transitional area between the Arkona Basin and the Oder Bank (Tromper Wiek, Sassnitz Channel). Twenty one sediment cores with a length of up to 47 cm were retrieved with a four- (EMB058) or eight-tube multi-corer. Most of the cores were immediately cut to 1 cm thick slices, which were then transferred to 100 ml plastic jars (EMB058) or 50 ml polypropylene tubes and frozen on board. In the laboratory, these samples were freeze-dried under vacuum and homogenised afterward for particle size analysis (section “Particle Size Analysis”). A proportion of each sample was ground with a ball mill for gamma spectrometry (section “Gamma Spectrometry”) and geochemical analyses (section “Geochemical Analyses”). For sandy cores, the mud (≤63 μm) was separated prior to analysis, because the investigated elements are predominantly bound therein and are diluted by geochemically inert coarser sediments (mostly quartz sand). This procedure leads to more precise results whereas the analysis of the total sediment often reaches instrumental detection limits. Since the particle size composition of the samples is known, the contents of the elements measured in the mud fraction can be recalculated to the contents in the original sample. In addition, this method allows a better comparison of sediment samples of different particle size composition (Leipe et al., 2017). For X-radiography (section “X-radiography”), five of the POS475 cores were split lengthwise on board and their work halves were further processed at the Geological Survey of Finland (GTK) in Espoo. Samples for X-ray imaging were collected in plastic boxes (50 × 5 × 2 cm) that were pushed into the half-cores, cut out with a steel string, and sealed with tape (Virtasalo et al., 2011).
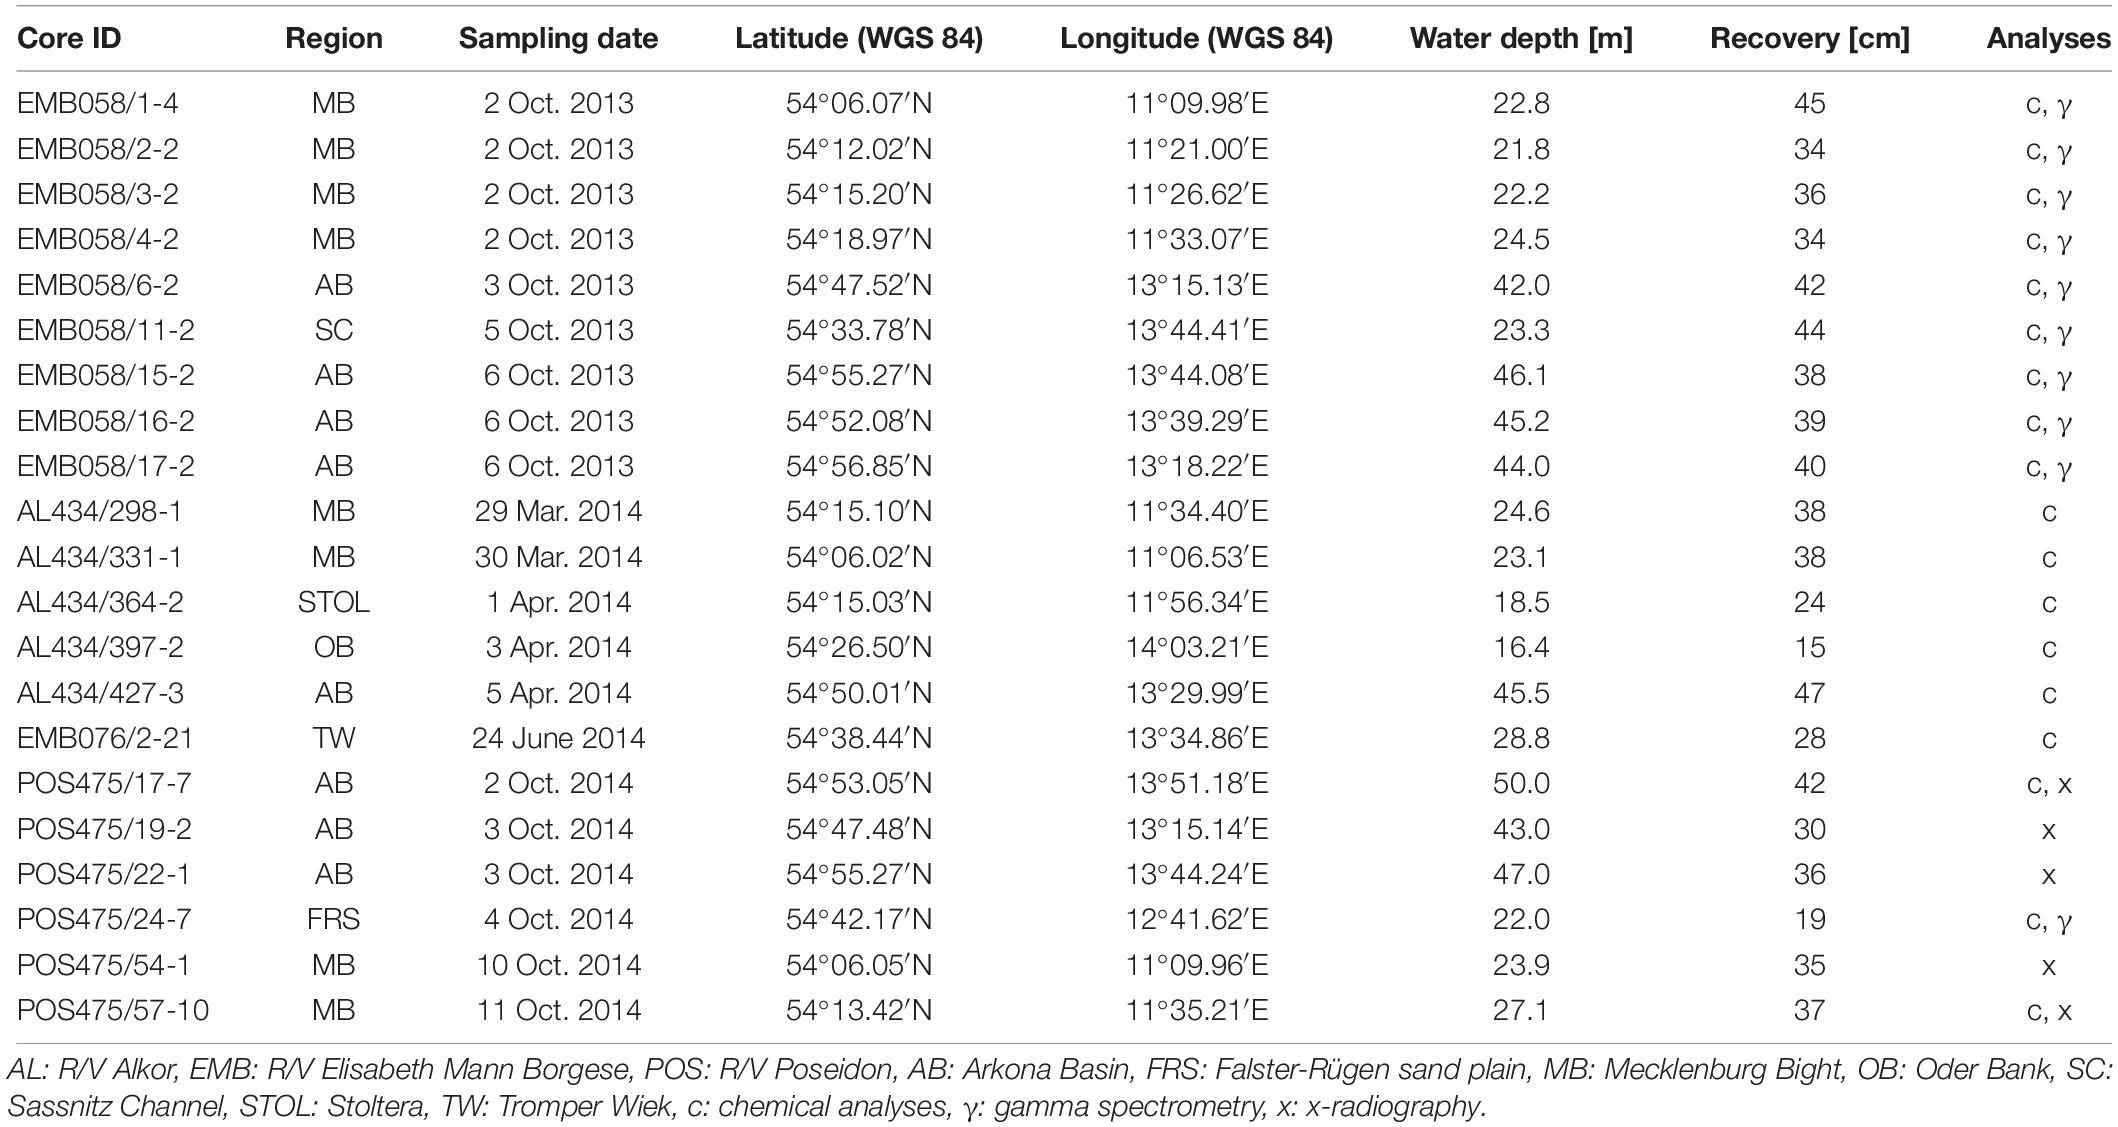
Table 1. Meta data of the studied cores, retrieved by multi-corer.
Water Content and Dry Bulk Density
The absolute water content (Wa) of the freeze-dried samples was calculated by subtraction of dry weight from wet weight values. It was used to calculate the dry bulk density (DBD) with the equation of Flemming and Delafontaine (2000), under the assumption of an average grain density of around 2.65 g/cm3:
Particle Size Analysis
The particle size was determined by laser diffractometry according to Fraunhofer’s theory with a CILAS 1180 Laser Particle Size Analyzer for particle sizes of 0.4–2,500 μm used in wet dispersion mode. 20 consecutive measurements were automatically performed for each sample and averaged to one result. To characterise the sediment in an almost natural state, the organic content was not removed and no dispersing agent was added before measuring. The precision (relative standard deviation from the mean volume percentage of the individual particle fractions) was regularly checked by repeated particle size determinations of several subsamples and unfortunately was quite high at up to 12%. The sediment classification according to the international standard ISO (14688)-1 (2002) was based on the median distinguishing between clay (<2 μm), fine to coarse silt (2–63 μm) and fine to medium sand (63–630 μm) etc (Blott and Pye, 2012). The standard deviation σ of particle size distribution, which is an estimate of the sorting of sediment, was calculated by the formula
with D75 and D25 representing the measured cumulative percentile values (the particle size at which 75 and 25% of the particles are finer).
Resuspension Experiments
During the research cruises in June (EMB076) and October 2014 (POS475), resuspension experiments with natural sediments were conducted on board using an annular flume similar to that described by Widdows et al. (1998) and adapted from Peine (2005). The flume has a 64 cm outer and 40 cm inner diameter, thus, having a 12 cm channel width and a bed area of 0.19 m2. A second bottom with a hole was placed in the flume with a 10 cm distance from the flume bottom. This bottom allowed the placement of a 10 cm long (10 cm inner diameter) core filled with sediment in the flume. The sediment surface of the core was positioned flush with the second bottom. The flume was filled up with natural sea water and bubble foil over the sediment cores was used to prevent resuspension during filling. Current velocities were generated by a 12 V motor and were increased in 0.1 V steps with a motor control panel. Three-dimensional current velocities were measured with a downward looking Acoustic Doppler Velocimeter (ADV, NorTek AS, Vangkroken 2, 1351 Rud, Norway) positioned centrally and about 8 cm above the bed. The current velocity at which particles started to resuspend, as observed by visual inspection, was determined as the critical shear velocity.
X-Radiography
For sedimentary fabric analysis, high-resolution digital X-radiographs of the prepared POS475 samples were produced at the Laboratory of Microtomography, University of Helsinki using a custom-made tungsten-anode phoenix| x-ray nanotom micro-computed tomograph from GE Sensing & Inspection Technologies. X-ray source power settings were adjusted to 150 kV and 240 μA, and the detector was set to an exposure time of 750 ms and an averaging of 15 images per radiograph (Virtasalo et al., 2011). The resulting X-radiographs were mirrored, inverted to negatives and combined to one radiograph per core by using the MosaicJ plugin (Thévenaz, 2006; Thévenaz and Unser, 2007; RRID: SCR_001935) for ImageJ version 1.50i (Rasband, 1997; RRID: SCR_003070), followed by adjustments of their brightness and contrast.
Gamma Spectrometry
The gamma-ray spectra of the EMB058 and POS475/24-7 samples with focus on the radionuclide 137Cs were determined at 662 keV using a Broad Energy High-purity Germanium Detector (BE3830-7500SL-RDC-6-ULB) or a Germanium Well Detector (GCW4021-7500SL-RDC-6-ULB) from Canberra. For analytical details see Bunke (2018) and Moros et al. (2017).
Geochemical Analyses
The Hg content was measured with a Direct Mercury Analyzer DMA-80 from Milestone Microwave Laboratory Systems (MLS GmbH) by thermal decomposition at 750°C, gold amalgamation and atomic absorption spectrophotometry at 253.65 nm. Analytical details on calibration, precision (relative standard deviation) and accuracy (deviation from reference value) can be obtained from Bunke (2018) and Leipe et al. (2013). If the measured down-core Hg profiles showed a relative stable level of low values in the deeper core section, this was assumed as the geogenic background of the respective core location. Because of the high affinity of Hg to organic material (Leipe et al., 2013) and in order to enhance the comparability between different sedimentological environments, the Hg content was normalised by the total organic carbon (TOC) content of the respective sample.
The TOC content was calculated by subtracting the total inorganic carbon (TIC) from the total carbon (TC) content. The TIC content was measured with a Macro-Elemental Analyser multi EA 2000 CS (EMB058 and most AL434 samples) or multi EA 4000 CS BU (all other samples) by acidic removal of carbonates and analysis of the released CO2 with a non-dispersive infrared detector. Analytical details on calibration, precision and accuracy can be obtained from Bunke (2018) and Leipe et al. (2011). The TC content was measured with a CHNS-O Elemental Analyser EuroEA 3052 from EuroVector by combustion at 1000°C, chromatographically separation of the released gases and their determination with a thermal conductivity detector. Analytical details on calibration, precision and accuracy can be obtained from Bunke (2018).
All geochemical parameters, including the radionuclide activity, were corrected for salinity, using the measured bottom water salinity from a CTD (conductivity, temperature, depth) device that was deployed at each station, under the assumption that the pore water salinity in the upper 50 cm of the sediment largely correspond to the salinity of the overlying bottom water.
Meteorological, Hydrological and Hydroacoustic Data Analysis
In the south-western Baltic Sea, several automated measuring stations collect meteorological and hydrological data, such as wind velocity and direction, flow velocity, salinity and turbidity of the water. They are part of the German Marine Environmental Monitoring Network (MARNET) operated by the Federal Maritime and Hydrographic Agency (BSH). Two of these stations, maintained by the Physical Oceanography and Instrumentation department of IOW, are on the Falster-Rügen sand plain (25 km east of the Darss Sill) and in the Arkona Basin (near the locations of the cores POS475/24-2 and POS475/17-7 in Figure 1, respectively). Recorded data from these stations during major storm and MBI events was analysed to characterise its influence on the sea conditions. The storm “Xaver” between 4 and 10 Dec. 2013 was chosen due to its close spatial and temporal proximity to the sediment sampling events (Table 1). Analysed parameters were wind velocity (measured 10 m above the sea surface), horizontal flow velocity of the bottom water (measured 3 m above the seafloor in 18 m and 42 m water depth, respectively), salinity of the surface (measured 2 m below the sea surface) and bottom water (measured 2 m above the seafloor in 19 m and 43 m, respectively), and turbidity of the surface water (measured 2 m below the sea surface). Another storm named “Irenäus” passed the study area in mid-March 2018 and a MBI occurred in December 2014.
On behalf of the BSH, the Marine Geology department of IOW monitors the Baltic Sea floor with various geophysical methods (e.g., side-scan sonar imaging) and has processed a large amount of respective data. Several side-scan sonar images of the seafloor around some of the coring locations (200 × 200 m) were assessed to visualise the morphology of the sediment surface.
Estimation of Sediment Accumulation
For further insight into sediment accumulation, mean net linear sedimentation rates (LSR) and mean net mass accumulation rates (MAR) of the anthropogenically undisturbed mud cores (in terms of mixing) were calculated for the past 113 years. The calculations were based on Hg, assuming that the sediment depth at which Hg exceeds its natural background level represents the year 1900 and was not altered by mixing processes (scenario 1). For two additional LSR/MAR estimations based on Hg, a mixing depth of 7.1 cm (maximum bioturbation depth; scenario 2) and 19 cm (maximum penetration depth of Hg in sandy cores; scenario 3) was subtracted from the individual Hg background exceedance depth of each core prior to calculation to compensate for mixing induced signal shifts to greater depths.
Results
Sediment Physical Properties
The sediments of the Mecklenburg Bight and the Arkona Basin have a narrow particle-size range (σ∼ 2), dominated by medium to coarse silt with 5–10% of clay-sized particles and from 0% up to 3% of fine sand. The sediments become coarser toward the Falster-Rügen sand plain and the Oder Bank, respectively, where fine sand predominates (Figure 1). In general, there are only minor variations in the particle size distribution with increasing sediment depth (upper 40–50 cm; Figure 3). In core EMB058/6-2, a coarsening is recognisable below 20 cm with increasing fine sand from 12% up to 30% and decreasing coarse silt from 50% down to 30%. In core EMB058/11-2 from the Sassnitz Channel south of the Arkona Basin, siltier intervals (up to 44% coarse silt) alternate with more sandy intervals (up to 57% fine sand). In core AL434/364-2 from Stoltera east of the Mecklenburg Bight basin, the dominating fine and medium sand decreases below 17 cm from 88% down to 24% and the silt increases accordingly from 12% up to 76%. In core POS475/24-7 from the Falster-Rügen sand plain, the medium sand increases from 6% at the sediment surface to 37% at 19 cm core depth while finer particles decrease.
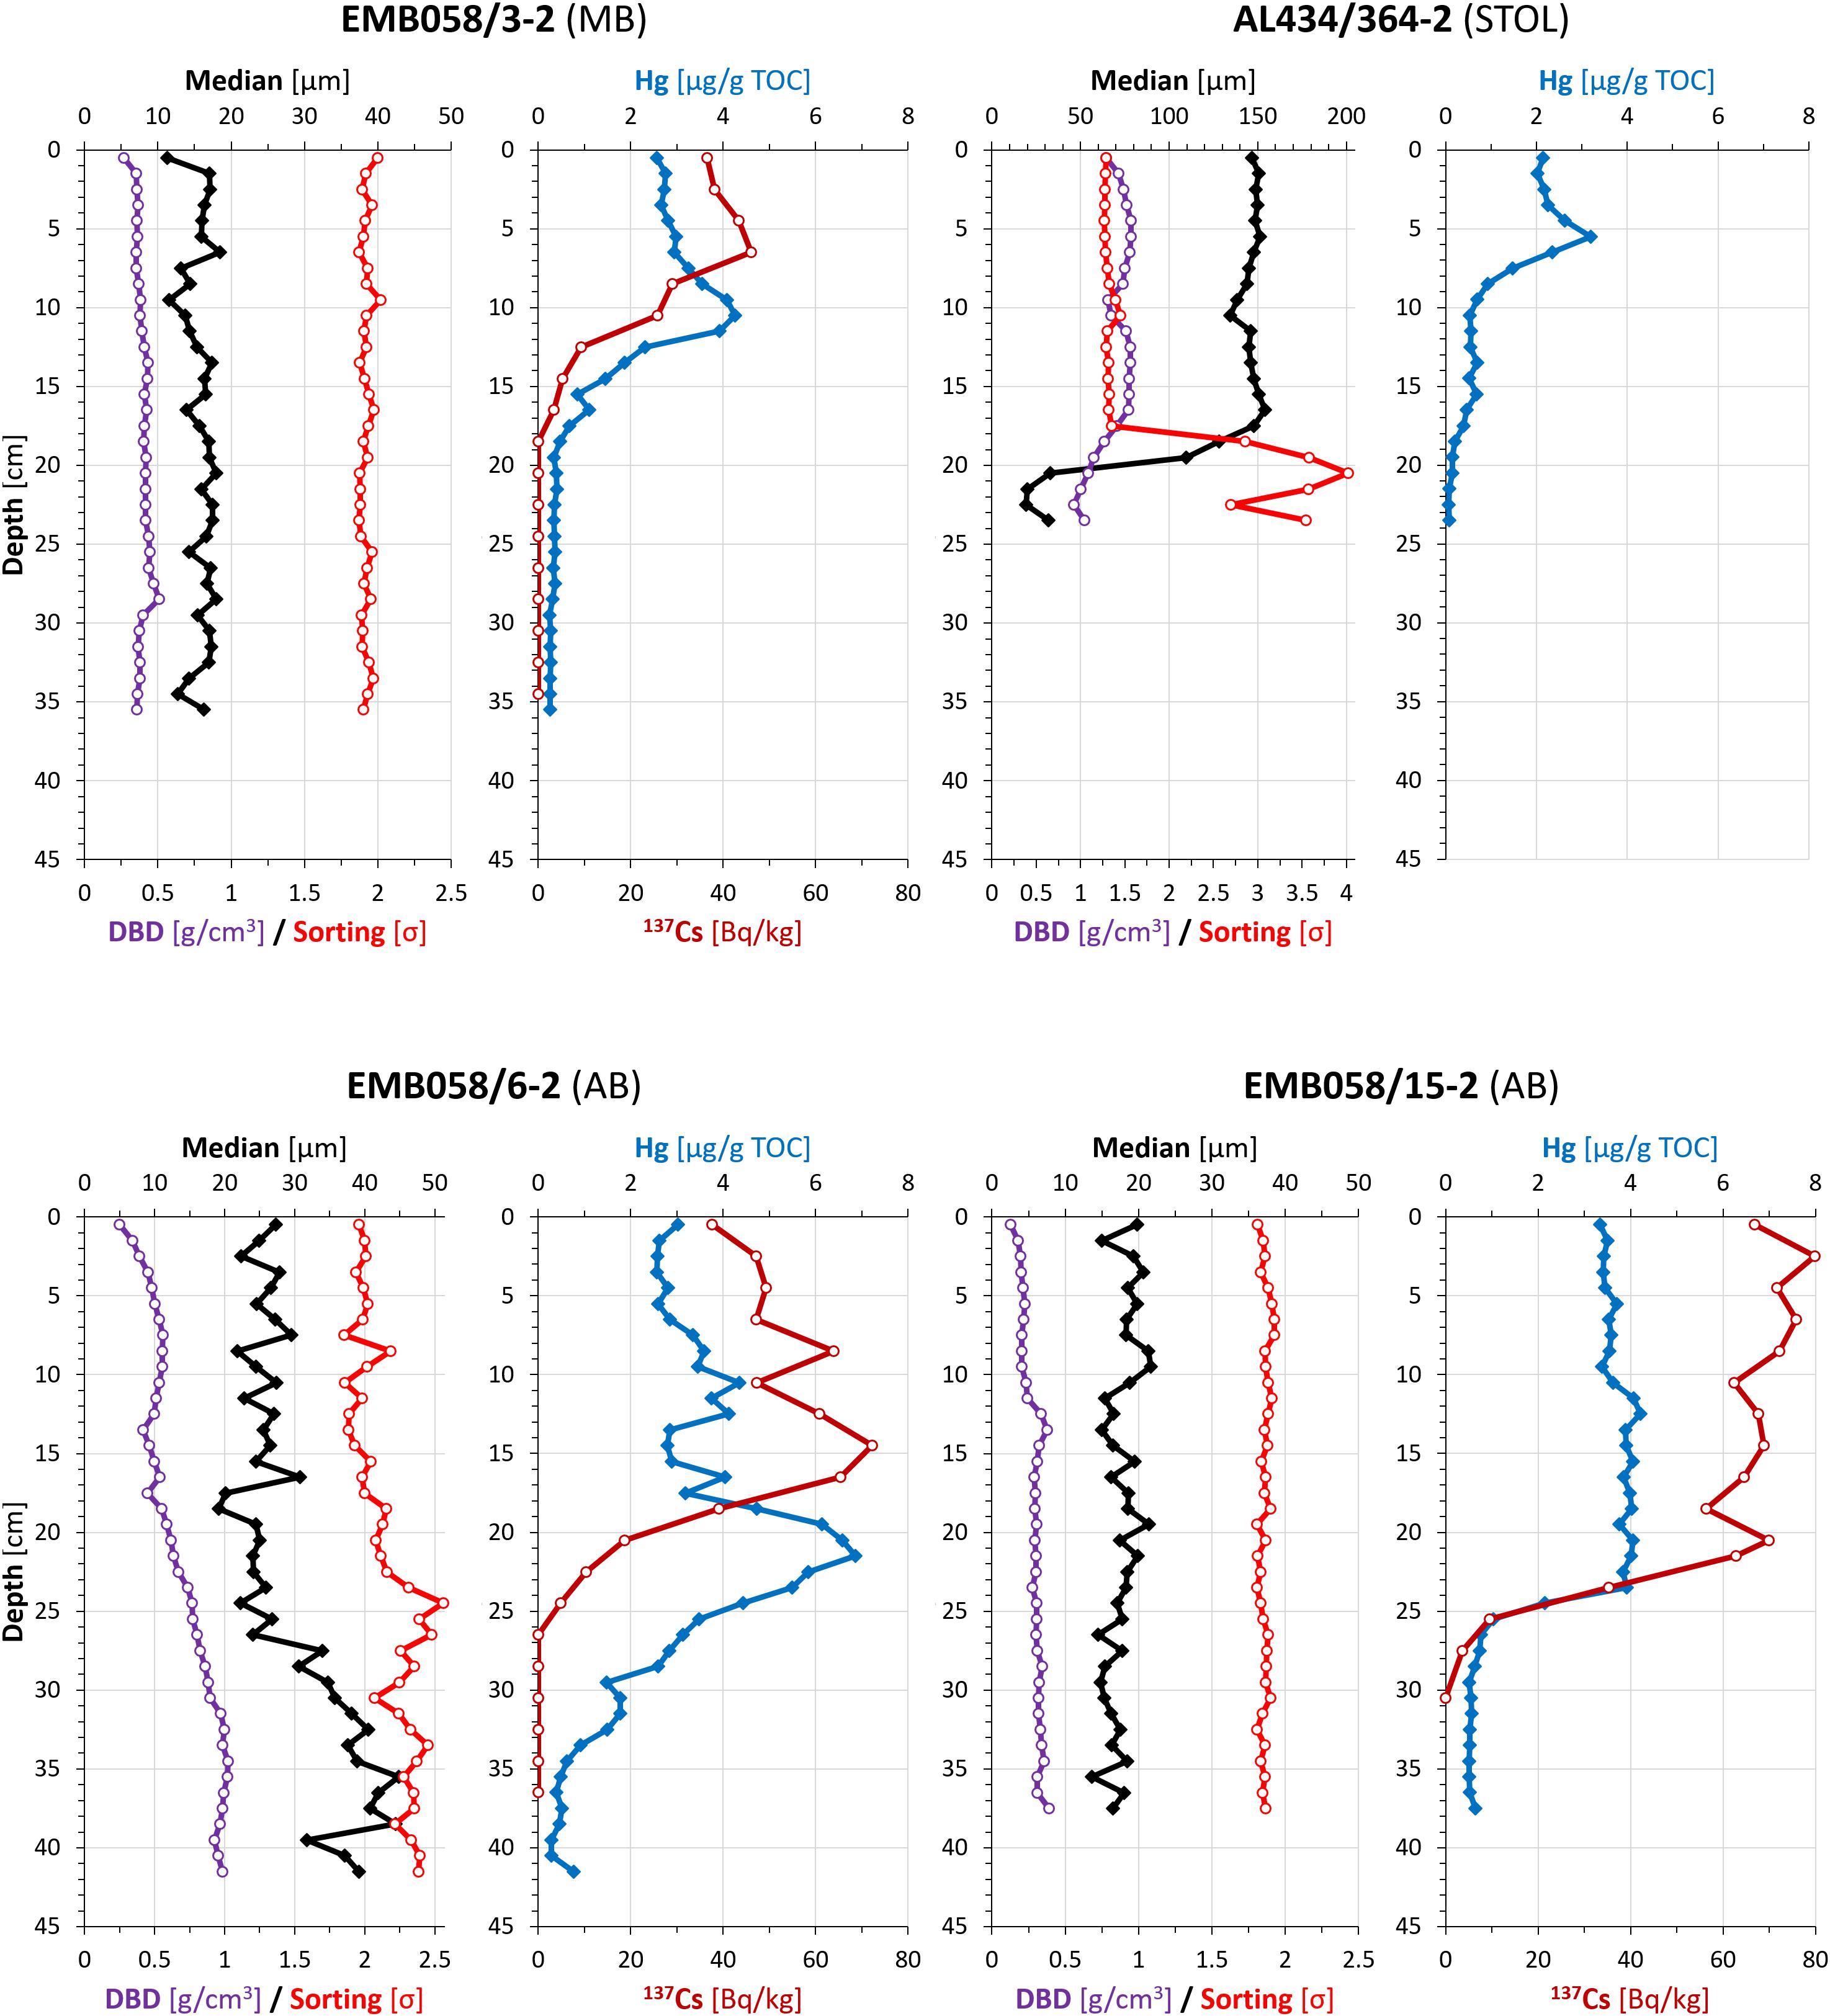
Figure 3. Dry bulk density (DBD; purple), median (black), sorting (standard deviation of particle size distribution; red), 137Cs (dark red) and TOC normalised Hg (blue) profiles of the studied cores from the Mecklenburg Bight (MB), Stoltera (STOL) and the Arkona Basin (AB). Notice the change in scale between mud (MB, AB) and sandy (STOL) cores. AL: R/V Alkor, EMB: R/V Elisabeth Mann Borgese.
In general, the DBD values are steadily increasing with depth due to sediment compaction (Figure 3). In the cores from the mud basins, the DBD ranges between 0.12–0.27 g/cm3 at the sediment surface and 0.31–0.56 g/cm3 in depths of 15–47 cm. Only in core EMB058/6-2 from the south-western edge of the Arkona Basin, the DBD increases to ca. 1 g/cm3 due to the increase in particle size. In the cores from the sandy and transitional areas, the DBD ranges between 0.37–1.55 g/cm3 at the surface and 0.92–1.61 g/cm3 in depths of 5–44 cm. Only in core AL434/364-2 from Stoltera, the DBD decreases to ca. 1 g/cm3 below 17 cm due to the decrease in particle size.
The resuspension experiments resulted in current velocities at which the first particles were separated from the sediment at different locations (Figure 4). For the basin muds, the sandy silts of the Tromper Wiek and the fine sands of Stoltera, sediment mobilisation occurred at 7–10 cm/s, while the fine sands on the Oder Bank resuspended at around 20 cm/s.
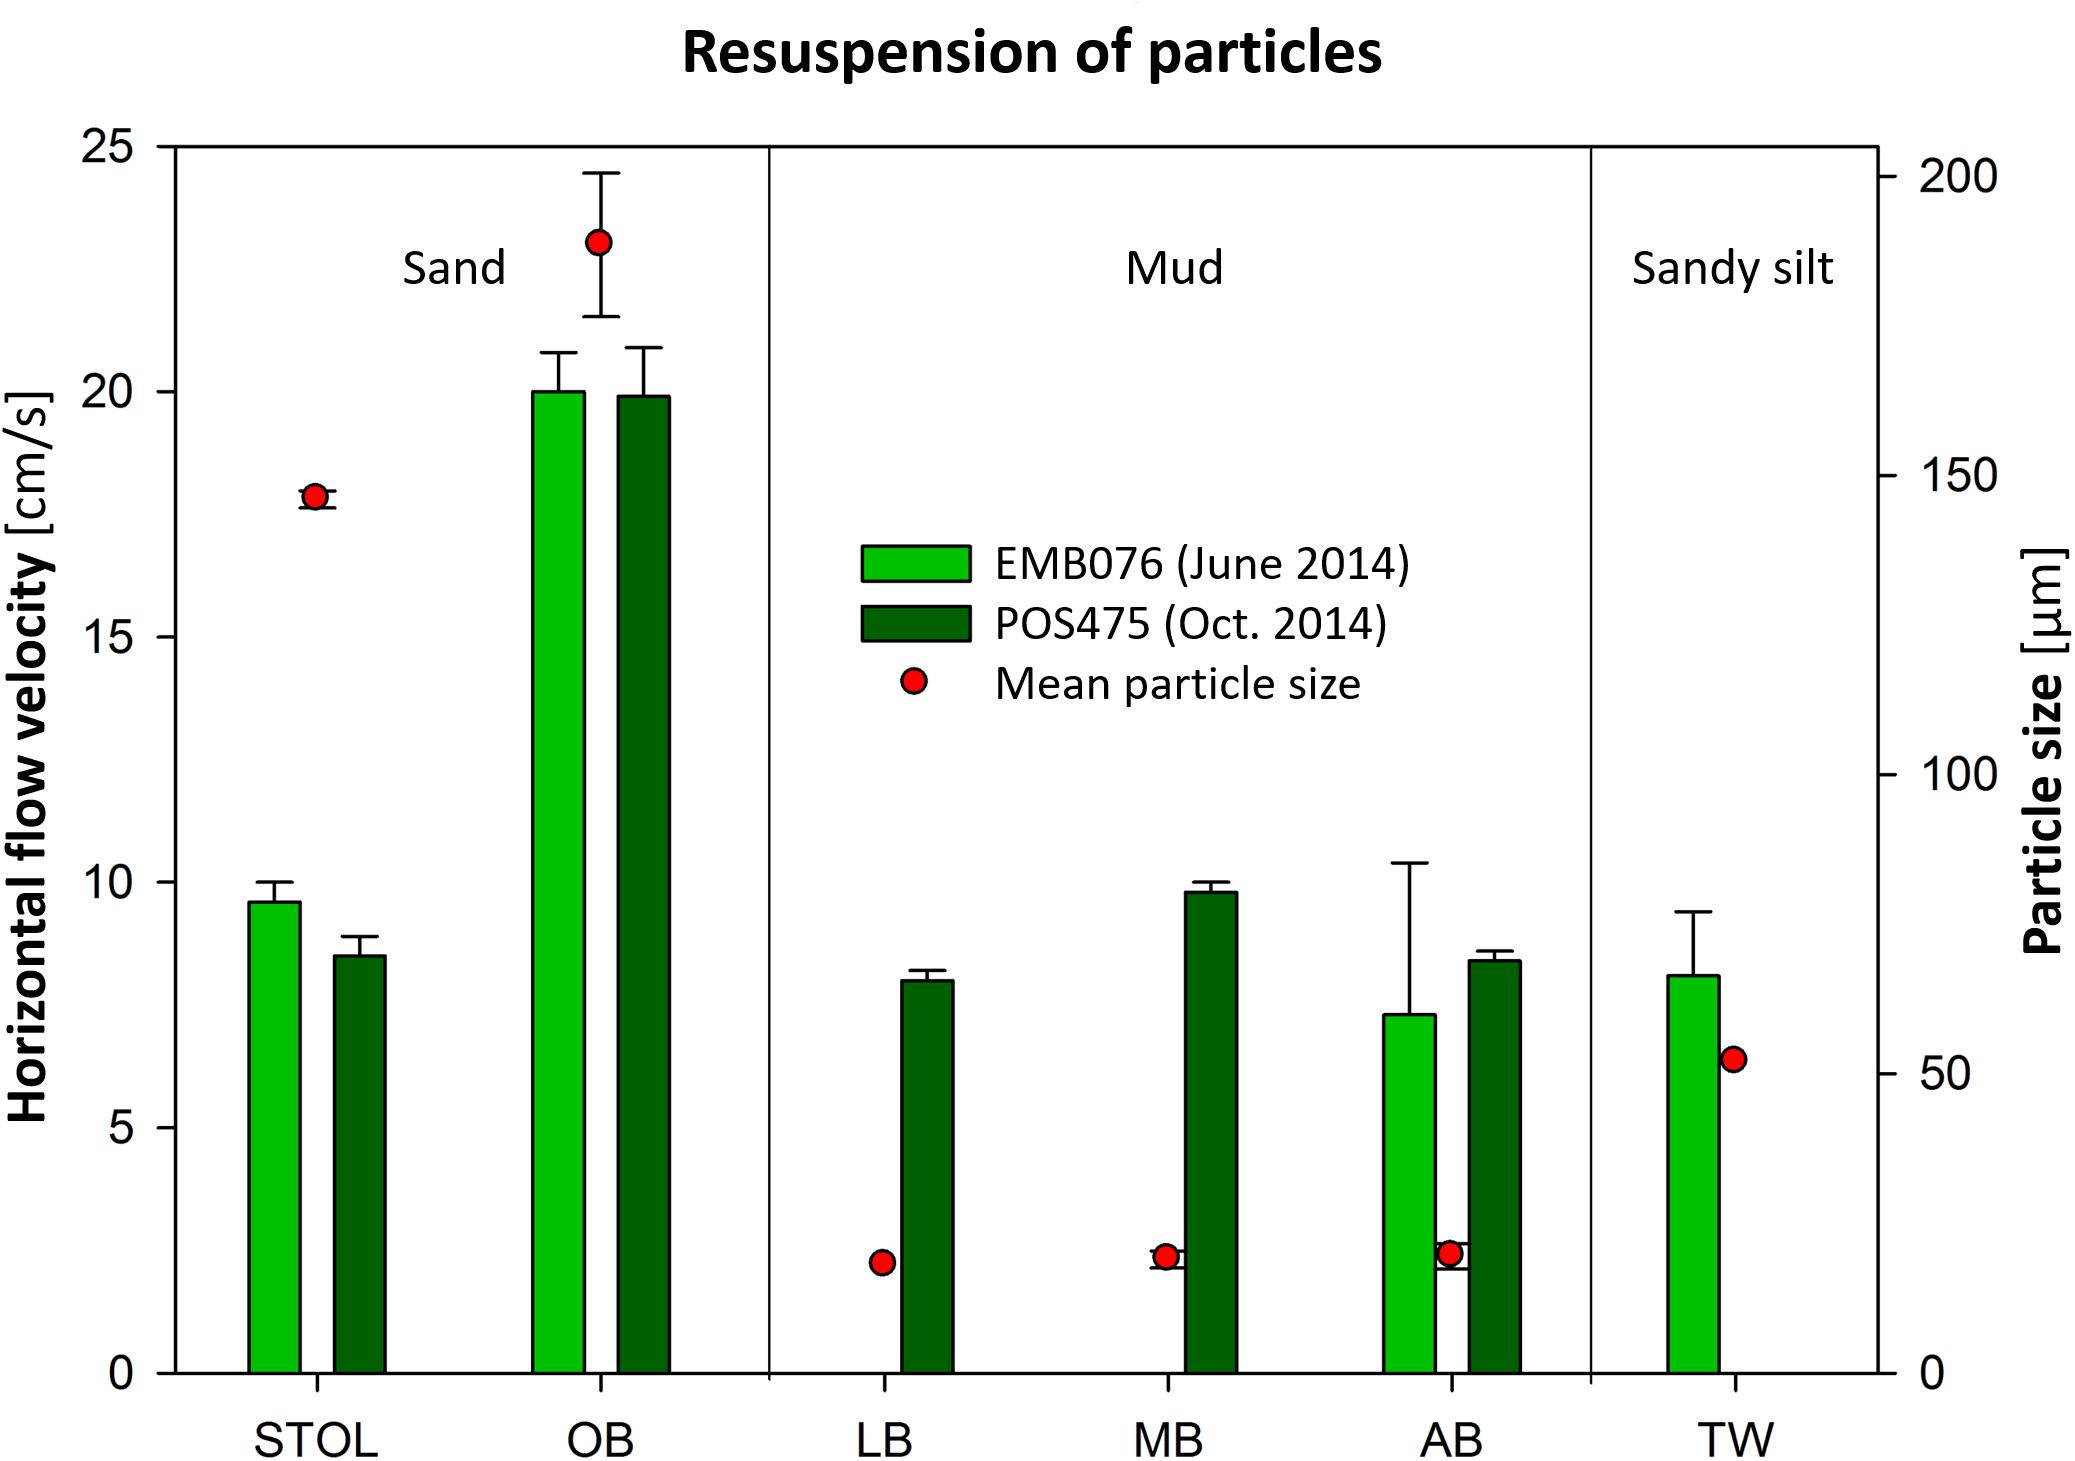
Figure 4. Experimentally determined flow velocities at which the first particles were resuspended from the seafloor sediment surface at different locations during research cruises in June (light green) and October (dark green) 2014. Red circles represent the local mean particle sizes. EMB: R/V Elisabeth Mann Borgese, POS: R/V Poseidon, AB: Arkona Basin, LB: Lübeck Bay, MB: Mecklenburg Bight, OB: Oder Bank, STOL: Stoltera, TW: Tromper Wiek.
Sedimentary Fabric
The negative X-radiographs show density differences within the sediment with brighter tones representing denser material. Deeper buried and thus compacted sediments are generally denser than surface sediments due to the smaller contents of water and organic material. In addition, coarse sediments in general are denser than fine sediments. In the cores POS475/54-1 and 57-10 from the Mecklenburg Bight, intervals of laminated to thin-bedded, sometimes bright-to-dark (upward) graded layers alternate with diffuse burrow-mottled intervals (Figure 5). The latter are characterised by some subhorizontal, tubular structures of darker material with or without bright linings (tube wall), and rare vertical burrows. Occasionally, discordant surfaces (minor angular unconformities) are recognisable in both cores. In contrast, the cores POS475/17-7, 19-2, and 22-1 from the Arkona Basin are almost entirely burrow-mottled by a lower abundance of predominantly subhorizontal tubular structures (Figure 5). Locally, convex laminated structures up to 3 cm in width are visible. Only in the cores POS475/17-7 and 19-2, a few normal graded layers and discordant surfaces appear. Moreover, the density sharply decreases at around 16 cm sediment depth in core POS475/19-2 from the south-western edge of the Arkona Basin, indicating an upward change to finer-grained material.
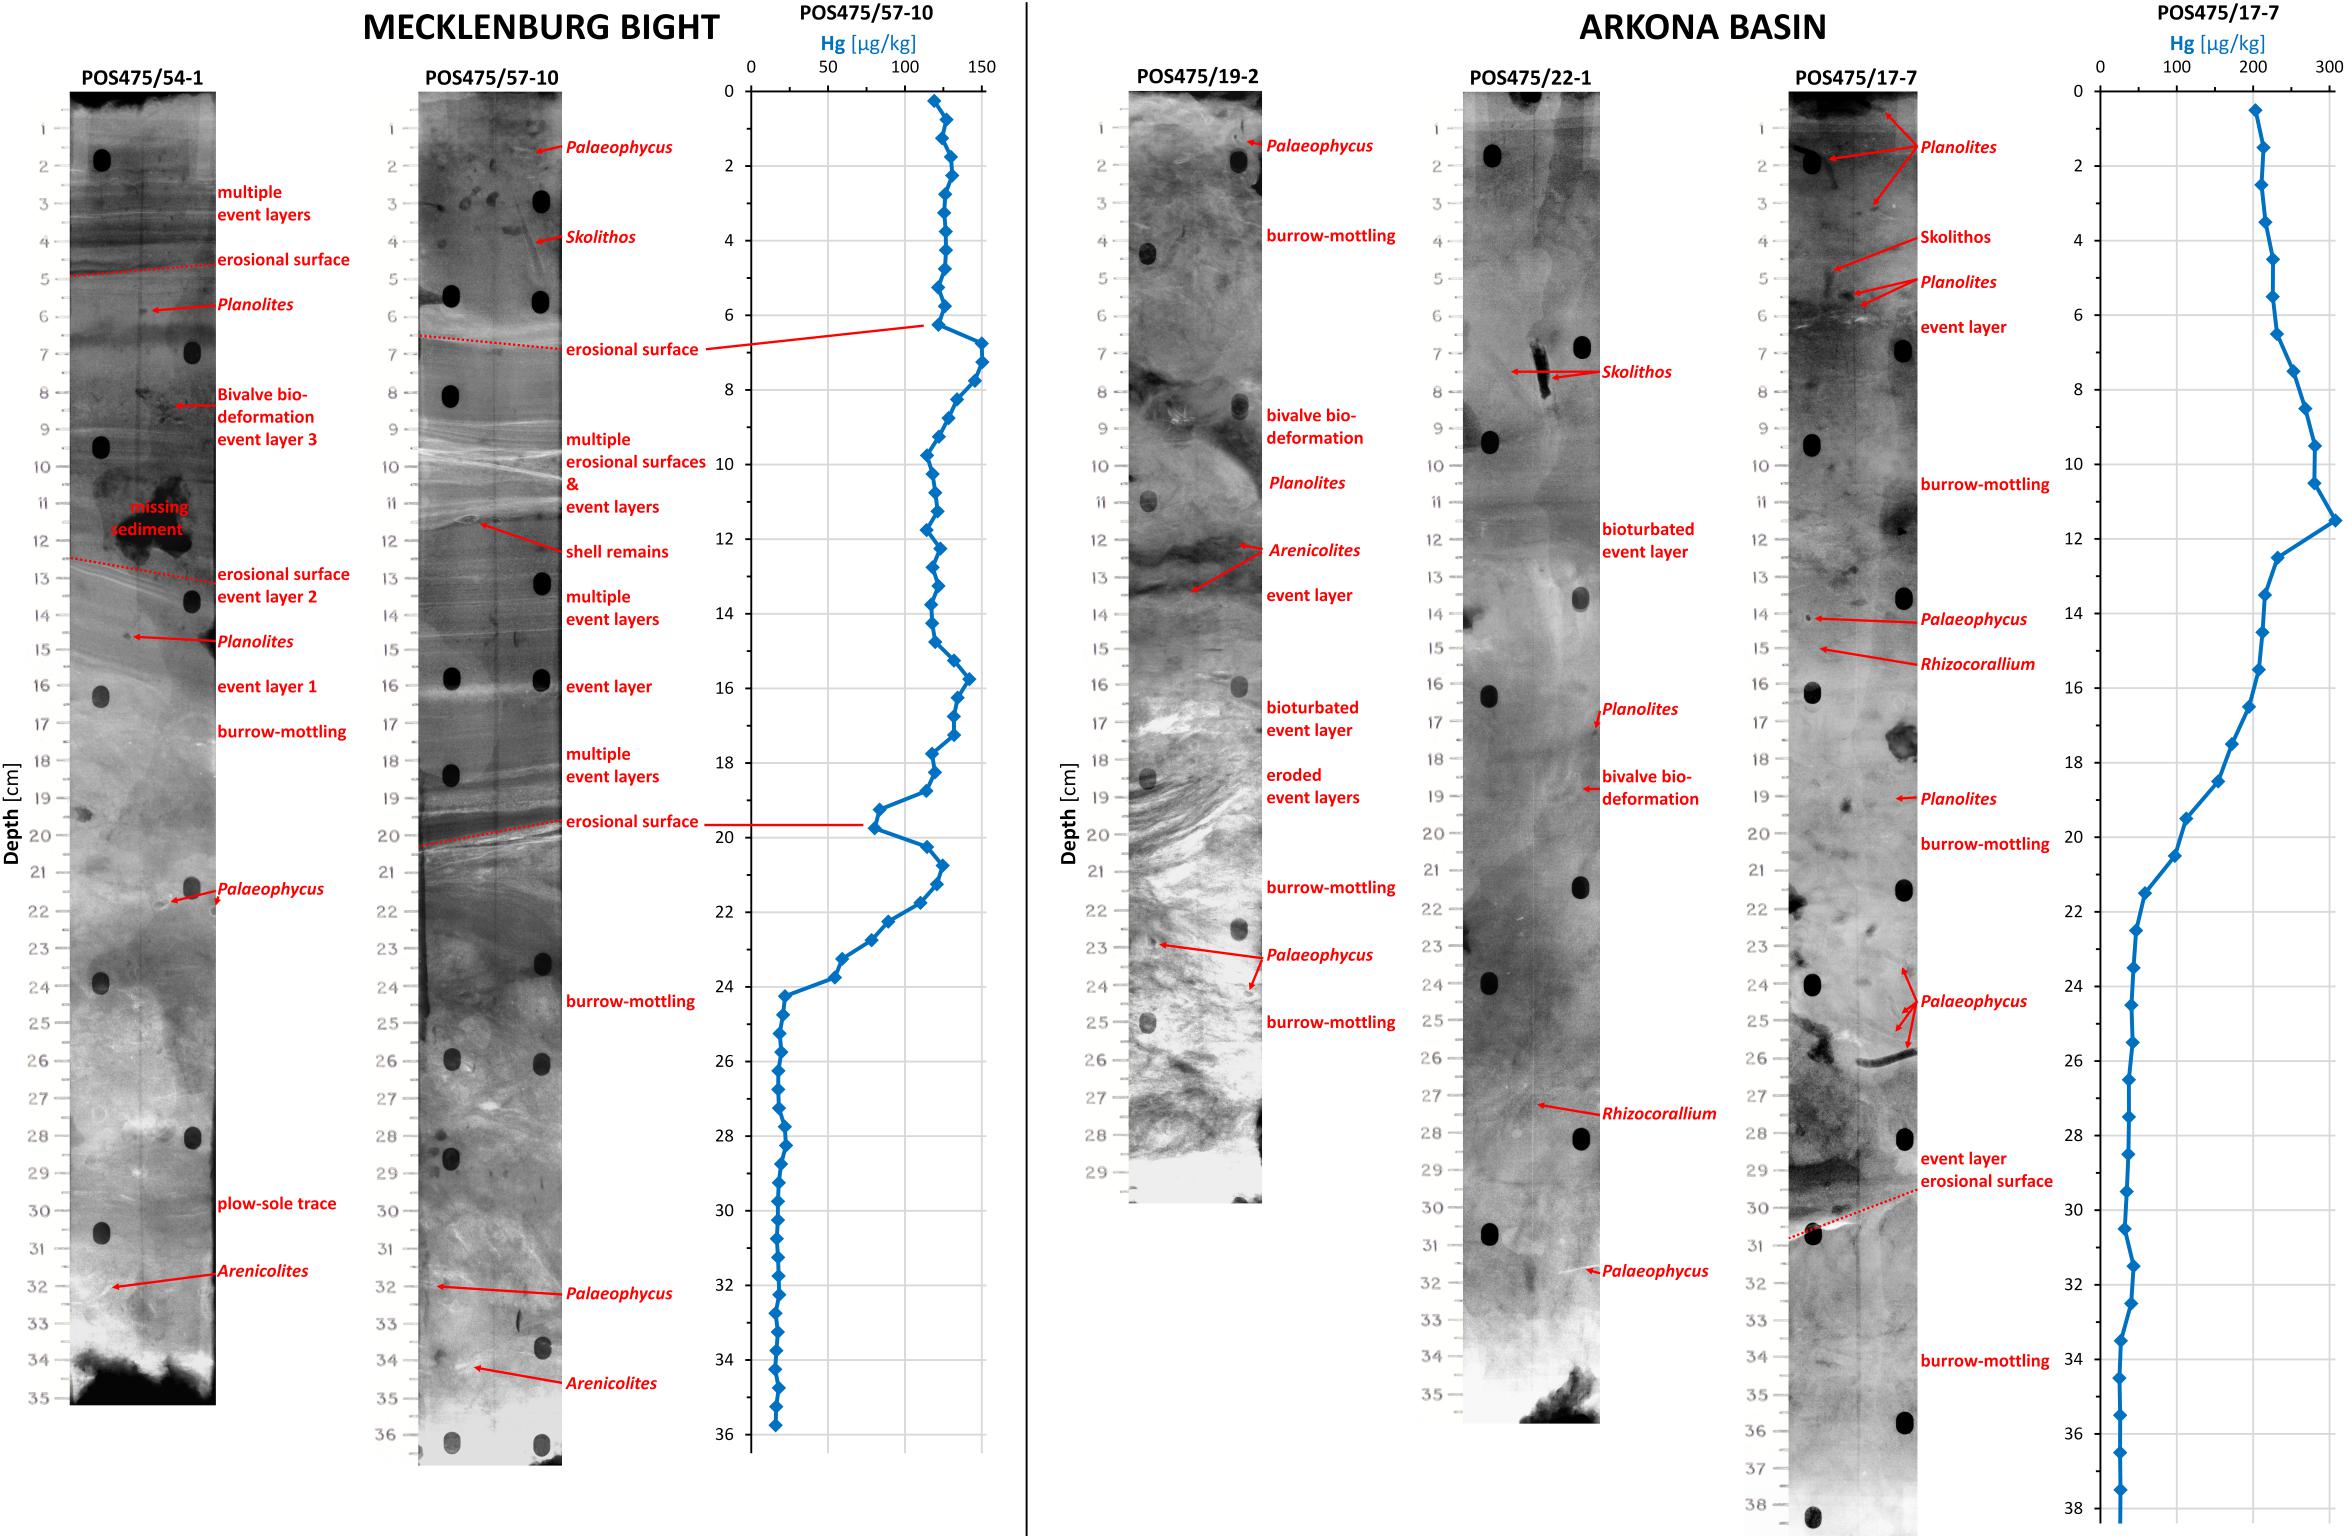
Figure 5. Negative X-radiographs and Hg profiles of selected cores from the Mecklenburg Bight (left) and the Arkona Basin (right) with interpreted sedimentary structures. The dark ovals are holes in the sample box and the straight vertical lines are gaps in the surrounding tape. POS: R/V Poseidon.
Organic Carbon
The TOC content is high (compared to the global average of marine surface sediments) with an average surface sediment value of 5.7 ± 1.3 wt.% in the basin muds and 4.4 ± 0.7 wt.% in the mud fraction of the sandy areas. Only in the Tromper Wiek (EMB076/2-21), the adjacent Sassnitz Channel (EMB058/11-2) and the south-western edge of the Arkona Basin (EMB058/6-2), the TOC content in the mud fraction is lower with values between 1.73 and 3.49 wt.%. The TOC contents in the Arkona Basin are slightly higher than in the Mecklenburg Bight, but highest in the mud fraction of the fine sands on the Oder Bank. In general, the profiles show a gentle down-core decrease of up to 3 wt.% in the upper 40 cm.
Mercury and Caesium-137
The down-core profiles of Hg and 137Cs show similarities in both the Arkona Basin and the Mecklenburg Bight (Figures 6A,B). In the lower parts of the cores, below 20–45 cm, the geogenic background is visible through low Hg values of around 0.5 μg/g TOC (this study; Leipe et al., 2013) and no 137Cs activity, followed by an in general steep increase to a maximum (up to 12.16 μg/g TOC for Hg and 99.99 Bq/kg for 137Cs) and a gentler decrease to the sediment surface (up to 4.54 μg/g TOC for Hg and 88.42 Bq/kg for 137Cs). While in most cores (e.g., EMB058/3-2 and 6-2), the profiles show a broad “peak” with an offset between Hg (deeper/earlier) and 137Cs (shallower/later), in others (e.g., EMB058/4-2 and 15-2), the maxima form plateaus with little to no decline and both parameters run parallel with nearly no offset. In core EMB058/16-2, the 137Cs increase takes place in two steps, interrupted by an almost 10 cm wide plateau.
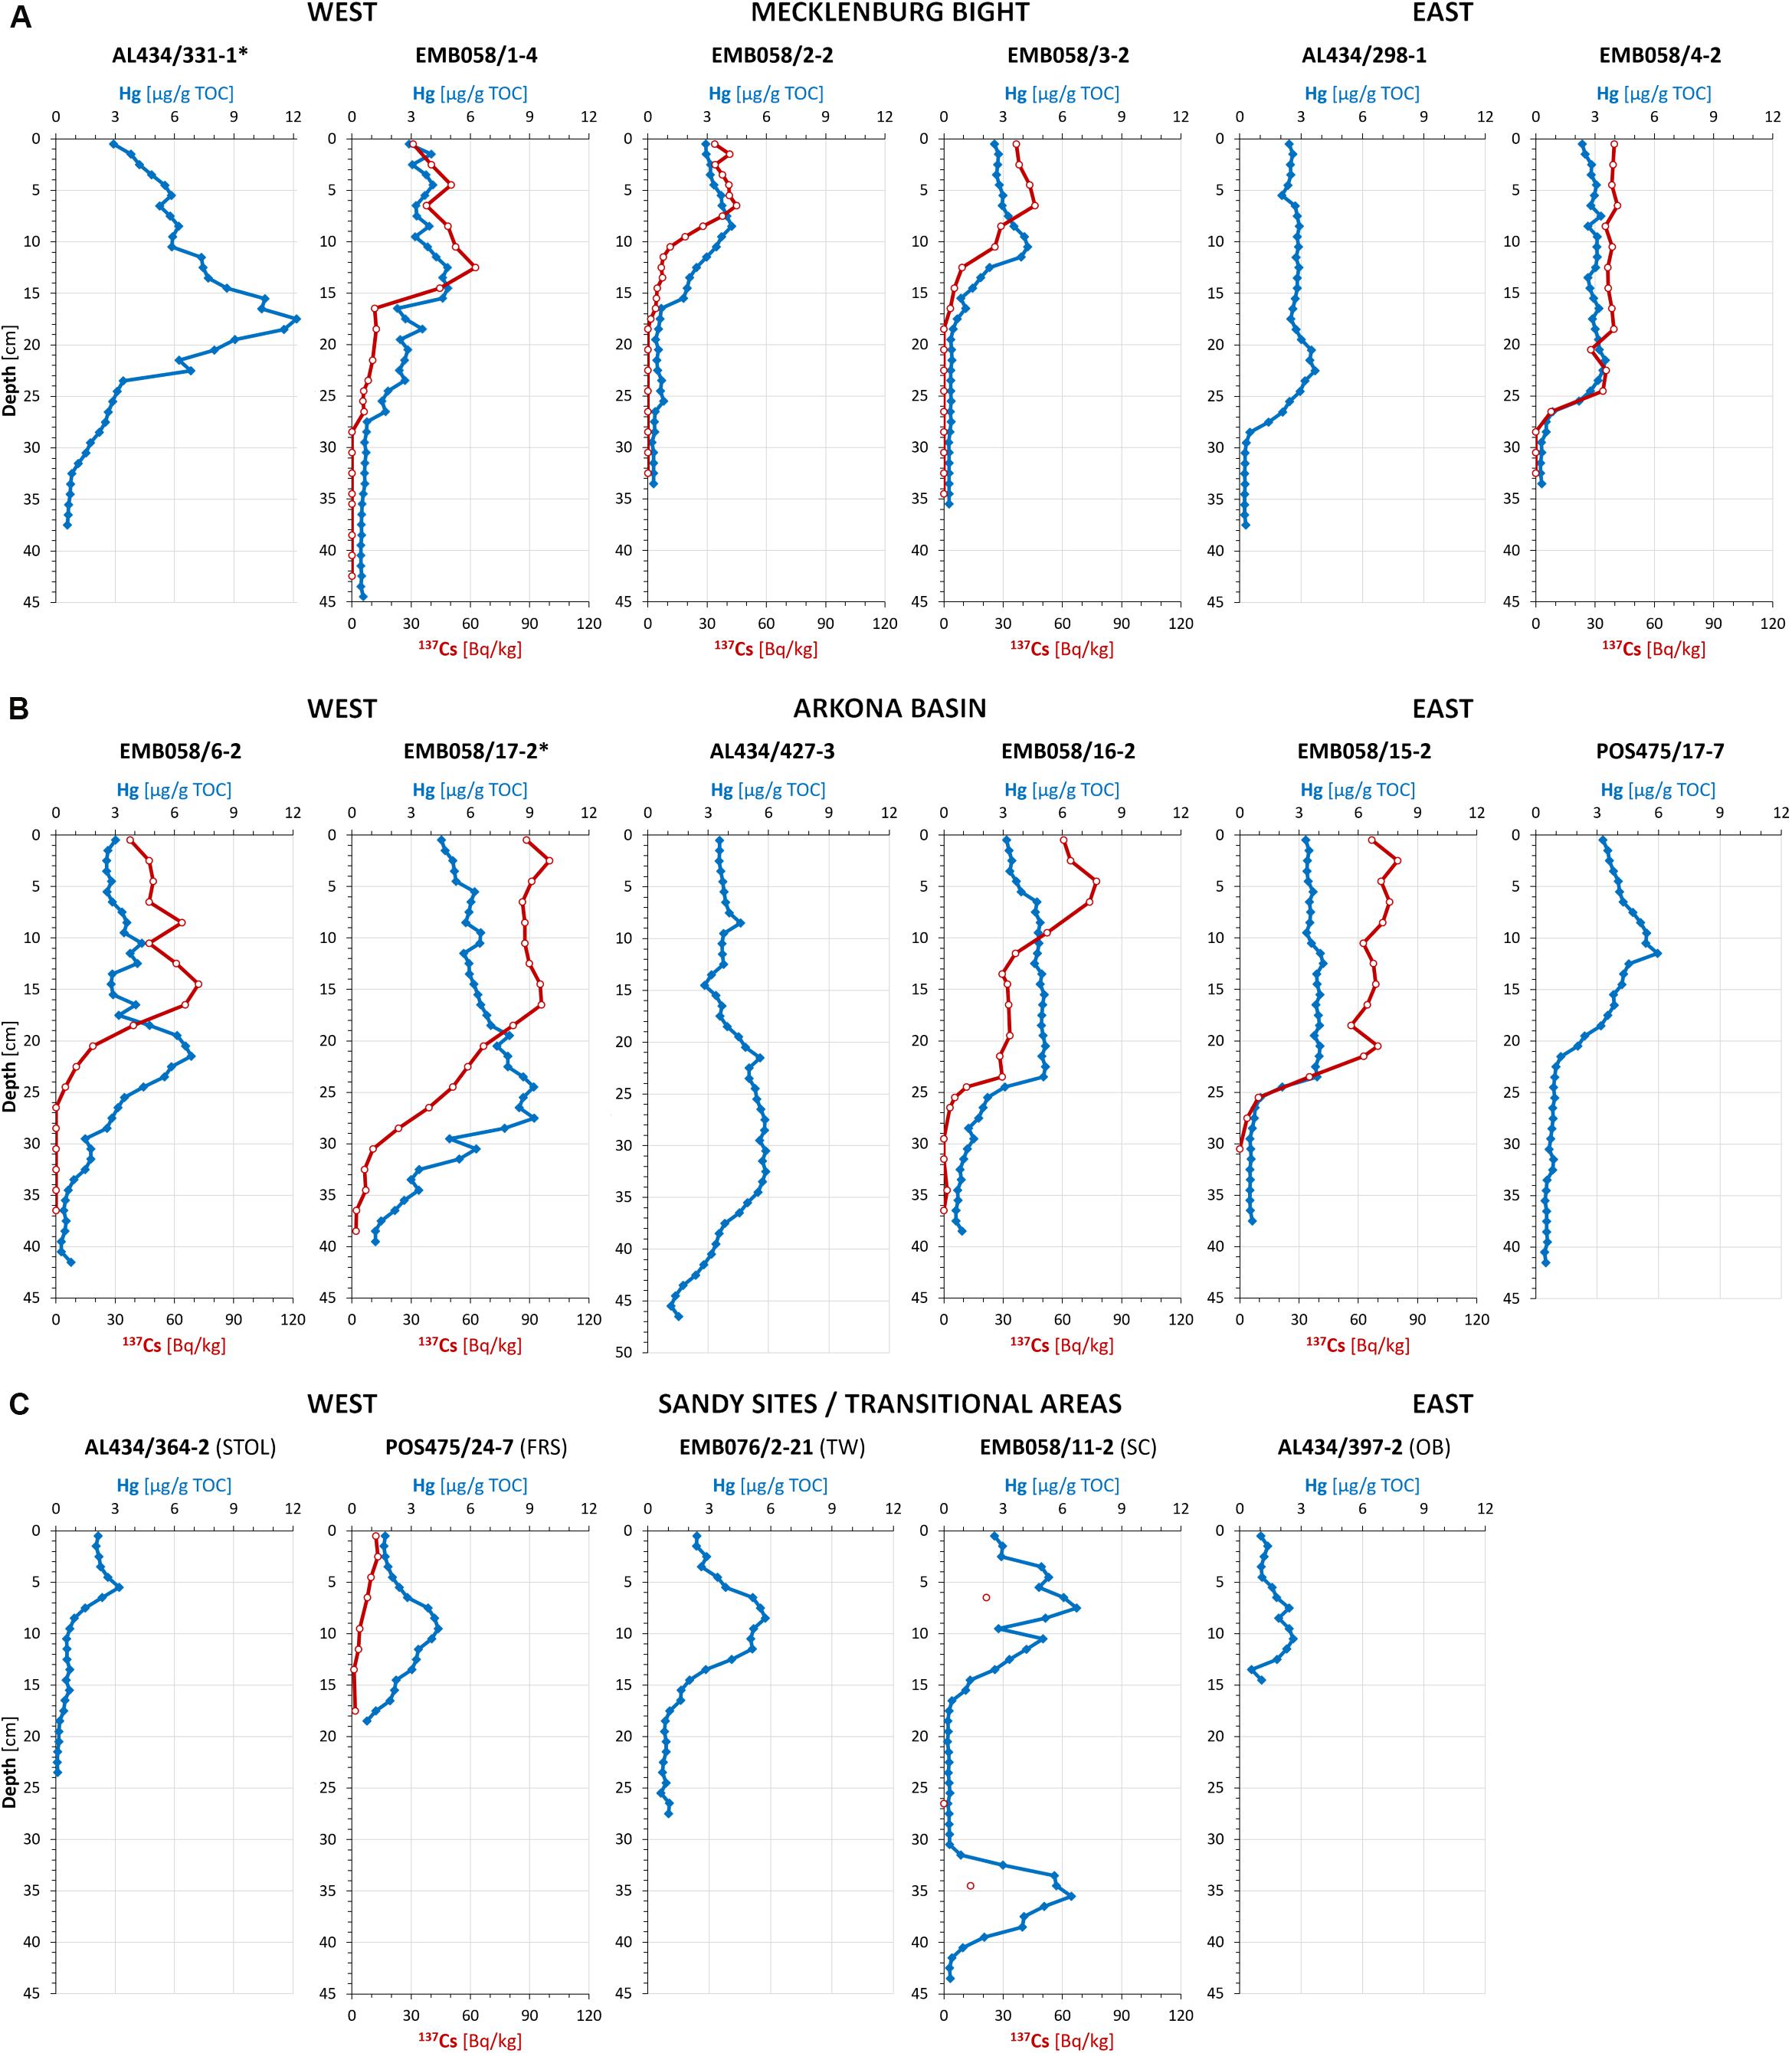
Figure 6. 137Cs (red) and TOC normalised Hg (blue) profiles of the studied cores from (A) the Mecklenburg Bight, (B) the Arkona Basin and (C) the adjacent sandy areas, arranged from west (left) to east (right). Stations in close vicinity to the local pollution hot spots are marked with an asterisk. Notice the decreasing surface and maximum Hg values with increasing distance to the hot spots as well as the different types of profile shapes. AL: R/V Alkor, EMB: R/V Elisabeth Mann Borgese, POS: R/V Poseidon, FRS: Falster-Rügen sand plain, OB: Oder Bank, SC: Sassnitz Channel, STOL: Stoltera, TW: Tromper Wiek.
The Hg profiles of the cores from the sandy areas bear a resemblance to each other and to a few profiles from the mud basins (Figure 6C). They show low geogenic background values of around 0.08–0.85 μg/g TOC below 20 cm, a relative smooth increase to a maximum (2.41–6.71 μg/g TOC) that lies between 5 and 10 cm, and a gentler decrease to the sediment surface with values above the geogenic background (1.03–2.56 μg/g TOC). However, the 137Cs profile of the core POS475/24-7 from the Falster-Rügen sand plain shows an upward activity increase from around 1 Bq/kg at 14 cm to 13 Bq/kg at the sediment surface. In core EMB058/11-2 from the Sassnitz Channel are two relatively sharp Hg maxima with 137Cs activity, one in the lower (6.45 μg/g TOC) and one in the upper part (6.71 μg/g TOC) with geogenic background values in between (0.27 ± 0.06 μg/g TOC and no detectable 137Cs activity).
Sea and Seafloor Conditions
During the storm “Xaver,” maximum wind velocities of about 25 m/s were reached at both stations on 6 Dec. 2013. At the same time, higher mean horizontal flow velocities of about 60 cm/s and 50 cm/s occurred in the bottom water of the Falster-Rügen sand plain (Figure 7A) and the Arkona Basin (Figure 7B), respectively. The bottom water salinity decreased from 14 PSU to 11 PSU at the “Darss Sill” station and from 16 PSU to 9 PSU at the station in the Arkona Basin, converging with the surface water salinity that increased simultaneously. The surface water turbidity also increased from under 0.5 NTU to maximal 8 NTU at the “Darss Sill” station and from around 0.3 NTU to maximal 0.8 NTU in the Arkona Basin at that time. During the storm “Irenäus” in mid-March 2018, wind velocities of up to 20 m/s and a more than three times higher than normal turbidity (2.3 NTU) of the surface water were measured in the Arkona Basin. During the MBI in December 2014, MARNET data show mean horizontal flow velocities of up to 50 cm/s on the Falster-Rügen sand plain and still up to 38 cm/s in the Arkona Basin (data not shown here).
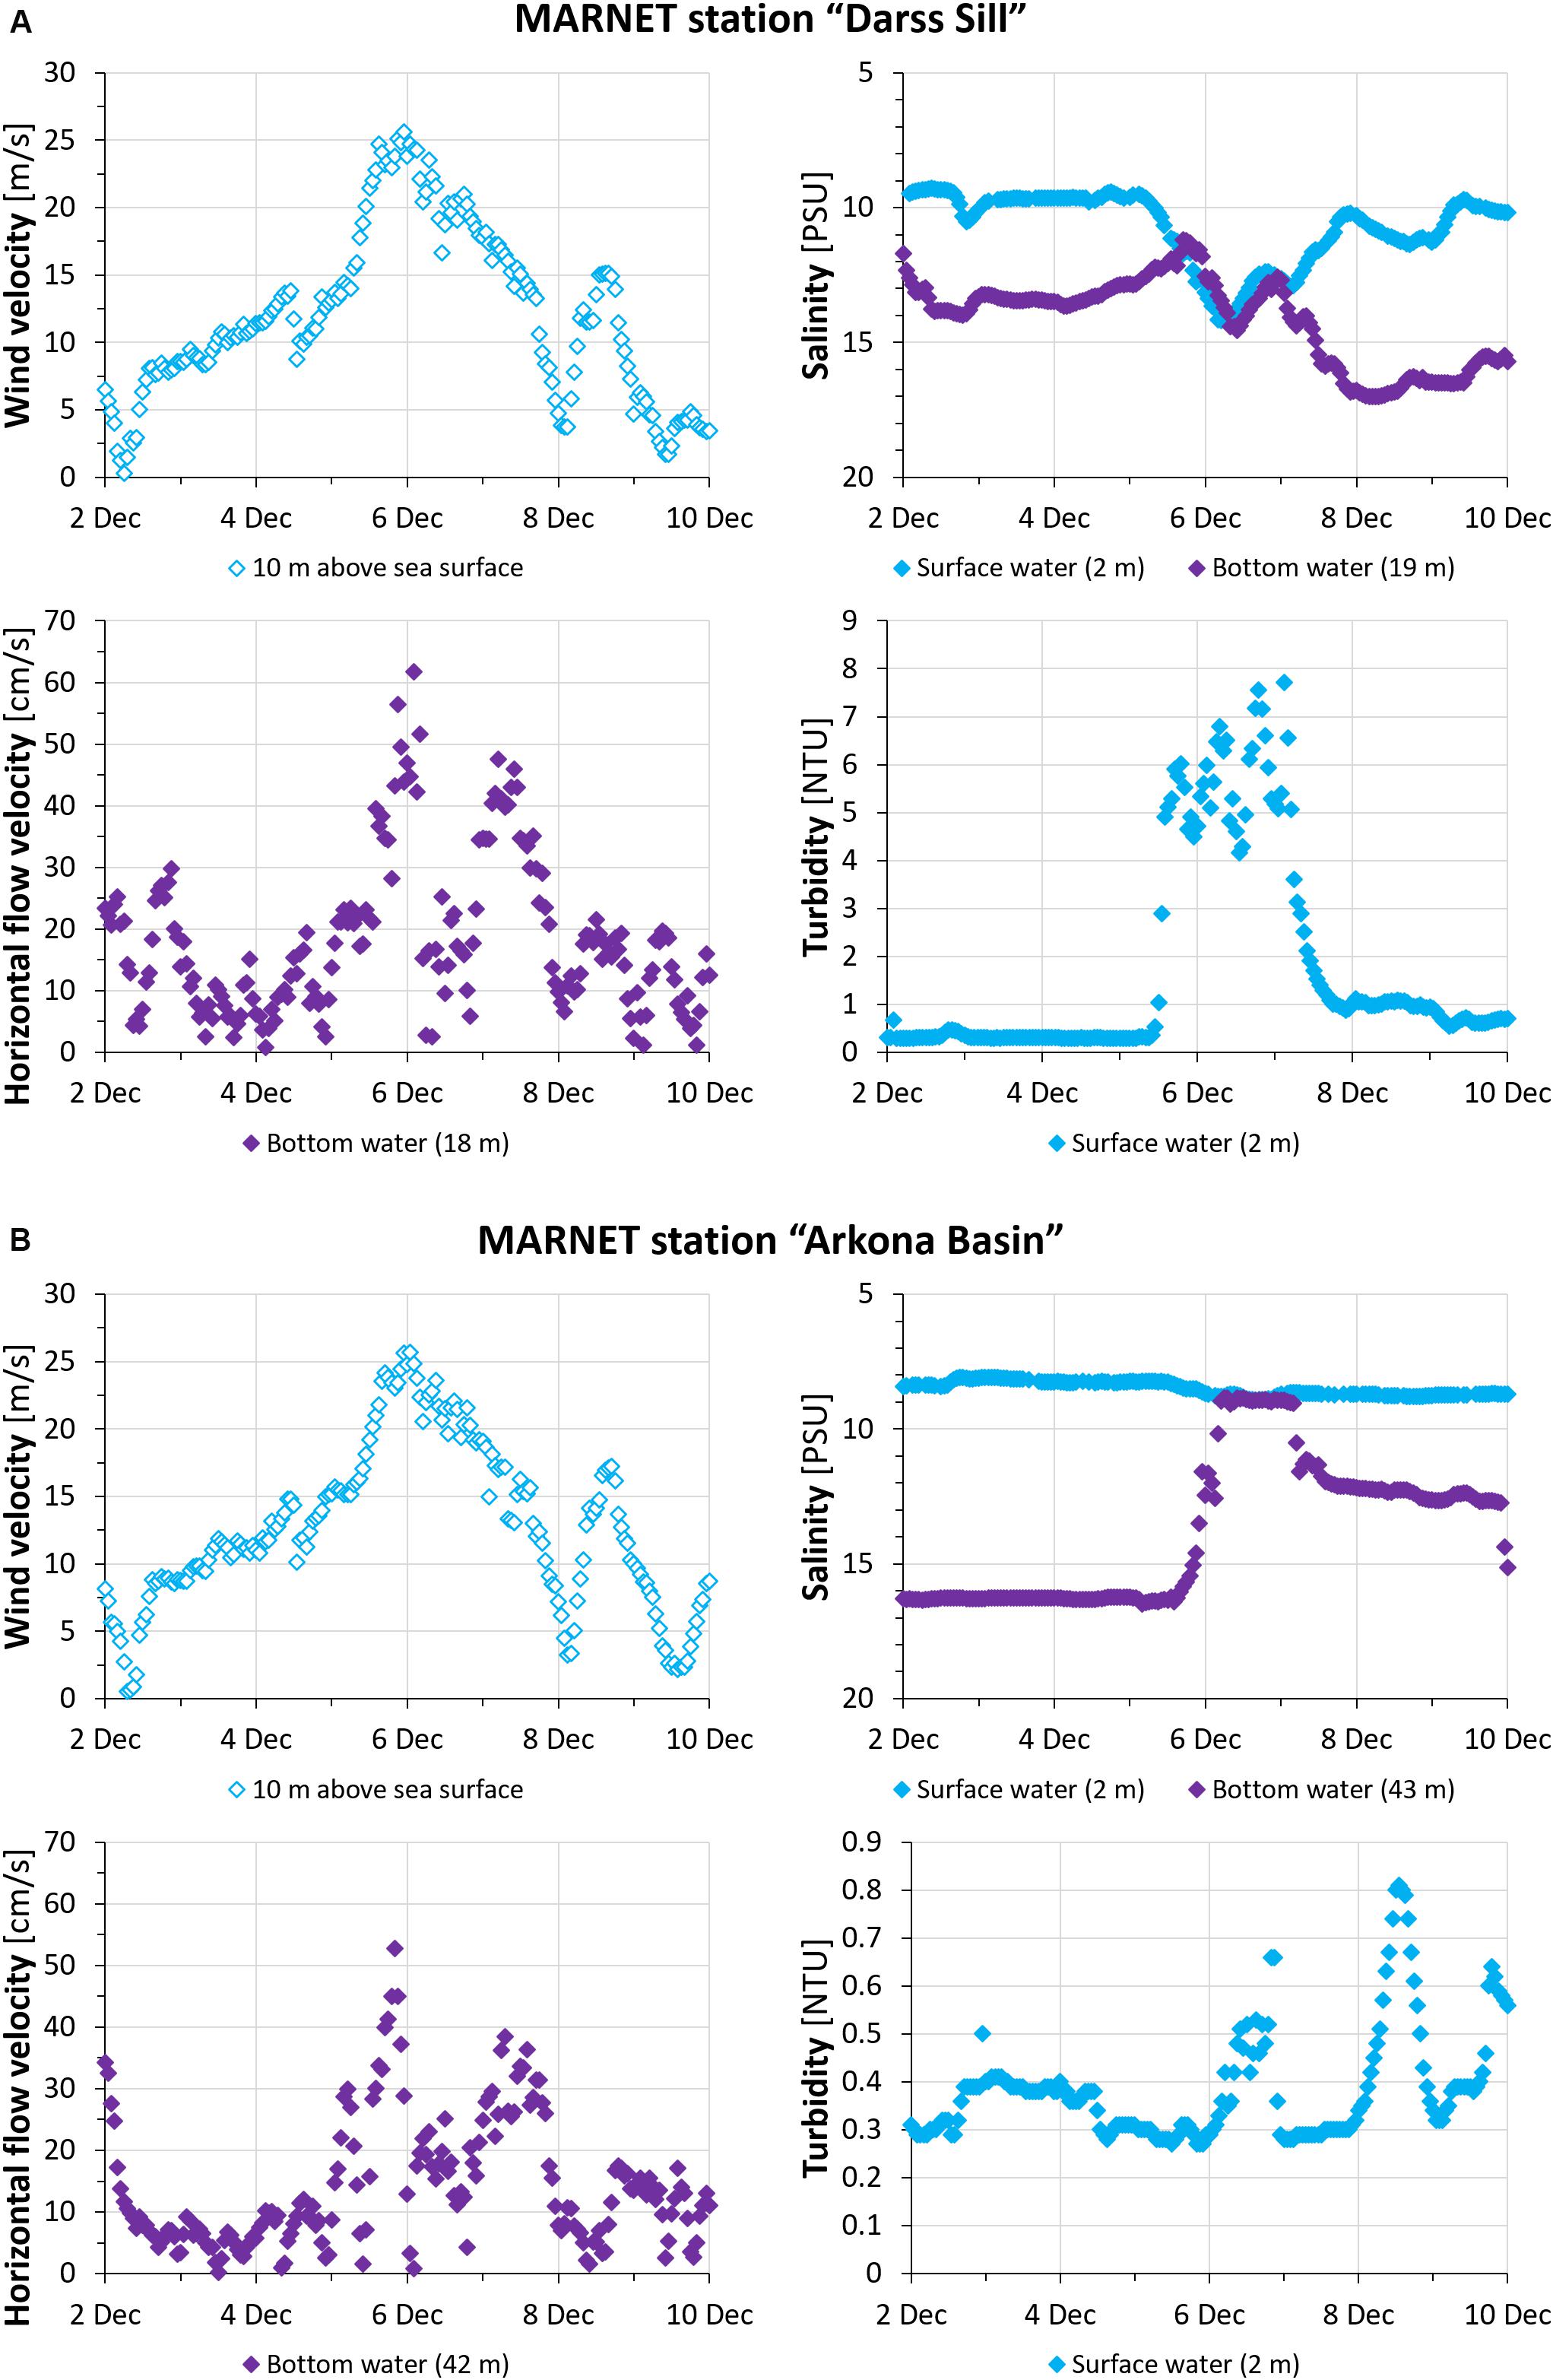
Figure 7. Meteorological and hydrological data from the automated measuring stations (A) “Darss Sill” on the Falster-Rügen sand plain and (B) “Arkona Basin” during the storm “Xaver” in December 2013. Notice the higher surface water turbidity and the congruence of surface and bottom water salinity during and shortly after the wind and flow velocity maxima on 6 Dec. 2013. Data from BSH/IOW (2013).
The assessment of side-scan sonar images revealed an extensive pattern of multiple cross-cutting tracks in the muds of the Mecklenburg Bight and the Arkona Basin (Figure 8).
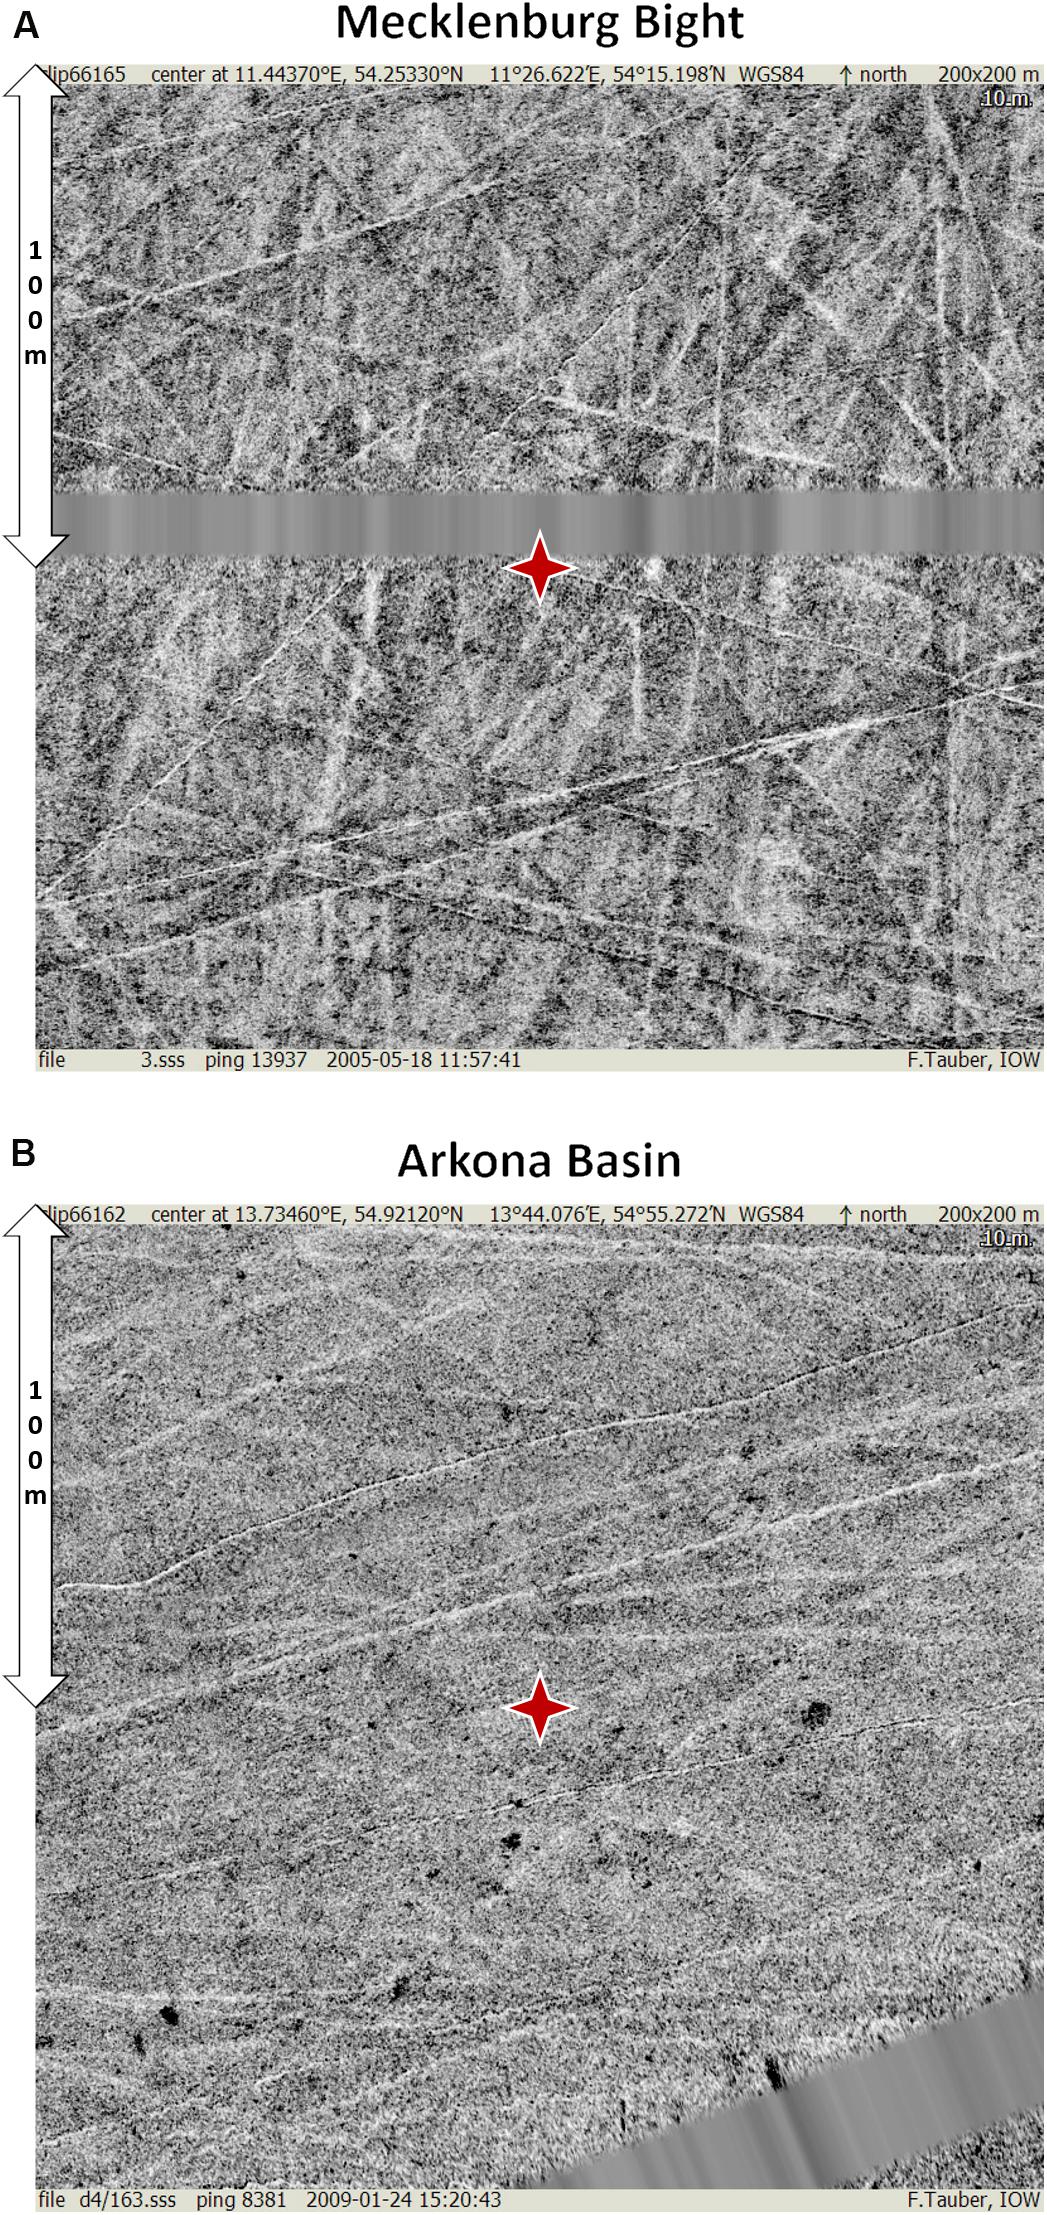
Figure 8. Sidescan-sonar images of the seafloor around coring sites (A) EMB058/3-2 in the Mecklenburg Bight in 2005 and (B) EMB058/15-2 in the Arkona Basin in 2009 display multiple generations of bottom-trawl tracks.
Sediment Accumulation
If no sediment mixing is considered (scenario 1), the LSRs and MARs reach values of 1.7–3.1 mm/a and 0.64–0.98 kg/m2/a in the Mecklenburg Bight and 2.9–3.5 mm/a and 0.93–1.86 kg/m2/a in the Arkona Basin (Table 2). An assumed mixing depth of 7.1 cm (scenario 2) leads to lower net rates of 1.1–2.5 mm/a and 0.40–0.78 kg/m2/a in the Mecklenburg Bight and 2.3–2.9 mm/a and 0.73–1.48 kg/m2/a in the Arkona Basin. An assumed mixing depth of 19 cm (scenario 3) results in lowest net rates of 0–1.4 mm/a and 0–0.45 kg/m2/a in the Mecklenburg Bight and 1.2–1.9 mm/a and 0.39–0.82 kg/m2/a in the Arkona Basin. Remarkable are the relatively high net rates in the core EMB058/6-2 from the south-western edge of the Arkona Basin as well as the particularly low net rates in core EMB058/3-2 from the central Mecklenburg Bight, which even fall to zero in the third scenario.
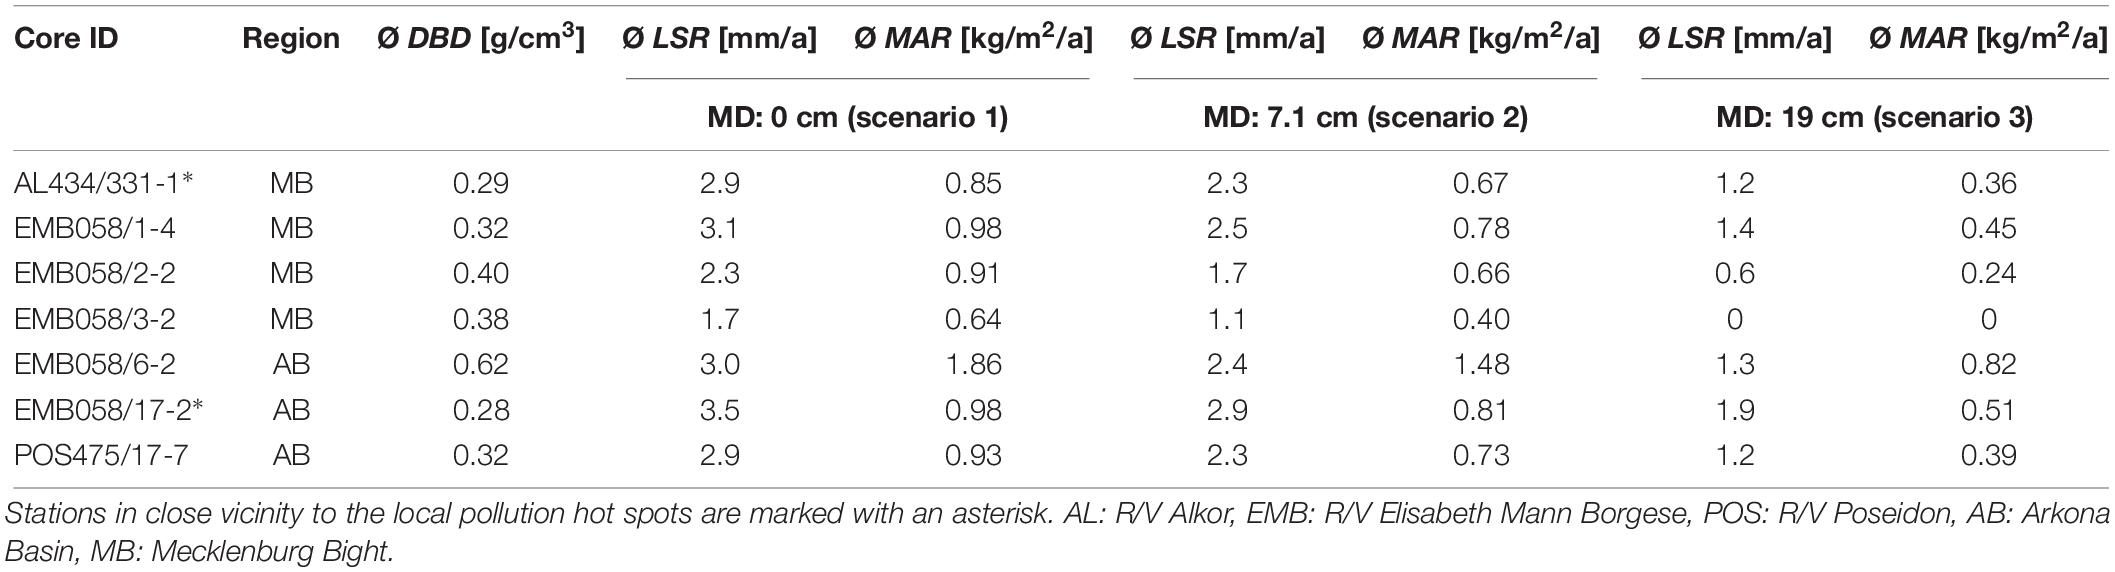
Table 2. Mean dry bulk densities (DBD), net linear sedimentation rates (LSR) and mass accumulation rates (MAR) of selected mud cores assuming a mixing depth (MD) of 0 (scenario 1), 7.1 (scenario 2), and 19 cm (scenario 3), respectively.
Discussion
The variations of Hg and 137Cs in the studied cores are mainly due to input changes (pollution vs. environmental measures) as well as post-depositional mixing processes. They are not dominated by other parameters like DBD or particle size that show mostly minor variations (Figure 3). The profiles of Hg and 137Cs indicate varyingly strong sediment mixing processes down to depths between 5 and 25 cm (Figure 6). Some mud cores allow the recognition of the relative timing of deposition (offset between Hg and 137Cs) and associated temporal trends. Others show mixed signals that in some cases coincide, forming plateaus of homogeneously distributed (mixed) Hg content and 137Cs activity. This is quite remarkable considering the temporal input differences of these two elements and points to significant spatial differences in the intensity of post-depositional sediment mixing. In addition, the subsurface occurrence of Hg and 137Cs in the sandy cores (no net sediment deposition) proves an intermixture of these anthropogenic contaminants with older sediments (Figure 6C). In the following sections, the different mixing processes and their effects on the sediments in the south-western Baltic Sea will be discussed, distinguishing between biogenic, hydrodynamic and anthropogenic impacts.
Bioturbation: Biogenic Mixing
Diffuse mottled intervals in the negative X-radiographs (Figure 5) indicate that the basin muds are biomixed by indistinct background burrow-mottling of benthic organisms with sporadic discrete and identifiable tubular structures and burrows (ichnofossils). The archetypal Cruziana ichnofacies predominates, with various subsurface and/or surface deposit-feeding structures (Table 3; Virtasalo et al., 2011 and references therein). Arenicolites, Palaeophycus, Planolites, Rhizocorallium, and Skolithos are produced by polychaetes, while bivalves produce the observed convex laminated structures (bivalve biodeformation) and plow-sole traces (Werner, 2002; Virtasalo et al., 2011). This interpretation agrees with recent macrozoobenthic studies in the area (Schiele et al., 2015; Gogina et al., 2017; Morys et al., 2017), suggesting that the western Baltic Sea basins are mainly populated and bioturbated by infaunal bivalves (e.g., Abra alba, Arctica islandica, Kurtiella bidentata, and Limecola balthica), the crustacean Diastylis rathkei as well as polychaetes like Capitella capitate, Nepthtys hombergii, and Scoloplos armiger. Furthermore, Morys et al. (2016, 2017) did parallel photometric measurements of the natural particle tracer chlorophyll α, which is thought to behave like sediment particles and track the mixing of fresh organic matter (Maire et al., 2008). Based on exponentially decreasing chlorophyll α concentrations and macrozoobenthos abundances, the authors found a dominance of surficial biodiffusors in the Mecklenburg Bight. In the Arkona Basin, the depth distribution of chlorophyll α (subsurface maxima) and organisms (most importantly bivalves and polychaetes) indicate a dominance of burrow-mottling. The resulting bioturbation depths range between 5.2 ± 1.7 and 7.1 ± 1.6 cm in the south-western Baltic Sea (Morys et al., 2016). This ongoing bioturbation is responsible for slight perturbations of the Hg and 137Cs profiles that blur the temporal signals but preserves their relative order.
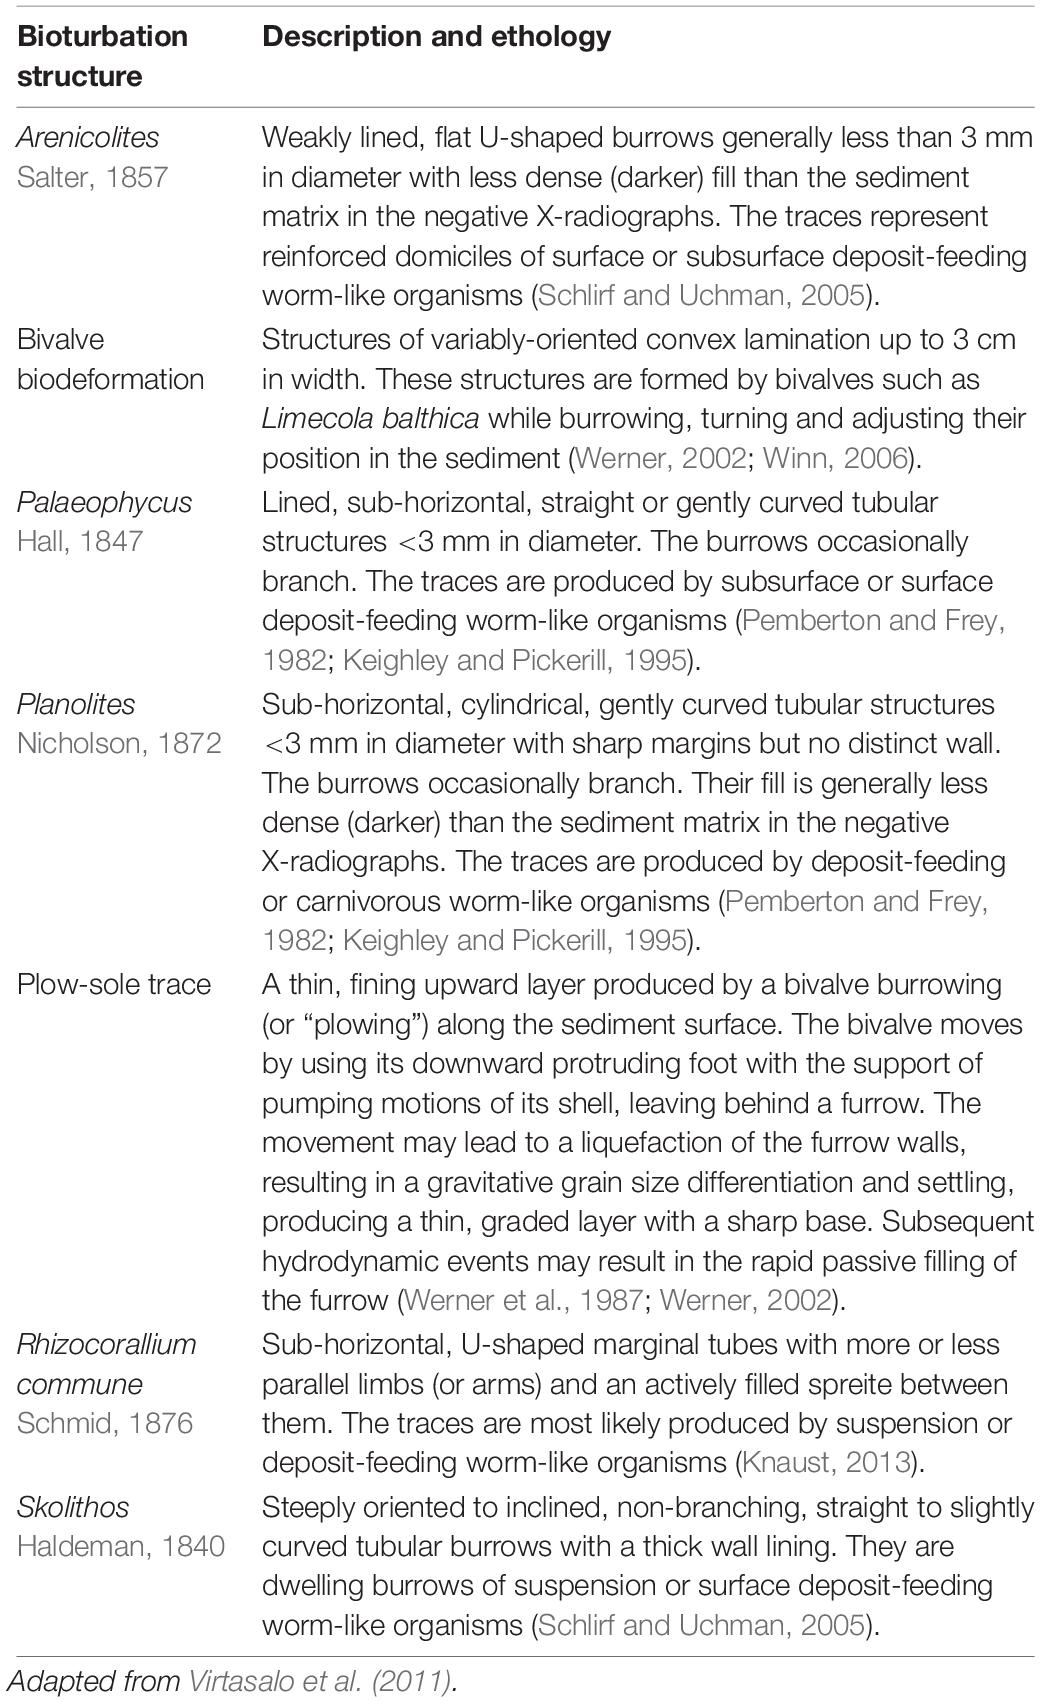
Table 3. Ichnogenera and other bioturbation structures identified in the studied cores.
Hydroturbation: Hydrodynamic Mixing
During fair weather conditions, the influence of waves is insignificant at the bottom of the basins, because the wave energy decreases strongly with increasing water depth and is moreover absorbed by internal density boundaries (pycnoclines) of the waterbody. Data from a high-resolution wave model (SWAN version 41.01), covering the Baltic Sea area west of 15°E, indicates that the maximum wave friction velocity in 2014 did not exceed 0.02 m/s in both the Arkona Basin and the Mecklenburg Bight (Schulz, 2017). During the storm “Xaver”, however, wind velocities of up to 25 m/s led to mean horizontal flow velocities of more than 50 cm/s in the bottom water (Figure 7). The linkage between wind and flow velocity is confirmed by the convergence of the lower surface salinity and the higher bottom water salinity with similar values during the time of highest velocities, indicating a homogenisation of the water column. The higher surface water turbidity during the same time suggests that sediment was resuspended in the water. In comparison with the experimentally determined resuspension velocities of 7–20 cm/s (Figure 4), the data indicate that storms have the potential to resuspend and laterally transport sediments in the western Baltic Sea, even in 50 m water depth. This is also evident from north-east stretching geochemical aureoles of contaminated sediments around the local Hg pollution hot spots (Leipe et al., 2017). According to Kersten et al. (2005), sufficiently strong storm events for sediment resuspension occur approximately six times a year (mainly during the winter season), based on wind data obtained at Cape Arkona from 1980 to 2002. Furthermore, they found storm-generated sediment mixing down to 10 cm in the Mecklenburg Bight (around 23 m water depth) by interpreting activity profiles of the short-lived natural radionuclide 234Th (half-life of 24.1 days) in sediment cores.
Laminated to thin-bedded, bright-to-dark graded intervals in the negative X-radiographs represent deposits of such storm events (Figure 5). The lamination or bedding is formed by the rapid deposition of sediment layers that are thick enough to bury the pre-existing surface and temporally inhibit the benthic community, thus creating a sharp basal contact (Nittrouer et al., 1998; Bentley and Nittrouer, 1999; Virtasalo et al., 2014). The truncation of underlying deposits by a newly deposited layer is proof of erosion prior to deposition (e.g., at 30 cm in core POS475/17-7). The normal grading represents an upward fining from coarse (bright) to fine silt to mud (dark) due to the decreasing flow velocity of a waning event. Dark mud in the upper part of an event layer indicates the preservation of a complete depositional flow event, otherwise the superimposed event layers could also belong to one single event with fluctuating flow velocity, or possibly represent the amalgamation of several separate events in one interval (e.g., at 10 cm in core POS475/57-10). After the event, the benthic community re-establishes itself and consequently mixes the event layer to the bioturbation depth, which creates a gradational upper contact (Nittrouer et al., 1998; Virtasalo et al., 2014). Moreover, bioturbation can partially or completely erase an event layer shortly after deposition and recolonisation. An example of this is the bioturbated event layer at 17 cm in core POS475/19-2 (Figure 5). While the occurrence of multiple event layers in the cores from the Mecklenburg Bight down to around 20 cm confirms the impact of hydroturbation at that location and water depth (24–27 m) at least in the last circa 100 years, the lack of such layers in the cores from the deeper Arkona Basin (43–50 m) could indicate either no event layer deposition (less hydroturbation) or mixing or total erasure by potentially more intense bioturbation or direct anthropogenic impact.
Another important type of hydrodynamic events are the occasional occurring MBIs of highly saline water from the North Sea. MARNET data show mean horizontal flow velocities of up to 50 cm/s on the Falster-Rügen sand plain and still up to 38 cm/s in the Arkona Basin during the MBI in December 2014. This is sufficient enough to resuspend and laterally transport local sediments, probably forming event layers. Most likely affected are the sediments in the MBI pathway, e.g., in the central Mecklenburg Bight, which could contribute to the low net LSRs and MARs of the cores EMB058/2-2 and 3-2 (section “Mixing Influence on Sediment Deposition,” Table 2). Recently, strong MBIs occur only once in a decade (Mohrholz et al., 2015).
Episodic hydroturbation contributes to the slight perturbations of the geochemical profiles by bioturbation and probably further decreases the temporal resolution due to the deeper-reaching hydrodynamic mixing. Furthermore, it might be responsible for the local deviations from the general trend of decreasing pollutant contents toward the sediment surface, e.g., at around 10 cm depth in the cores EMB058/6-2, 17-2 and AL434/427-3 (Figure 6B), due to reworking of sub-recent, more polluted deposits. However, a sedimentological change is not visually recognisable at that depth (Figure 3B), which points to a change in the sediment source rather than in sediment deposition. In the Sassnitz Channel (core EMB058/11-2), a whole package of even older unpolluted (pre-industrial) sandy material lies between younger polluted finer sediments and thus must have been remobilised after the start of industrialisation.
Anthroturbation: Anthropogenic Mixing
Multiple cross-cutting tracks on the seafloor document a strong direct anthropogenic impact on the muds in the Mecklenburg Bight and the Arkona Basin (Figure 8). These tracks are most likely caused by bottom trawling, as indicated by the fishing effort data (Figure 2), and presumably affect the seafloor sediments in a similar manner as it already was documented by Krost et al. (1990) and others (section “Anthropogenic Pressure”). Due to the long track preservation time, this pattern represents several generations of bottom-trawls.
This recurring anthroturbation causes the above mentioned in-depth mixing that evenly distributes geochemical signals throughout the affected sediment layer. The plateaus of more or less stable pollutant contents down to 25 cm core depth in the cores EMB058/4-2, 15-2, 16-2 and probably Al434/298-1 and POS475/57-10 are examples of a strong disturbance that erases any detailed age relationships (Figures 5, 6A,B). The parallelism of Hg and 137Cs only indicates that the anthroturbation occurred after the Chernobyl disaster in 1986, while the reduced Hg contents at the sediment surface show that at least some time has passed. In core EMB058/15-2, the Hg profile shows a small step at 11 cm depth within the plateau, suggesting that another anthroturbation event occurred in more recent times. The same probably happened in core EMB058/16-2 not much after the Chernobyl disaster, as indicated by the 137Cs increase above the plateau. Storms can be ruled out as the main cause of such strongly disturbed profiles, because their impact most likely affected much larger areas leaving comparable features in most of the profiles.
It is conceivable that the resuspension of sediments by otter boards also might cause a gravimetric sorting during redeposition, which could be visible as an event layer similar to those caused by storms. Actually, the strongly disturbed Hg profile of the core POS475/57-10 from the Mecklenburg Bight points in that direction, because the X-radiograph shows several event layers and erosional surfaces in the corresponding interval (Figure 5). However, bottom-trawl induced resuspension and gravimetric sorting during redeposition lack the processes of lateral water flow as well as gradual waning and potential fluctuation of the flow that produce the characteristic internal layering of event deposits. Hence, these layers and also the visible bioturbation traces must have formed after the anthroturbation event. This conclusion is supported by the erosional surface and the corresponding decrease in Hg content at 20 cm core depth.
Mixing Influence on Sediment Deposition
Besides the input characteristics and the post-depositional degradation, the geochemical profiles, especially those of contaminants, are the result of the combined effects of bio-, hydro- and anthroturbation, which have already been discussed and are summarised in Figure 9. While it remains difficult to accurately separate the mixing effects of bio- and hydroturbation on geochemical profiles, the in-depth effect of anthroturbation is clearly recognisable. A special case are the core profiles in the sandy areas (Figures 6C, 9A). They represent the integrated signals of sediment mixing and reworking only, because there is no net deposition in these highly dynamic areas (Christiansen et al., 2002; Emeis et al., 2002) and because the influence of TOC content and particle size was minimised through normalisation with TOC. Interestingly, their resemblance indicates a similarly strong mixing influence that seems to be independent from the exact core location. All show a maximal penetration depth of 15–19 cm, an average sediment mixing depth of 5–10 cm and decreasing values toward the sediment surface. This decline is somewhat irritating, as one would expect a more even distribution similar to that of the anthropogenically disturbed cores (Figure 9C). It is possible that less penetrating mixing processes, which occur more frequently and only affect the surficial sediment layer, caused a mixing of younger and thus less polluted material into the sediment, diluting the peak contamination. The profiles would therefore also reflect the temporal change to decreasing contamination levels. However, the upward 137Cs activity increase in core POS475/24-7 from the Falster-Rügen sand plain does not quite fit to this explanation. Alternatively, a constant degree of mobilisation and redeposition could perhaps produce comparable profiles. Moreover, pore-water fluxes could play a role in these highly permeable sediments. More research is needed to explain this issue satisfactorily.
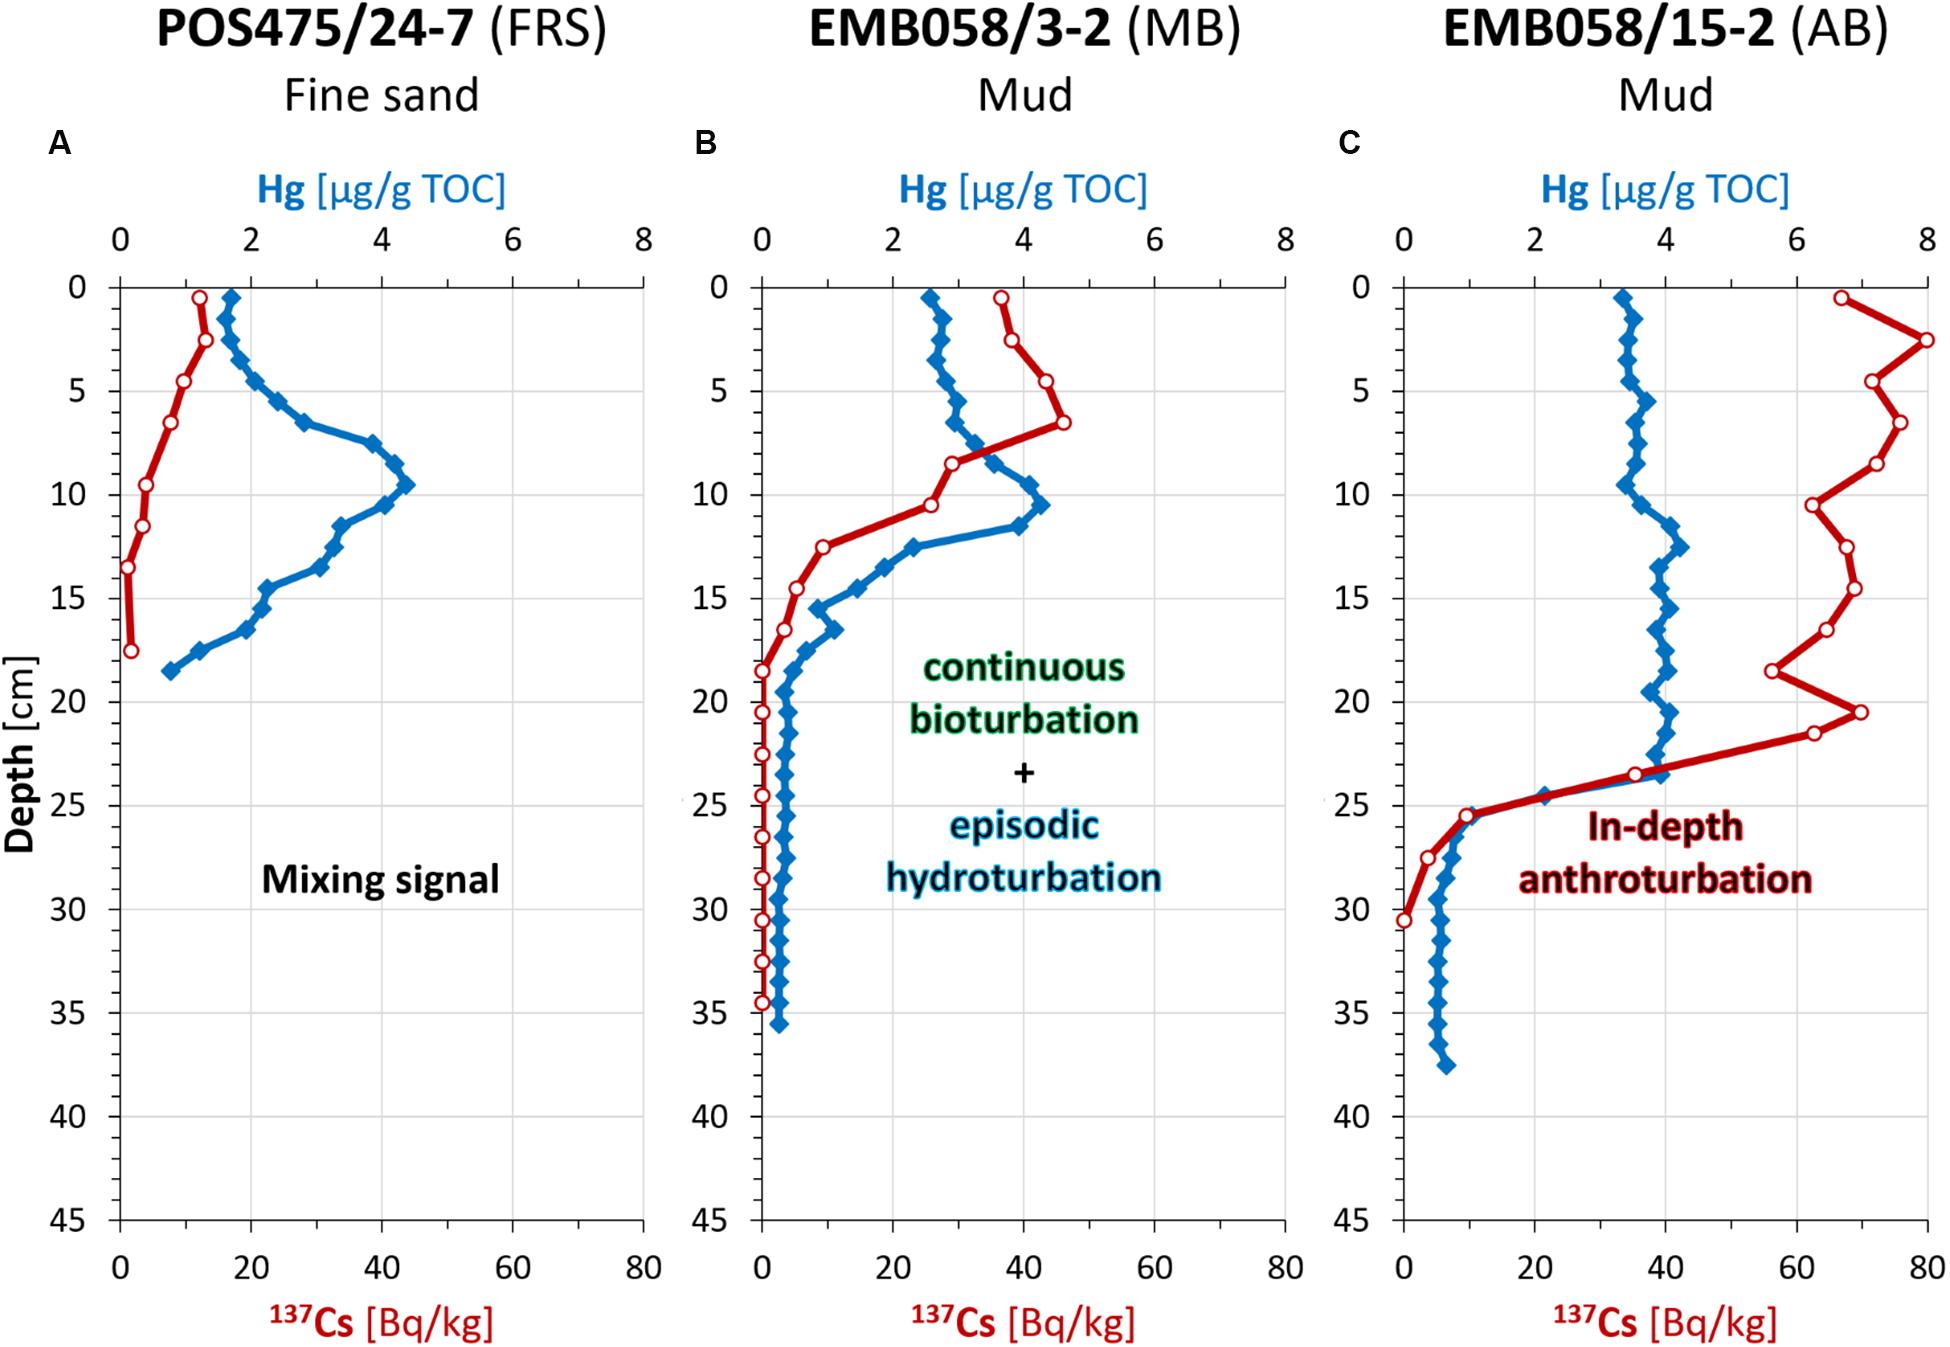
Figure 9. Prime examples of 137Cs (red) and TOC normalised Hg (blue) profiles that are mainly affected by (A) sediment mixing without deposition, (B) continuous bioturbation (by benthic fauna) together with episodic hydroturbation (by storms and saline water inflows) and (C) deep-penetrating disturbance by anthroturbation (e.g., by bottom trawling). The mixing intensity and depth increases from (A) to (C). EMB: R/V Elisabeth Mann Borgese, POS: R/V Poseidon, AB: Arkona Basin, FRS: Falster-Rügen sand plain, MB: Mecklenburg Bight.
Taking into account that coarser sediment areas represent predominantly transition areas for fine material (fluffy layer) one could expect a temporal incorporation of geochemical proxies into the surficial sediments, because these proxies are mainly bound to the mud fraction. However, the residence time of such material is difficult to assess (Christiansen et al., 2002; Emeis et al., 2002). Here, we found for the first time that anthropogenically introduced contaminants (age proxies) are enriched in the mud fraction of the uppermost 5–10 cm in sandy cores, and decrease to natural background values (or zero) below. If we agree that bio- and hydroturbation act more or less uniformly, we can assume that this average mixing depth applies to the entire sandy area. This corresponds well with the chlorophyll-based bioturbation depth of 5–7 cm (Morys et al., 2016) and the 234Th-based hydroturbation depth of up to 10 cm (Kersten et al., 2005). In the net-depositional and softer mud-covered basins, the mixed surface layer is progressively buried and the time-marker profiles are extended toward greater sediment depths. Or vice versa, if we find time-marker profiles in mud sediment cores of the basins that do not exceed the natural mixing depth, then we can assume that there is no net sediment accumulation (anymore).
From all investigated sediment cores of the mud basins, five cores (EMB058/4-2, 15-2, 16-2, AL434/298-1, and 427-3) show indications of deep mixing (ca. 25 cm of homogenisation) obviously caused by bottom trawling (Figures 5, 6A,B). The remaining seven cores show useful time-marker profiles and at least five of these cores (EMB058/1-4, 6-2, 17-2, AL434/331-1, and POS475/17-7) seem to record net sediment deposition (Table 2). This is an important finding, because one of the key questions of sedimentation in shallow-water basins is: Are these basins already filled up to the wave base, so that near-bottom currents transport the fine material further away? In this case, the basin surface sediment budget would be in a steady state. It would, of course, function as a temporary storage for surface integrated material, but not necessarily with a long term summation effect of permanent final deposition. Based on the findings of this study, parts of the investigated basins, especially in the mud area of the central Mecklenburg Bight, could be in this transitional mode.
The reconstructed net LSRs and MARs in the case of no assumed mixing (scenario 1) can therefore be ruled out as too high (Table 2). In the case of an assumed natural mixing depth of 7.1 cm (scenario 2), the net rates appear reasonable (e.g., 2.3 mm/a LSR and 0.73 kg/m2/a MAR of core POS475/17-7) and are comparable to other areas of the Baltic Sea (Mattila et al., 2006; Christoffersen et al., 2007; Leipe et al., 2011; Winogradow and Pempkowiak, 2014). In the case of an assumed mixing depth of 19 cm (scenario 3), the net rates are quite low and at one coring site (EMB058/3-2) no net sediment deposition could be determined. The relatively high MAR of core EMB058/6-2 in all three cases is caused by the higher DBD due to the contained fraction of fine sand (Figure 3).
Besides the assessment of MARs, if possible, a calculation of the amount of anthropogenically sourced material in the surface sediments (above the natural background) is possible and useful for large parts of the area. This inventory is independent of the fact, whether there is a long-term net deposition of total sediment or not. For example, about 93 tons of anthropogenic Hg accumulated in the muds of the Arkona Basin, based on a mean anthropogenic Hg inventory of 21.39 mg/m2 and an area of 4330 km2.
Conclusion and Outlook
Dynamic seafloor conditions in nearshore shallow basins of the south-western Baltic Sea prevent uninterrupted sediment deposition. Various natural and anthropogenic processes resuspend and mix the surficial sediments and affect geochemical profiles down to a depth of 5–25 cm. Continuous intense bioturbation by benthic organisms in the upper 5–7 cm causes slight perturbations of Hg and 137Cs profiles that blur the temporal signals but preserves their relative order. Episodic hydroturbation by storms and MBIs contributes to these perturbations and probably further decreases the temporal resolution due to the deeper-reaching mixing effect of up to 10 cm. Regularly occurring anthroturbation by bottom trawling causes mixing that flattens geochemical signals throughout the affected sediment layer of up to 25 cm.
If the latter can be excluded, time-marker profiles affected by natural bio- and hydroturbation can still be used to reconstruct net MARs. This is valid as long as these profiles reach deeper than a mean mixing depth of 5 to 10 cm. Taking that into account, mean net LSRs of 0.73–2.9 mm/a and mean net MARs of 0.40–1.48 kg/m2/a can be estimated for the mud basins. In the non-net-depositional sandy areas, anthropogenically introduced contaminants are also enriched in the mud fraction of the uppermost 5–10 cm. The inventory of these contaminants admixed in the surficial sediments can be calculated (irrespective of the occurrence of net deposition), and illustrates the important, at least temporary storage function not only of the mud basins but also of the adjacent sandy areas over industrial times. About 93 tons of anthropogenic Hg accumulated alone in the muds of the Arkona Basin.
The identified types of Hg and 137Cs profiles from (non-net-depositional) shallow-water sandy sediments to the adjacent basin muds is a novel finding of this study and encourages similar investigations in other coastal areas, not only in the Baltic Sea. Especially spatial differences in the intensity of the different sediment mixing processes require further study. Moreover, the pervasive anthropogenic impact through bottom trawling, e.g., on the sedimentary fabric and the distribution of contaminants, is worth further investigation. Here, data from relative “undisturbed” sedimentation areas, e.g., in the vicinity of larger seafloor obstacles that are avoided by bottom trawlers, could serve as reference.
Data Availability Statement
The geochemical and radionuclide data are publicly accessible in the online Baltic Sea Atlas (http://bio-50.io-warnemuende.de/iowbsa/index.php).
Author Contributions
DB wrote the first draft of the manuscript, conducted most measurements, and interpreted the data. TL, MM, and HA developed the concept of this study and helped with the interpretation of the results. SF designed the resuspension experiments that CM conducted and evaluated. FT compiled and provided sediment maps and side-scan sonar images as well as advice. JV substantially contributed to the X-radiography and sedimentary fabric analysis and interpretation. All authors revised and improved the manuscript.
Funding
This study was embedded in the KüNO (Coastal Research North Sea/Baltic Sea) project SECOS (The Service of Sediments in German Coastal Seas) funded by the German Federal Ministry of Education and Research (BMBF grant 03F0666A) in the frame of their FONA call (Research for Sustainable Developments). Additional funds came from the IOW budget. The publication of this article was funded by the Open Access Fund of the Leibniz Association.
Conflict of Interest
The authors declare that the research was conducted in the absence of any commercial or financial relationships that could be construed as a potential conflict of interest.
Acknowledgments
We appreciate laboratory and metrological support from Aki Kallonen, Anke Bender, Eva-Maria Brodte, Holger Pielenz, Ines Scherff, Jörg Benge, Jörn Kurth, Katrin Bahloul, Kirstin Schulz, Klaus-Peter Wlost, Marko Lipka, Michael Endler, Rainer Bahlo, Sascha Plewe, and Sibylle Fink. We thank the captains and crews of the research vessels Elisabeth Mann Borgese, Alkor, and Poseidon as well as the involved scientific parties for successful and pleasant cruises. We greatly acknowledge the support by the editors Teresa Radziejewska, Marta Marcos, and AG as well as the constructive comments by the reviewers that helped improve our manuscript. Parts of this study first appeared in the Ph.D. thesis of Bunke (2018).
References
Appleby, P. G., Richardson, N., and Nolan, P. J. (1991). 241Am dating of lake sediments. Hydrobiologia 214, 35–42. doi: 10.1007/BF00050929
Bentley, S. J., and Nittrouer, C. A. (1999). Physical and biological influences on the formation of sedimentary fabric in an oxygen-restricted depositional environment: Eckernforde Bay, southwestern Baltic Sea. Palaios 14, 585–600. doi: 10.2307/3515315
Berner, R. A. (1976). “The benthic boundary layer from the viewpoint of a geochemist,” in The Benthic Boundary Layer, ed. I. N. McCave, (New York, NY: Springer), 33–55. doi: 10.1007/978-1-4615-8747-7_3
Bernhard, M. (1989). Sedimentologische Beeinflussung der Oberflächensedimente durch Grundfischerei in der Kieler Bucht. Diploma thesis, Christian-Albrechts-Universität Kiel, Kiel, Germany.
Björck, S. (1995). A review of the history of the Baltic Sea. Quat. Int. 27, 19–40. doi: 10.1016/1040-6182(94)00057-C
Blott, S. J., and Pye, K. (2012). Particle size scales and classification of sediment types based on particle size distributions: Review and recommended procedures. Sedimentology 59, 2071–2096. doi: 10.1111/j.1365-3091.2012.01335.x
Boudreau, B. P. (1986a). Mathematics of tracer mixing in sediments: I. Spatially-dependent, diffusive mixing. Am. J. Sci. 286, 161–198. doi: 10.2475/ajs.286.3.161
Boudreau, B. P. (1986b). Mathematics of tracer mixing in sediments: II. Nonlocal mixing and biological conveyor-belt phenomena. Am. J. Sci. 286, 199–238. doi: 10.2475/ajs.286.3.199
Boudreau, B. P., and Imboden, D. M. (1987). Mathematics of tracer mixing in sediments: III. The theory of nonlocal mixing within sediments. Am. J. Sci. 287, 693–719. doi: 10.2475/ajs.287.7.693
Bunke, D. (2018). Sediment Mixing Processes and Accumulation Patterns in the South-Western Baltic Sea [Dissertation]. Universität Greifswald, Greifswald, Germany. Available at: https://nbn-resolving.org/urn:nbn:de:gbv:9-opus-20780 (accessed April 23, 2018).
Christiansen, C., Edelvang, K., Emeis, K.-C., Graf, G., Jähmlich, S., Kozuch, J., et al. (2002). Material transport from the nearshore to the basinal environment in the southern Baltic Sea: I. Processes and mass estimates. J. Mar. Syst. 35, 133–150. doi: 10.1016/S0924-7963(02)00126-4
Christoffersen, P. L., Christiansen, C., Jensen, J. B., Leipe, T., and Hille, S. (2007). Depositional conditions and organic matter distribution in the Bornholm Basin, Baltic Sea. Geo Mar. Lett. 27, 325–338. doi: 10.1007/s00367-007-0054-6
Duplisea, D. E., Jennings, S., Warr, K. J., and Dinmore, T. A. (2002). A size-based model of the impacts of bottom trawling on benthic community structure. Can. J. Fish. Aquat. Sci. 59, 1785–1795. doi: 10.1139/f02-148
Emeis, K.-C., Christiansen, C., Edelvang, K., Jähmlich, S., Kozuch, J., Laima, M., et al. (2002). Material transport from the near shore to the basinal environment in the southern Baltic Sea: II. Synthesis of data on origin and properties of material. J. Mar. Syst. 35, 151–168. doi: 10.1016/S0924-7963(02)00127-6
Fennel, W., and Sturm, M. (1992). Dynamics of the western Baltic. J. Mar. Syst. 3, 183–205. doi: 10.1016/0924-7963(92)90038-A
Flemming, B. W., and Delafontaine, M. T. (2000). Mass physical properties of muddy intertidal sediments: some applications, misapplications and non-applications. Cont. Shelf Res. 20, 1179–1197. doi: 10.1016/S0278-4343(00)00018-2
Gingele, F. X., and Leipe, T. (2001). Southwestern Baltic Sea—A sink for suspended matter from the North Sea? Geology 29, 215–218. doi: 10.1130/0091-7613(2001)029<0215:SBSASF>2.0.CO;2
Gogina, M., Morys, C., Forster, S., Gräwe, U., Friedland, R., and Zettler, M. L. (2017). Towards benthic ecosystem functioning maps: Quantifiing bioturbation potential in the German part of the Baltic Sea. Ecol. Indic. 73, 574–588. doi: 10.1016/j.ecolind.2016.10.025
Haldeman, S. S. (1840). Supplement to Number One of “A Monograph of the Limniades, Or Freshwater Univalve Shells of North America”: Containing Descriptions of Apparently New Animals in Different Classes and the Names and Characters of the Subgenera in Paludina and Anculosa. Philadelphia, PA: J. Dobson.
Hall, J. (1847). Palaeontology of New York. Volume I: Containing descriptions of the organic remains of the lower division of the New York system (equivalent to the Lower Silurian rocks of Europe). Palaeontology 7:338.
Hallberg, R. O. (1991). Environmental implications of metal distribution in Baltic Sea sediments. Ambio 20, 309–316.
HELCOM, (2010). Ecosystem health of the Baltic Sea 2003-2007: HELCOM initial holistic assessment. Balt. Sea Environ. Proc. 122:68.
HELCOM, (2011). Fifth Baltic Sea pollution load compilation (PLC-5). Balt. Sea Environ. Proc. 128:217.
HELCOM, (2013). Thematic assessment of long-term changes in radioactivity in the Baltic Sea, 2007-2010. Balt. Sea Environ. Proc. 135:40.
Horowitz, H. M., Jacob, D. J., Amos, H. M., Streets, D. G., and Sunderland, E. M. (2014). Historical mercury releases from commercial products: Global environmental implications. Environ. Sci. Technol. 48, 10242–10250. doi: 10.1021/es501337j
Hylander, L. D., and Meili, M. (2003). 500 years of mercury production: Global annual inventory by region until 2000 and associated emissions. Sci. Total Environ. 304, 13–27. doi: 10.1016/S0048-9697(02)00553-3
ICES, (2015). Fishing Abrasion Pressure Maps for Mobile Bottom-Contacting Gears in HELCOM Area. Copenhagen: ICES.
Ikäheimonen, T. K., Outola, I., Vartti, V.-P., and Kotilainen, P. (2009). Radioactivity in the Baltic Sea: Inventories and temporal trends of 137Cs and 90Sr in water and sediments. J. Radioanal. Nucl. Chem. 282, 419–425. doi: 10.1007/s10967-009-0144-1
Ilus, E., and Ilus, T. (2000). Sources of radioactivity. Radiol. Expo. Popul. Eur. Community to Radioact. Balt. Sea Mar. Proj. Radiat. Prot. 110, 9–76.
Iso. (14688)-1, (2002). Geotechnical Investigation and Testing Identification and Classification of Soil. Geneva: ISO.
Jennings, S., Pinnegar, J. K., Polunin, N. V. C., and Warr, K. J. (2001). Impacts of trawling disturbance on the trophic structure of benthic invertebrate communities. Mar. Ecol. Prog. Ser. 213, 127–142. doi: 10.3354/meps213127
Jones, J. B. (1992). Environmental impact of trawling on the seabed: A review. New Zeal. J. Mar. Freshw. Res. 26, 59–67. doi: 10.1080/00288330.1992.9516500
Keighley, D. G., and Pickerill, R. K. (1995). The ichnotaxa palaeophycus and planolites: Historical perspectives and recommendations. Ichnos 3, 301–309. doi: 10.1080/10420949509386400
Kersten, M., Leipe, T., and Tauber, F. (2005). Storm disturbance of sediment contaminants at a hot-spot in the Baltic Sea assessed by 234Th radionuclide tracer profiles. Environ. Sci. Technol. 39, 984–990. doi: 10.1021/es049391y
Knaust, D. (2013). The ichnogenus Rhizocorallium: Classification, trace makers, palaeoenvironments and evolution. Earth-Science Rev. 126, 1–47. doi: 10.1016/j.earscirev.2013.04.007
Kristensen, E., Penha-Lopes, G., Delefosse, M., Valdemarsen, T., Quintana, C. O., and Banta, G. T. (2012). What is bioturbation? The need for a precise definition for fauna in aquatic sciences. Mar. Ecol. Prog. Ser. 446, 285–302. doi: 10.3354/meps09506
Krost, P. (1990). Der Einfluß der Grundschleppnetzfischerei auf Nährsalz-Freisetzung aus dem Sediment und Makrofauna der Kieler Bucht (Westl. Ostsee). Berichte aus dem Inst. für Meereskd. 200:167. doi: 10.3289/IFM_BER_200
Krost, P., Bernhard, M., Werner, F., and Hukriede, W. (1990). Otter trawl tracks in Kiel Bay (Western Baltic) mapped by side-scan sonar. Meeresforschung 32, 344–353.
Lass, H.-U., and Matthäus, W. (2008). “General Oceanography of the Baltic Sea,” in State and Evolution of the Baltic Sea, 1952–2005: A detailed 50-Year Survey of Meteorology and Climate, Physics, Chemistry, Biology, and Marine Environment, eds R. Feistel, G. Nausch, and N. Wasmund (Hoboken, NJ: John Wiley & Sons, Inc), 5–43. doi: 10.1002/9780470283134.ch2
Leipe, T., and Gingele, F. X. (2003). The kaolinite/chlorite clay mineral ratio in surface sediments of the southern Baltic Sea as an indicator for long distance transport of fine-grained material. Baltica 16, 31–36.
Leipe, T., Harff, J., Meyer, M., Hille, S., Pollehne, F., Schneider, R., et al. (2008). “Sedimentary records of environmental changes and anthropogenic impacts during the past decades,” in State and Evolution of the Baltic Sea, 1952-2005: A Detailed 50-Year Survey of Meteorology and Climate, Physics, Chemistry, Biology, and Marine Environment, eds R. Feistel, G. Nausch, and N. Wasmund, (Hoboken, NJ: John Wiley & Sons, Inc), 395–439. doi: 10.1002/9780470283134.ch14
Leipe, T., Kersten, M., Heise, S., Pohl, C., Witt, G., Liehr, G., et al. (2005). Ecotoxicity assessment of natural attenuation effects at a historical dumping site in the western Baltic Sea. Mar. Pollut. Bull. 50, 446–459. doi: 10.1016/j.marpolbul.2004.11.049
Leipe, T., Moros, M., Kotilainen, A. T., Vallius, H., Kabel, K., Endler, M., et al. (2013). Mercury in Baltic Sea sediments—Natural background and anthropogenic impact. Chemie der Erde Geochem. 73, 249–259. doi: 10.1016/j.chemer.2013.06.005
Leipe, T., Naumann, M., Tauber, F., Radtke, H., Friedland, R., Hiller, A., et al. (2017). Regional distribution patterns of chemical parameters in surface sediments of the south-western Baltic Sea and their possible causes. Geo Mar. Lett. 37, 593–606. doi: 10.1007/s00367-017-0514-6
Leipe, T., Tauber, F., Vallius, H., Virtasalo, J. J., Uścinowicz, S., Kowalski, N., et al. (2011). Particulate organic carbon (POC) in surface sediments of the Baltic Sea. Geo Mar. Lett. 31, 175–188. doi: 10.1007/s00367-010-0223-x
Lemke, W. (1998). Sedimentation und paläogeographische Entwicklung im westlichen Ostseeraum (Mecklenburger Bucht bis Arkonabecken) vom Ende der Weichselvereisung bis zur Litorinatransgression. Meereswissenschaftliche Berichte 31:170.
Maire, O., Lecroart, P., Meysman, F. J. R., Rosenberg, R., Duchêne, J., and Grémare, A. (2008). Quantification of sediment reworking rates in bioturbation research: A review. Aquat. Biol. 2, 219–238. doi: 10.3354/ab00053
Mattila, J., Kankaanpää, H., and Ilus, E. (2006). Estimation of recent sediment accumulation rates in the Baltic Sea using artificial radionuclides 137Cs and 239,240Pu as time markers. Boreal Environ. Res. 11, 95–107.
Meysman, F. J. R., Boudreau, B. P., and Middelburg, J. J. (2010). When and why does bioturbation lead to diffusive mixing? J. Mar. Res. 68, 881–920. doi: 10.1357/002224010796673885
Milkert, D., and Werner, F. (1996). Formation and distribution of storm layers in western Baltic Sea muds. Baltica 9, 36–50.
Mohrholz, V., Naumann, M., Nausch, G., Krüger, S., and Gräwe, U. (2015). Fresh oxygen for the Baltic Sea—An exceptional saline inflow after a decade of stagnation. J. Mar. Syst. 148, 152–166. doi: 10.1016/j.jmarsys.2015.03.005
Moros, M., Andersen, T. J., Schulz-Bull, D. E., Häusler, K., Bunke, D., Snowball, I., et al. (2017). Towards an event stratigraphy for Baltic Sea sediments deposited since ad 1900: Approaches and challenges. Boreas 46, 129–142. doi: 10.1111/bor.12193
Morys, C., Forster, S., and Graf, G. (2016). Variability of bioturbation in various sediment types and on different spatial scales in the southwestern Baltic Sea. Mar. Ecol. Prog. Ser. 557, 31–49. doi: 10.3354/meps11837
Morys, C., Powilleit, M., and Forster, S. (2017). Bioturbation in relation to the depth distribution of macrozoobenthos in the southwestern Baltic Sea. Mar. Ecol. Prog. Ser. 579, 19–36. doi: 10.3354/meps12236
Nausch, G., Feistel, R., and Wasmund, N. (2008). “Introduction,” in State and Evolution of the Baltic Sea, 1952–2005: A Detailed 50-Year Survey Of Meteorology and Climate, Physics, Chemistry, Biology, and Marine Environment, eds R. Feistel, G. Nausch, and N. Wasmund (Hoboken, NJ: John Wiley & Sons, Inc), 1–4. doi: 10.1002/9780470283134.ch1
Nicholson, H. A. (1872). Contributions to the study of the errant Annelides of the older palaeozoic rocks. Proc. R. Soc. Lond. 21, 288–290. doi: 10.1098/rspl.1872.0061
Nies, H., Bojanowski, R., Karlberg, O., and Nielsen, S. P. (1995). Sources of radioactivity in the Baltic Sea. Balt. Sea Environ. Proc. 61, 6–18.
Nittrouer, C. A., Lopez, G. R., Wright, L. D., Bentley, S. J., D’Andrea, A. F., Friedrichs, C. T., et al. (1998). Oceanographic processes and the preservation of sedimentary structure in Eckernforde Bay, Baltic Sea. Cont. Shelf Res. 18, 1689–1714. doi: 10.1016/S0278-4343(98)00054-5
Peine, F. (2005). Influence of Subtidal Macrofauna Organisms Generating Biogenic Structures on the Near-Bottom Particle Transport in the Southwestern Baltic Sea [Dissertation]. Universität Rostock, Rostock, Germany. Available at: http://www.biologie.uni-rostock.de/meeresbiologie/download/peine_phd_thesis.pdf (accessed March 20, 2017).
Pemberton, S. G., and Frey, R. W. (1982). Trace fossil nomenclature and the Planolites-Palaeophycus dilemma. J. Paleontol. 56, 843–881.
Pemberton, S. G., MacEachern, J. A., Gingras, M. K., and Saunders, T. D. A. (2008). Biogenic chaos: Cryptobioturbation and the work of sedimentologically friendly organisms. Palaeogeogr. Palaeoclimatol. Palaeoecol. 270, 273–279. doi: 10.1016/j.palaeo.2008.01.036
Pennington, W., Tutin, T. G., Cambray, R. S., and Fisher, E. M. (1973). Observations on lake sediments using fallout 137Cs as a tracer. Nature 242, 324–326. doi: 10.1038/242324a0
Pohl, C., Hennings, U., Petersohn, I., and Siegel, H. (1998). Trace metal budget, transport, modification and sink in the transition area between the oder and peene rivers and the southern Pomeranian Bight. Mar. Pollut. Bull. 36, 598–616. doi: 10.1016/S0025-326X(98)00038-1
Povinec, P. P., Fowler, S., and Baxter, M. (1996). Chernobyl & the marine environment: The radiological impact in context. Int. At. Energy Agency Bull. 38, 18–22.
Rasband, W. (1997). ImageJ. [Software]. Available at: https://imagej.nih.gov/ij/ (accessed October 23, 2019).
Rosenberg, R., Nilsson, H. C., Grémare, A., and Amouroux, J.-M. (2003). Effects of demersal trawling on marine sedimentary habitats analysed by sediment profile imagery. J. Exp. Mar. Bio. Ecol. 285–286, 465–477. doi: 10.1016/S0022-0981(02)00577-4
Salter, J. W. (1857). On Annelide-burrows and surface-markings from the Cambrian rocks of the Longmynd. No. 2. Q. J. Geol. Soc. 13, 199–206. doi: 10.1144/GSL.JGS.1857.013.01-02.29
Schiele, K. S., Darr, A., Zettler, M. L., Friedland, R., Tauber, F., von Weber, M., et al. (2015). Biotope map of the German Baltic Sea. Mar. Pollut. Bull. 96, 127–135. doi: 10.1016/j.marpolbul.2015.05.038
Schlirf, M., and Uchman, A. (2005). Revision of the ichnogenus Sabellarifex Richter, 1921 and its relationship to Skolithos Haldeman, 1840 and Polykladichnus Fürsich, 1981. J. Syst. Palaeontol. 3, 115–131. doi: 10.1017/S1477201905001550
Schulz, K. (2017). Suspended Sediment Transport near Sloping Topography [Dissertation]. Universität Rostock, Rostock, Germany. doi: 10.18453/rosdok_id00001863
Shull, D. H., Benoit, J. M., Wojcik, C., and Senning, J. R. (2009). Infaunal burrow ventilation and pore-water transport in muddy sediments. Estuar. Coast. Shelf Sci. 83, 277–286. doi: 10.1016/j.ecss.2009.04.005
Siegel, H., Seifert, T., Schernewski, G., Gerth, M., Ohde, T., Reißmann, J., et al. (2005). Discharge and transport processes along the German Baltic Sea coast. Ocean Dyn. 55, 47–66. doi: 10.1007/s10236-005-0110-6
Smith, C. J., Rumohr, H., Karakassis, I., and Papadopoulou, K.-N. (2003). Analysing the impact of bottom trawls on sedimentary seabeds with sediment profile imagery. J. Exp. Mar. Bio. Ecol. 28, 479–496. doi: 10.1016/S0022-0981(02)00545-2
Soulsby, R. L., Mead, C. T., and Wild, B. R. (2007). A model for simulating the dispersal tracks of sand grains in coastal areas: “SandTrack.”. Geol. Soc. London, Spec. Publ. 274, 65–72. doi: 10.1144/GSL.SP.2007.274.01.08
Tauber, F. (2009). Sidescan sonar survey of a dumping site in the Mecklenburg Bight (south-western Baltic Sea). J. Mar. Syst. 75, 421–429. doi: 10.1016/j.jmarsys.2008.04.006
Tauber, F. (2014). “Regionalized classification of seabed sediments in the German Baltic Sea,” in The 12th Colloquium on Baltic Sea Marine Geology — Abstract Volume, (Rostock: Leibniz Institute for Baltic Sea Research Warnemünde), 79.
Thévenaz, P. (2006). MosaicJ. [Software]. Available at: http://bigwww.epfl.ch/thevenaz/mosaicj/ (accessed October 23, 2019).
Thévenaz, P., and Unser, M. (2007). User-friendly semiautomated assembly of accurate image mosaics in microscopy. Microsc. Res. Tech. 70, 135–146. doi: 10.1002/jemt.20393
Virtasalo, J. J., Bonsdorff, E., Moros, M., Kabel, K., Kotilainen, A. T., Ryabchuk, D., et al. (2011). Ichnological trends along an open-water transect across a large marginal-marine epicontinental basin, the modern Baltic Sea. Sediment. Geol. 241, 40–51. doi: 10.1016/j.sedgeo.2011.09.010
Virtasalo, J. J., Ryabchuk, D., Kotilainen, A. T., Zhamoida, V., Grigoriev, A., Sivkov, V., et al. (2014). Middle Holocene to present sedimentary environment in the easternmost Gulf of Finland (Baltic Sea) and the birth of the Neva River. Mar. Geol. 350, 84–96. doi: 10.1016/j.margeo.2014.02.003
von Dorrien, C., Krumme, U., Grieger, C., Miethe, T., and Stötera, S. (2013). Analyse fischereilicher Daten in den schleswig-holsteinischen Küstengewässern der Ostsee. Braunschweig: Johann Heinrich von Thünen-Institut.
Werner, F. (2002). Bioturbation structures in marine Holocene sediments of Kiel Bay (Western Baltic). Meyniana 54, 41–72.
Werner, F., Erlenkeuser, H., von Grafenstein, U., McLean, S., Sarnthein, M., Schauer, U., et al. (1987). “Sedimentary records of benthic processes,” in Seawater-Sediment Interactions in Coastal Waters, eds J. Rumohr, E. Walger, and B. Zeitzschel, (Berlin: Springer), 162–262. doi: 10.1029/ln013p0162
Werner, F., Hoffmann, G., Michael, B., Milkert, D., and Vikgren, K. (1990). Sedimentologische Auswirkungen der Grundfischerei in der Kieler Bucht (Westliche Ostsee). Meyniana 42, 123–151. doi: 10.2312/meyniana.1990.42.123
Wetzel, A. (1981). Ökologische und stratigraphische Bedeutung biogener Gefúge in quartären Sedimenten am NW-afrikanischen Kontinantalrand. Meteor Forschungs Ergebnisse C34, 1–47.
Widdows, J., Brinsley, M. D., Bowley, N., and Barrett, C. (1998). A benthic annular flume for in situ measurement of suspension feeding/biodeposition rates and erosion potential of intertidal cohesive sediments. Estuar. Coast. Shelf Sci. 46, 27–38. doi: 10.1006/ecss.1997.0259
Winn, K. (2006). Bioturbation structures in marine Holocene sediments of the Great Belt (Western Baltic). Meyniana 58, 157–178.
Keywords: sediment mixing, Baltic Sea, mercury, caesium-137, sedimentary fabric
Citation: Bunke D, Leipe T, Moros M, Morys C, Tauber F, Virtasalo JJ, Forster S and Arz HW (2019) Natural and Anthropogenic Sediment Mixing Processes in the South-Western Baltic Sea. Front. Mar. Sci. 6:677. doi: 10.3389/fmars.2019.00677
Received: 30 April 2018; Accepted: 17 October 2019;
Published: 12 November 2019.
Edited by:
Anas Ghadouani, The University of Western Australia, AustraliaReviewed by:
Andrzej Osadczuk, University of Szczecin, PolandShari L. Gallop, University of Waikato, New Zealand
Copyright © 2019 Bunke, Leipe, Moros, Morys, Tauber, Virtasalo, Forster and Arz. This is an open-access article distributed under the terms of the Creative Commons Attribution License (CC BY). The use, distribution or reproduction in other forums is permitted, provided the original author(s) and the copyright owner(s) are credited and that the original publication in this journal is cited, in accordance with accepted academic practice. No use, distribution or reproduction is permitted which does not comply with these terms.
*Correspondence: Dennis Bunke, ZGVubmlzLmJ1bmtlQHVuaS1sZWlwemlnLmRl
†Present address: Dennis Bunke, Institute of Geophysics and Geology, Leipzig University, Leipzig, Germany Claudia Morys, Department of Ecology, Environment and Plant Sciences, Stockholm University, Stockholm, Sweden