 Gregory K. Silber
 Jeffrey D. Adams
- 1Smultea Environmental Sciences, Washington Grove, MD, United States
- 2Office of Protected Resources, National Marine Fisheries Service, NOAA, Silver Spring, MD, United States
The Arctic is among the most rapidly-changing regions on Earth. Diminishing levels of sea-ice has increased opportunities for maritime activities in historically inaccessible areas such as the Northern Sea Route and Northwest Passage. Degradation of Arctic marine ecosystems may accompany expanding vessel operations through introduced underwater noise, potential for large oil spills, among other things; and may compound stressors already effecting biological populations due to climate change. Assessments are needed to track changes in vessel traffic patterns and associated environmental impacts. We analyzed Arctic-wide vessel Automatic Identification System data 1 January 2015 to 31 December 2017 to quantify the amount and spatial distribution of vessel operations, assess possible changes in these operations, and establish a baseline for future monitoring. Nearly 400,000 vessel transits were analyzed. Number of trips, hours of operation, and amount of sea surface exposed to vessel traffic were used to compare operations between 14 delineated waterways. Operations were extensive and diverse: an average of 132,828 trips were made annually by over 5,000 different vessels. Transits were made in all areas studied and all months of the year. Maritime activities were intensive in some areas, but ice-limited in others. Amount of sea surface exposed to vessel traffic exceeded 70% in all but three areas. Bulk carriers, cargo ships, passenger/cruise ships, research survey ships, and vessels supporting oil/gas-related activities were represented. However, fishing vessels, primarily in the Barents, Bering, and Norwegian Seas, surpassed operations of all other vessel types and comprised about one-half of all voyages each year. We observed no overt increasing or decreasing trends in vessel traffic volume in our limited study period. Instead, inter-year variation was evident. While the number of unique vessels and transits increased year-to-year, hours of operation declined in the same period. Abundance/distribution of fisheries resources, economic feasibility of Arctic marine travel as weighed against inherent risks, and other factors likely accounted for inter-year variation in regional activity levels. Measures have been established to protect Arctic marine ecosystems but may need strengthening to address potential ecosystem threats from existing and growing commercial and industrial activities in the region.
Introduction
The Arctic is one of the globe’s most rapidly-changing regions (Intergovernmental Panel on Climate Change [IPCC], 2018). Annual average Arctic sea ice extent has declined steadily at least since the early 1980s, and Northern Hemisphere snow and ice extent in 2016 was the lowest on record (U.S. Global Change Research Program [USGCRP], 2017). Diminishing annual and seasonal Arctic sea ice cover is expected to continue or accelerate in the foreseeable future (Overland et al., 2018). Predicted timing for seasonal ice-free waters in certain locations has ranged from within a few decades (Overland and Wang, 2013), to mid-century, (Smith and Stephenson, 2013), to as late as 2100 (Boé et al., 2009; Melia et al., 2016).
Expansion of the duration and spatial extent of seasonal ice-free water will bring changes in accessibility, and therefore the quantity and character, of maritime activities in the region (e.g., Arctic Council, 2009). Extended navigation periods resulting from decreasing ice cover are expected to encourage intercontinental transportation along routes with historically limited access (Khon et al., 2010; Smith and Stephenson, 2013; Zheng et al., 2016). Among these, the Northwest Passage (Guy, 2006; Buixadé Farré et al., 2014) and Russia’s Northern Sea Route (Liu and Kronbak, 2010; Stephenson et al., 2014) are increasingly viewed as economically-viable alternatives to Suez or Panama Canal routes (Stroeve et al., 2012; Melia et al., 2016). Changing conditions also favor high-latitude tourism (Hamilton et al., 2005), new opportunities for exploitation of vast sub-seafloor oil and gas reserves (Arctic Monitoring and Assessment Programme [AMAP], 2008; Petrick et al., 2017; Wilkinson et al., 2017), and expansion of other commercial and industrial activities (e.g., Christiansen et al., 2014; Congressional Research Service [CRS], 2018).
As Arctic maritime activities increase, so are expected impacts to Arctic marine ecosystems (Arctic Council, 2009; Congressional Research Service [CRS], 2018). Expanding vessel activities will increase air-borne emissions levels (Corbett et al., 2010; Johansson et al., 2017) and contribute to the likelihood of maritime casualties (United States Coast Guard [USCG], 2010). Environmental degradation associated with increased vessel traffic will also include the effects from increased underwater noise levels on marine organisms (Moore et al., 2012; Halliday et al., 2017), introduction of non-native species (Miller and Ruiz, 2014; Nong et al., 2018), and ship strikes of marine mammals (Huntington et al., 2015; Cooke and Clapham, 2018). These, in turn heighten exposure of Arctic species already susceptible to the effects of climate change (Ragen et al., 2008; Silber et al., 2017) and negatively influence indigenous people reliant on the region’s resources (Huntington et al., 2015).
Among the greatest potential threats to Arctic biological processes are large-scale oil and chemical spills (Arctic Council, 2009; Congressional Research Service [CRS], 2018; Walker et al., 2018). Substantial oil and gas reserves are being tapped in Arctic shelf waters (e.g., Congressional Research Service [CRS], 2018) increasing the likelihood of spills from well blowouts, tanker spills, or vessel accidents (Arctic Monitoring and Assessment Programme [AMAP], 2008; U.S. Committee on the Marine Transportation System [CMTS], 2013). Effects from spills are particularly acute given the region is remote, insufficiently charted, and inadequately supported by spill response infrastructure (Ivanova, 2011; National Research Council of the National Academies of Science [NRC], 2014). Long-term entrainment of oil in cold-water biological communities (Vergeynst et al., 2018) make Arctic ecosystems particularly vulnerable to spills.
Threats from increasing vessel activity on the integrity of Arctic marine ecosystems are real. However, there have been only limited efforts to quantify the amount and spatial features of Arctic-wide maritime operations (Eguíluz et al., 2016; Adams and Silber, 2017; Ocean Conservancy, 2017), and to our knowledge there are no studies of yearly changes in these operations. The magnitude of potential risks will not be fully known until the extent of maritime activities is known. Previously, we analyzed Automatic Identification System (AIS) data to quantify Arctic-wide vessel activities for calendar year 2015 and to establish a baseline of marine traffic in the region (Adams and Silber, 2017). Here, we quantify vessel operations in 2016 and 2017. Incorporating the 2015 data, and using the same metrics used in the 2015 study, we provide a 3 year, pan-Arctic characterization of current maritime activities.
Materials and Methods
Data synthesis and analytical methods were the same as those used in Adams and Silber (2017)1. Descriptions of analytical approaches detailed in that report are summarized here.
Global satellite AIS data were obtained from exactEarth® for 2015 and from ORBCOMMTM for 2016 and 2017. The Transview (TV32) software application, developed by the Department of Transportation’s VOLPE National Transportation Systems Center2, was used to decode raw, global AIS data into monthly comma separated value (CSV) files. The decoded monthly data was imported into a spatially-enabled PostgreSQL/PostGIS database and linked to an enhanced vessel database (IHS Markit, 2017) to obtain verified vessel type, gross tonnage, and country of origin (flag country) information.
AIS data were then overlaid on the Arctic as defined by the Arctic Research and Policy Act of 1984 (ARPA) and data located within the ARPA-delineated boundary were analyzed. Within this area, 14 bodies of water were identified using spatial boundaries defined in the International Hydrographic Organization’s Sea Areas3 data set, namely: the Arctic Ocean, Baffin Bay, Barents Sea, Beaufort Sea, Bering Sea, Chukchi Sea, Davis Strait, East Siberian Sea, Greenland Sea, Laptev Sea, Kara Sea, Northwest Passages, Norwegian Sea, and the White Sea (Figure 1). These spatial designations were used to parse and characterize vessel activity in each body of water.
Figure 1. Boundaries of study area as defined by the Arctic Research and Policy Act of 1984 and the 14 oceans, seas, bays, straits and passages within the boundary (International Hydrographic Organization Sea Areas).
Each AIS record contains a speed, position, and timestamp. We used this information to assess the spatial and temporal integrity of a given record using temporally adjacent AIS records by the same vessel. Records for an individual vessel were sorted using timestamps and then aggregated into transits (i.e., individual trips made by vessels) according to time elapsed between successive records. If elapsed time between successive records for a given vessel was <4 h, they were aggregated into the same transit; if ≥4 h, a new transit was initiated for the vessel. Distance-based computational checks were also made for two temporally adjacent records to ensure the integrity of the derived transit. To segment trips by area, we intersected transits with clipped body of water polygons. Transits that straddled the end and the beginning of a month were split between consecutive months using interpolation.
Spatial density analyses produce gridded surfaces containing cell values representing the concentration of certain features. Linear vessel transit features were used in calculating areas of relative traffic density. A Line Density tool in ArcGIS for Desktop was used with a search radius of 10km and an output cell size of 5km for all transits and specific vessel classes to determine linear distances. Color ramps were used to depict relative densities throughout the study area. We also computed the percent of the total water surface area exposed to vessel traffic by summing the area associated with grid cells containing non-zero density values. An area represented by a grid cell was considered exposed to vessel traffic when the associated vessel traffic density value was greater than zero.
Data from over 360 million individual AIS transmissions logged within the Arctic spatial boundary during the study period were analyzed. These data were first screened to remove any transmissions that contained suspect position, speed or timestamp data. Transmissions by vessels that were not actively engaged in travel were also removed. The remaining AIS transmissions were aggregated into transits. Transits that contained less than 5 AIS transmissions or represented less than 5 nm of travel were removed. The remaining transits were linked to a third-party vessel database (IHS Markit, 2017) to obtain more detailed and accurate information on vessel size and type. Transits by vessels that could not link to the above-described (IHS) database were dropped from the analysis. The remaining transits were then segmented based on sea area, year and month. It should be noted that vessels engaged in nationally-sensitive operations, involving for example military, sovereign, or other government vessels, may not routinely transmit AIS signals and these are data potentially unavailable to this study.
A set of metrics were used to characterize vessel activity: number of trips, hours of operation, and trip distance. Each of these metrics were used to compare operations between areas, between years, and IHS vessel type class. Gross vessel class designations (using AIS “Level 3” data) were used to characterize broad-scale (e.g., Arctic-wide) seasonal and inter-year variation in vessel activities, whereas finer scale (“Level 5” AIS data) vessel class information was used in describing results for all other metrics. The 14 delineated bodies of water differ a great deal in size; as a result, absolute counts of number of trips and values for distances traveled may be of limited value in inter-area comparisons. Therefore, in an effort to provide a measure of relative amount of vessel traffic volume in each of the 14 areas studied, we also determined transit densities (trip distance per unit of water surface area, or km/km2) and extent of sea surface exposed to vessel trips (percent of total water surface area with non-zero density values).
Results
Arctic vessel operations were substantial and spatially varied. During the study period, an average of 132,828 trips were made each year by over 5,000 different vessels (Table 1). These vessels represented more than 60 different IHS Level 5 vessel types. Annually, vessels operated an average of over 3.2M hours (yearly range 2.8M–3.7M hours). Transits were made in all areas studied (Figures 2A–C) and all months of the year in Figure 3. While the number of individual vessels and the number of transits increased steadily during our study period, the number of hours of operation and total distances traveled declined (Table 1). Thus, on the whole Arctic-wide, vessels engaged in an increasing number of trips, but these trips tended to be relatively shorter in duration.
Table 1. Annual Arctic-wide vessel traffic metrics, 2015–2017.
Figure 2. Relative track densities of all vessel types in (A) 2015, (B) 2016, and (C) 2017. Areas with no color indicate no vessel traffic or low traffic volumes relative to other locations.
Figure 3. Vessel hours of operation, by month and vessel class, in 2015, 2016, and 2017.
Country of origin for vessels utilizing Arctic waters was diverse, with most being registered to Panama, Russia, Norway and the United States (Table 2). Norwegian-flagged vessels made the most trips (mean = 42,365; range 37,429 in 2017 to 49,394 in 2015) followed by vessels flagged by Russia (mean = 36,422; range 21,008 in 2015 to 48,092 in 2017) and the United States (mean = 17,536; range 16,583 in 2017 to 18,580 in 2016).
Table 2. Nations with >100 flagged vessels operating in Arctic waters and number of registered ships, 2015–2017.
The distribution and number of nations under which vessels were registered (also referred to as its “flag state”) reflect at least two types of activities in the region. One, ships from Arctic countries (Norway, Russia, the United States, etc.) were engaged in extensive commercial fishing industries, local/regional shipping activities, or resource extraction operations. A second group was comprised of commercial vessels registered in countries (e.g., Panama, Marshall Islands) that may have little or no direct interest in Arctic operation. Instead, “flags of convenience” are nations who offer attractive tax and employment regulations that confer cost benefits to owners, and our findings mirror, in part, a worldwide registry of vessels. The number of vessels registered in nations distant from Arctic waters (e.g., China, Liberia) also illustrate the importance of Arctic routes to inter-continental shipping activities.
Overall, fishing vessels, primarily <1000 gross tons (gt), logged the greatest number of trips and hours of operation (Table 3). In all 3 years combined, these vessels made 52.2% of all trips in the entire study area, and constituted 43.9, 54.2, and 57.0% of all Arctic vessel trips in 2015, 2016, 2017, respectively. Of the 14 waterways studied, fishing vessel activity was highest in the Bering, Barents, and Norwegian Seas, representing 66.3, 62.1, and 41.4% of all trips in those areas, respectively. Fishing vessel activities (including Stern Trawlers) in those three seas also represented 42.4–46.7% of the hours of operation of all vessel types combined (Table 3). Fishing vessels (primarily < 1,000gt) also accounted for more trips than any other vessel type in the Greenland Sea, Davis Strait, and Baffin Bay.
Table 3. Hours of operation by fishing vessels in waterways in which commercial fisheries operations were the predominant vessel activity (as measured by hours of operation).
In 2017, fishing vessels in the Bering Sea alone accounted for 16.6% of all operational hours for all vessel types in the entire study area combined, the highest such value in our dataset. However, total hours logged (as well as proportions of hours of operation within a given body of water) by fishing vessels varied inter-annually both within those seas and across the Arctic (Table 3). Tracks of fishing vessel routes were numerous and spatially diffuse (Figures 4A–C), indicative of the magnitude of this industry and the importance of fisheries resources in these areas. The spatial distribution of these trips also underwent inter-annual changes (Figures 4A–C).
Figure 4. Relative track densities of fishing vessels in (A) 2015, (B) 2016, and (C) 2017. Areas with no color indicate no vessel traffic or low traffic volumes relative to other locations.
Excluding all vessels engaged in fishing operations, the greatest number of transits occurred in the Norwegian, Barents, and Bering Seas (Table 4). (Note, we excluded fishing vessel activities in this table and in other representations to better highlight/discuss activities and metrics involving other vessel classes). Well over 100,000 trips were made in 3 years in the Norwegian and Barents Seas alone. The number of trips in these three Seas exceeded those in the Greenland Sea (the location with the fourth highest number of trips) by fourfold or more. In comparison to other locations, trips in these areas exceeded the number of trips made in the Northwest Passage, the Beaufort and East Siberian Seas and other locations by nearly two orders of magnitude.
Table 4. Total number of transits and percent surface area exposed to vessel traffic, excluding all fishing vessel operations, for each body of water in the study area.
Average sea surface area exposed to vessel traffic exceeded 96% in the Norwegian, Barents, and Bering Seas and over 90% of the sea surface was exposed to vessel transits in the Davis Strait and Chukchi Sea (Table 4). The Arctic Ocean had the greatest overall surface area but was also at least 50% ice-bound for 12 months and 75% ice-covered for 11 months of the year. It ranked last in both density and percent sea surface covered by vessel transits. The Beaufort Sea and the Northwest Passage also exhibited low sea surface exposure and also hosted the fewest trips.
Vessel Types
Excluding Fishing Vessels, General Cargo Ships were among the vessel types making the most trips in nine of the 14 bodies of water studied (Table 5). Research/survey vessels, supporting primarily academic oceanographic and geophysical seismic research, were also among the most common vessel types, totaling an average of over 79,000 h of operation in each year of study period. Most of this work was conducted, in rank order, in the Barents, Kara, Norwegian, and Greenland Seas totaling between 21,000 and 93,000 h of operation during 2015–2017. In addition, vessels engaged in fisheries research logged an annual average of over 6,500 h; the majority occurring in the Greenland, Norwegian, Bering, and Barents Seas, in that order.
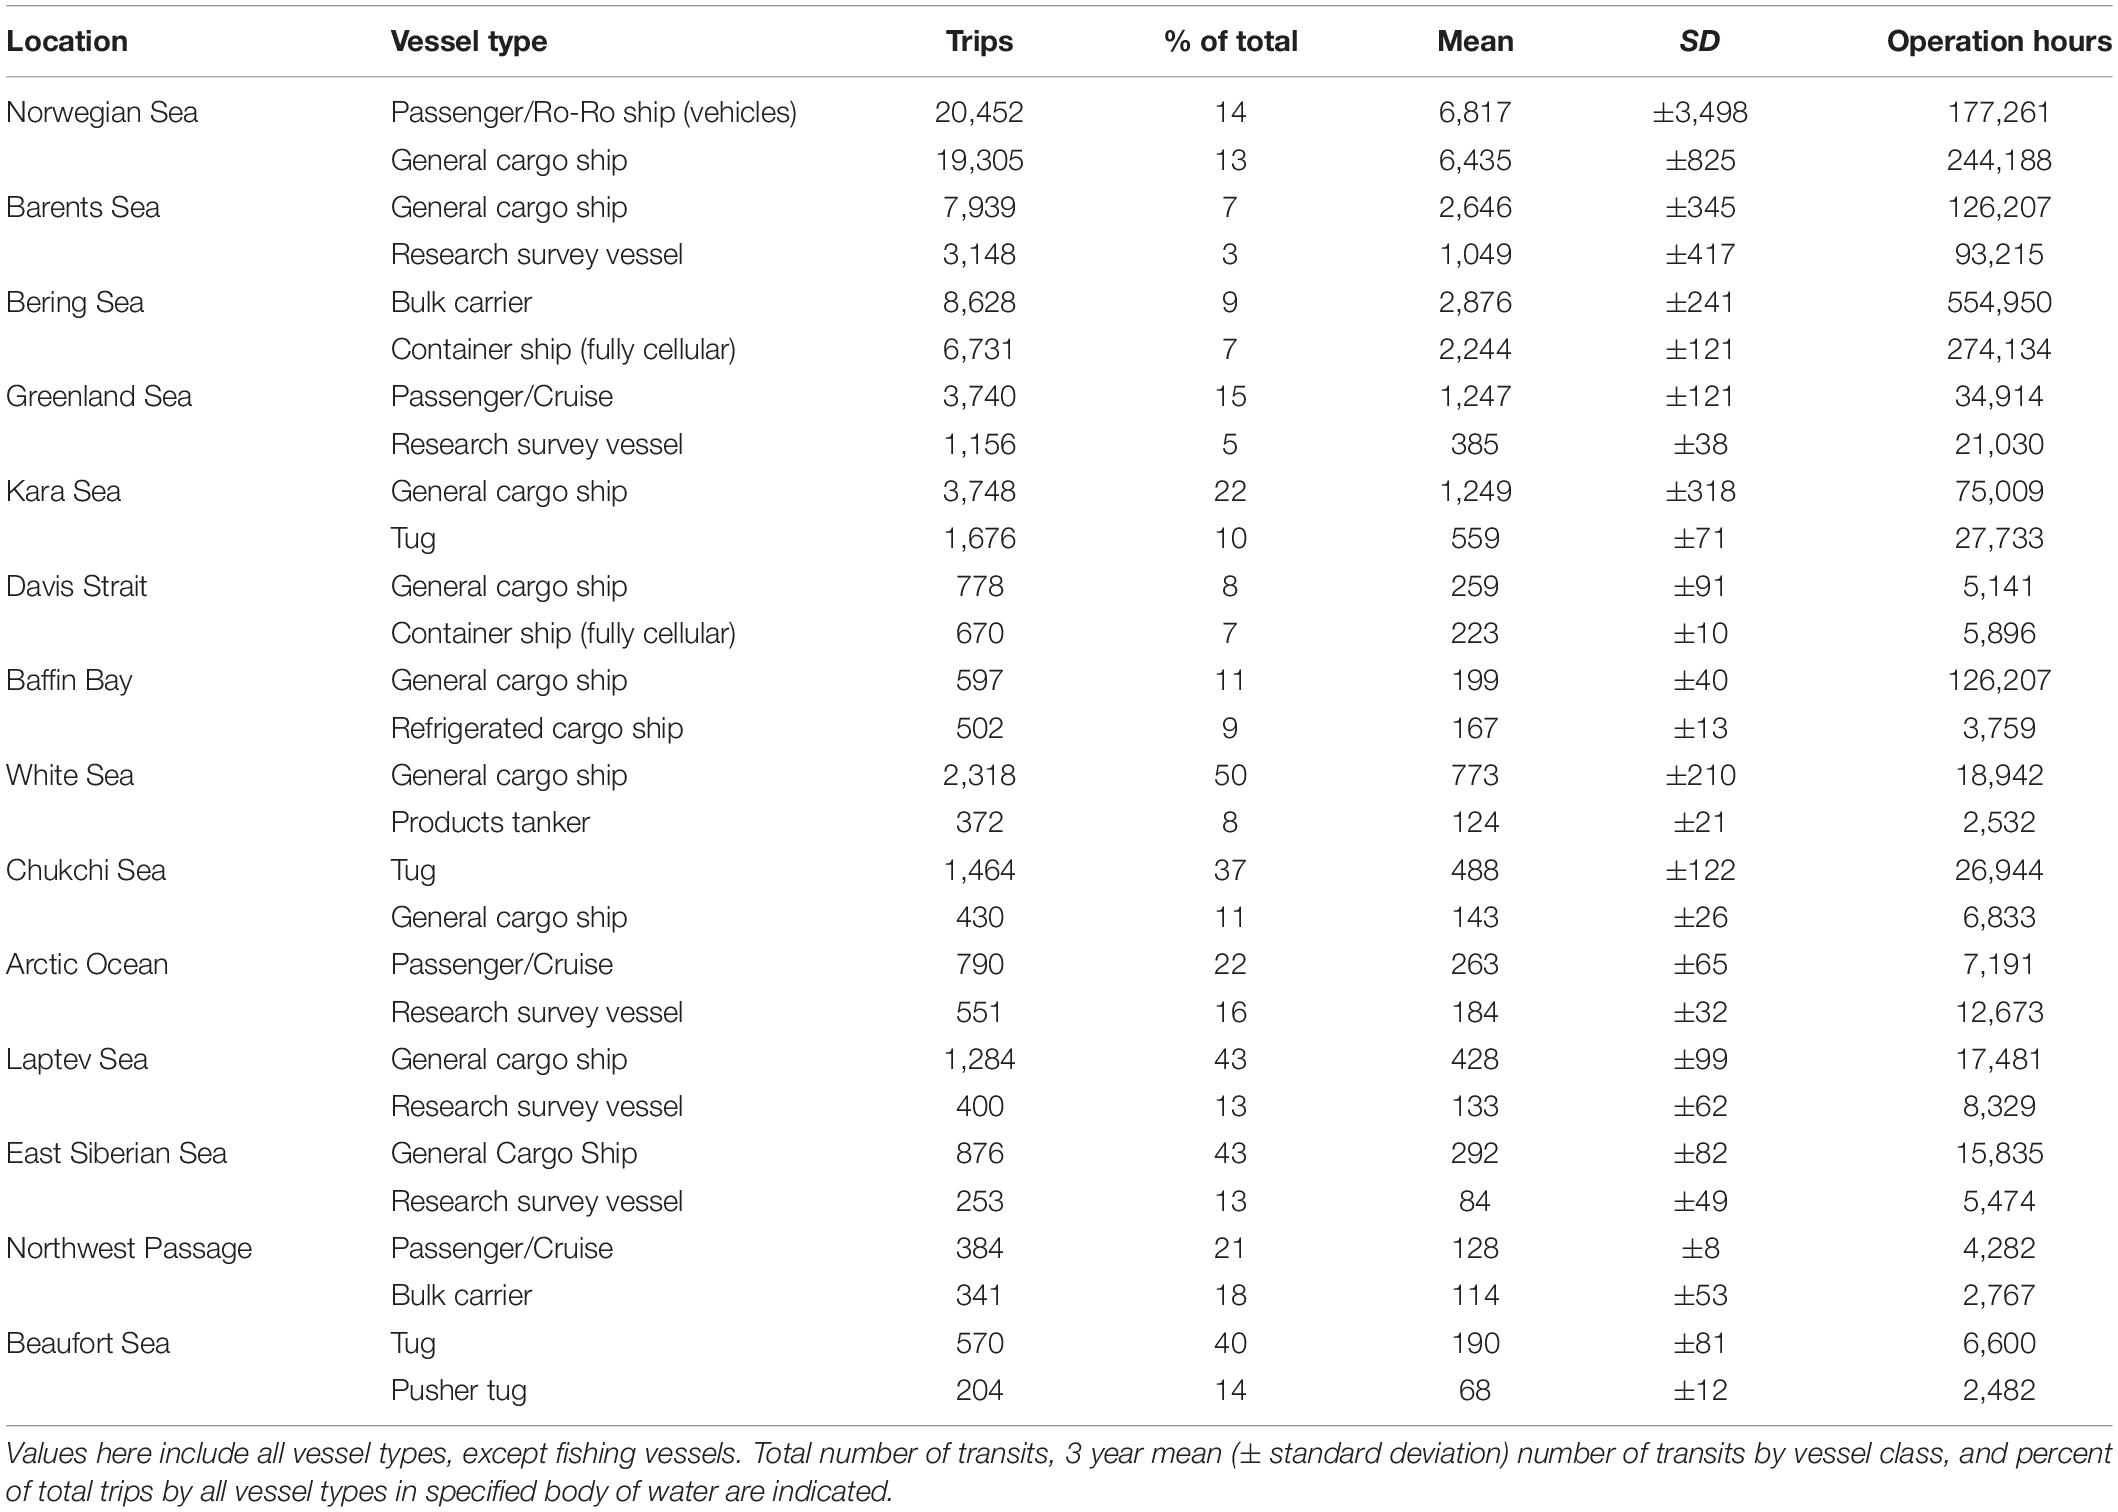
Table 5. Two most common (as measured by number of trips) vessel classes in each Arctic waterway studied.
Vessel operations associated with the oil and gas industry were also strongly represented in our records, both numerically and spatially. Level 5 vessels types associated with the production and transport of oil and gas included, but were not limited to, Platform Supply Ships, Anchor Handling Tugs, Standby Safety Vessels, Drilling Ships, and Tankers. The Norwegian, Barents, and Kara Seas exhibited the greatest extent of oil/gas exploration- and extraction-related activities. Collectively, oil industry ships (excluding tankers) accounted for a total (for all 3 years) of 4,633, 2,821, and 671 transits in the Norwegian, Barents, and Kara Seas, respectively. Tankers moving hydrocarbon products [crude oil, Liquified Natural Gas (LNG), and Liquid and Petroleum Gas (LPG)] made 2,089, 1,930, and 596 transits in these three seas in 2015, 2016, and 2017, respectively.
Ships in the Passenger/Cruise vessel class made the greatest number of trips in the Greenland Sea (3 year total = 3,740 trips; mean = 1,246.7/yr), followed by the Barents (mean 630.0/yr) and Norwegian Seas (mean 484.0/yr) and the Arctic Ocean (mean 263.3/yr) (Table 5). Passenger/Cruise vessels comprised 22.4 and 20.8% of all vessel trips in the Arctic Ocean and Northwest Passage, respectively. Tugs made more trips than all other vessel classes in the Chukchi and Beaufort Seas (1,464 and 570 transits, respectively) and ranked among the top three vessel types in trips made in the Barents, Bering, and Kara Seas (Table 5). Transits by Icebreakers were most common in the Arctic Ocean and Northwest Passages, but trips by this vessel class were relatively few elsewhere.
Vessel Activities by Location
The Norwegian Sea exhibited the highest overall number of transits in 2015 (n = 56,952 trips) and 2016 (n = 47,103); whereas the greatest number of trips occurred in the Barents Sea in 2017 (n = 45,578 transits). Highest overall number of vessel operating hours occurred in the Bering Sea in 2015, 2016, and 2017, followed by the number of hours logged in the Barents Sea in those same years.
Most transits in the Bering Sea were logged by fishing vessels (exceeding 11,000 trips in each of the 3 years; mean = 13,520; range 11,089–15,082). These were generally short in duration (3 year mean = 30 h/trip) and distance (3 year mean = 143 nm). In addition, stern trawlers and factory stern trawlers collectively logged over 20,000 trips in the 3 year study period (mean = 3,464/yr; range = 2,146–4,559), a mean of 38 h/trip. Bulk Carriers in the Bering Sea logged more hours of operation than all other (non-fishing) vessel types in all locations, exceeding the second-highest, Cellular Container Ships in the Bering Sea, by over 280,000 h (Table 5). Transits by these vessels involved considerable distances (Bulk Carriers: mean = 712 nm/trip; Cellular Container Ships: mean = 669 nm/trip) many having been engaged in lengthy intercontinental voyages between western North America and Asia using the North Pacific Great Circle Route (Figures 2A–C).
In the East Siberian, Kara, and Laptev Seas (along with portions of the Chukchi, Beaufort, and Barents Seas), collectively considered as segments of the Northern Sea Route, General Cargo Ships made the greatest number of trips (Table 5). Research Survey Vessels and Products Tankers were also among ship classes making the greatest number of trips along this shipping route. Relative to other locations in the study area, comparatively small portions (75.4–85.3%) of these waterways were exposed to vessel traffic.
Most transits through the Canadian archipelago including the Northwest Passage, Baffin Bay and Davis Strait were made by General Cargo Ships (1,375 total, in these three areas in all 3 years) and Passenger/Cruise ships (1,048 in 3 years). Container Ships, Refrigerated Cargo Ships, Bulk Carriers, Chemical/Products Tankers, and Icebreakers were also among vessel types making the greatest number of trips in these waterways (Table 5). In the Northwest Passage, alone, total number of trips increased from 443 in 2015 to 644 in 2016 to 760 in 2017. In this location, the total number of hours under operation progressed from 8,669 h in 2015 to 6,766 in 2016 to 10,158 in 2017.
Inter-Year Comparisons
We observed modest inter-year changes in the number of individual vessels (by vessel type) operating in Arctic waters. Dry Cargo/Passenger vessels comprised the highest overall number of individual vessels operating in 2015 (1,771 vessels) and 2016 (1,699 vessels); while most ships operating in 2017 were in the Bulk Carrier class (1,779 vessels).
The overall number of trips increased in each year of the study period over the previous year while hours of operation and distances traveled declined (Table 1). At least some observed inter-annual variability can be attributed to large-scale changes in fishing vessel operations. For example, vessels engaged in fishing operations in aggregate logged a total of 51,093, 75,892, and 80,958 trips in 2015, 2016, and 2017, respectively (constituting more trips than all other vessel types in each year). Fishing vessels also represented 39.6% of all vessel operating hours in the Barents Sea in 2017 (and 10.8% of all vessels in the entire study area), but only 17.8% in 2016; in the Bering Sea fishing vessels logged over 100,000 more hours in 2017 than in 2016 (Table 3).
Other regional inter-annual fluctuations in vessel operations occurred. The number of trips and hours of operation by Bulk Carriers and Cellular Container Ships in the Bering Sea exhibited increases of 3–15% in 2016 relative to 2015, and the number of trips either declined (by 7%) for Cellular Container Ships or increased (by 7%) Bulk Carriers in 2017 relative to 2016. Hours logged by Chemical Tankers, Chemical/Products Tankers, Crude/Oil Products Tankers, and Products Tankers in the East Siberian Sea (a 3 years collective total of 5,958 h) increased 4.6% in 2016 over 2015 but declined 5.3% the following year. Total operating hours by these same four vessel classes in the Kara Sea went from 10,579 h in 2015 to 18,241 h in 2016 and 12,427 in 2017.
Trips by Passenger/Cruise vessels in the Greenland Sea increased by 2% in 2016 over 2015 and increased 20% in 2017 relative to 2016. In contrast, voyages by passenger/cruise ships in the Barents Sea was greatest in 2015 and dipped by about 5% in each of the subsequent 2 years. Trips by this vessel class in the Norwegian Sea were most numerous in 2015, subsequently declined 21% in 2016 and then increased 13% the following year. In one perplexing example an abrupt and precipitous drop occurred in vessel hours of operation in the Norwegian Sea in mid-2016 that continued at similar levels throughout 2017 (Figure 5) – a pattern that did not occur in monthly hours of operation in the Bering Sea (Figure 6). In this Norwegian Sea case, the number of trips by Passenger/Roll-On, Roll-Off vehicle transport (or “Ro-Ro”) vessels alone dropped from 11,656 trips in 2015 to 5,291 in 2016, and 3,505 in 2017 (Figure 5); while the number of transits by General Cargo Ships was 7,468, 6,389, and 5,448 in 2015, 2016, and 2017, respectively. In contrast, General Cargo Ships and Bulk Carriers operating in the Barents Sea added an average of 363 and 264 trips, respectively, in each subsequent year of the study while operating hours of these two vessel classes declined between 6.1 and 35.6% each year in the same period.
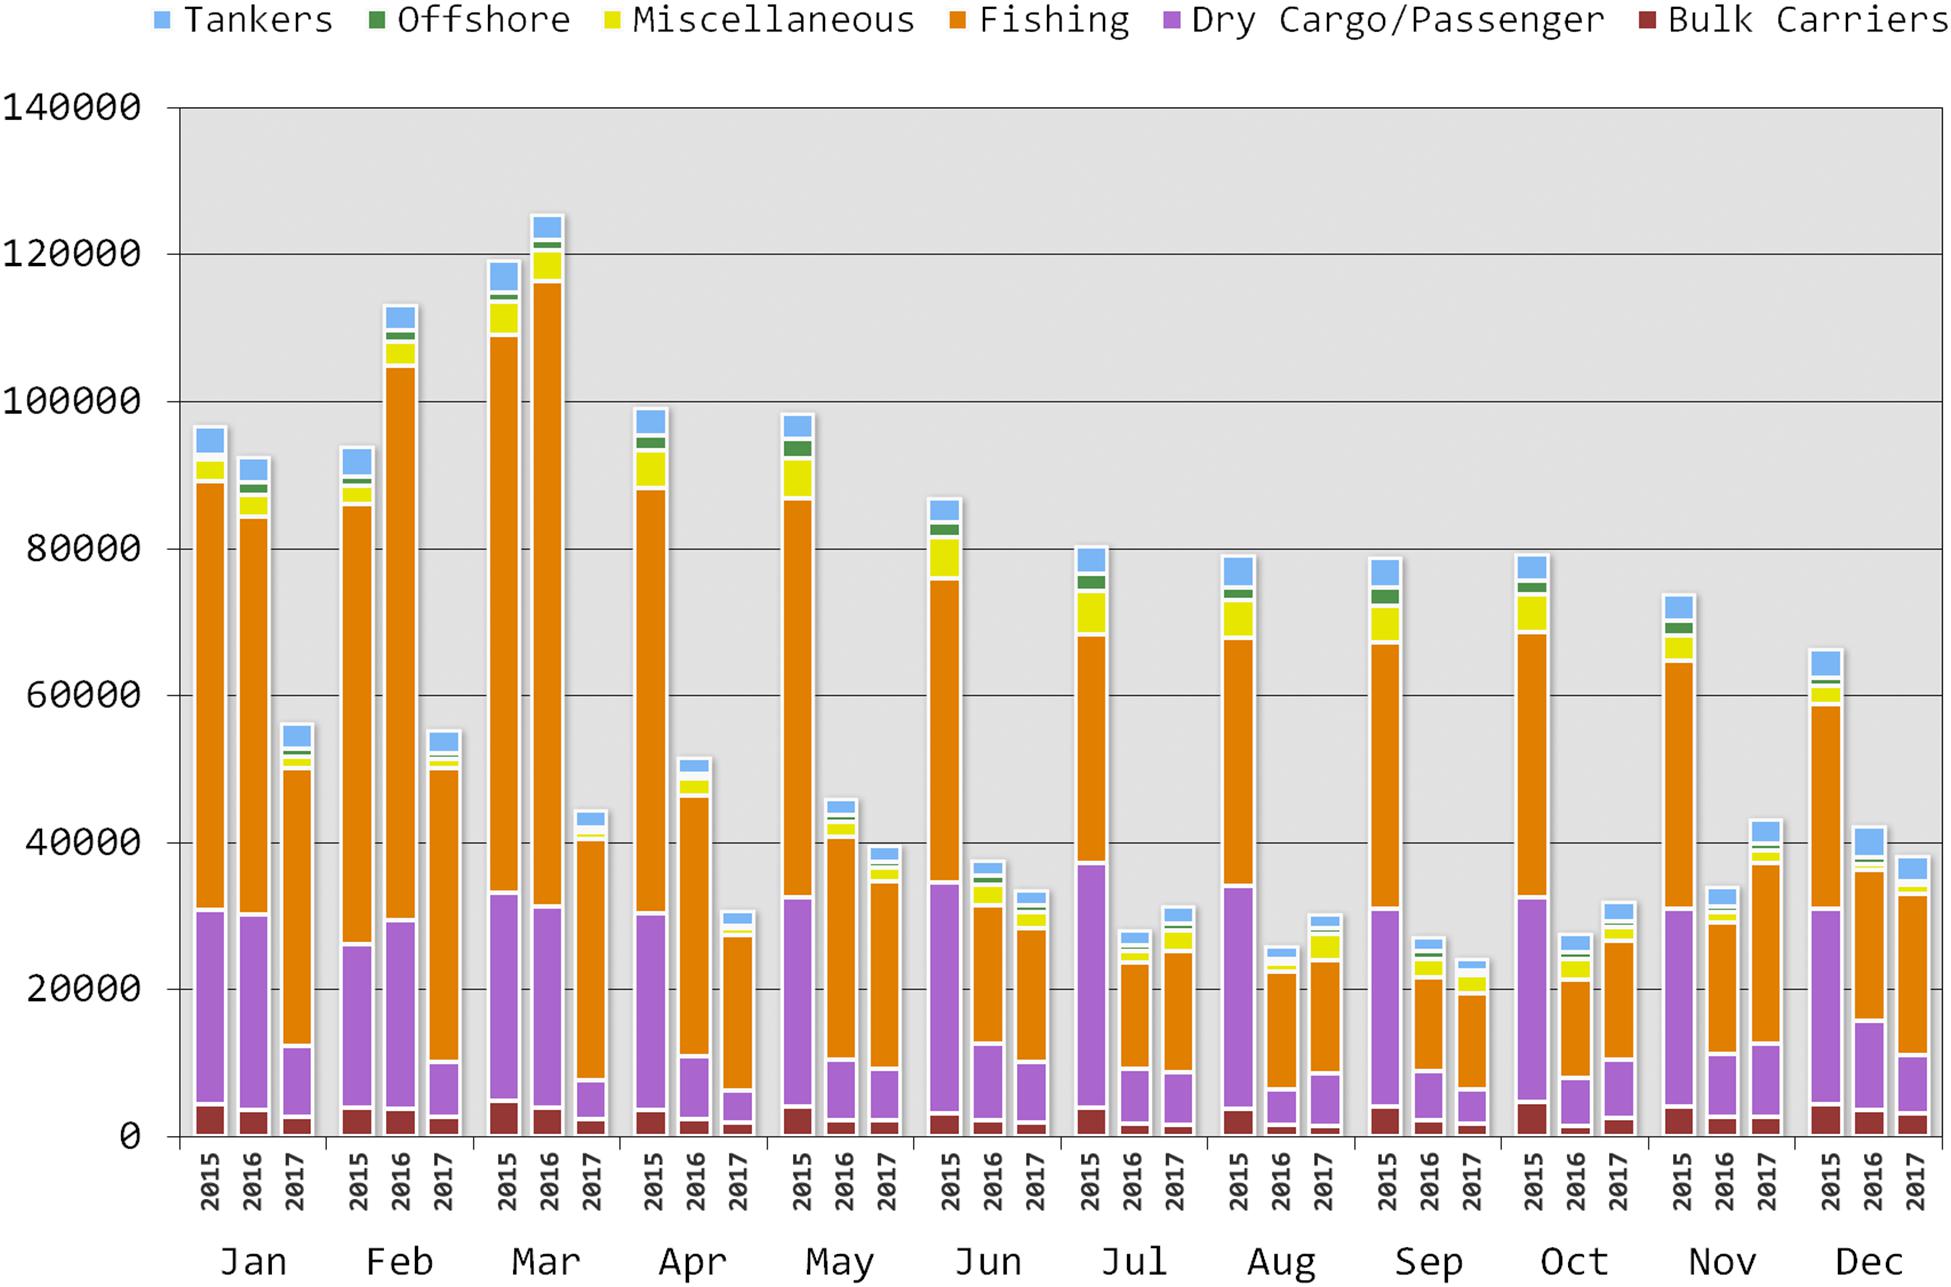
Figure 5. Vessel hours of operation in the Norwegian Sea, by month and vessel class, in 2015, 2016, and 2017.
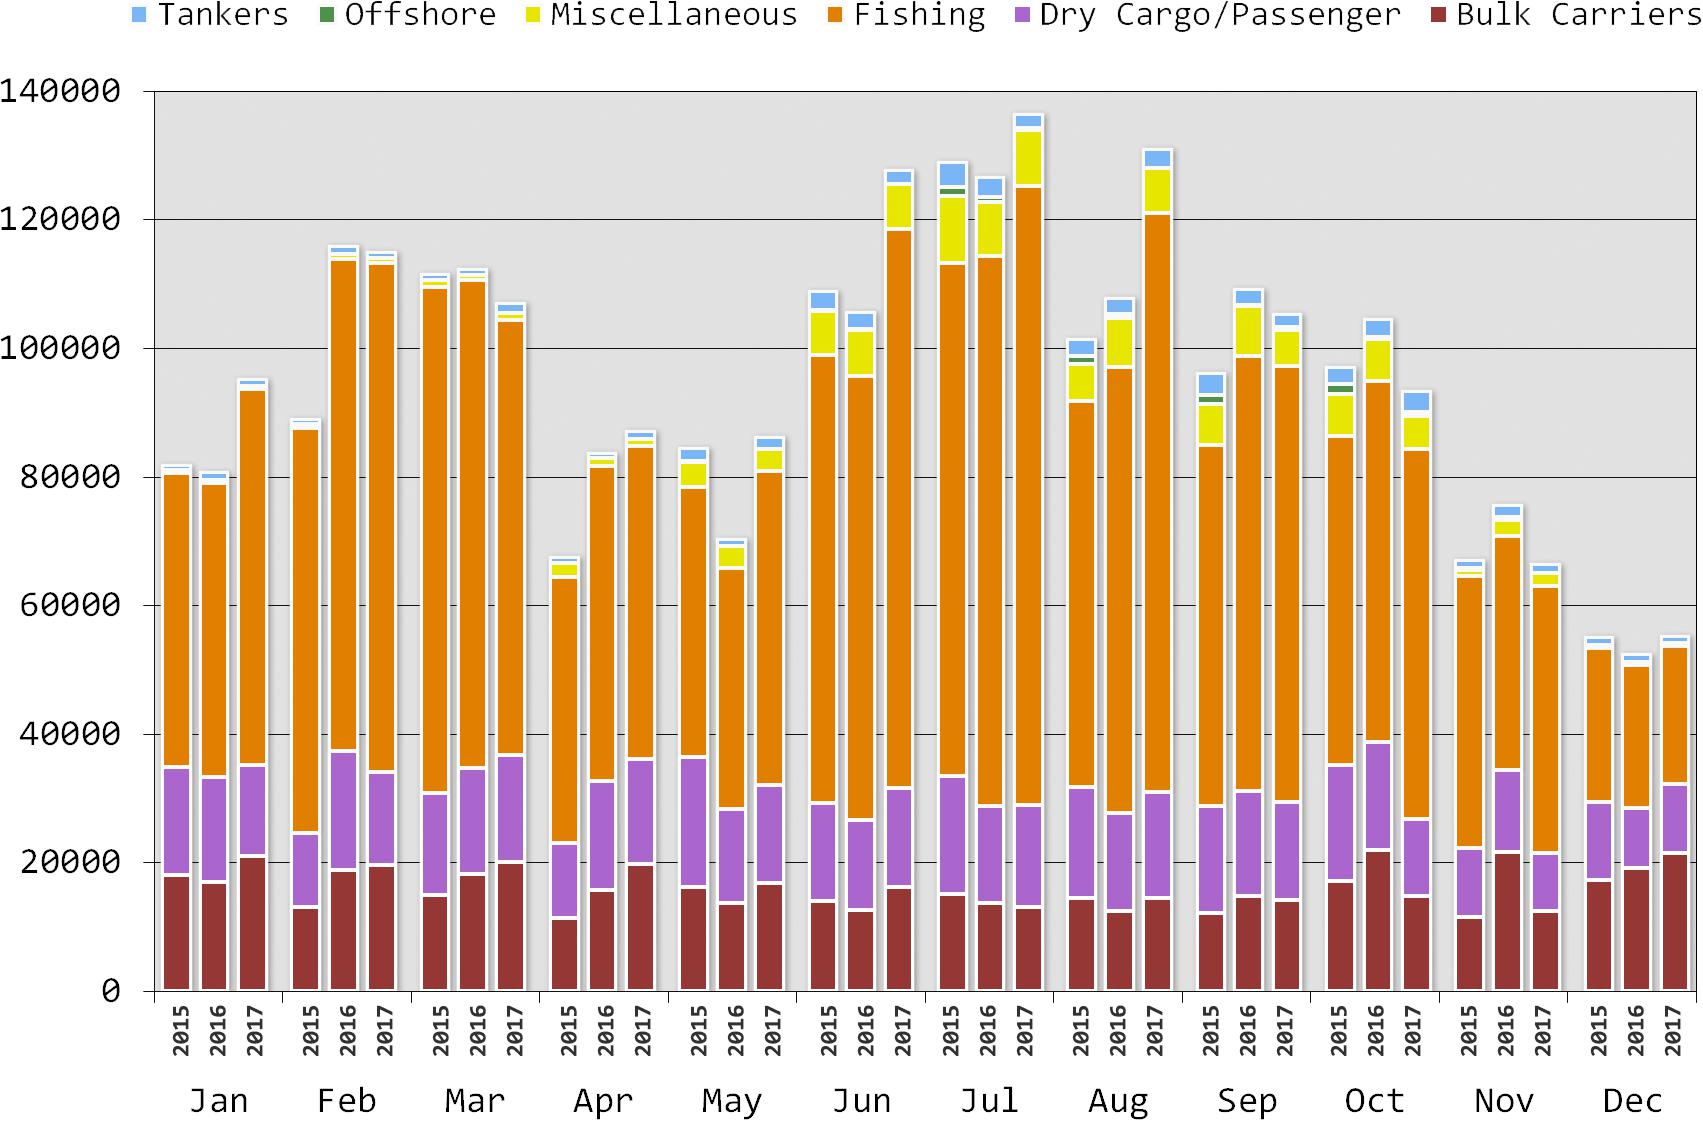
Figure 6. Vessel hours of operation in the Bering Sea, by month and vessel class, in 2015, 2016, and 2017.
Discussion
Tens of thousands of voyages were undertaken in Arctic waters in each year of our study. And, yet, high latitude vessel activity is projected to grow as conditions evolve. This in turn is expected to heighten negative consequences for Arctic marine ecosystems (Arctic Council, 2009; Roach, 2018). While vessel traffic levels were extensive in some locations, they remained limited in others. It is the latter areas that may undergo the greatest amount of growth in changing ice conditions.
Characteristics of Maritime Activities in Various Waterways
Based on the volume, nature, and spatial characteristics of vessel traffic, Arctic waterways can be organized into three groups. These are the Barents, Bering, and Norwegian Seas; the Northern Sea Route and Northwest Passage and associated complexes of bays and straits; and the Arctic Ocean. In the first of these, the Barents, Bering, and Norwegian Seas include relatively low-latitude areas with extensive seasonal ice-free zones. Access to the Barents and Norwegian Seas is facilitated by warm northward-bearing North Atlantic surface waters creating vast ice-free areas during much or all of the year. Consequently, operations in these three seas were conducted by a diverse set of vessel types and represented an overwhelming majority of all vessel activity in the entire study area. Fishing activities predominated and were a major contributor to observed levels of surface area exposure to vessel activity (over 95%), a function of both the number of trips and broad spatial footprint of this industry. However, the importance of these bodies of water to both long- and short-distance transport of goods was also evidenced by the presence of large vessels such as General Cargo Ships, Bulk Carriers, Container Ships, and Passenger/Ro-Ro (vehicle) transport vessels, among others (Table 5).
In the Bering Sea, for example, long-distance, inter-continental trade was indicated by Bulk Carriers having logged the highest number of hours of operation of all (non-fishing) vessel classes, surpassing by nearly twofold the next-highest vessel class, Container Ships. These values are due, in part, to the expanse of this body of water, i.e., temporally and spatially lengthy trips were needed to traverse it. A significant inter-continental trade route exists in a portion of the Bering Sea connecting Asian and North American ports along a Great Circle Route atop the North Pacific Ocean (Burns and Poe, 2014) (a portion of this route is evident in Figures 2A–C). While most of the substantial ship traffic along this route passes south of the Aleutian Islands, much of it utilizes the Unimak Pass through the Aleutians and passes into waters north of the archipelago (Schwehr and McGillivary, 2007).
A second group of waterways – the East Siberian, Laptev, Kara and White Seas (or, the Northern Sea Route), and in the Northwest Passage, Baffin Bay, Davis Strait and the Beaufort and Chukchi Seas – generally exhibited ice cover that exceeded 50% (up to 9/10 in some locations) in winter and relatively little (e.g., <10%) ice cover in summer/fall (Adams and Silber, 2017). Some trips were regional in nature delivering supplies and goods to ports within the Northern Sea Route (Humpert, 2014; Zhang et al., 2016) or Northwest Passage (Haas and Howell, 2015).
A comparatively small number of unique, primarily large vessels (e.g., bulk and container ships, tankers) (Table 5) undertook lengthy trips in the Northern Sea Route, a finding consistent with previous studies (Zhang et al., 2016). Some of these ships were on trans-Arctic voyages delivering supplies and materials, transporting oil and gas products, or otherwise connecting distant ports (Humpert, 2014; Dalaklis and Baxevani, 2017). Arctic waterways as tourism destinations was evidenced by numerous passenger cruise ship transits in waters comprising the Northwest Passage and Northern Sea Route, although these vessels made far fewer trips than containerized ships and tankers. The number of vessels engaged in transport of energy products along the Northern Sea Route reflected the presence of a mature oil/gas industry on the Siberian coast.
Varying amounts (36.5–88.9%) of sea surface exposure to vessel traffic along the Northern Sea Route and in the Northwest Passage (including the Greenland and Beaufort Seas here) (Table 4) appear related to prescribed, non-diffuse routes and restricted access due to ice cover for at least part of each year. Total water surface extent available for transits was also a factor. In the Davis Strait, for example, a comparatively small body of water, a relatively modest number of trips resulted in over 90% its surface area being exposed to trips. In contrast, in the Greenland Sea, a spatially vast area, numerous trips (fourth highest of all areas studied) exposed only 77% of its surface area to vessel activities, suggesting these trips (many by passenger cruise and research survey vessels) were localized or bounded by certain routes.
Research survey vessels logged a substantial number of hours in the Greenland, Kara, Laptev, and East Siberian Seas (Table 5). Much of this, notably in locations such as the Kara (Smith, 2016) and Laptev Seas (Soldatkin, 2017), can be attributed to seismic surveys for sub-seafloor oil reserves evidenced as grid pattern ship tracklines in our sample. Separately, research survey cruises in locations such as the Barents Sea (and Arctic Ocean) were tied to scientific studies of the oceanography, glaciology and marine ecosystems of the region (e.g., Hopkins, 2018), and fisheries stocks research cruises (e.g., Ingvaldsen et al., 2017; Vedenin et al., 2018). Bathymetric surveys in support of Arctic nation’s recent claims to Exclusive Economic Zones under the United Nations Convention on the Law of the Sea were also undertaken during our study (e.g., Shimeld and Boggild, 2017). Because they can involve visits to remote sampling locations and may include extended data-collection periods, research and scientific cruises can be long in duration, thereby inflating hours of operation values.
Studies indicate the Northern Sea Route maintains regional and potential international importance (Pierre and Olivier, 2015). However, its economic relevance, especially regarding global trade implications, may remain somewhat limited in the near term due to market conditions (Raspotnik and Stephen, 2013; Lee and Kim, 2015; Zhang et al., 2016) and lingering concerns regarding navigational hazards (Stephenson et al., 2014). Voyages may be similarly limited in the Northwest Passage at present, particularly as significant ice hazards still exist (Haas and Howell, 2015).
Nonetheless, commercial and logistical boundaries along these two major shipping routes are currently being tested with real trials. In July 2016, the Yong Sheng, an ice class ship owned by Chinese shipping giant COSCO, made its third trip (its first two voyages having taken place in 2013 and 2015) delivering wind turbine equipment from China to the United Kingdom through the Northern Sea Route, and then returned via this route (Humpert, 2016). The company sent several additional general cargo vessels along this same passage that same year. In addition, in fall 2018, the Venta Maersk became the first container ship to travel (albeit while still being aided by an icebreaker for a portion of the trip) from Vladivostok along the Northern Sea Route, via portions of the Bering, Chukchi, East Siberian, and Barents Seas, to the German port of Bremerhaven (Reuters News, 2018). In the same period, two LNG-powered bulk carriers owned by Finnish shipping company ESL bore general cargo loads from Japan, westbound along the Northern Sea Route, to the Swedish port of Oxelösund (also icebreaker-aided) (Corkhill, 2018). In August 2016 a cruise ship made a journey from Seward, AK to New York, NY, the first of its class to traverse the Northwest Passage (Dennis and Mooney, 2016). Tens of cruise ships capable of long Arctic voyages now exist, with several more being added each year (Nilson, 2018).
Cases involving these “firsts” notwithstanding, overall, we observed relatively small increases in trips in these key Arctic passageways. However, as changes in environmental conditions evolve toward greater accessibility, sea-borne industries now enter a critical phase of testing increased use of these areas. It is precisely these areas that may be experiencing the most growth in the coming years and may be most ecologically vulnerable as maritime activities expand.
Last, the truly polar Arctic Ocean consisted of the greatest overall surface area in our study and was characterized by comparatively low (but, not zero) ship traffic volume (<1,500 trips annually). Being ice-bound much of the year travel is limited in the Arctic Ocean and limited amounts (<25%) of the water surface was exposed to vessel traffic each year. Here, passenger cruise ships, research survey vessels, and ice-beakers, in that order, made most trips in the 3 years study period. These voyages were also highly-seasonal, most having occurred primarily June to October.
Sea Ice Cover
Amounts of ice on the sea surface and in the water column are important determinants in the location and extent of Arctic vessel traffic. Globally, the highest recorded annual global temperature occurred in 2016 (U.S. Global Change Research Program [USGCRP], 2017), exceeding a 139-year annual average by 0.95oC (NOAA, 2019b). The Earth’s historical annual average temperature was surpassed in 2017 by 0.85oC. Related, in 2016 Northern Hemisphere snow and ice extent was the lowest recorded in the period 1979 to present (NOAA, 2019a), a substantial decline from 2015 coverage. Snow/ice cover was 2% greater in 2017 relative to 2016, but these 2 years represented the lowest levels in the last 39 years (U.S. Global Change Research Program [USGCRP], 2017). Likewise, in our study area sea ice coverage changed minimally (ca. <2% between years) in the course of our study (National Snow and Ice Data Center [NSIDC], 2018). Thus, relative amounts of Arctic-wide ice coverage may have been only one factor influencing observed inter-annual changes in volume and distribution of vessel traffic patterns.
Three-Year Trends
Numerous sources have indicated declining ice cover will prompt increased maritime activities in historically ice-limited areas. Sea ice extent almost certainly had a role in the observed number of trips observed in some locations (e.g., the Northern Sea Route) and by some vessel classes. However, we observed no overt increasing or decreasing trends in vessel traffic volume in our limited study period. For example, as noted, although the overall number of voyages steadily increased during our study, distances traveled and time underway decreased. Instead, a more apparent pattern involved considerable regional inter-annual variability in operations. This variation confounds conclusions about region-wide activities and defy simple, single-factor explanations regarding trends and their causes.
A suite of variables, nearly all of which are beyond the scope of this study, likely had roles in Arctic maritime activity levels. These might include, for example, abundance, availability, and locations of fisheries resources (e.g., Watson and Haynie, 2018); market forces (e.g., oil/gas demand and prices); global economic factors effecting intercontinental trade (e.g., Eurasia Group, 2014; International Energy Agency [IEA], 2019); and economic feasibility relative to navigational safety of high Arctic marine travel (e.g., Zheng et al., 2016). As one example, in late-2015 Royal Dutch Shell abandoned pursuit of further exploratory drilling in the U.S. Chukchi Sea. This decision resulted from assessments of expected risks and high project costs relative to potential return (i.e., comparatively low oil prices at the time) after finding insufficient indications of crude in the region (Schaps, 2015).
Potential Impacts
The release of air-borne emissions from shipping activities has become a growing concern for high-latitude marine transportation (Dalsøren et al., 2007; Johansson et al., 2017). Amounts of aerosols and gaseous emissions, including carbon dioxide, are expected to increase with increased shipping activities thereby accelerating the melting of ice and snow (Corbett et al., 2010). Air-borne pollutants and greenhouse gases are also emitted as by-products of ongoing oil and gas extraction activities (Peters et al., 2011). In addition, scores of non-indigenous species have been detected in Arctic ballast water exchange operations (Miller and Ruiz, 2014).
The U.S. Coast Guard has indicated an increased likelihood of maritime accidents is expected to accompany expanded Arctic vessel operations (United States Coast Guard [USCG], 2010). Fatal vessel strikes (Huntington et al., 2015; Cooke and Clapham, 2018) and fishing gear entanglement of Arctic marine mammal species (George et al., 2017) are reported conservation concerns. Adverse impacts to fish and marine mammal populations are expected as industrial activities increase (Reeves et al., 2012) in turn impacting indigenous people reliant on the region’s resources (Huntington et al., 2015). These impacts may compound the vulnerability of Arctic species as they undergo shifts in distribution and habitats change as a result of rapidly changing Arctic ecosystems (Silber et al., 2017).
Our findings indicate waters exposed to at least some vessel traffic exceeded 75% in nearly all areas studied and exposure levels exceed 90% in 5 of the 14 areas (Table 4). Associated vessel-related impacts, such as those related to introduced noise, may follow. Anthropogenic underwater noise sources may alter marine mammal intra-species acoustic signaling behavior (Moore et al., 2012; Fournet et al., 2018) or disrupt normal behavior (Gordon et al., 2003). These noise sources and other stimuli may compound stressors already impinging on Arctic marine mammal populations as a result of climate change itself (Ragen et al., 2008; Kovacs et al., 2011).
The possibility of an uncontained, large-scale oil spill may be the single greatest threat to Arctic ecosystems (Afenyo et al., 2017; Congressional Research Service [CRS], 2018). Effects from a spill on biological communities could be severe and long-lasting. And, while local effects may linger, high winds and moving ice fields may transport surface oil to locations other than a spill site. Among other potential impacts, Arctic seabird and mammal species (e.g., polar bears, Aleutian sea otters) are highly vulnerable to oiling whereby thermoregulation and buoyancy are effected (e.g., Renner and Kuletz, 2015). Yet, spill response infrastructures and contingency planning are generally regarded as inadequate in many poorly supported locations where severe and unpredictable weather conditions can prevail (e.g., National Research Council of the National Academies of Science [NRC], 2014; Wilkinson et al., 2017). The plausibility of a substantial spill appears high given the levels of activity devoted to oil/gas industries in our findings.
To be sure, the severity of some potential impacts identified here has not been fully quantified in all cases, particularly at the population level. However, given projections for growth of vessel operations, it is reasonable to assume that potential threats may become realities.
Fishing Vessels and Effort
Multi-billion-dollar commercial fisheries exist in the Norwegian, Bering, and Barents Seas for various species of cod, halibut, capelin, pollock, salmon, herring, and crustaceans, among others. Norwegian and Barents Sea fisheries resources destined for markets throughout Europe, Russia and Asia are supported by a vast network of fishing vessels, trawlers, and vessels engaged in processing and transporting fish products (Food and Agriculture Organization of the United Nations [FAO], 2011). Crustacean and groundfish fisheries for Walleye Pollock (Gadus chalcogrammus), Pacific Cod (Gadus macrocephalus), Atka Mackerel (Pleurogrammus monopterygius) among other species render the Bering Sea one of the most productive fishing regions in the world.
As measured by number of trips, unique vessels, and hours of operation, fishing vessel operations, collectively, dwarfed activity levels by all other vessel classes. Our metrics also attest to the magnitude and breadth of these fleets. For example, in the Bering Sea, alone, fishing vessels accounted for 10–17% of all vessel operating hours Arctic-wide (Table 3).
But industry activities were not static. Availability of fisheries resources in Arctic waters can be variable (e.g., Haug et al., 2017; Troell et al., 2017). Therefore, the extent and locations of vessel operations associated with these resources will likewise vary. Observed inter-year changes in spatial distribution may have reflected shifts in targeted species locations (Figures 3A–C) in turn having been driven by changing prey distribution and other factors. Evidence indicates that commercially important fish species are undergoing northward distributional shifts in response to warming water temperatures (e.g., Fossheim et al., 2015; Misund et al., 2016) and fishing practices are adjusting to these ecosystem-level changes (Watson and Haynie, 2018). The industry also responds to changing markets, seeking to maximize profits depending on fish products sought or proximity of processing centers (Watson and Haynie, 2018). Diminishing sea ice levels may also contribute to the emergence of, and increased access to, previously inaccessible fishing locations. In short, a malleable industry was apparent in our sample.
An abrupt decline in hours of operation logged in the Norwegian and Barents Seas noted here may be at least in part related to a substantial reduction in availability of capelin (Mallotus villosus), an integral part of this ecosystem (ICES, 2017). Landings for this species declined from 11,500 landed tones in 2015 to zero in 2016 and 2017 (but subsequently increased in 2018) (ICES, 2017). Some inter-year variability in fishing trips may also be attributed to changes in catch limits for Atlantic cod (Gadus morhua), haddock (Melanogrammus aeglefinus) and other species established each year for Norwegian and Barents Sea by Norwegian-Russian bilateral agreements and the International Council for the Exploration of the Sea (ICES) (Seaman, 2017).
Impacts From Fisheries
The size of the fleet and number of vessels supporting the vast industry suggest impacts from the industry may be significant. While typically smaller in size than large container, tanker, or bulk carrying ships, fishing vessels nonetheless contribute a proportional share to air-borne emissions (Dalsøren et al., 2007; Roiger et al., 2015), radiated underwater noise (Hovem et al., 2015; Peng et al., 2017), or small fuel spills during routine operations or accidents (International Maritime Organization [IMO], 1988; Richardson et al., 2016). Active and “lost” gear may entangle Arctic-dwelling marine mammals and other marine vertebrates (Reeves et al., 2014; George et al., 2017); and like all ships, fishing vessels are capable of fatally striking marine mammals (Jensen and Silber, 2003).
Factoring in incidental bycatch (e.g., Ianelli and Stram, 2014; Breivik et al., 2017) and the effects of trawling (represented by Stern Trawlers and Factory Stern Trawlers in this study; Table 3) on demersal communities (Puig et al., 2012; Christiansen et al., 2014), impacts on ecosystem integrity from this industry are indeed consequential. Effects on targeted species assemblages themselves and related ecosystem impacts compound negative influences on these biological communities (Zeller et al., 2011; ICES, 2018; Popov and Zeller, 2018). Therefore, considering the volume of fishing operations, as characterized by numbers of trips in our sample, this source may dwarf ecosystem impacts typically ascribed to larger vessels.
Oil and Gas
Intensive vessel activity found in some locations reflected a dynamic Arctic energy industry. Terrestrial and undersea oil deposits in the region are expansive (US Geological Survey [USGS], 2009; Gautier et al., 2011) and they have been accessed in waters of the Norwegian/Barents Seas and off Russian coasts. Year-round ice-free conditions and relatively shallow shelf waters enhance the economic viability of drilling in the Norwegian and Barents Seas. Over 30 exploratory wells were drilled on the Norwegian Shelf in each of 3 years, 2016–2018 and 11 new discoveries were made in 2017 (Norwegian Petroleum Directorate, 2018). In the Barents Sea, alone, 15 new exploratory oil wells were drilled in 2017 north of Hammerfest, Norway (Norwegian Petroleum Directorate, 2017).
Vessel operations related to oil/gas activities were strongly represented in our sample. For example, plots of ship tracks indicated hubs of oil and gas vessel activities in Russia’s Kara Sea (Figures 2A–C) in support of the Prirazlomnoye oil field, south of Novaya Zemlya. Production from the field began in December 2013. By the end of 2017, over 41 million barrels of oil had been extracted from the site (Gazprom Neft, 2018). In addition, construction was completed at the Russian seaport of Sabetta in mid-2016, one of the most complex LNG projects ever undertaken (Dalaklis et al., 2018), to handle LNG and gas condensate from the Yamal Peninsula. Shipments of LNG from the facility began in late 2017, and by August 2018 over 4 million tons had been removed (World Maritime News, 2017). Transport of gas from these facilities, across the Barents Sea to Murmansk, Russia (Figures 2A–C) via ice breaking shuttle tankers occurs year-round (Offshore Technology Focus, 2018).
Seismic survey vessels, shallow and deep-water ice islands, and ice-strengthened drillships were in use in the Alaskan and Canadian Beaufort Sea throughout the 1970s and 1980s (Timco and Frederking, 2009). By 2000, hundreds of exploratory or producing wells had been opened in the region. While at present only the Beaufort Sea has producing wells in U.S. federal waters (Bureau of Ocean Energy Management [BOEM], 2018), the region is expected to remain of interest to oil companies. For example, in December 2017 the Italian oil producer Eni began drilling a new well from an existing man-made island in the U.S. Beaufort Sea, becoming the first company to do so since 2015 (Congressional Research Service [CRS], 2018). Whereas energy production may one day ramp up again in the Beaufort Sea, we found some of the lowest levels of vessel transits and hours underway in this location.
Impacts From Oil/Gas Industries
Our findings indicate energy products are on the move on large scales and traversing great distances in some Arctic waters, thereby contributing to the vulnerability of marine environments. Potential for large spills from oil- and gas-bearing vessels are a serious concern (Arctic Council, 2009; National Research Council of the National Academies of Science [NRC], 2014). Indications are insufficient infrastructure and resources exist to respond to, contain, or clean spills in remote and hazardous locations (National Research Council of the National Academies of Science [NRC], 2014; Nevalainen et al., 2017; Wilkinson et al., 2017). In addition, long residency times of spilled oil (Hazen et al., 2016) especially in cold-water ecosystems (Engelhardt, 1985; Vergeynst et al., 2018), and long-term entrainment in marine biological processes (Hicken et al., 2011; National Research Council of the National Academies of Science [NRC], 2014; Yuewen and Adzigbli, 2018) contribute to the potential severity of impacts from a large spill.
Seismic survey exploration of sub-seafloor oil reserves introduces loud sounds into the water column. Pulsed seismic signals are among the most powerful man-made sound sources (Hildebrand, 2009). Exposure to these sounds have consequences for marine mammal populations and other organisms (Nowacek et al., 2015; Kyhn et al., 2019) by disrupting normal behavior (Richardson et al., 1995), eliciting startle responses (Heide-Jørgensen et al., 2013), and resulting in temporary and permanent hearing loss (National Marine Fisheries Service [NMFS], 2018).
Global reliance on fossil fuels assures energy production will remain a feature in Arctic waters for the foreseeable future. However, in the past, market forces have influenced the levels of Arctic oil industry activities (Harsem et al., 2015). For example, a 2007/2008 global decline in oil demand and prices slowed oil/gas production in the Arctic (Petrick et al., 2017). Economic conditions akin to the 2007/2008 downturn, or other factors, may once again slow production in the future (Lindholt and Glomsrød, 2012). Inherent hazards associated with existing long supply lines through inhospitable natural environments are areas of legitimate concern. Severe ecosystem degradation may follow.
Conservation Measures
The Polar Code
In January 2017, the International Maritime Organization’s (IMO) Polar Code went into effect. Intended to protect unique environments and ecosystems of polar regions, the Code provided new requirements for vessel navigational safety and pollution prevention by addressing new ship design; operations and mariner training; and search and rescue capabilities. Years in the making, the Code applies to passenger and cargo ships >500 gt engaged in international voyages in polar regions (but does not apply to fishing vessels, pleasure yachts, or military vessels) (International Maritime Organization [IMO], 2014). At the time of this writing, the IMO’s Sub-Committee on Ship Design and Construction is considering amendments to the Code to include recommended safety measures for fishing vessels > 24 m in length operating in polar waters and pleasure yachts >300 gt (not engaged in trade)4.
The Polar Code was a landmark set of regulations and guidelines for limiting impacts from shipping. However, some maintain it might have established far more stringent protection measures (Friends of the Earth [FOE], 2016; Ocean Conservancy, 2017; Roach, 2018). Nonetheless, as an already IMO-adopted instrument, strengthening the Code’s existing framework and its measures in response to more fully understood adverse effects would be commendable.
Routing Measures
Potential increases in north-south flowing vessel traffic through the Bering Strait prompted the IMO to adopt routing measures in the region to increase navigational safety. Jointly submitted to the IMO by the Russian Federation and United States and adopted by the IMO’s Maritime Safety Committee in late-2017, the measure (International Maritime Organization [IMO], 2017) established six “two-way routes” and six precautionary areas (for all ships >400 gt, excluding fishing vessels) in the Bering Strait and Bering Sea between the Chukotskiy Peninsula and Alaskan coast. The adopted measure also includes Areas to be Avoided around St. Lawrence Island, King Island, and Nunivak Island (Hobson, 2018).
In its analysis of the routing measures, the U.S. Coast Guard indicated “increased cargo traffic, passenger ship traffic, adventure tourism traffic, oil and gas exploration, and research and scientific activities” would increase the likelihood of maritime casualties and threaten environments inhabited by endangered marine species and remote indigenous communities that rely on traditional subsistence activities (United States Coast Guard [USCG], 2014). Therefore, anticipated benefits of this action include helping ships avoid numerous hazardous shoals, reefs and islands; reducing “…risk of pollution or other damage to the marine environment, including national and international recognized habitat and species; and avoiding the key areas of fishing activities and areas of subsistence activities by local indigenous communities…” It is generally accepted that these measures will also contribute to the reduction of vessel strikes of large cetaceans such as bowhead (Balaena mysticetus), gray (Eschrichtius robustus), and North Pacific right (Eubalaena japonica) whales (Allen, 2014; Huntington et al., 2015).
However, extensive use of the international Unimak Pass and Bering Sea route by large vessels (Figures 2A–C), along with activities of the spatially diffuse commercial fishing industries (Figures 4A–C), may have significant consequences for biological communities occurring in this region. Numerous endangered mammal species occur in this area including bowhead and the highly depleted North Pacific right whales and other whale species. Critical habitat for right whales (National Oceanic and Atmospheric Administration [NOAA], 2008) and conservation zones for the endangered Steller sea lion (Eumatopis jubatus) has been established in this area (National Oceanic and Atmospheric Administration [NOAA], 1993). Therefore, east-west vessel traffic near the Aleutian Islands likely rivals or exceeds the threat of ship strikes of endangered marine mammals from the relatively smaller amount of traffic on north-south trips through the Bering Strait and Bering Sea. As such, inter-continental vessel routes near the Aleutian Islands should also be candidates for imposing conservation measures to minimize impacts to marine mammals and sensitive ecosystems near the archipelago.
Oil Spill Contingency Planning
At this time, planning and preparation for a major oil/chemical spill in Arctic waters is inadequate. Cognizant of the deficiencies, several Arctic nations have met jointly or attempted independently to increase response and remediation readiness. Fortified and double-hulled tankers are routinely in use by oil companies and subsidiaries as a safeguard against spills. However, existing contingencies for such an event are almost certainly insufficient. International bodies such as the Arctic Council (Arctic Monitoring and Assessment Programme [AMAP], 2008; Arctic Council, 2009) and the IMO have highlighted and attempted to address these shortcomings. These efforts are commended, should be continued or accelerated, and where feasible, resources provided to prepare for the occurrence of a spill of significant magnitude.
Conclusion
Vessel operations were extensive in volume and diverse in the types (e.g., long-range shipping, fishing) and location of activity. The observed already substantial maritime activity is projected to increase. Our study period was too brief to demonstrate significant growth in maritime activities; instead, inter-annual variation prevailed. While receding ice coverages have created new opportunities for increased use of these waters, expansion of Arctic maritime traffic may not be tied solely to receding amounts of ice-covered waters. Decisions regarding utilization of new or expanded routes are likely to be a function of logistical and economic factors.
Vessel traffic volume is somewhat limited in some areas. However, maritime transport operations will likely experience the greatest growth in locations undergoing the most rapid increases in seasonally ice-free zones, which includes water bodies along the Northern Sea Route and the Northwest Passages. Increased use of these locations will be driven by assessments of economic feasibility weighed against inherent risks to hazardous high-latitude travel. These boundaries are currently being tested with real trials (both with and without ice breaker assistance) in locations with historically limited access. Cost/benefit ratios will shift with global demand for certain goods and resources (e.g., oil), and logistical costs may diminish as needs for ice-breaker assistance is diminished. A modest growth of the tourist cruise industry occurred during our study and will likely undergo additional growth as certain destinations become increasingly accessible. Commercial fisheries operations, including those engaged in stern trawler fisheries, are largely year-round in many locations and spatially vast primarily in the lower latitudes. By volume alone, these industries may have the greatest overall impact (e.g., bycatch, disruption of benthic communities) to Artic marine biological processes. Therefore, considerations regarding ecosystem protection should include direct and indirect impacts from fishing activities.
Exact threats to Arctic marine ecosystems are not known with certainty especially as related to population levels impacts. However, increased use of this region by trans-Arctic shipment of goods, oil/gas exploration and other commercial enterprises is accompanied by concurrent risks to Arctic ecosystems. Limited supporting infrastructures and constraints of response capabilities in the case of a large oil spill suggest existing protective measures are probably inadequate and should be strengthened. AIS data have been used to support maritime security, vessel traffic monitoring, and regulatory functions. Coupled with baseline descriptions of the volume and spatial distribution of Arctic-wide commercial activities, the AIS can aid in characterizing trends in Arctic vessel operations and assessing potential threats to Arctic marine ecosystems. Only through monitoring of trends in vessel activities, particularly those areas where growth is most likely to occur, will assessments of impacts be possible. As understanding of maritime activity levels and concurrent environmental impacts improves, so should a strengthening of ecosystem protection measures.
Data Availability
All datasets generated for this study are included in the manuscript and/or the supplementary files.
Author Contributions
GS and JA helped to build the NOAA Fisheries AIS program, jointly conceived this analytical project, and worked collaboratively to complete it. JA conducted most of the data analysis. GS prepared most of the text.
Funding
Funding was not received specifically for this work. Instead, the Office of Protected Resources, National Marine Fisheries Service provided programmatic funds in support of the development and maintenance of the AIS data program and partial salary support during data analysis.
Conflict of Interest Statement
The authors declare that the research was conducted in the absence of any commercial or financial relationships that could be construed as a potential conflict of interest.
Acknowledgments
We thank Kam Chin and David Phinney of the Department of Transportation’s John A. Volpe National Transportation Systems Center for providing Automatic Identification System data, and without whom this study would not have been possible. We are grateful to NOAA Fisheries’ Office of Protected Resources for providing the work environment to conduct this work.
Footnotes
- ^ https://www.fisheries.noaa.gov/resource/document/technical-memorandum-2015-vessel-activity-arctic
- ^ https://www.volpe.dot.gov/
- ^ https://www.arcgis.com/home/item.html?id=44e04407fbaf4d93afcb63018fbca9e2
- ^ http://www.imo.org/en/MediaCentre/MeetingSummaries/MSC/Pages/MSC-100th-session.aspx
References
Adams, J. D., and Silber, G. K. (2017). 2015 Vessel Activity in the Arctic. U.S. Dep. Commer., NOAA. NOAA Technical Memorandum NMFS-OPR-57. Silver Spring, MD: National Oceanic and Atmospheric Administration.
Afenyo, M., Khan, F., Veitch, B., and Yang, M. (2017). A probabilistic ecological risk model for arctic marine oil spills. J. Environ. Chem. Eng. 5, 1494–1503. doi: 10.1016/j.marpolbul.2016.08.064
Allen, A. S. (2014). The development of ships× routeing measures in the bering strait: lessons learned from the North Atlantic right whale to protect local whale populations. Mar. Pol. 50, 215–226. doi: 10.1016/j.marpol.2014.05.019
Arctic Council (2009). Arctic Marine Shipping Assessment 2009. Report. Publication of the Arctic Council’s Protection of the Marine Environment Committee, April 2009. Tromsø: Arctic Council.
Arctic Monitoring and Assessment Programme [AMAP] (2008). Arctic Oil and Gas 2007. Oslo, Norway, 40. Available at: https://www.amap.no/documents/doc/arctic-oil-and-gas-2007/71
Boé, J., Hall, A., and Qu, X. (2009). September sea-ice cover in the arctic ocean projected to vanish by 2100. Nat. Geosci. 2, 341–343. doi: 10.1038/ngeo467
Breivik, O. N., Storvik, G. O., and Nedreaas, K. H. (2017). Latent gaussian models to predict historical bycatch in commercial fishery. Fish. Res. 185, 62–72. doi: 10.1016/j.fishres.2016.09.033
Buixadé Farré, A., Stephenson, S. R., Chen, L., Czub, M., Dai, Y., Demchev, D., et al. (2014). Commercial arctic shipping through the northeast passage: routes, resources, governance, technology, and infrastructure. Polar Geogr. 37, 298–324. doi: 10.1080/1088937x.2014.965769
Bureau of Ocean Energy Management [BOEM] (2018). Final Environmental Impact Statement, Liberty Development and Production Plan Beaufort Sea, Alaska. Alaska Outer Continental Shelf OCS EIS/EA BOEM 2018-050. Washington, DC: Bureau of Ocean Energy Management.
Burns, D., and Poe, A. (2014). Marine Vessel Traffic in the Aleutians. Aleutian Islands Working Group. Available at: https://aleutianislandsworkinggroup.wordpress.com/2014/09/09/marine-vessel-traffic-in-the-aleutians/ (accessed September 9, 2014).
Christiansen, J. S., Mecklenburg, C. W., and Karamushko, O. V. (2014). Arctic marine fishes and their fisheries in light of global change. Global Change Biol. 20, 352–359. doi: 10.1111/gcb.12395
Congressional Research Service [CRS] (2018). Changes in the Arctic: Background and Issues for Congress. Report to Congress 7-5700 R41153. Washigton, DC.
Cooke, J. G., and Clapham, P. J. (2018). Eubalaena Japonica. Moscow: The IUCN Red List of Threatened Species 2018.
Corbett, J. J., Lack, D. A., Winebrake, J. J., Harder, S., Silberman, J. A., and Gold, M. (2010). Arctic shipping emissions inventories and future scenarios. Atmospheric Chem. Phys. 10, 9689–9704. doi: 10.5194/acp-10-9689-2010
Corkhill, M. (2018). LNG-Powered Bulk Carriers Make Northern Sea Route Delivery Voyages. LNG Port Info. https://www.lngworldshipping.com/news/view,lngpowered-bulk-carriers-make-northern-sea-route-delivery-voyages_54325.htm (accessed Sep 24, 2018).
Dalaklis, D., and Baxevani, E. (2017). “Maritime routes in the arctic: examining the level of traffic and port capabilities along the northern sea route,” in Oceans’ Yearbook 31, eds A. Chircop, S. Coffen-Smout, and M. McConnell (Leiden: Brill Nijhoff), 06–35. doi: 10.1163/9789004347137_006
Dalaklis, D., Baxevani, E., and Siousiouras, P. (2018). The future of arctic shipping business and the positive influence of the international code for ships operating in polar waters. J. Ocean Tech. 13, 77–94.
Dalsøren, S. B., Endresen, Ø, Isaksen, I. S. A., Gravir, G., and Sørgård, E. (2007). Environmental impacts of the expected increase in sea transportation, with a particular focus on oil and gas scenarios for Norway and northwest Russia. J. Geophys. Res. 112:D02310. doi: 10.1029/2005JD006927
Dennis, B., and Mooney, C. (2016). A Luxury Cruise Ship Sets Sail for the Arctic, Thanks to Climate Change. Available at: https://www.washingtonpost.com/news/energy-environment/wp/2016/08/16/a-luxury-cruise-ship-sets-sail-for-the-arctic-thanks-to-climate-change/?utm_term=.b6636b164437 (accessed August 16, 2016).
Eguíluz, V. M., Fernández-Gracia, J., Irigoien, X., and Duarte, C. M. (2016). A quantitative assessment of Arctic shipping in 2010–2014. Sci. Repts. 6:30682. doi: 10.1038/srep30682
Eurasia Group (2014). Opportunities and Challenges for Arctic Oil and Gas Development. Technical Report OTC-24586-MS. New York, NY.
Food and Agriculture Organization of the United Nations [FAO] (2011). Fishery and Aquaculture Country Profiles. Norway. Country Profile Fact Sheets. In: FAO Fisheries and Aquaculture Department. Rome. Available at: http://www.fao.org/fishery/ (accessed January 1, 2011).
Fossheim, M., Primicerio, R., Johannesen, E., Ingvaldsen, R. B., Aschan, M. M., and Dolgov, A. V. (2015). Recent warming leads to a rapid borealization of fish communities in the arctic. 223 nature clim. Change 5, 673–677. doi: 10.1038/nclimate2647
Fournet, M. E., Matthews, L. P., Gabriele, C. M., Haver, S., Mellinger, D., and Klinck, H. (2018). Humpback whales Megaptera novaeangliae alter calling behavior in response to natural sounds and vessel noise. Mar. Ecol. Prog. Ser. 607, 251–268. doi: 10.3354/meps12784
Friends of the Earth [FOE] (2016). Arctic Shipping Policy: What’s Wrong With This Picture?. Amsterdam: Friends of the Earth International.
Gautier, D. L., Bird, K. J., Charpentier, R. R., Grantz, A., Houseknecht, D. W., Klett, T. R., et al. (2011). Oil and gas resource potential north of the arctic circle. Geol. Soc. Mem. 35, 151–161. doi: 10.1144/M35.9
Gazprom Neft (2018). Gazprom Neft Increased Annual Oil Production on the Arctic Shelf by 18%. Saint Petersburg: Gazprom Neft.
George, J. C., Sheffield, G., Reed, D. J., Tudor, B., and Suydam, R. (2017). Evidence of injuries from line entanglements, killer whales, and ship strikes on bering-chukchi-beaufort Sea bowhead whales. Arctic 70, 37–46.
Gordon, J. C. D., Gillespie, D., Potter, J., Frantzis, A., Simmonds, M. P., Swift, R., et al. (2003). A review of the effects of seismic surveys on marine mammals. Mar. Tech. Soc. J. 37, 16–34. doi: 10.4031/002533203787536998
Guy, E. (2006). Evaluating the viability of commercial shipping in the Northwest passage. J. Ocean Tech. 1, 9–18.
Haas, C., and Howell, S. E. L. (2015). Ice thickness in the Northwest passage. Geophys. Res. Lett. 42, 7673–7680. doi: 10.1002/2015GL065704
Halliday, W. D., Insley, S. J., Hilliard, R. C., de Jong, T., and Pine, M. K. (2017). Potential impacts of shipping noise on marine mammals in the western Canadian arctic. Mar. Poll. Bull. 123, 73–82. doi: 10.1016/j.marpolbul.2017.09.027
Hamilton, J. M., Maddison, D. J., and Tol, R. S. J. (2005). Effects of climate change on international tourism. Climate Res. 29, 245–254. doi: 10.3354/cr029245
Harsem, O., Heen, K., Rodrigues, J. M. P., and Vassdal, T. (2015). Oil exploration and sea ice projections in the arctic. Polar Rec. 51, 91–106. doi: 10.1017/S0032247413000624
Haug, T., Bogstad, B., Chierici, M., Gjøsæter, H., Hallfredsson, E. H., Høines, ÅS., et al. (2017). Future harvest of living resources in the arctic ocean north of the Nordic and Barents Seas: a review of possibilities and constraints. Fish. Res. 188, 38–57. doi: 10.1016/j.fishres.2016.12.002
Hazen, T. C., Prince, R. C., and Mahmoudi, N. (2016). Marine oil biodegradation Env. Sci. Tech. 50, 2121–2129. doi: 10.1021/acs.est.5b03333
Heide-Jørgensen, M. P., Hansen, R. G., Westdal, K., Reeves, R. R., and Mosbech, A. (2013). Narwhals and seismic exploration: is seismic noise increasing the risk of ice entrapments? Biol. Cons. 158, 50–54. doi: 10.1016/j.biocon.2012.08.005
Hicken, C. E., Linbo, T. L., Baldwin, D. H., Willis, M. L., Myers, M. S., Holland, L., et al. (2011). Sublethal exposure to crude oil during embryonic development alters cardiac morphology and reduces aerobic capacity in adult fish. Proc. Natl. Acad. Sci. U.S.A. 108, 7086–7090. doi: 10.1073/pnas.1019031108
Hildebrand, J. (2009). Anthropogenic and natural sources of ambient noise in the ocean. Mar. Ecol. Prog. Ser. 395, 5–20. doi: 10.1146/annurev-marine-121211-172423
Hobson, M. K. (2018). Amid ice melt, new shipping lanes are drawn up off Alaska. Sci. Am. doi: 10.3354/meps08353
Hopkins, J. (2018). RRS James Clark Ross 30 June-8 August 2017. The Changing Arctic Cruise Report, JR16006. Cruise Report No 51. Southampton: National Oceanography Centre.
Hovem, J. M., Vagsholm, R., Sorheim, H., and Haukebo, B. (2015). “Measurements and analysis of underwater acoustic noise of fishing vessels,” in Proccedings of the Conference on OCEANS 2015, (Genova).
Humpert, M. (2014). “Arctic Shipping: an Analysis of the 2013 Northern sea route season,” in Arctic Yearbook Briefing Notes, ed. L. Heininen (Akureyri: Arctic Portal).
Humpert, M. (2016). China’s COSCO Shipping Company Expands Activities on Northern Sea Route. High North News. Available at: https://www.highnorthnews.com/en/chinas-cosco-shipping-company-expands-activities-northern-sea-route (accessed Sep 20, 2016).
Huntington, H. P., Daniel, R., Hartsig, A., Harun, K., Heiman, M., Meehan, R., et al. (2015). Vessels, risks, and rules: planning for safe shipping in bering strait. Mar. Pol. 51, 119–127. doi: 10.1016/j.marpol.2014.07.027
Ianelli, J. N., and Stram, D. L. (2014). Estimating impacts of the pollock fishery bycatch on western alaska chinook salmon. ICES J. Mar. Sci. 72, 1159–1172. doi: 10.1093/icesjms/fsu173
ICES (2017). Capelin (Mallotus villosus) in subareas 1 and 2 (Northeast Arctic), excluding Division 2.a west of 5°W (Barents Sea capelin). Copenhagen: International Council for the Exploration of the Sea.
ICES (2018). Report of the Arctic Fisheries Working Group (AFWG), 18–24 April 2018. ICES CM 2018/ACOM:06. Ispra, 859.
Ingvaldsen, R. B., Gjøsæter, H., Hallfredsson, E., Haug, T., Hosia, A., Jørgensen, L. L., et al. (2017). Cruise Report SI_ARCTIC/Arctic Ecosystem Survey R/V Helmer Hanssen, 2-16 September 2016. Available at: https://www.imr.no/filarkiv/2016/12/cruise_report_si_arctic_2015_final.pdf/nb-no
Intergovernmental Panel on Climate Change [IPCC] (2018). Global Warming of 1.5°C. An IPCC Special Report. Geneva: Intergovernmental Panel on Climate Change.
International Maritime Organization [IMO] (1988). International CONVENTION for the Prevention of Pollution From Ships (MARPOL). Annex V. London: International Maritime Organization.
International Maritime Organization [IMO] (2014). International Code for Ships Operating in Polar Waters (Polar Code). Maritime Safety Committee, 94th Session. London: International Maritime Organization.
International Maritime Organization [IMO] (2017). Establishment of Two-Way Routes and Precautionary Areas in the Bering Sea and Bering Strait. Sub-Committee on Navigation, Communications, and Search and Rescue. 5th Session. London: International Maritime Organization.
Ivanova, M. (2011). Oil spill emergency preparedness in the Russian arctic: a study of the murmansk region. Polar Res. 30:7285. doi: 10.3402/polar.v30i0.7285
Jensen, A. S., and Silber, G. K. (2003). Large Whale Ship Strike Database. U.S. Department of Commerce, NOAA Technical Memorandum, NMFS-F/OPR-25. Silver Spring, MD: National Marine Fisheries Service.
Johansson, L., Jalkanen, J.-P., and Kukkonen, J. (2017). Global assessment of shipping emissions in 2015 on a high spatial and temporal resolution. Atmospheric Env. 167, 403–415. doi: 10.1016/j.atmosenv.2017.08.042
Khon, V. C., Mokhov, I. I., Latif, M., Semenov, V. A., and Park, W. (2010). Perspectives of Northern sea route and Northwest passage in the twenty-first century. Clim. Change 100, 757–768. doi: 10.1007/s10584-009-9683-2
Kovacs, K. M., Lydersen, C., Overland, J. E., and Moore, S. E. (2011). Impacts of changing sea-ice conditions on arctic marine mammals. Mar. Biodiversity 41, 181–194. doi: 10.1007/s12526-010-0061-0
Kyhn, L. A., Wisniewska, D. M., Beedholm, K., Tougaard, J., Simon, M., Mosbech, A., et al. (2019). Basin-wide contributions to the underwater soundscape by multiple seismic surveys with implications for marine mammals in baffin bay, Greenland. Mar. Poll. Bull. 138, 474–490. doi: 10.1016/j.marpolbul.2018.11.038
Lee, T., and Kim, H. J. (2015). Barriers of voyaging on the Northern sea route: a perspective from shipping companies. Mar. Pol. 62, 264–270. doi: 10.1016/j.marpol.2015.09.006
Lindholt, L., and Glomsrød, S. (2012). The arctic: no big bonanza for the global petroleum industry. Energy Econ. 34, 1465–1474. doi: 10.1016/j.eneco.2012.06.020
Liu, M., and Kronbak, J. (2010). The potential economic viability of using the Northern sea route (NSR) as an alternative route. J. Transport Geogr. 18, 434–444. doi: 10.1016/j.jtrangeo.2009.08.004
Melia, N., Haines, K., and Hawkins, E. (2016). Sea ice decline and 21st century trans-arctic shipping routes. Geophys. Res. Lett. 43, 9720–9728. doi: 10.1002/2016GL069315
Miller, A. W., and Ruiz, G. M. (2014). Arctic shipping and marine invaders. Nat. Clim. Change 4, 413–416. doi: 10.1038/nclimate2244
Misund, O. A., Heggland, K., Skogseth, R., Falck, E., Gjøsæter, H., Sundet, J., et al. (2016). Norwegian fisheries in the svalbard zone since 1980. Regulations, profitability and warming waters affect landings. Polar Sci. 10, 312–322. doi: 10.1016/j.polar.2016.02.001
Moore, S. E., Reeves, R. R., Southall, B. L., Ragen, T. J., Suydam, R. S., and Clark, C. W. (2012). A new framework for assessing the effects of anthropogenic sound on marine mammals in a rapidly changing arctic. BioScience 62, 289–295. doi: 10.1525/bio.2012.62.3.10
National Marine Fisheries Service [NMFS] (2018). 2018 Revisions to: Technical Guidance for Assessing the Effects of Anthropogenic Sound on Marine Mammal Hearing (Version 2.0): Underwater Thresholds for Onset of Permanent and Temporary Threshold Shifts. U.S. Dept. of Commer., NOAA. NOAA Technical Memorandum NMFS-OPR-59. Silver Spring, MD.: National Marine Fisheries Service.
National Oceanic and Atmospheric Administration [NOAA] (1993). Final Rule: Designated Critical Habitat; Steller Sea Lion. U.S. Federal Register 58 FR 45269. Available at: https://cdn.loc.gov/service/ll/fedreg/fr058/fr058165/fr058165.pdf#page=47 (accessed August 27, 1993).
National Oceanic and Atmospheric Administration [NOAA] (2008). Final Rule: Designation of Critical Habitat for North Pacific Right Whale. U.S. Federal Register 73 FR 19000. Available at: https://www.federalregister.gov/ documents/2008/ 04/08 /E8 - 7233/ endangered-and-threatened-species-designation- of-critical-habitat-for-north-pacific-right-whale (accessed May 8, 2008).
National Research Council of the National Academies of Science [NRC] (2014). Responding to Oil Spills in the U.S. Arctic Marine Environment. Washington, D.C: The National Academies Press.
National Snow and Ice Data Center [NSIDC] (2018). Sea Ice Index, Version 3. Boulder, CO: National Snow and Ice Data Center.
Nevalainen, M., Helle, I., and Vanhatalo, J. (2017). Preparing for the unprecedented – towards quantitative oil risk assessment in the arctic marine areas. Mar. Poll. Bull. 114, 90–101. doi: 10.1016/j.marpolbul.2016.08.064
NOAA (2019b). State of the Climate: Global Climate Report for Annual 2018. National Centers for Environmental Information. Silver Spring, MD: National Oceanic and Atmospheric Administration.
NOAA (2019a). Sea Ice and Snow Cover Extent National Centers for Environmental Information. Silver Spring, MD: National Oceanic and Atmospheric Administration.
Nong, D., Countryman, A. M., Warziniack, T., and Grey, E. K. (2018). Arctic sea routes: potential new pathways for nonindigenous species spread. Arctic 71:4732. doi: 10.14430/arctic4732
Norwegian Petroleum Directorate (2017). 6000 Wells on the Norwegian Shelf. Available at: http://www.npd.no/en/news/News/2017/6000-wells-on-the-Norwegian-shelf/ (accessed April 4, 2017).
Norwegian Petroleum Directorate (2018). Exploration. Available at: http://www.npd.no/en/news/News/2018/The-Shelf-2017/4-Exploration/ (accessed November 1, 2018).
Nowacek, D. P., Clark, C. W., Mann, D., Miller, P. J. O., Rosenbaum, H. C., Golden, J. S., et al. (2015). Marine seismic surveys and ocean noise: time for coordinated and prudent planning. Front. Ecol. Env. 13:378–386. doi: 10.1890/130286
Ocean Conservancy (2017). Navigating the North: An Assessment of the Environmental Risks of Arctic Vessel Traffic. Anchorage, AK: Ocean Conservancy.
Offshore Technology Focus (2018). Prirazlomnoye Oilfield. Available at: https://www.offshore-technology.com/projects/prirazlomnoye/ (accessed January 23, 2019).
Overland, J., Dunlea, E., Box, J., Corell, R., Forsinus, M., Kattsov, V., et al. (2018). The urgency of arctic change. Polar Sci. (in press). doi: 10.1016/j.polar.2018.11.008
Overland, J. E., and Wang, M. (2013). When will the summer arctic be nearly sea ice free? Geophys. Res. Lett. 40, 2097–2101. doi: 10.1002/grl.50316
Peng, Z., Wang, B., Fan, J., and Zhao, K. (2017). Modeling low-frequency underwater noise radiated from a typical fishing boat based on measurement in shallow water. J. Acoust. Soc. Am. 141:3526. doi: 10.1121/1.4987435
Peters, G. P., Nilssen, T. B., Lindholt, L., Eide, M. S., Glomsrød, S., Eide, L. I., et al. (2011). Future emissions from shipping and petroleum activities in the arctic. Atmos. Chem. Phys. 11, 5305–5320. doi: 10.5194/acp-11-5305-2011
Petrick, S., Riemann-Campe, K., Hoog, S., Growitsch, C., Schwind, H., Gerdes, R., et al. (2017). Climate change, future arctic sea ice, and the competitiveness of European arctic offshore oil and gas production on world markets. Ambio 46(Suppl. 3), 410–422. doi: 10.1007/s13280-017-0957-z
Pierre, C., and Olivier, F. (2015). Relevance of the Northern sea route (NSR) for bulk shipping. Trans. Res. 78, 337–346. doi: 10.1016/j.tra.2015.05.020
Popov, S., and Zeller, D. (2018). Reconstructed Russian fisheries catches in the barents sea: 1950-2014. Front. Mar. Sci. 5:266. doi: 10.3389/fmars.2018.00266
Puig, P., Canals, M., Company, J. B., Martín, J., Amblas, D., Lastras, G., et al. (2012). Ploughing the deep sea floor. Nature 489, 286–290. doi: 10.1038/nature11410
Ragen, T. J., Huntington, H. P., and Hovelsrud, G. K. (2008). Conservation of arctic marine mammals faced with climate change. Ecol. Appl. 18, S166–S174. doi: 10.1890/06-0734.1
Raspotnik, A., and Stephen, K. (2013). Why the Northern Sea Route is Still of Limited Geo-economic Importance. Washington, DC: The Arctic Institute.
Reeves, R. R., Ewins, P. J., Agbayani, S., Heide-Jørgensen, M. P., Kovacs, K. M., Lydersen, C., et al. (2014). Distribution of endemic cetaceans in relation to hydrocarbon development and commercial shipping in a warming arctic. Mar. Pol. 44, 375–389. doi: 10.1016/j.marpol.2013.10.005
Reeves, R. R., Rosa, C., George, J. C., Sheffield, G., and Moore, M. (2012). Implications of Arctic industrial growth and strategies to mitigate future vessel and fishing gear impacts on bowhead whales. Mar. Poll. 36, 454–462. doi: 10.1016/j.marpol.2011.08.005
Renner, M., and Kuletz, K. J. (2015). A spatial-seasonal analysis of the oiling risk from shipping traffic to seabirds in the aleutian archipelago. Mar. Poll. Bull. 101, 127–136. doi: 10.1016/j.marpolbul.2015.11.007
Reuters News (2018). Maersk Sends First Container Ship Through Arctic Route. Available at: https://www.reuters.com/article/us-arctic-shipping-maersk/maersk-sends-first-container-ship-through-arctic-route-idUSKCN1L91BR (accessed August 28, 2018).
Richardson, K., Haynes, D., Talouli, A., and Donoghue, M. J. (2016). Marine pollution originating from purse seine and longline fishing vessel operations in the Western and central pacific ocean, 2003–2015. Ambio 46, 190–200. doi: 10.1007/s13280-016-0811-8
Richardson, W. J., Greene, C. R., Malme, C. I., and Thomson, D. H. (1995). Marine Mammals and Noise. San Diego: Academic Press.
Roach, A. J. (2018). “Beyond the polar code: IMO measures for assuring safe and environmentally sound arctic navigation,” in Sustainable Shipping in a Changing Arctic. WMU Studies in Maritime Affairs, eds L. Hildebrand, L. Brigham, and T. M. Johansson (Berlin: Springer).
Roiger, A., Thomas, J. -L., Schlager, H., Law, K. S., Kim, J., Schäfler, A., et al. (2015). Quantifying emerging local anthropogenic emissions in the arctic region: the ACCESS aircraft campaign experiment. Bull. Am. Meteorol. Soc. 96, 441–460. doi: 10.1175/bams-d-13-00169.1.2016.1.test
Schaps, K. (2015). Royal Dutch Shell Pulls Plug on Arctic Exploration. Reuters. Available at: https://www.reuters.com/article/us-shell-alaska/royal-dutch-shell-pulls-plug-on-arctic-exploration-iduskcn0rs0ex20150928 (accessed September 28, 2015).
Schwehr, K. D., and McGillivary, P. A. (2007). Marine Ship Automatic Identification System (AIS) for Enhanced Coastal Security Capabilities: An Oil Spill Tracking Application. Oceans 2007. Vancouver, BC: IEEE.
Seaman, T. (2017). Russia, Norway cut Barents Sea cod Quota 13%, Re-open Capelin Fishery. Undercurrent News. Available at: https://www.undercurrentnews.com/2017/10/12/russia-norway-cut-barents-sea-cod-quota-13-re-open-capelin-fishery/ (accessed October 12, 2017).
Shimeld, J., and Boggild, K. (2017). Seismic Operations Report for the 2016 Canada-Sweden Polar Expedition in the Arctic Ocean. Ottawa: Geological Survey of Canada.
Silber, G. K., Lettrich, M. D., Thomas, P. O., Baker, J. D., Baumgartner, M., Becker, E. A., et al. (2017). Projecting marine mammal distribution in a changing climate. Front. Mar. Sci. 4, 413. doi: 10.3389/fmars.2017.00413
Smith, L. C., and Stephenson, S. R. (2013). New Trans-arctic shipping routes navigable by midcentury. Proc. Natl. Acad. Sci. U.S.A. 110, E1191–E1195. doi: 10.1073/pnas.1214212110
Soldatkin, V. (2017). Russia’s Rosneft Finds Offshore Oilfield in Eastern Arctic. Available at: http://fortune.com/2017/06/18/russia-rosneft-oilfield-offshore-arctic/ (accessed June 18, 2017).
Stephenson, S. R., Brigham, L. W., and Smith, L. C. (2014). Marine accessibility along Russia’s northern sea route. Polar Geogr. 37, 111–133. doi: 10.1080/1088937x.2013.845859
Stroeve, J. C., Kattsov, V., Barrett, A., Serreze, M., Pavlova, T., Holland, M., et al. (2012). Trends in arctic sea ice extent from CMIP5, CMIP3 and observations. Geophys. Res. Lett. 39:L16502. doi: 10.1029/2012GL052676
Timco, G. W., and Frederking, R. (2009). “Historical perspectives on the 1970s and 80s beaufort sea exploration,” in Proceedings of the 20th International Conference on Port and Ocean Engineering under Arctic Conditions. 9-12 June 2009, (Luleå).
Troell, M., Eide, A., Isaksen, J., Hermansen, Ø., and Crépin, A.-S. (2017). Seafood from a changing Arctic. Ambio 46(Suppl. 3):368. doi: 10.1007/s13280-017-0954-2
U.S. Committee on the Marine Transportation System [CMTS] (2013). U.S. Arctic Marine Transportation System: Overview and Priorities for Action 2013. New Jersey, NY: Committee on the Marine Transportation System.
U.S. Global Change Research Program [USGCRP] (2017). in Climate Science Special Report: Fourth National Climate Assessment, Volume I, eds D. J. Wuebbles, D. W. Fahey, K. A. Hibbard, D. J. Dokken, B. C. Stewart, and T. K. Maycock (Washington, DC: U.S. Global Change Research Program), 470.
United States Coast Guard [USCG] (2010). Port Access Route Study: In the Bering Strait. U.S. Federal Register 75 FR 68568. Washington, DC: United States Coast Guard.
United States Coast Guard [USCG] (2014). Proposed Rule. Port Access Route Study: In the Chukchi Sea, Bering Strait and Bering Sea. U.S. Federal Register 79 FR 72157. Washington, DC: United States Coast Guard.
US Geological Survey [USGS] (2009). Circum-Arctic Resource Appraisal (North of the Arctic Circle) Assessment Units GIS Data. Reston, VA: US Geological Survey.
Vedenin, A., Gusky, M., Gebruk, A., Kremenetskaia, A., Rybakova, E., and Boetius, A. (2018). Spatial distribution of benthic macrofauna in the central arctic ocean. PLoS One 13:e0200121. doi: 10.1371/journal.pone.0200121
Vergeynst, L., Wegeberg, S., Aamand, J., Lassen, P., Gosewinkel, U., Fritt-Rasmussen, J., et al. (2018). Biodegradation of marine oil spills in the arctic with a Greenland perspective. Sci Total Environ. 626, 1243–1258. doi: 10.1016/j.scitotenv.2018.01.173
Walker, T. R., Del, M. C., Adebambo, O., and Zomorodi, S. (2018). “Environmental effects of marine transportation,” in Word Seas: An Environmental Evaluation, ed. C. Sheppard (cambridge, MA: Academic Press).
Watson, J. T., and Haynie, A. C. (2018). Paths to resilience: the walleye pollock fleet uses multiple fishing strategies to buffer against environmental change in the bering sea. Can. J. Fish. Aquatic Sci. 75, 1977–1989. doi: 10.1139/cjfas-2017-0315
Wilkinson, J., Beegle-Krause, C. J., Evers, K. U., Hughes, N., Lewis, A., Reed, M., et al. (2017). Oil spill response capabilities and technologies for ice-covered arctic marine waters: a review of recent developments and established practices. Ambio 46(Suppl. 3):423. doi: 10.1007/s13280-017-0958-y
World Maritime News (2017). Christophe de Margerie to Load 1st Yamal LNG Cargo This Week. Available at: https://worldmaritimenews.com/archives/237031/christophe-de-margerie-to-load-1st-yamal-lng-cargo-this-week/ (accessed December 8, 2017).
Yuewen, D., and Adzigbli, L. (2018). Assessing the impact of oil spills on marine organisms. J. Oceanogr. Mar. Res. 6:179. doi: 10.4172/2572-3103.1000179
Zeller, D., Booth, S., Pakhomov, E., Swartz, W., and Pauly, D. (2011). Arctic fisheries catches in Russia, USA, and Canada: baselines for neglected ecosystems. Polar Biology 34, 955–973. doi: 10.1007/s00300-010-0952-3
Zhang, Y., Meng, Q., and Zhang, L. (2016). Is the Northern sea route attractive to shipping companies? Some insights from recent ship traffic data. Mar. Pol. 73, 53–60. doi: 10.1016/j.marpol.2016.07.030
Keywords: Arctic, shipping operations, Northern Sea Route, Northwest Passage, Arctic routes, Arctic fishing, Arctic marine ecosystems, climate change
Citation: Silber GK and Adams JD (2019) Vessel Operations in the Arctic, 2015–2017. Front. Mar. Sci. 6:573. doi: 10.3389/fmars.2019.00573
Received: 26 March 2019; Accepted: 29 August 2019;
Published: 18 September 2019.
Edited by:
David Peel, Commonwealth Scientific and Industrial Research Organisation (CSIRO), AustraliaReviewed by:
Susana Perera-Valderrama, National Commission for the Knowledge and Use of Biodiversity (CONABIO), MexicoJessica Helen Ford, Commonwealth Scientific and Industrial Research Organisation (CSIRO), Australia
Copyright © 2019 Silber and Adams. This is an open-access article distributed under the terms of the Creative Commons Attribution License (CC BY). The use, distribution or reproduction in other forums is permitted, provided the original author(s) and the copyright owner(s) are credited and that the original publication in this journal is cited, in accordance with accepted academic practice. No use, distribution or reproduction is permitted which does not comply with these terms.
*Correspondence: Gregory K. Silber, R3JlZ1NpbGJlcjJAZ21haWwuY29t