- 1Cascadia Research Collective, Olympia, WA, United States
- 2Department of Biology, Hopkins Marine Station, Stanford University, Pacific Grove, CA, United States
- 3Scripps Institution of Oceanography, La Jolla, CA, United States
- 4Southall Environmental Associates, Aptos, CA, United States
- 5Institute of Marine Sciences, University of California, Santa Cruz, Santa Cruz, CA, United States
We examine the dive and movement behavior of blue, fin, and humpback whales along the US West Coast in regions with high ship traffic where ship strikes have been identified as a major concern. All three species are known to feed in coastal waters near areas of high ship traffic. We analyzed data from 33 archival tag deployments representing over 3,000 h of data that were attached with suction-cups or short darts for periods >20 h and recorded depth (≥ 1 Hz), fast-lock GPS positions and other sensors. There were clear differences among the three species but all showed a distinct diurnal difference in diving behavior. While dive depth varied among animals based on where prey was located, whales spent a high proportion of their time closer to the surface where they would be more vulnerable to ship strikes at night than in the day. This was most pronounced for blue whales where vulnerability was twice as high at night compared to the day. We also found differences in movement patterns of whales between day and night. Movements were more localized to specific areas in the day near prey resources while at night these movements often involved directional movements (though sometimes returning to the same area). We show how in several specific areas like the Santa Barbara Channel, these differences in movements and locations translate to a very different overlap with shipping lanes at night compared to the daytime locations, which is the basis for most sighting data.
Introduction
Ship strikes of larges whales have become a growing concern in many areas around the world (Panigada et al., 2006; Williams and O’Hara, 2010; Silber et al., 2012b). Along the US West Coast concern became more acute after several periods with elevated ship strikes. This included at least four fin whale ship strikes documented in the Pacific Northwest in 2002 (Douglas et al., 2008), and at least four blue whales documented struck by ships off southern California in Fall 2007 (Berman-Kowalewski et al., 2009). A number of species have been documented struck by ships along the US West Coast, and concern has focused on blue, fin, and humpback whales that often feed in coastal waters, including in areas of high vessel traffic near the routes of ships coming and going from the major ports of Los Angeles/Long Beach, San Francisco Bay, and the Salish Sea (Calambokidis and Barlow, 2004; Calambokidis et al., 2004, 2015; Redfern et al., 2013; Douglas et al., 2014; Dransfield et al., 2014; Rockwood et al., 2017). While reported numbers of ship strikes have been of concern, these likely dramatically under-represent the true number of ship strikes occurring due to the low proportion of strikes documented or carcasses recovered (Williams et al., 2011; Rockwood et al., 2017).
Although this problem has been known for many years, solutions have proved challenging though some options have been put into place. Changes in shipping lanes have been successful in reducing overlap between areas of highest ship traffic and whale concentrations including in the major lanes off the US West Coast (Segee, 2010; Redfern et al., 2013). Vessel speed restrictions have been applied in a number of areas based on both the reduced lethality of strikes of ships going slower and the better potential for whales to avoid slower ships (Conn and Silber, 2013). Other strategies including voluntary ship slowdowns (McKenna et al., 2012) or use of acoustic alarms (Nowacek et al., 2004) have been shown to be ineffective or of limited use.
Scientific data on whale behavior and distribution has been important to evaluating strategies for reducing ship strikes but has also had some key limitations. Data on whale distribution including habitat models in most regions including the US West Coast has come primarily from sighting data based on surveys (Redfern et al., 2013; Becker et al., 2014; Calambokidis et al., 2015) which are based on daytime sighting data only. Some strategies that might help reduce ship strikes are only possible in daylight (avoidance based on visual sightings for example) and vulnerability of whales between day and night are important to understand for evaluation of mitigation strategies.
Data from tags attached to whales can provide new more detailed information on whale behavior and movements (Calambokidis et al., 2008; Johnson et al., 2009; Goldbogen et al., 2013a, 2014; Cade et al., 2016) including insights into diel differences in feeding behavior (Friedlaender et al., 2009). Tags attached to whales have provided important information on whale behavior in response to close approach of ships (McKenna et al., 2015), and alarm sounds to warn whales of ship approach (Nowacek et al., 2004), as well as other types of anthropogenic sounds like Navy sonar (Southall et al., 2012, 2019; Goldbogen et al., 2013b). Tags have also provided new information on whale distribution and movements including implications for ship strike risk (Irvine et al., 2014; Abrahms et al., 2019). Position and movement data from tags have faced some key limitations, however, with longer-term satellite tags not providing very frequent or accurate positions due to bandwidth limitations uploading data to satellites. Archival tags can record more frequent higher quality GPS positions but are limited to short durations due to the need to recover the tag and attachment limitations. These tradeoffs are beginning to be bridged with new tag developments including with archival tags making use of short darts to achieve longer duration attachment periods than could generally be achieved with suction cups (Szesciorka et al., 2016). The combination of longer duration, high resolution position information, and detailed dive behavior (especially as it related to behaviors like time near surface or reaction to ships) is needed to better assess vulnerability to ship strikes.
We use deployments from longer duration archival tags that fully sampled day and night periods to examine differences in day and night diving and movement of three baleen whale species in the eastern North Pacific and evaluate these differences in the context of risk of ship strikes.
Methods
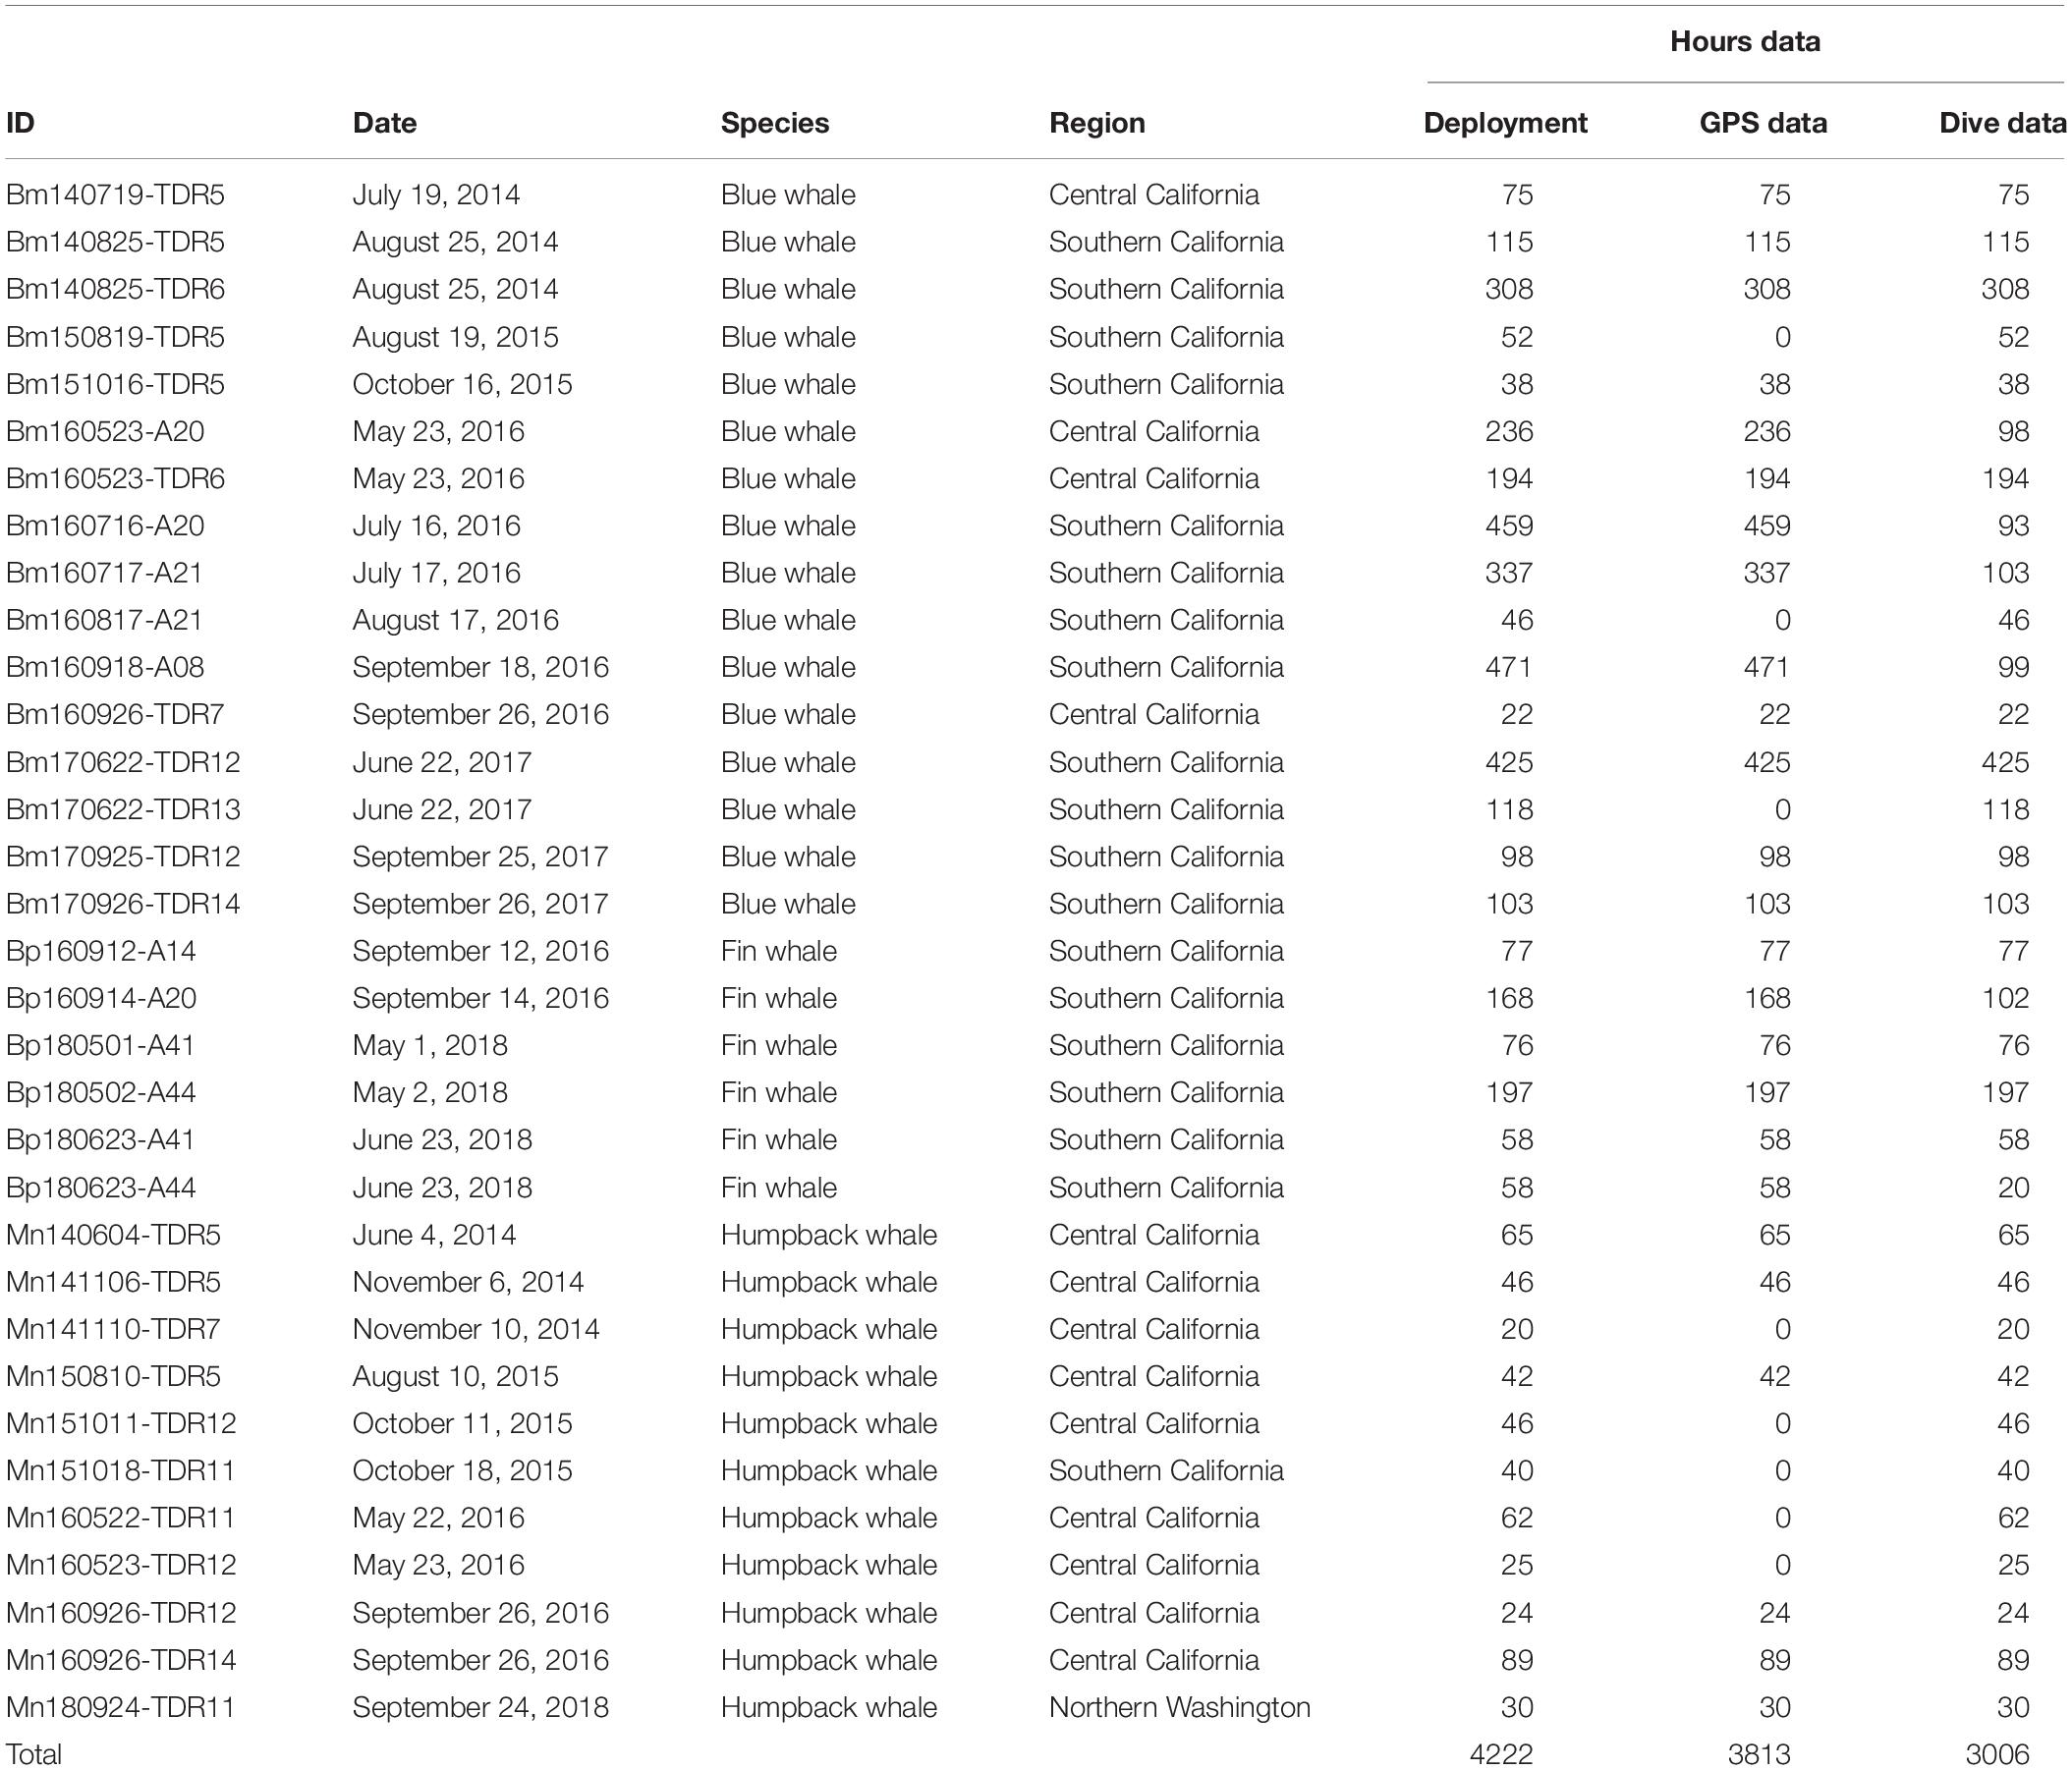
We have been conducting tag deployments in the eastern North Pacific along the US West Coast on blue, fin, and humpback whales using a variety of archival tags since the 1990s. For this study, we used only deployments that had at least 20 continuous hours of dive data along with high quality positions from an onboard GPS so that each tag obtained representative samples of both day and night behavior. Tags used in this study consisted of two primary tag designs:
• Wildlife Computers TDR10-F tag - Depth, Temperature, Light-level, Fastloc® GPS, and in most configurations with 3D accelerometers. The tag was modified to take a plate with darts and a satellite transmitter.
• Acousonde acoustic tag – miniature, self-contained, autonomous acoustic/ultrasonic recorder incorporating hydrophones as well as depth, attitude and orientation sensors, digital recording electronics, data storage, and battery with modified attachment plate with darts, satellite transmitter, Sirtrack FastGPS, and custom-made syntactic floatation.
Tag deployments were conducted from small 6–7 m Rigid Hull Inflatable Boats (RHIBs) equipped with a bow pulpit for a tagger to stand and use a 3–4 m pole to attach tags. Tags were attached with 3–4 stainless steel darts 4–6 cm long equipped with 1–2 rows of petals (Szesciorka et al., 2016). Tags were recovered after they detached from the animal and floated to the surface with the aid of an Argos satellite transmitter, which provided rough position as well as when tags had detached from the whales (based on the number and quality of positions) and a VHF transmitter that was used to localize on tags with a directional antenna. Tagging procedures were conducted under authority of a scientific research permit under the Marine Mammal Protection Act and Endangered Species Act and procedures were reviewed and approved by an Institutional Animal Care and Use Committee in conformance with the Animal Welfare Act.
Tags were deployed in a number of locations along the US West Coast with most frequent deployments in the: (1) Southern California Bight (primarily near the Palos Verdes Peninsula and in the Santa Barbara Channel) and (2) Gulf of the Farallones off San Francisco Bay in central/northern California (Figure 1). These are the areas of highest ship vessel traffic along the US West Coast corresponding to the routes to and from the ports of Los Angeles/Long Beach and those in San Francisco Bay (Rockwood et al., 2017). For this analysis we focused on data gathered along the US West Coast between 32.5 and 48.5 N latitude (tag deployments on 7 additional blue whales that were tagged in this region but migrated south outside of it were not included in this analysis).
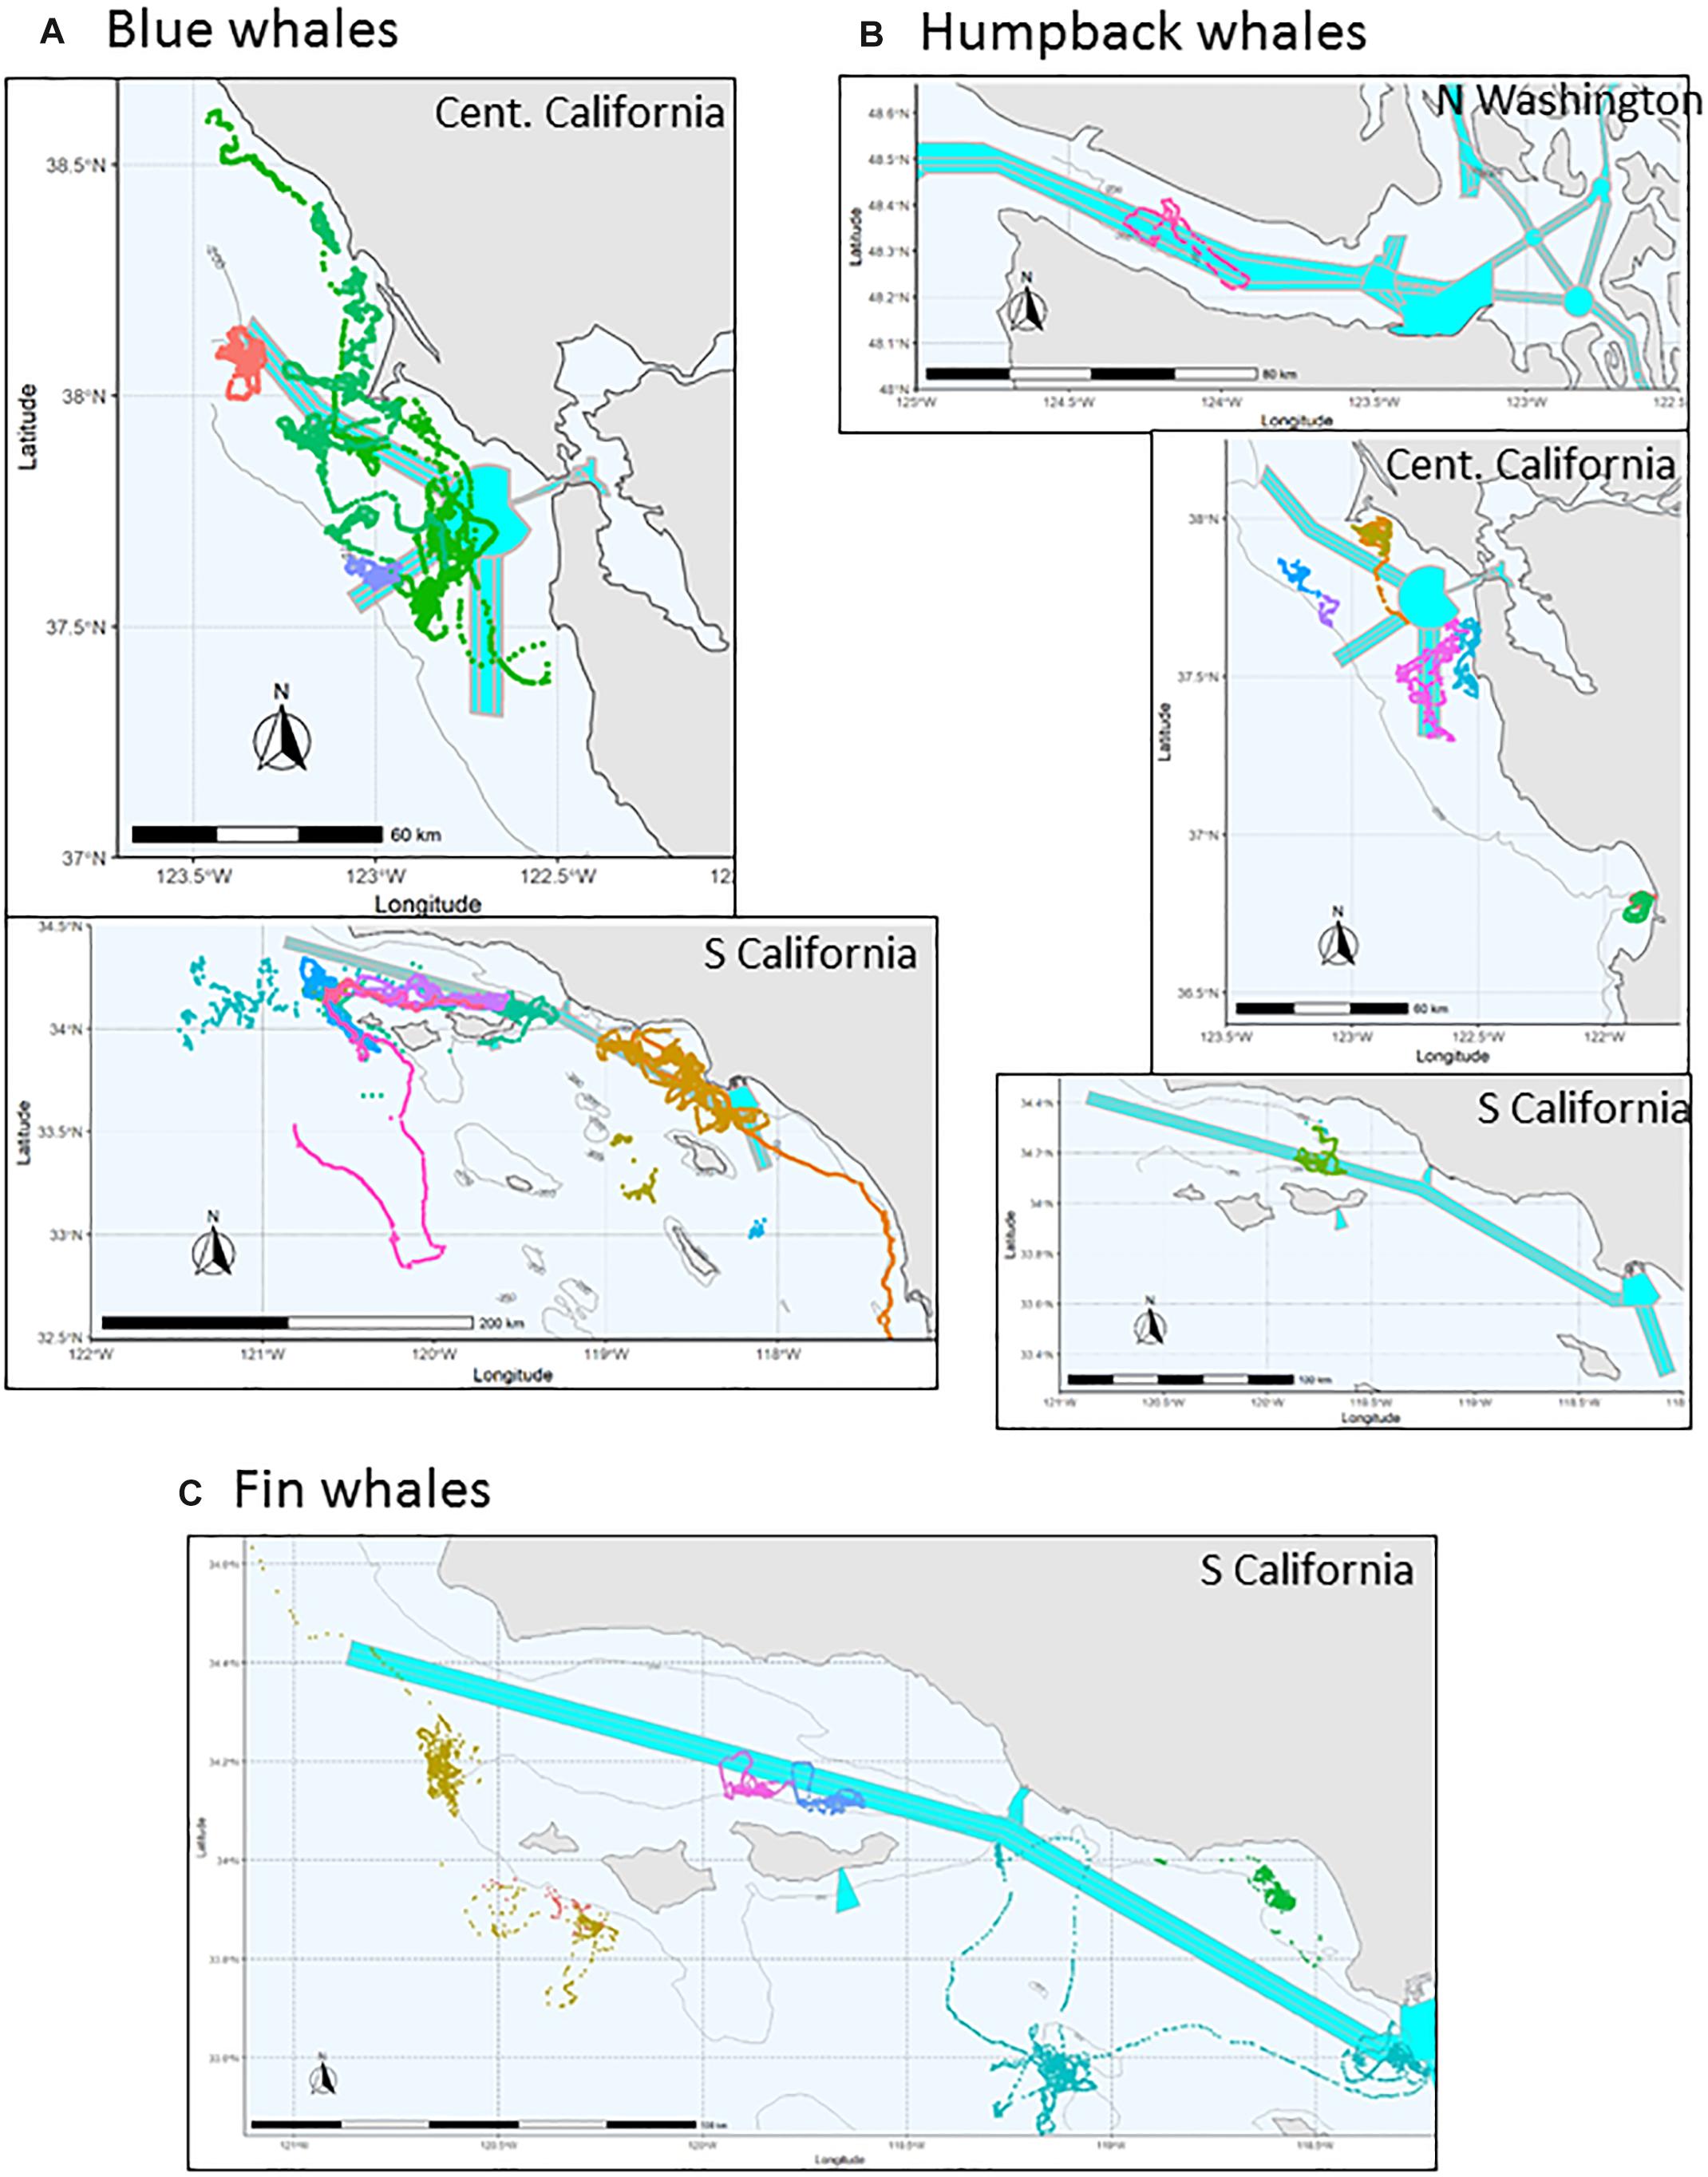
Figure 1. Map of position tracks by species (color coded by deployment) for tag deployments used in this analysis. (A) Blue whale, (B) Humpback whale, and (C) Fin whale.
Data on whale diving behavior and movements were assigned a diel period category (Day, Night, Astronomical Dusk, Astronomical Dawn) for each 24-h cycle (Cycle) according to the time of day in relation to the sun angle, which was determined from the mean GPS location of the tagged animal for each Julian day. Day was considered sunrise to sunset, the crepuscular periods around dawn and dusk were calculated as the period between sunrise/sunset time and astronomical dawn/dusk (sun −18 degrees below horizon) as calculated by NOAA for that season and position and night was the period between the astronomical dusk and dawn.
For the geographic movement analysis, we used the GPS location data from either the integrated Fastloc GPS (TDR10 tags) or Sirtrack FastGPS on the piggy-backed GPS units (on Acousonde tags) to examine differences in movement patterns of all three whale species between day and night periods (Table 3). For the examination of whale movement differences during day and night periods, we only used a period if there were continuous positions (periods were excluded if there were any gaps greater than 3 h). The remaining location data were re-discretized into a regular 15-min sampling rate using the AdehabitatLT package in R, version 0.3.23 (Calenge, 2006) for analysis. The 15-min sampling rate was selected to ensure movement metrics were not overly biased by differences in the tag determined frequency of locations which can vary by species, tag placement and animal behavior; observed intervals between positions averaged 8.9 (SD-9.3), 7.5 (SD-7.9), and 4.9 (SD-3.9) minutes and the 15-min cut-off encompassed 88, 93, and 98% of the intervals for blue, fin, and humpback whales, respectively. To determine to what degree an animal’s daytime location corresponds to that of the nighttime, we calculated the geographic centroid for the day period of each 24-h cycle, then calculated the distance of each location in that cycle from the day-time centroid. We calculated a cumulative distribution of centroid distances for day and night for each individual as well as a mean cumulative distribution weighted by individual. For comparison among species, we examined proportion of positions within 2.5 and 10 km of that centroid position.
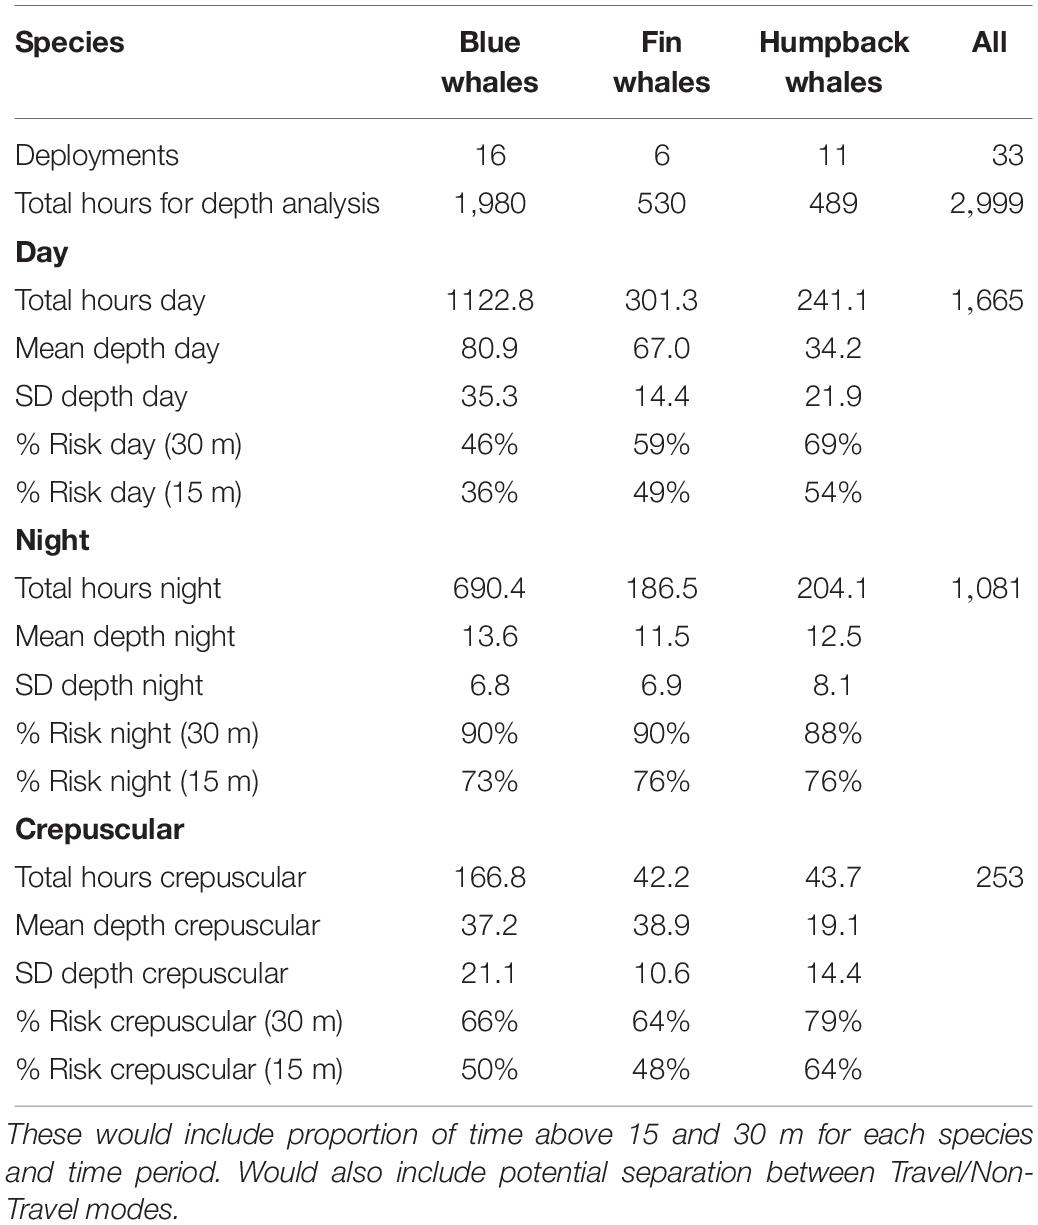
For the dive-depth analysis, we down-sampled all depth data to a common sampling rate for all tags (1 Hz) and rounded values to 0.1-m precision. All data points were assigned a period category (Day, Night, Astronomical Dusk, Astronomical Dawn). We calculated mean and standard deviation for depths for each period as well as a cumulative distribution of dive depths to examine what portion of time whales were near the surface and vulnerable to ship strikes (Table 2). For each species, we calculated a mean cumulative distribution of dive depths weighted by individual. We used nominal whale depths of 15 and 30 m as two thresholds for whale vulnerability to ship strike based on:
• Average draft of medium to larger container ships (7,000–18,000 TEU) is 14–16 and 15.2 m is the minimum depth of the expanded Panama Canal under the new Expanded Panamax Standard (Rodrigue et al., 2016).
• The overall danger zone about a moving ship appears to be about one to two times the draft vertically (Silber et al., 2010).
Results
We identified 33 deployments representing 3,000 h of data from the above tags that met our criteria of >20 h of continuous depth and position data (see Table 1 for a summary by species) off the US West Coast. There were pronounced differences in dive behavior between day and night and among species (Table 2 and Figure 2). In all three species, whales spent a greater portion of time near the surface during the night compared to the day. This difference was most pronounced in blue whales primarily because of their deeper average dive depth during the day compared to the other species (average daytime depth was 81 m for blue whales compared to 67 m for fin whales and 34 m for humpback whales). The night dive depths were similar among species with an average of 11.5–13.6 m by species.
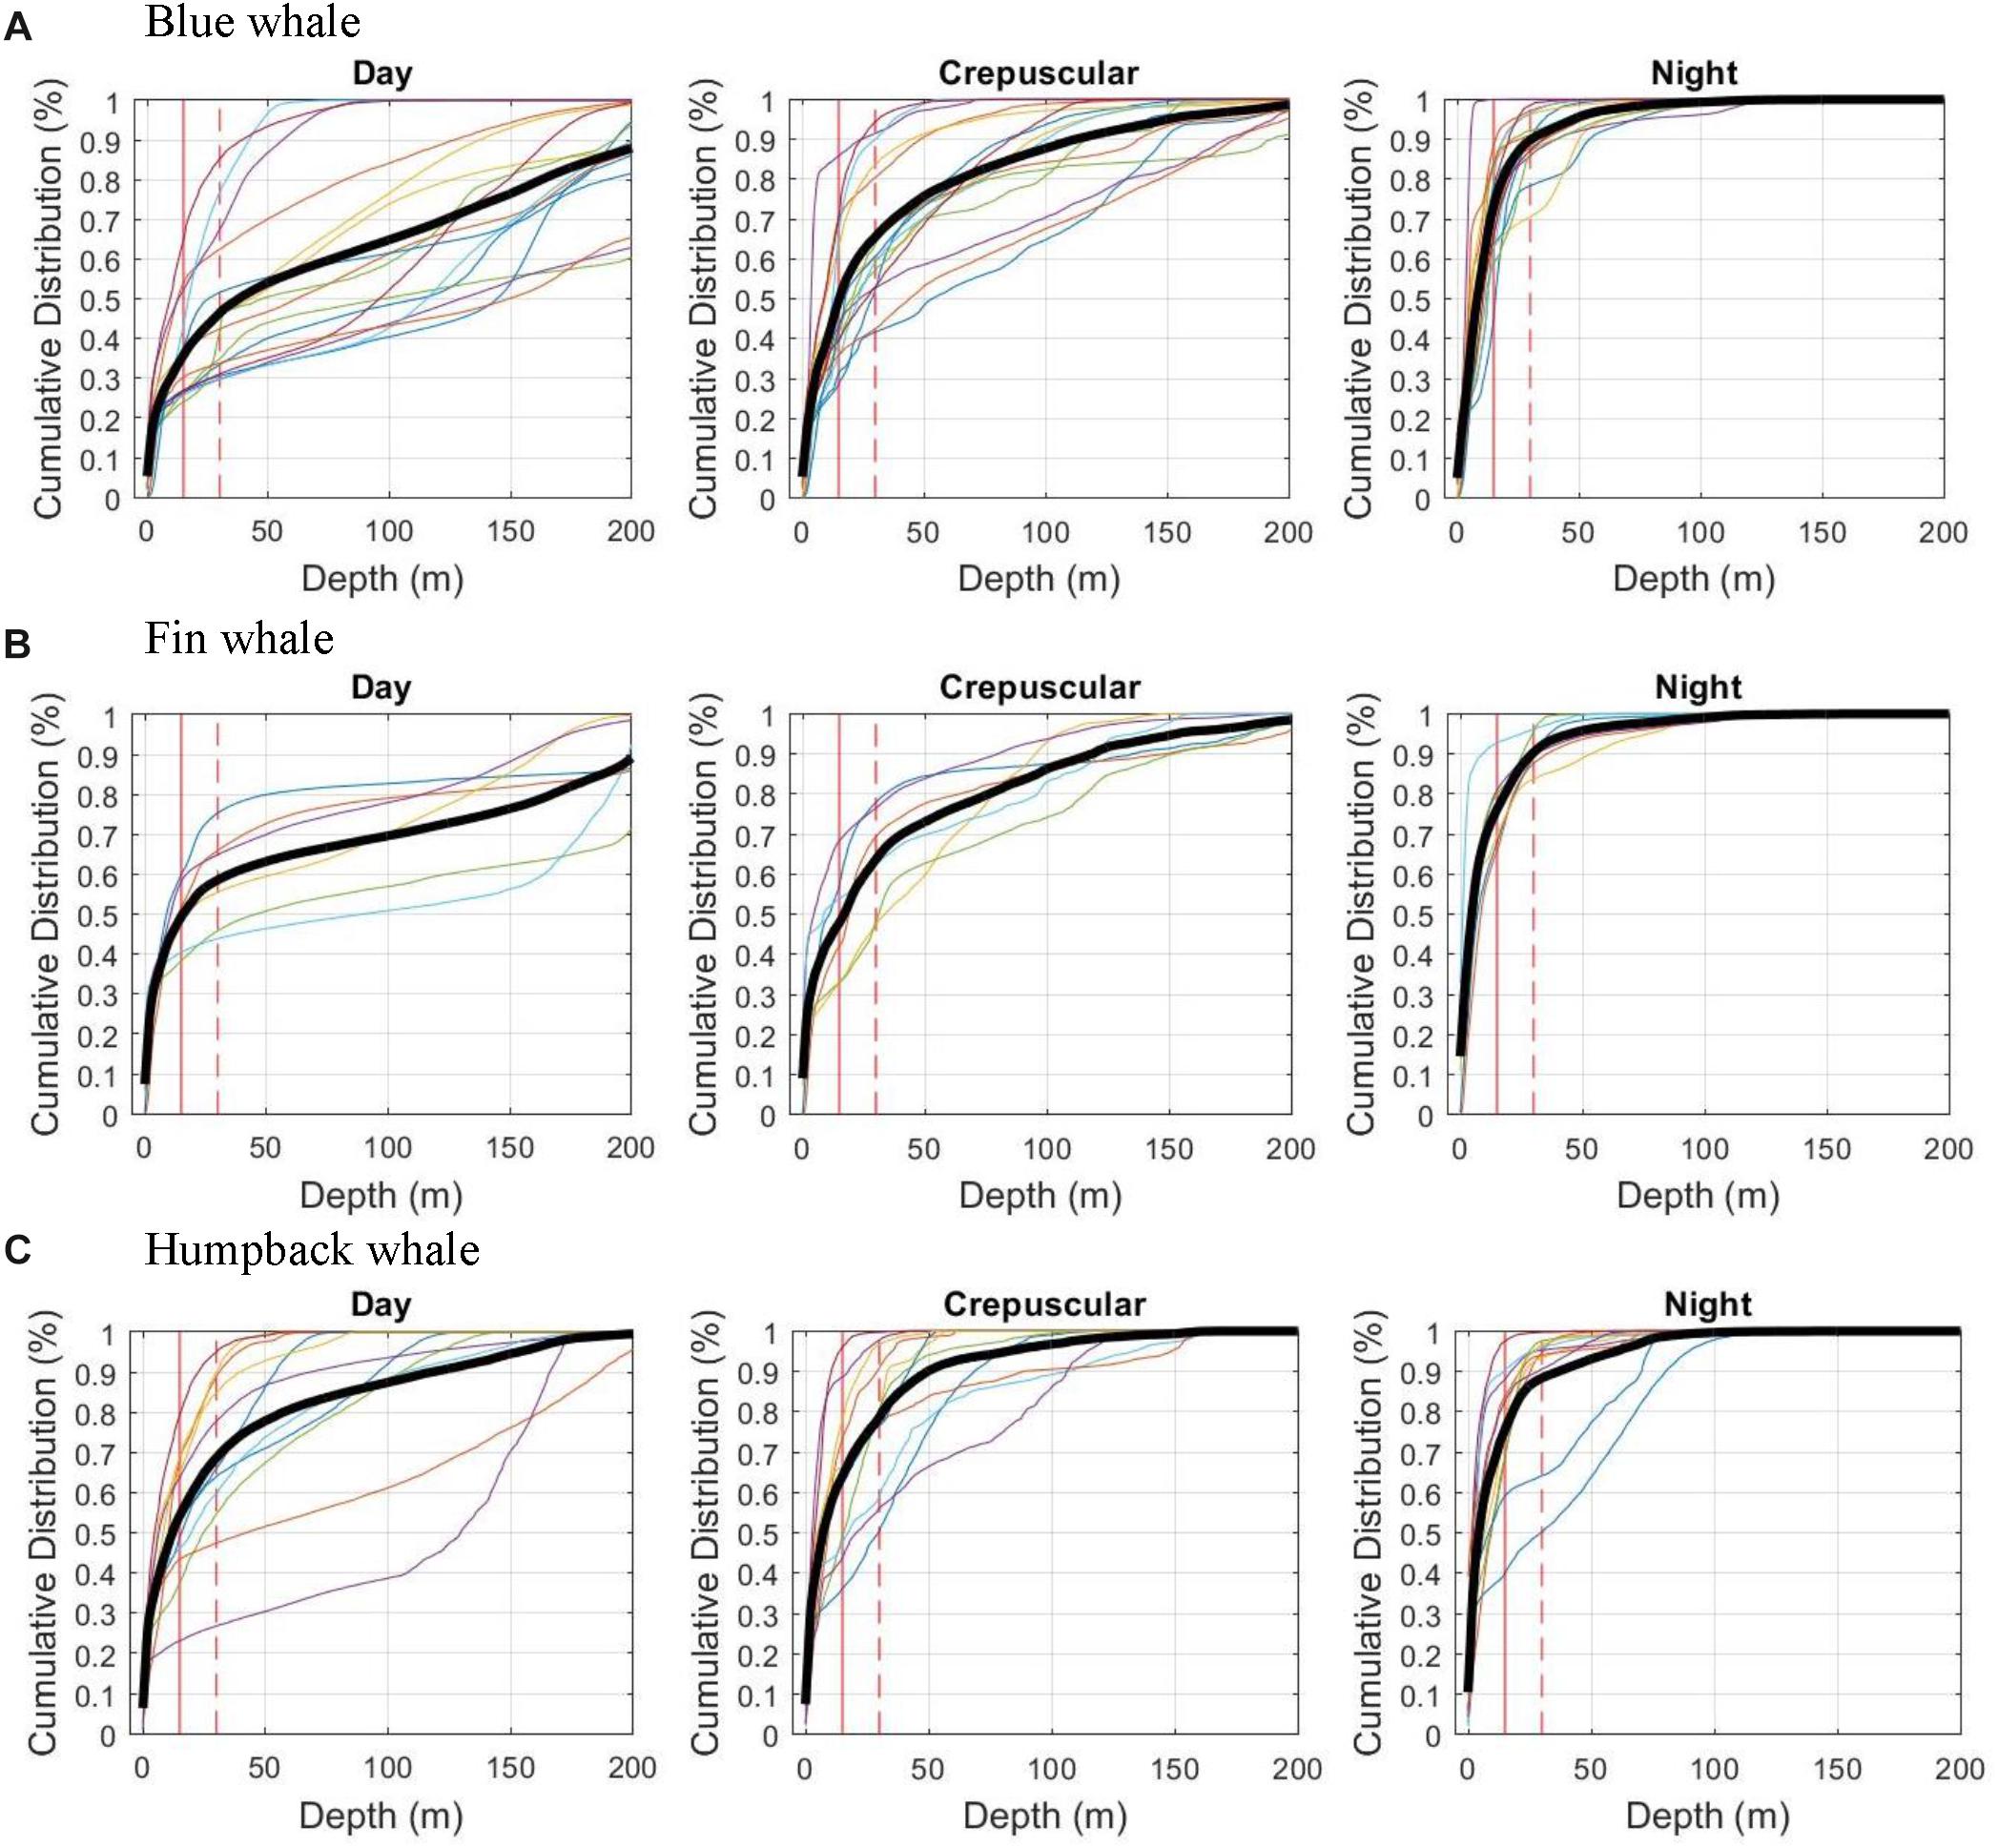
Figure 2. Cumulative time at depth and shallower by species and broken into 3 periods (day, crepuscular, and night). The 9 plots (3 species and 3 time periods) show cumulative time on Y axis and depth on X axis showing faint tracings for each individual deployment and bold tracing showing average for all deployments on that species in that time period. These represent time periods where the animal was along the US West Coast and exclude migrating animals. Average for each species/period weights each individual equally (treating long deployments with equal weight as shorter ones). Vertical lines show 15 and 30 m depths as discussed in Methods. (A) Blue whale Day Night, (B) Fin whale, and (C) Humpback whale.
These dive differences directly translated to differing proportions of time within the top 15 and 30 m zones where they would be most vulnerable to either being struck by a ship’s bow or propeller. Blue whales were twice as likely to be in the top 30-m of the water column at night compared to the day, average among the deployments of 90% versus 46% of time, respectively (Table 2 and Figure 2). This was similar for the proportion of time shallower than 15 m with 73% at night versus 36% during the day for blue whales. All three species were in the top 30 m close to 90% of the time at night, but for humpback and fin whales, the daytime average was 69 and 59%, respectively, not as great a difference as for blue whales (Table 2).
Daytime positions, typically the primary type of positions available for most data sets on whale distribution, did not very accurately reflect where whales were that night and tended to vary by species (Figure 3). While there was considerable individual variation, humpback whales tended to stay closest to the average daytime position including into the following night while blue whales tended to move farthest from these daytime positions. Positions for whales (for each 15 min period) were on average were within 5 km of the centroid position for that period (Table 3) and were generally smallest for humpback whales. On average, nighttime positions, however, were >10 km from the daytime centroid positions for blue and fin whales, indicating how daytime positions can be a poor proxy for the positions at night.
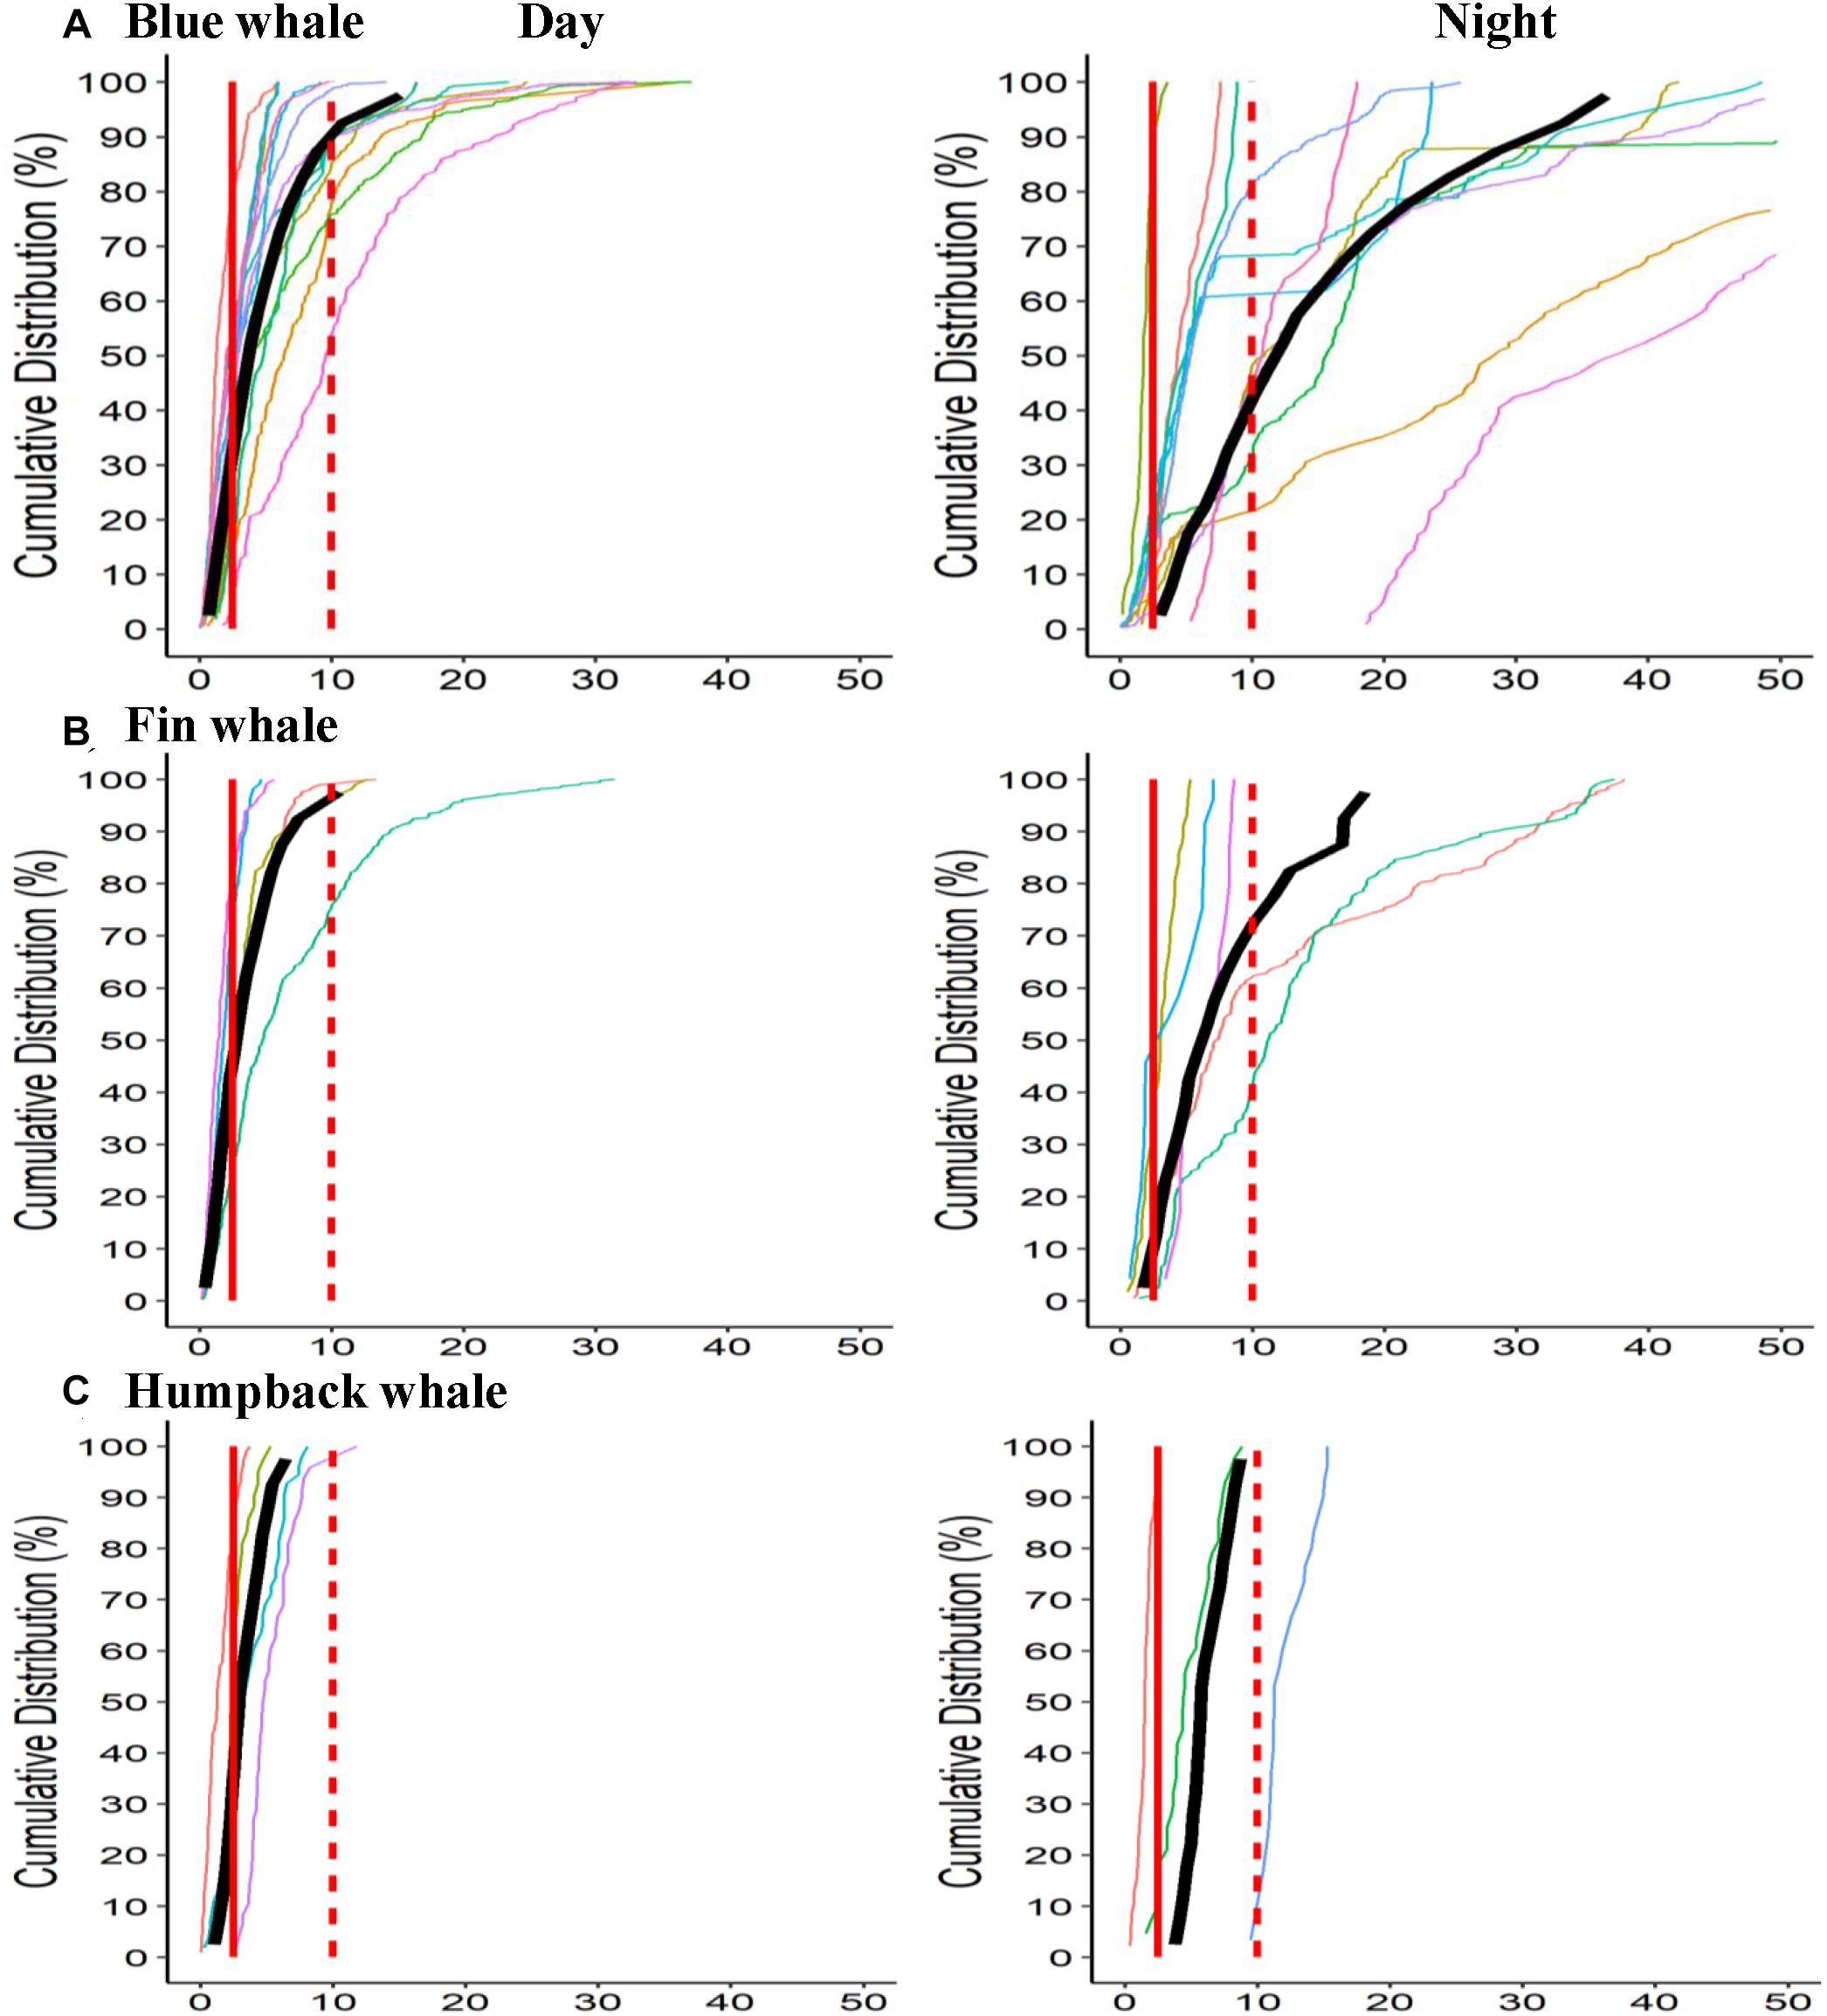
Figure 3. Cumulative distance in kilometers from daytime centroid (mean of daytime positions). Positions standardized to one every 15 min interpolating as necessary (to avoid bias in sampling rate). Plots show distance from centroid point and lines show proportion of positions within that range on the Y-axis. Vertical lines show cut offs at 2.5 and 10 km range. Individual lines show cumulative positions for all cycles in each deployment. (A) Blue whale Day Night, (B) Fin whale, and (C) Humpback whale.
There were also differences in movement patterns of all three species in the day versus night though this was more complex and complicated by sometimes fewer GPS hits during the night — likely due to the less active surfacing patterns which limited samples sizes especially for humpback whales (Table 3). For periods with good positions throughout, there was little difference in speed of movement between day and night or among species. Humpback whales stayed closer to the start position or the centroid position in both day and night compared to blue and fin whales (Table 3).
While the overall areas over which the whales moved were similar or slightly higher during the day versus at night, the daytime periods were typical 50% longer than night periods and indicated that on a time-corrected basis whales tended to travel farther from their starting point at night (Table 3). Since speeds were similar between day and night this reflected a more directed course of travel at night. This was apparent in the average change in heading from each pair of positions to the next; the mean heading change averaged 49° in the day versus 30° at night for blue whales and 51° in the day versus 35° at night for fin whales, both of which were significant different (p < 0.01) (Table 3).
This was also apparent in some of the detailed tracks for blue whales that had the largest sample of day and night movement. A typical pattern for whales that fed consistently in one area over multiple days was to perform more directed movement at night that looped to bring the whale back to the feeding area by the next morning (Figure 4). In the Santa Barbara Channel, the main daytime feeding areas for blue whales was south of the shipping lanes (Figure 5) but the range of the nighttime movements seen in the tag data regularly took them into the shipping lanes.
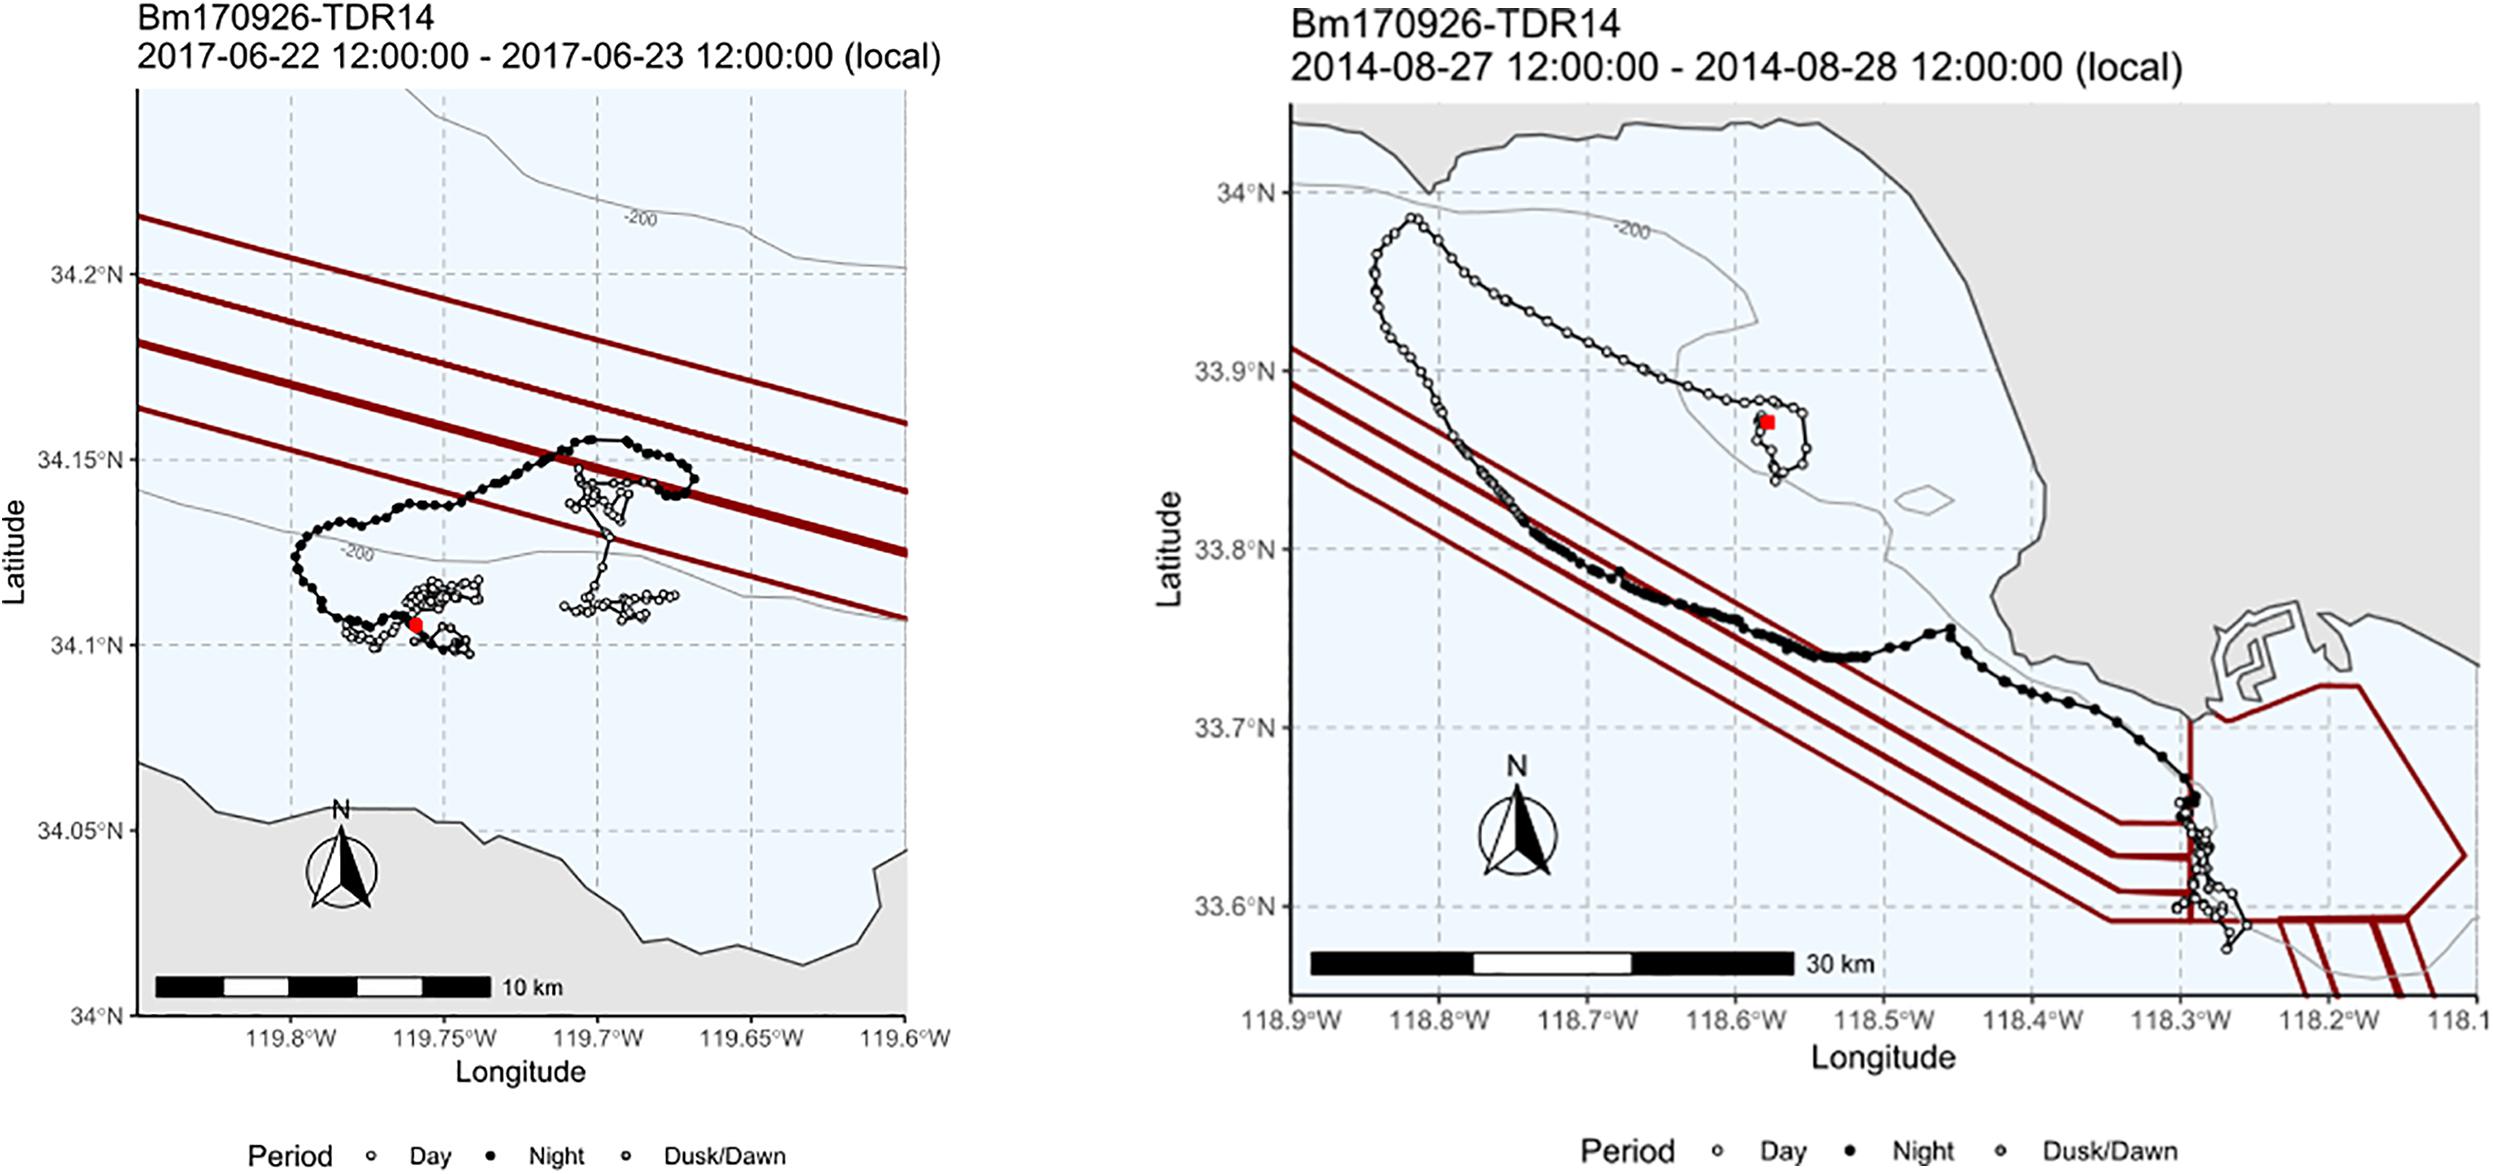
Figure 4. Two examples of tracks of blue whales covering approximate 24-h periods with daytime tracks in white and nighttime in black showing movement patterns around Southern California shipping lanes (left in Santa Barbara Channel and right off LA/Long Beach). In both cases, long looping tracks were seen at night that took whales into or out of the shipping lanes (shown in red) compared to where they were feeding in the day.
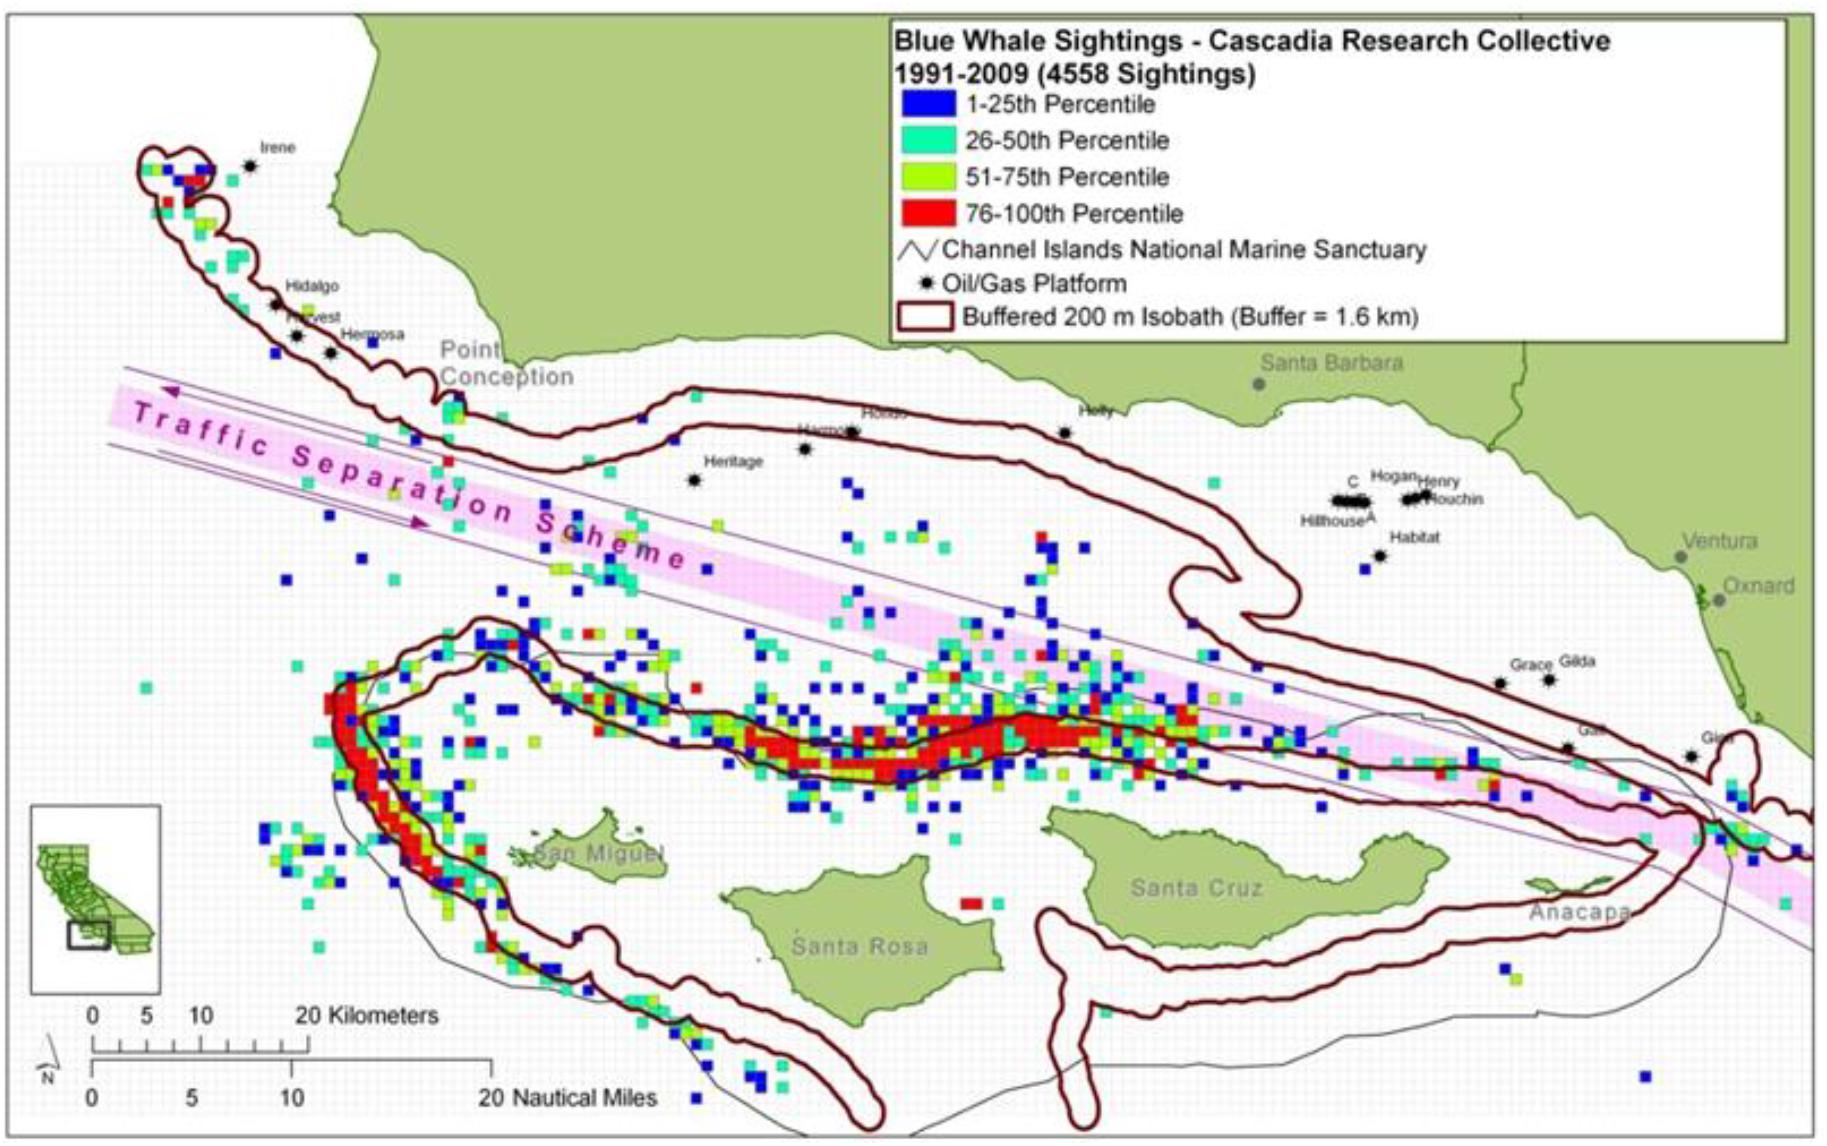
Figure 5. Blue whale daytime sighting locations from Cascadia Research non-systematic surveys 1991–2009 when high densities were seen in the Santa Barbara Channel showing high density of occurrence around 200 m isobaths and mostly south of the designated shipping lanes at that time.
Discussion
The differences between species and day versus night diving and movements have clear implications for vulnerability to ship strikes. Whales were closer to the surface almost twice as much of the time at night compared to the day and this would put them at depths where they would be in the strike zone of ships or be hit by the propeller. This was most easily seen in the day/night differences in the proportion of time within our nominal 15 and 30 m depths but this difference would hold regardless of the ship draft [15-m depth reflects the average draft of medium to larger container ships of 7,000–18,000 Twenty-foot Equivalent Unit (Rodrigue, 2017) while 30-m draft would correspond with that of some of the largest ships but could also reflect the overall danger zone about a moving ship which appears to be on the order one to two times the draft (Silber et al., 2010)].
Although the depth of the whale is important for vulnerability to ship strike, it is also influenced by when and how a whale reacts to an approaching ship. Tagged blue whales (including some of the early deployments evaluated for use in the current study) took little evasive action to the close approach of ships on near-collision courses (McKenna et al., 2015). An encounter model of the risk of ship strikes of whales off the US West Coast based on distributions of whales and ships also included dive data from some of the tag data used here (but without separation by day and night) but had to make assumptions about whale response to approaching ships to consider the probability a whale would get struck by a ship (Rockwood et al., 2017). While we do not know yet how whales might react differently to ships in the day versus the night, there is some potential for their being less reactive at night in addition to their being in a more vulnerable portion of the water column closer to the surface. The greater time whales spend farther from the surface in the day is the result of their feeding on krill prey at deeper depths (Friedlaender et al., 2014; Goldbogen et al., 2017). Humpback whales off California are more variable in their prey and switch between fish and krill depending on their relative abundance (Fleming et al., 2015). Our more anecdotal observations of whales feeding or resting at the surface including during some of the tag deployments revealed these whales are often easier to approach when surface feeding as their maneuverability is often limited due to engulfed prey, and resting whales sometimes do not react to small boat approaches. While these observations were of resting or surface-feeding whales during the day, this might also be applicable to the night when whales are most commonly near the surface and their slower reaction during the surface periods we observed could further increase their vulnerability to ship strike than we demonstrate based solely on time at depth.
A number of studies have examined broader distributions and habitat models of blue whales in the eastern North Pacific based on long duration satellite tag data and acoustic detections though these have generally been on a broader and coarser scale. Satellite tags typically provide a few positions a day based on Argos Doppler shift and the less frequent or accurate positions these types of tags provide have been used for broader scale assessments (Mate et al., 1999; Bailey et al., 2009; Hazen et al., 2017). Lagerquist et al. (2000) also provided dive information by period of day on one blue whales with a depth-recoding satellite tags off central California but this did not reveal any consistent diel patterns. Irvine et al. (2014) looked at home ranges based on tagging data and overlap with shipping lanes. None of these attempted or could look at differences in day versus night movement and positions that may not have been appropriate at the courser spatial scales of this data and the resulting models. Similarly, acoustic detections of blue whales have been used to examine timing and occurrence of whales in the eastern North Pacific (Stafford et al., 2001, 2005; Burtenshaw et al., 2004). Only some of these are able to localize calls to fine scale locations and calls do not appear to be representative of whale density since they vary by behavior, season, and sex of the calling whale (McDonald et al., 2001; Oleson et al., 2007a, b; Lewis et al., 2018).
Finer spatial scales are often critical to evaluating ship strike risk. One of the areas of highest risk of ship strikes are in the designated shipping lanes coming and going from major ports like Los Angeles/Long Beach and those in San Francisco Bay as well as transit routes for ships between ports along the US West Coast (Redfern et al., 2013; Jensen et al., 2015; Rockwood et al., 2017; Moore et al., 2018). Shipping lanes are often only 1 nmi wide and so whether whale presence overlaps with these areas requires position data on a very fine spatial scale. One change in shipping lanes in the southern California Bight that was made to reduce risk of ship strikes shifted one of the lanes only 1 nmi to get it farther from area of frequent blue whale feeding in the southern Santa Barbara Channel (Moore et al., 2018). Finer scale data on whale positions taking into account the differences in whale movements and distributions between day and night are required for more detailed assessments. In some areas like the Santa Barbara Channel, daytime positions would lead to a conclusion of limited overlap between some of the main blue whale feeding areas in the South Central Santa Barbara Channel, yet nighttime positions may involve more overlap as whales shift away from the specific areas (Figure 4). Similarly, risk may appear higher where feeding areas are concentrated in shipping lane areas during the day but are more dispersed away from those areas of overlap during the more vulnerable nighttime.
The species differences in whale shifts away from daytime positions fits both with the broader and larger movements we saw during the entire deployment durations and with other aspects of their known feeding behavior. Humpback whales which showed the most limited movements away from daytime positions are known to be fairly loyal to specific feeding areas (Baker et al., 2013; Calambokidis et al., 2015). Greater blue whale movement shifts are also consistent with their broader range of movements during the feeding season in the Eastern North Pacific (Mate et al., 1999; Calambokidis et al., 2009; Irvine et al., 2014).
The greater vulnerability of whales to ship strikes at night also has implications for management strategies to reduce ship strikes. A variety of approaches have been suggested for reducing ship strikes (Nowacek et al., 2004; Silber et al., 2012a, b; Conn and Silber, 2013; Redfern et al., 2013). Our results demonstrate that methods based on visual sightings of whales or other approaches requiring daylight would not be very effective since they would not address the primary period of whale vulnerability. Similarly, approaches to reduce ship strikes including speed or location restrictions would be most effective if they were enforced in locations when ships transit whale hot spots at night.
The use of medium-duration archival tags term has provided new insights into dive behavior and movements of whales not possible with other data sources to date. There are still challenges in use of some of this data, however. While our sample size for blue whales was fairly large, that available for humpback and fin whales was smaller and involves a limited number of individuals. Some of the parameters we report may also vary by location and season and additional deployments will be required to fully address.
Data Availability
The datasets generated for this study are available on request to the corresponding author.
Ethics Statement
Tagging procedures were conducted under authority of a scientific research permit under the Marine Mammal Protection Act and Endangered Species Act and procedures were reviewed and approved by an Institutional Animal Care and Use Committee in conformance with the Animal Welfare Act.
Author Contributions
JC drafted the manuscript. JC, JF, AS, BS, DC, AF, and JG reviewed and edited the manuscript, and collected the data. JC and JF analyzed the data.
Funding
A number of different funding sources helped to support some of the tag deployments used in this study including the Office of Naval Research (Under Grants N00014-13-1-0772 and N00014-14-1-0414), the Office of Naval Operations/Living Marine Resources (N39430-16-C-1853 and N39430-15-C-1692), and NOAA (Under Grant NA16NMF4720061 through WDFW and support from Channel Islands NM Sanctuary).
Conflict of Interest Statement
The authors declare that the research was conducted in the absence of any commercial or financial relationships that could be construed as a potential conflict of interest.
Acknowledgments
Megan McKenna and Erin Oleson contributed to previous research exploring initial aspects of this question. Ana Širović at Scripps Institution of Oceanography and Steve Jeffries at WDFW were PIs on some of the funding sources mentioned above. We thank the Channel Island National Marine Sanctuary and the crew of their vessel Shearwater that assisted in some of the field effort. We also thank the field personnel in the latter years of the SOCAL Behavioral Response Study who assisted with some of the tag deployments and supporting elements of the field studies that included some of the tag deployments used in this study. Nathan Harrison helped to prepare some of the tag components used in this study.
References
Abrahms, B., Welch, H., Brodie, S., Jacox, M., Becker, E., Bograd, S. J., et al. (2019). Dynamic ensemble models to predict distributions and anthropogenic risk exposure for highly mobile species. Divers. Distrib. 25, 1182–1193. doi: 10.1111/ddi.12940
Bailey, H., Mate, B. R., Palacios, D. M., Irvine, L., Bograd, S. J., and Costa, D. P. (2009). Behavioural estimation of blue whale movements in the Northeast Pacific from state-space model analysis of satellite tracks. Endanger. Species Res. 10, 93–106. doi: 10.3354/esr00239
Baker, C. S., Steel, D., Calambokidis, J., Falcone, E. A., Gozález-Peral, U., Barlow, J., et al. (2013). Strong maternal fidelity and natal philopatry shape genetic structure in North Pacific humpback whales. Mar. Ecol. Prog. Ser. 494, 291–306. doi: 10.3354/meps10508
Becker, E. A., Forney, K. A., Foley, D. G., Smith, R. C., Moore, T. J., and Barlow, J. (2014). Predicting seasonal density patterns of California cetaceans based on habitat models. Endanger. Species Res. 23, 1–22. doi: 10.3354/esr00548
Berman-Kowalewski, M., Gulland, F. M. D., Wilkin, S., Calambokidis, J., Mate, B., Cordaro, J., et al. (2009). Association between Blue Whale (Balaenoptera musculus) mortality and ship strikes along the California Coast. Aquat. Mammals 36, 59–66. doi: 10.1578/am.36.1.2010.59
Burtenshaw, J. C., Oleson, E. M., Hildebrand, J. A., McDonald, M. A., Andrew, R. K., Howe, B. M., et al. (2004). Acoustic and satellite remote sensing of blue whale seasonality and habitat in the Northeast Pacific. Deep Sea Res. Part II Top. Stud. Oceanogr. 51, 967–986. doi: 10.1016/j.dsr2.2004.06.020
Cade, D. E., Friedlaender, A. S., Calambokidis, J., and Goldbogen, J. A. (2016). Kinematic diversity in rorqual feeding mechanisms. Curr. Biol. 26, 2617–2624. doi: 10.1016/j.cub.2016.07.037
Calambokidis, J., and Barlow, J. (2004). Abundance of blue and humpback whales in the eastern North Pacific estimated by capture-recapture and line-transect methods. Mar. Mammal Sci. 20, 63–85. doi: 10.1111/j.1748-7692.2004.tb01141.x
Calambokidis, J., Barlow, J., Ford, J. K. B., Chandler, T. E., and Douglas, A. B. (2009). Insights into the population structure of blue whales in the eastern North Pacific from recent sightings and photographic identifications. Mar. Mammal Sci. 25, 816–832. doi: 10.1111/j.1748-7692.2009.00298.x
Calambokidis, J., Schorr, G. S., Steiger, G. H., Francis, J., Bakhtiari, M., Marshall, G., et al. (2008). Insights into the underwater diving, feeding, and calling behavior of blue whales from a suction-cup attached video-imaging tag (Crittercam). Mar. Technol. Soc. J. 41, 15–25.
Calambokidis, J., Steiger, G. H., Curtice, C., Harrison, J., Ferguson, M. C., Becker, E., et al. (2015). Biologically important areas for selected Cetaceans within U.S. Waters – West Coast Region. Aquat. Mammals 41, 39–53. doi: 10.1578/AM.41.1.2015.39
Calambokidis, J., Steiger, G. H., Ellifrit, D. K., Troutman, B. L., and Bowlby, C. E. (2004). Distribution and abundance of humpback whales and other marine mammals off the northern Washington coast. Fish. Bull. 102, 563–580.
Calenge, C. (2006). The package adehabitat for the R software: a tool for the analysis of space and habitat use by animals. Ecol. Modell. 197, 516–519. doi: 10.1016/j.ecolmodel.2006.03.017
Conn, P. B., and Silber, G. K. (2013). Vessel speed restrictions reduce risk of collision-related mortality for North Atlantic right whales. Ecosphere 4, 1–16. doi: 10.1111/j.1523-1739.2009.01329.x
Douglas, A. B., Calambokidis, J., Munger, L. M., Soldevilla, M. S., Ferguson, M. C., Havron, A. M., et al. (2014). Seasonal distribution and abundance of cetaceans off southern California estimated from CalCOFI cruise data from 2004 to 2008. Fish. Bull. 112, 197–220. doi: 10.7755/FB.112.2-3.7
Douglas, A. B., Calambokidis, J., Raverty, S., Jeffries, S. J., Lambourn, D. M., and Norman, S. A. (2008). Incidence of ship strikes of large whales in Washington State. J. Mar. Biol. Assoc. United Kingdom 88, 1121–1132. doi: 10.1017/s0025315408000295
Dransfield, A., Hines, E., McGowan, J., Holzman, B., Nur, N., Elliott, M., et al. (2014). Where the whales are: using habitat modeling to support changes in shipping regulations within National Marine Sanctuaries in Central California. Endanger. Species Res. 26, 39–57. doi: 10.3354/esr00627
Fleming, A. H., Clark, C. T., Calambokidis, J., and Barlow, J. (2015). Humpback whale diets respond to variance in ocean climate and ecosystem conditions in the California Current. Glob. Change Biol. 22, 1214–1224. doi: 10.1111/gcb.13171
Friedlaender, A. S., Goldbogen, J. A., Hazen, E. L., Calambokidis, J., and Southall, B. L. (2014). Feeding performance of sympatric blue and fin whales exploiting a common prey resource. Mar. Mammal Sci. 31, 345–354. doi: 10.111/mms.12134
Friedlaender, A. S., Hazen, E. L., Nowacek, D. P., Halpin, P. N., Ware, C., Weinrich, M. T., et al. (2009). Diel changes in humpback whale Megaptera novaeangliae feeding behavior in response to sand lance Ammodytes spp. behavior and distribution. Mar. Ecol. Prog. Ser. 395, 91–100. doi: 10.3354/meps08003
Goldbogen, J. A., Cade, D. E., Calambokidis, J., Friedlaender, A. S., Potvin, J., Segre, P. S., et al. (2017). How Baleen Whales feed: the biomechanics of engulfment and filtration. Annu. Rev. Mar. Sci. 9, 367–386. doi: 10.1146/annurev-marine-122414-033905
Goldbogen, J. A., Friedlaender, A. S., Calambokidis, J., McKenna, M. F., Simon, M., and Nowacek, D. P. (2013a). Integrative approaches to the study of baleen whale diving behavior, feeding performance, and foraging ecology. BioScience 63, 90–100. doi: 10.1525/bio.2013.63.2.5
Goldbogen, J. A., Southall, B. L., DeRuiter, S. L., Calambokidis, J., Friedlaender, A. S., Hazen, E. L., et al. (2013b). Blue whales respond to simulated mifrequency military sonar. Proc. R. Soc. B. 280:20130657. doi: 10.1098/rspb.2013.0657
Goldbogen, J. A., Stimpert, A. K., DeRuiter, S. L., Calambokidis, J., Friedlaender, A. S., Schorr, G. S., et al. (2014). Using accelerometers to determine the calling behavior of tagged baleen whales. J. Exp. Biol. 217, 1–7. doi: 10.1242/jeb.103259
Hazen, E. L., Palacios, D. M., Forney, K. A., Howell, E. A., Becker, E., Hoover, A. L., et al. (2017). WhaleWatch: a dynamic management tool for predicting blue whale density in the California Current. J. Appl. Ecol. 54, 1415–1428. doi: 10.1111/1365-2664.12820
Irvine, L. M., Mate, B. R., Winsor, M. H., Palacios, D. M., Bograd, S. J., Costa, D. P., et al. (2014). Spatial and temporal occurrence of blue whales off the US West Coast, with implications for management. PLoS One 9:e102959. doi: 10.1371/journal.pone.0102959
Jensen, C. M., Hines, E., Holzman, B. A., Moore, T. J., Jahncke, J., and Redfern, J. V. (2015). Spatial and temporal variability in shipping traffic off San Francisco, California. Coast. Manag. 43, 575–588. doi: 10.1080/08920753.2015.1086947
Johnson, M., de Soto, N. A., and Madsen, P. T. (2009). Studying the behaviour and sensory ecology of marine mammals using acoustic recording tags: a review. Mar. Ecol. Prog. Ser. 395, 55–73. doi: 10.3354/meps08255
Lagerquist, B. A., Stafford, K. M., and Mate, B. R. (2000). Dive characteristics of satellite-monitored blue whales (Balaenoptera musculus) off the central California coast. Mar. Mammal Sci. 16, 375–391. doi: 10.1111/j.1748-7692.2000.tb00931.x
Lewis, L. A., Calambokidis, J., Stimpert, A. K., Fahlbusch, J., Friedlaender, A. S., McKenna, M. F., et al. (2018). Context-dependent variability in blue whale acoustic behaviour. R. Soc. Open Sci. 5:180241. doi: 10.1098/rsos.180241
Mate, B. R., Lagerquist, B. A., and Calambokidis, J. (1999). Movements of North Pacific blue whales during the feeding season off southern California and their southern fall migration. Mar. Mammal Sci. 15, 1246–1257. doi: 10.1111/j.1748-7692.1999.tb00888.x
McDonald, M. A., Calambokidis, J., Teranishi, A. M., and Hildebrand, J. A. (2001). The acoustic calls of blue whales off California with gender data. J. Acoust. Soc. Am. 109, 1728–1735. doi: 10.1121/1.1353593
McKenna, M. F., Calambokidis, J., Oleson, E. M., Laist, D. W., and Goldbogen, J. A. (2015). Simultaneous tracking of blue whales and large ships demonstrates limited behavioral responses for avoiding collision. Endanger. Species Res. 27, 219–232. doi: 10.3354/esr00666
McKenna, M. F., Katz, S. L., Condit, C., and Walbridge, S. (2012). Response of commercial ships to a voluntary speed reduction measure: are voluntary strategies adequate for mitigating ship-strike risk? Coast. Manag. 40, 634–650. doi: 10.1080/08920753.2012.727749
Moore, T. J., Redfern, J. V., Carver, M., Hastings, S., Adams, J. D., and Silber, G. K. (2018). Exploring ship traffic variability off California. Ocean Coast. Manag. 163, 515–527. doi: 10.1016/j.ocecoaman.2018.03.010
Nowacek, D. P., Johnson, M. P., and Tyack, P. L. (2004). North Atlantic right whales (Eubalaena glacialis) ignore ships but respond to alerting stimuli. Proc. R. Soc. Lond. Ser. B Biol. Sci. 271, 227–231. doi: 10.1098/rspb.2003.2570
Oleson, E. M., Calambokidis, J., Barlow, J., and Hildebrand, J. A. (2007a). Blue whale visual and acoustic encounter rates in the Southern California Bight. Mar. Mammal Sci. 23, 574–597. doi: 10.1111/j.1748-7692.2007.02303.x
Oleson, E. M., Calambokidis, J., Burgess, W. C., McDonald, M. A., LeDuc, C. A., and Hildebrand, J. A. (2007b). Behavioral context of call production by eastern North Pacific blue whales. Mar. Ecol. Prog. Ser. 330, 269–284. doi: 10.3354/meps330269
Panigada, S., Pesante, G., Zanardelli, M., Capoulade, F., Gannier, A., and Weinrich, M. T. (2006). Mediterranean fin whales at risk from fatal ship strikes. Mar. Pollut. Bull. 52, 1287–1298. doi: 10.1016/j.marpolbul.2006.03.014
Redfern, J. V., McKenna, M. F., Moore, T. J., Calambokidis, J., Deangelis, M. L., Becker, E. A., et al. (2013). Assessing the risk of ships striking large whales in marine spatial planning. Conserv. Biol. 27, 292–302. doi: 10.1111/cobi.12029
Rockwood, R. C., Calambokidis, J., and Jahncke, J. (2017). High mortality of blue, humpback and fin whales from modeling of vessel collisions on the U.S. West Coast suggests population impacts and insufficient protection. PLoS One 12:e0183052. doi: 10.1371/journal.pone.0183052
Rodrigue, J. P. (2017). “Ports and maritime technology,” in Handbook on Geographies of Technology, ed. B. Warf, (Cheltenham: Edward Elgar Publishing, Inc), 254. doi: 10.4337/9781785361166.00026
Rodrigue, J. P., Comtois, C., and Slack, B. (2016). The Geography of Transport Systems. Abingdon: Routledge.
Segee, B. P. (2010). Whale of opportunity: coast guard study of Los Angeles/long beach port access routes holds great potential for reducing ship strikes within Santa Barbara Channel. Ecol. L. Curr. 37:58.
Silber, G. K., Slutsky, J., and Bettridge, S. (2010). Hydrodynamics of a ship/whale collision. J. Exp. Mar. Biol. Ecol. 391, 10–19. doi: 10.1016/j.jembe.2010.05.013
Silber, G. K., Adams, J. D., and Bettridge, S. (2012a). Vessel operator response to a voluntary measure for reducing collisions with whales. Endanger. Species Res. 17, 245–254. doi: 10.3354/esr00434
Silber, G. K., Vanderlaan, A. S., Arceredillo, A. T., Johnson, L., Taggart, C. T., Brown, M. W., et al. (2012b). The role of the International maritime organization in reducing vessel threat to whales: process, options, action and effectiveness. Mar. Policy 36, 1221–1233. doi: 10.1016/j.marpol.2012.03.008
Southall, B. L., DeRuiter, S. L., Friedlaender, A., Stimpert, A. K., Goldbogen, J. A., Hazen, E., et al. (2019). Behavioral responses of individual blue whales (Balaenoptera musculus) to midfrequency military sonar. J. Exp. Biol. 222:jeb190637. doi: 10.1242/jeb.190637
Southall, B. L., Moretti, D., Abraham, B., Calambokidis, J., DeRuiter, S. L., and Tyack, P. L. (2012). Marine mammal behavioral response studies in Southern California: advances in technology and experimental methods. Mar. Technol. Soc. J. 46, 46–59.
Stafford, K. M., Moore, S. E., and Fox, C. G. (2005). Diel variation in blue whale calls recorded in the eastern tropical Pacific. Anim. Behav. 69, 951–958. doi: 10.1016/j.anbehav.2004.06.025
Stafford, K. M., Nieukirk, S. L., and Fox, C. G. (2001). Geographic and seasonal variation of blue whale calls in the North Pacific. J. Cetacean Res. Manag. 3, 65–76.
Szesciorka, A. R., Calambokidis, J., and Harvey, J. T. (2016). Testing tag attachments to increase the attachment duration of archival tags on baleen whales. Anim. Biotelem. 4, 1–12. doi: 10.1186/s40317-016-0110-y
Williams, R., Gero, S., Bejder, L., Calambokidis, J., Kraus, S. D., Lusseau, D., et al. (2011). Underestimating the damage: interpreting cetacean carcass recoveries in the context of the Deepwater Horizon/BP incident. Conserv. Lett. 4, 228–233. doi: 10.1111/j.1755-263x.2011.00168.x
Keywords: ship strike, diel differences, whale behavior, movements, archival tags
Citation: Calambokidis J, Fahlbusch JA, Szesciorka AR, Southall BL, Cade DE, Friedlaender AS and Goldbogen JA (2019) Differential Vulnerability to Ship Strikes Between Day and Night for Blue, Fin, and Humpback Whales Based on Dive and Movement Data From Medium Duration Archival Tags. Front. Mar. Sci. 6:543. doi: 10.3389/fmars.2019.00543
Received: 01 May 2019; Accepted: 19 August 2019;
Published: 13 September 2019.
Edited by:
Sara M. Maxwell, University of Washington Bothell, United StatesReviewed by:
Briana Abrahms, Southwest Fisheries Science Center (NOAA), United StatesFrancine Kershaw, Natural Resources Defense Council, United States
Copyright © 2019 Calambokidis, Fahlbusch, Szesciorka, Southall, Cade, Friedlaender and Goldbogen. This is an open-access article distributed under the terms of the Creative Commons Attribution License (CC BY). The use, distribution or reproduction in other forums is permitted, provided the original author(s) and the copyright owner(s) are credited and that the original publication in this journal is cited, in accordance with accepted academic practice. No use, distribution or reproduction is permitted which does not comply with these terms.
*Correspondence: John Calambokidis, Y2FsYW1ib2tpZGlzQGNhc2NhZGlhcmVzZWFyY2gub3Jn
 John Calambokidis
 James A. Fahlbusch
 Angela R. Szesciorka
 Brandon L. Southall
 Dave E. Cade
 Ari S. Friedlaender
 Jeremy A. Goldbogen2