 Pablo N. Trucco-Pignata1,2
 José Martín Hernández-Ayón1*
 Eduardo Santamaria-del-Angel3
 Emilio Beier4
 Laura Sánchez-Velasco5
 Victor M. Godínez6
 Orión Norzagaray1
- 1Instituto de Investigaciones Oceanológicas, Universidad Autónoma de Baja California, Ensenada, Mexico
- 2Ocean and Earth Science, National Oceanography Centre, University of Southampton, Southampton, United Kingdom
- 3Facultad de Ciencias Marinas, Universidad Autónoma de Baja California, Ensenada, Mexico
- 4CICESE, Unidad La Paz, La Paz, Mexico
- 5Departamento de Plancton y Ecología Marina, Centro Interdisciplinario de Ciencias Marinas, Instituto Politécnico Nacional, La Paz, Mexico
- 6Departamento de Oceanografía Física, CICESE, Ensenada, Mexico
As a result of anthropogenic activities, it has been predicted that the ocean will be challenged with rising temperature, increased stratification, ocean acidification, stronger more frequent tropical storms, and oxygen depletion. In the tropical Pacific off central Mexico all these phenomena are already occurring naturally, providing a laboratory from which to explore ocean biogeochemical dynamics that are predicted under future anthropogenic forcing conditions. Here, seasonally anomalous surface tropical waters were detected as a result of the developing “Godzilla El Niño 2015–2016.” The incursion of this oxygenated water modified the local structure of an intense and shallow oxygen minimum zone (OMZ), partially eroding and intensifying the oxycline while having an associated impact on the carbon maximum zone. The core of the OMZ (<4.4 μmol kg–1) was centered around 474 m, with a variant upper level between 50 and 360 m depth. Below the dominance of Tropical Surface Waters, the thickness of the oxycline varied between 10 and 325 m, with intensity values up to 11 μmol kg–1 m–1. The change in dissolved inorganic carbon (DIC) and apparent oxygen utilization yielded a molar ratio of δDIC = 0.98 × δAOU during June 2015 and of δDIC = 1.08 × δAOU for March 2016. A further decrease in the average content of DIC was observed in the carbon maximum zone for 2016. Traditionally, different explanations have been proposed to account for changing oxygen concentrations in the ocean rather than considering the interactions between multiple forcing factors. Our results highlight the significance of an episodic event like El Niño in the distribution and concentration of O2 and DIC and as a plausible mechanism of ventilation and increased oxygen availability in the upper OMZ of the tropical Pacific off central Mexico.
Introduction
Knowledge of the main hydrographic features of the northeastern tropical Pacific Ocean, spanning from the Gulf of California entrance to Panama, have been summarized by Fiedler and Talley (2006). The principal characteristics in the surface are: a warm low-salinity poleward flowing Tropical Surface Water (TSW) over a strong and shallow pycnocline, and a cool, low-salinity eastern boundary current water flowing from the north. In the subsurface, a pronounced oxygen minimum layer flows into the region, as a warm high salinity subtropical water, subducted into the thermocline primarily in the southern Subtropical Convergence (Fiedler and Talley, 2006). Afterward, this broad review is refined at a sub-basin scale by Portela et al. (2016). Focusing their analysis on the tropical Pacific off central Mexico (TPCM), the authors describe the seasonality of the water masses and the current pattern in the regional circulation scheme.
The TPCM forms part of the northern limit of one of the most extensive and intense (O2 < 20 μmol kg–1) oxygen minimum zone (OMZ) in the world (Paulmier and Ruiz-Pino, 2009; Stramma et al., 2010; Cepeda-Morales et al., 2013). Multiple studies have highlighted the role of OMZs in the biogeochemical cycles of nitrogen and sulfur (Canfield et al., 2010; Kalvelage et al., 2013), in the distribution and boundaries of pelagic ecosystems (Wishner et al., 2013; Davies et al., 2015), and as important reservoirs of inorganic carbon (Paulmier et al., 2011; Franco et al., 2014). Given increased atmospheric CO2 and thermal stratification in the ocean, OMZs have intensified and expanded (Stramma et al., 2008; Rabalais et al., 2010). Explore these zones provides a window through which to study and to understand the potential future conditions of our oceans, as well as their respective role in the climate system (Keeling and Garcia, 2002).
Our study area extends from 25.5°N in the Gulf of California, off the coasts of Baja California Sur and Sinaloa, to 18°N in front of the coasts of Nayarit and Jalisco, between 105.5 and 110°W (Figure 1). This is an oceanographically complex area in which hydrographic conditions depend on the interactions between the surrounding water masses (Portela et al., 2016), the intensity of seasonal and interannual variability (Kurczyn et al., 2012, 2013), and the prevailing mesoscale physical processes (Lavín et al., 2006; Godínez et al., 2010).
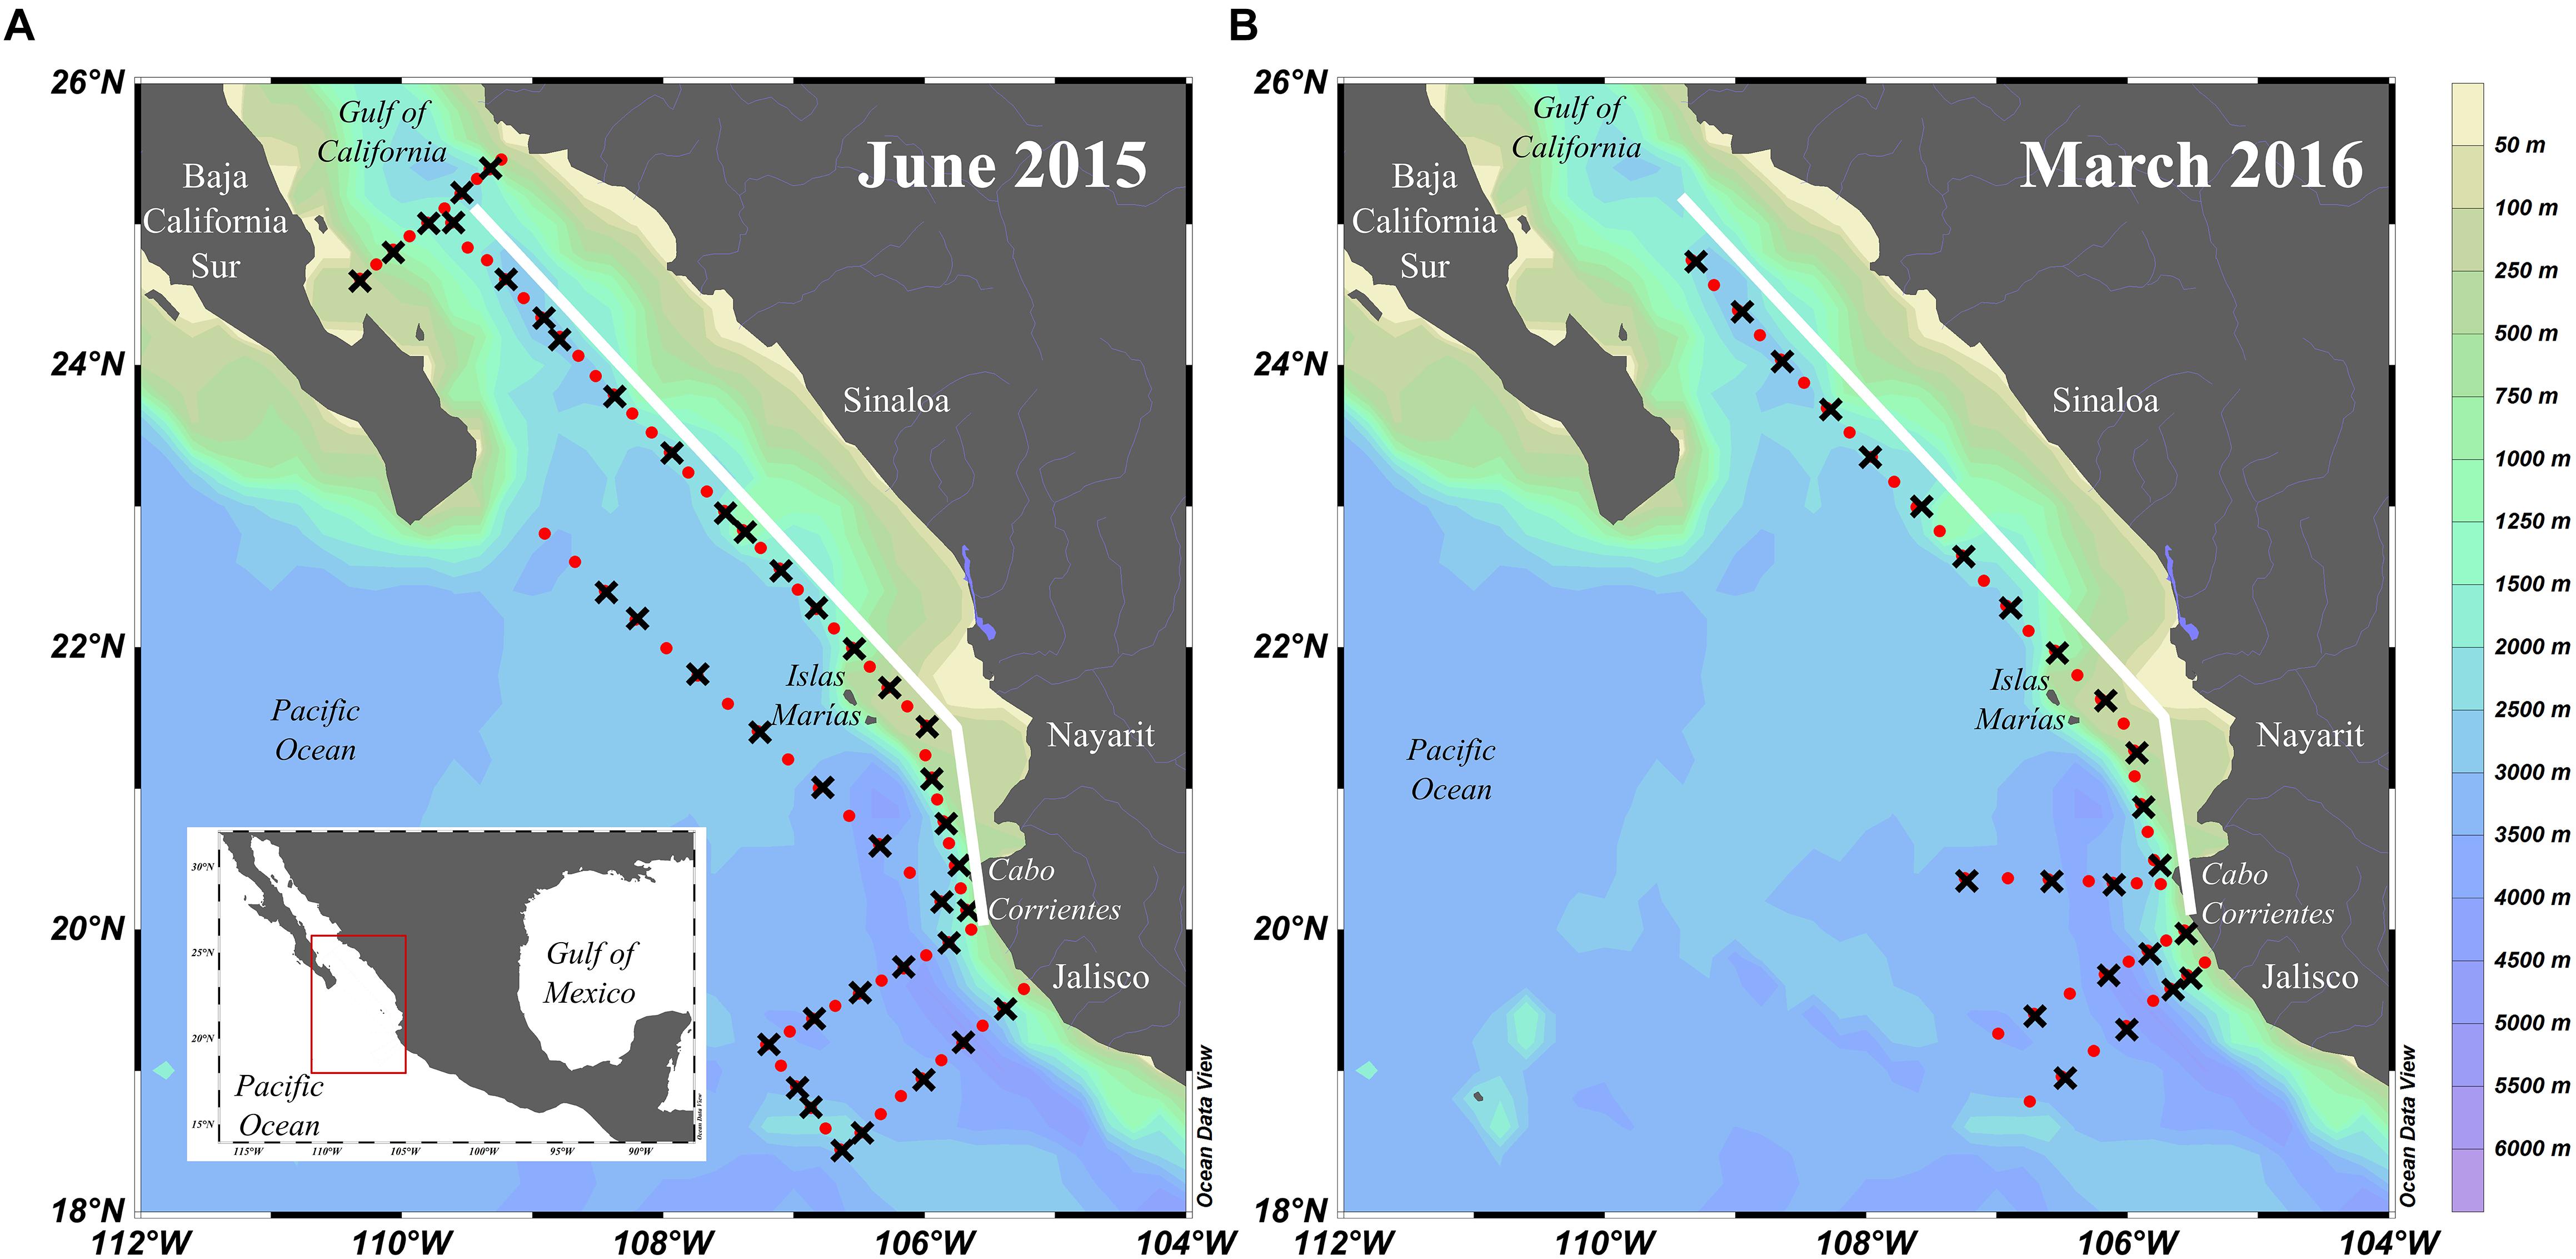
Figure 1. Hydrographic transects in the studied region over the bathymetric map. (A) June 3–16, 2015, (B) March 2–8, 2016. Black crosses depict stations with water sampling for chemical analysis, while red dots indicate only hydrographic stations. Latitudinal transect 1 appears as a white line.
In the northern region of the study area, circulation is dominated by both the entry of Transitional Water (TW) along Sinaloa and the exit of Gulf of California Water (GCW) down the peninsular side of the Gulf (Figure 1; Castro and Durazo, 2000; Kurczyn et al., 2012; Lavín et al., 2013; Portela et al., 2016). The dynamics of this area are strongly modulated by the presence of cyclonic and anticyclonic eddies (Castro et al., 2006; Lavín et al., 2009, 2013; Kurczyn et al., 2012; Collins et al., 2015), which significantly influence primary production and the distribution of the zooplankton [i.e., larval fish and squid paralarvae (Apango-Figueroa et al., 2015; Sánchez-Velasco et al., 2016)].
Off the coasts of Nayarit and Jalisco in the southern region, the water column is highly stratified and TSW dominates from the surface to 70 m depth (Franco et al., 2014). TSW is transported northward by the Mexican Coastal Current (MCC) primarily during summer and autumn, traveling over the continental platform (Gómez-Valdivia et al., 2015) while interacting and mixing with TW, GCW, and California Current Water (CCW). Due to the presence of cyclonic eddies near the tip of the Baja California peninsula, CCW is advected to the east (Lavín et al., 2009). In summary, the TPCM receives GCW in the surface layer during spring and TSW during summer and autumn (Portela et al., 2016).
The coastal oxycline is generally shallow, between 50 and 100 m depth (Fernández-Álamo and Färber-Lorda, 2006; Cepeda-Morales et al., 2009, 2013), as is the carbocline (Franco et al., 2014). These waters enriched with dissolved inorganic carbon (DIC) and low dissolved oxygen (DO) are associated with Subtropical Subsurface Water (StSsW), which dominates zonally and meridionally below the waters previously mentioned. The depth of the oxycline, along with upwelling events and cyclonic eddy pumping, can have a significant influence on the partial pressure of CO2 (pCO2) and important consequences for the estimation of ocean-atmosphere CO2 fluxes.
The overall objective of this paper is to understand the main processes that are affecting the measured distribution of DIC and DO in the upper part of the OMZ in the TPCM. Observations were performed during two contrasting temporal (seasonal) and spatial distribution on the OMZ, and during the development of an El Niño event, providing a wide range of oceanographic conditions to explore the mechanism that controls the OMZ dynamics. We started with the assumption that the distribution of DIC (determined for the first time in this region) and DO will be strongly correlated with the seasonal distribution of the different water masses (Kurczyn et al., 2012, 2013; Portela et al., 2016), each one with a particular chemical composition upon its origin and history. Our emphasis on the present study is about the repercussions of the “Godzilla El Niño 2015–2016” event on the structure of the OMZ in the TPCM, and how these oceanographic processes may concomitantly affect the distribution of the Carbon Maximum Zone (CMZ; Paulmier et al., 2011). The structure of the paper is as follows. In section “Data and Methods” we describe the sample collection methodology, measurements technics and the data analysis performed. In section “Results” we analyze the water masses distribution and their DIC and DO content, followed by a description of the vertical distribution oceanographic variables along a latitudinal transect. In section “Discussion” we discuss our observations differentiating the processes into oceanographic regions. Finally, in section “Conclusion” we summarize our findings and conclusions.
Data and Methods
Data Collection and Analysis
Two oceanographic cruises were carried out aboard the R/V “Alpha Helix” (CICESE). Hydrographic data were collected with an SBE-911 plus CTD and water samples were collected at different depths (typically from the surface to 200 m) using a rosette arranged with 12-L Niskin bottles. From a total of 83 hydrographic stations, 29 stations were analyzed for June 2015 to determine DIC, pH, and total alkalinity (TA), while 24 of 48 stations were analyzed for March 2016 (Figure 1). The samples of DIC and pH analysis were taken and preserved according to the protocols specified in the best practices manual SOP 1 (Dickson et al., 2007).
Dissolved inorganic carbon measurements were carried out in laboratory conditions using a CO2 (CO2/H2O LI-7000, LICOR) infrared gas analyzer. The analyzer was linked to a semiautomatic dispenser system. The sample was dosified with a Kloehn syringe and acidified with phosphoric acid at 8.5%. Due to this acidification, the DIC present in the sample was taken to a gaseous state. CO2 was then subsequently transferred to the infrared analyzer using N2 as a carrier and its absorbency value was quantified. To convert the absorbance values, samples were calibrated with a certified DIC standard provided by the laboratory of Dr. Andrew Dickson of Scripps Institution of Oceanography (Dickson et al., 2003). The precision obtained with this methodology was ± 2 μmol kg–1 with a measurement error of ±0.2%.
In this work, spectrophotometric measurements of pH in total proton scale (pHT) were implemented following the methodology established by Clayton and Byrne (1993) and the modifications made by Liu et al. (2011). The proton concentration in the total ion concentration scale was measured using 10 mM meta-Cresol purple (mCP) following the recommendations described in the best practices manual SOP 6b (Dickson et al., 2007). The absorbance measurements were carried out using a spectrophotometer (USB 4000, Ocean Optics) linked to a tungsten lamp (HL-2000, Ocean Optics). The temperature of the samples was controlled at 25 ± 0.2°C. A Tris pH standard from the laboratory of Dr. Andrew Dickson of Scripps Institution of Oceanography was used as quality control. A correction was applied for the absorbance of impurities present in mCP (Douglas and Byrne, 2017); specifically, a correction factor of434Aimp of 8.527 × 10⁻³ for a final mCP concentration in sample of 1.7 μM. Finally the pHT is converted to in situ conditions using the software CO2sys_v2.2.xls (Lewis and Wallace, 1998) The obtained precision was ±0.005 pH units with an accuracy of ±0.002 and a measurement error of ±0.023%.
A SBE43 type oxygen electrode (with a precision 4.46 μmol kg–1and a resolution of 0.446 μmol kg–1) was attached to the CTD and calibrated at Seabird in December 2011. Routine cleaning of the oxygen electrode was performed during the cruises. The sensor was rinsed with a 0.1% solution of Triton X-100 after every cast, followed by a flush of 500 ppm solution of bleach and finally rinsed with fresh water. The sensor was kept from direct sunlight and humidified. The oxygen electrode data were not compared with chemical oxygen determinations since the electrode was factory calibrated prior to cruises. Similar (O2) measurement values in the core of the StSsW for both winter and spring reflects a good performance of the DO sensor during both cruises (Table 2).
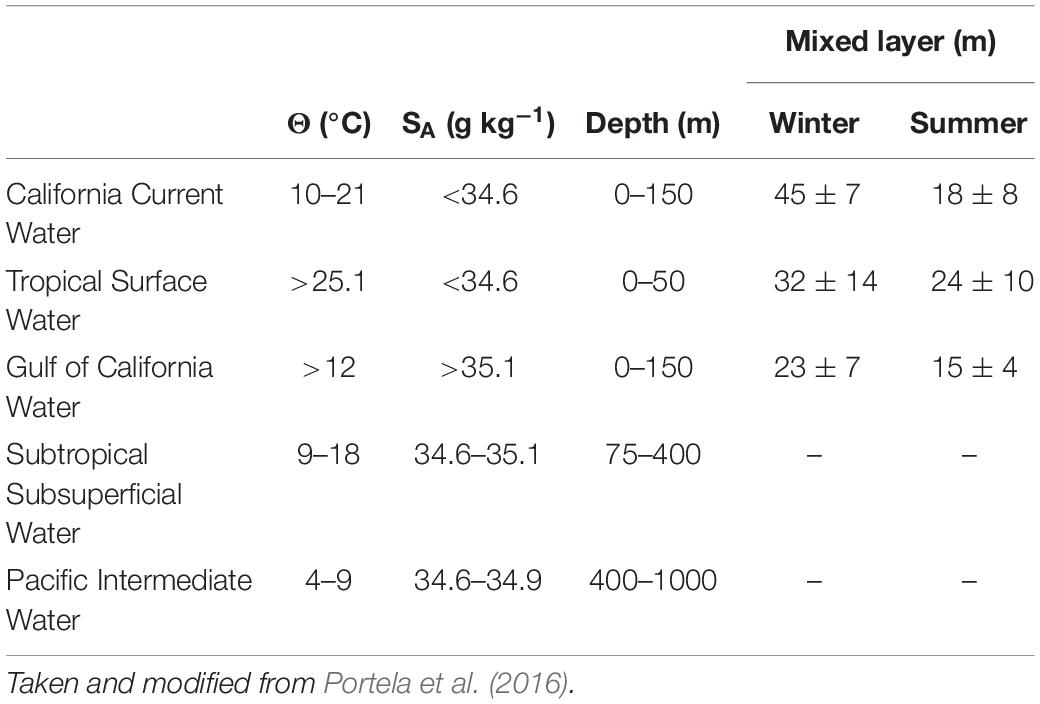
Table 1. Water mass limits in the Tropical Pacific in front of Mexico.
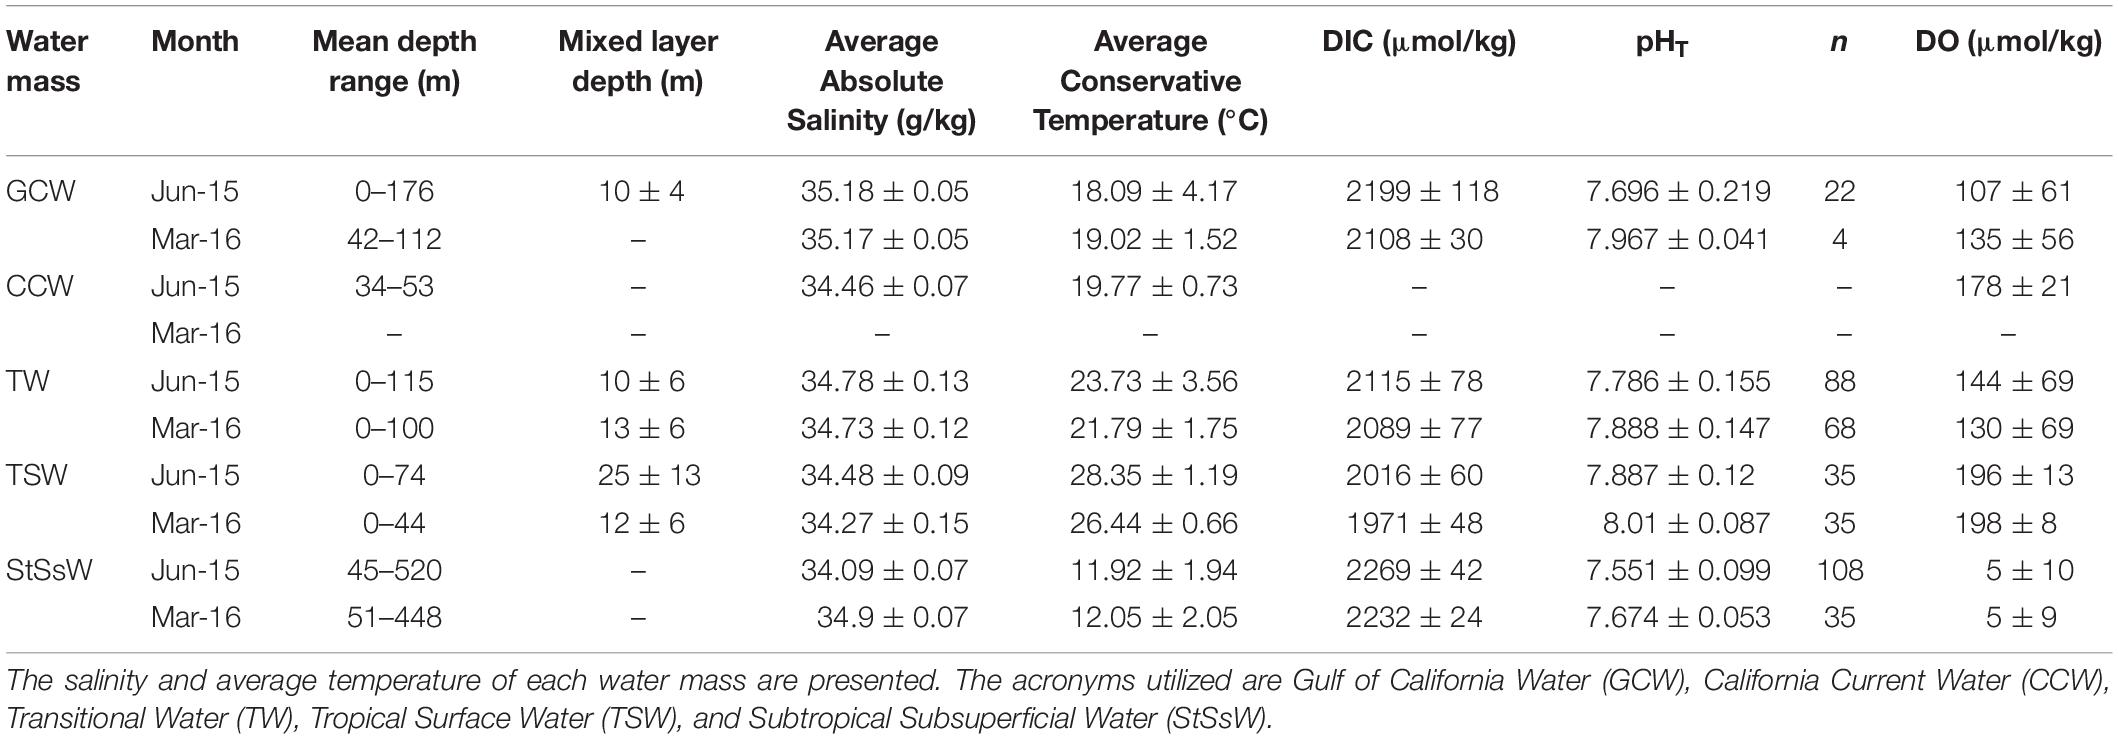
Table 2. Physical and chemical characteristics of the water masses in the Tropical Pacific in front of Mexico.
From these oxygen data, apparent oxygen utilization (AOU) was calculated. AOU is defined as the saturated DO concentration, estimated from temperature and salinity (Garcia and Gordon, 1992), minus the observed DO concentration. It has to be seen as an estimation of the amount of oxygen consumed since seawater was last under the air-sea equilibrium.
The international equation of the state of seawater (TEOS-10) allows to consistently evaluate all thermodynamic properties of pure water, ice, seawater and humid air. At the same time, variations in the composition of seawater around the world are accounted for; this spatial variation in its composition causes density differences that are equivalent to ten times the precision of practical salinity (SP) measurements made at sea (McDougall and Barker, 2017). The absolute salinity (SA) and the conservative temperature (Θ) are included in this new system of equations and should be used in the scientific literature replacing the use of potential temperature and practical salinity (IOC et al., 2010). The SA has units of grams per kilogram, and has a non-trivial effect on the horizontal density gradients, affecting all the variables derived from it. On the other hand, the conservative temperature Θ represents more accurately the heat content per unit mass of seawater. In this paper, we apply this recommendation and use these variables following the criteria defined by Portela et al. (2016) (see Table 1) to identify the water masses present during the different sampling periods. TW is the result of the mixing and interaction of the water masses present in this Table (Figure 3). As Pacific Intermediate Water (PIW) is found at depths much greater than 400 m, it was not included in the present analysis. The calculations of Θ and SA were carried out using the Thermodynamic Equation of Seawater 2010 (TEOS-10; IOC et al., 2010) included in the Ocean Data View program V4.7.81. The calculations of mixed layer depth were carried out using the methodology described by Kara et al. (2000) and a criterion of 0.2°C in ΔΘ for the equation of state was used to find the density variation (Δσt). The stratification parameter was calculated following Simpson (1981). It represents the amount of work per volume (J⋅m–3) needed to mix the water column up to a particular depth (300 m for this study).
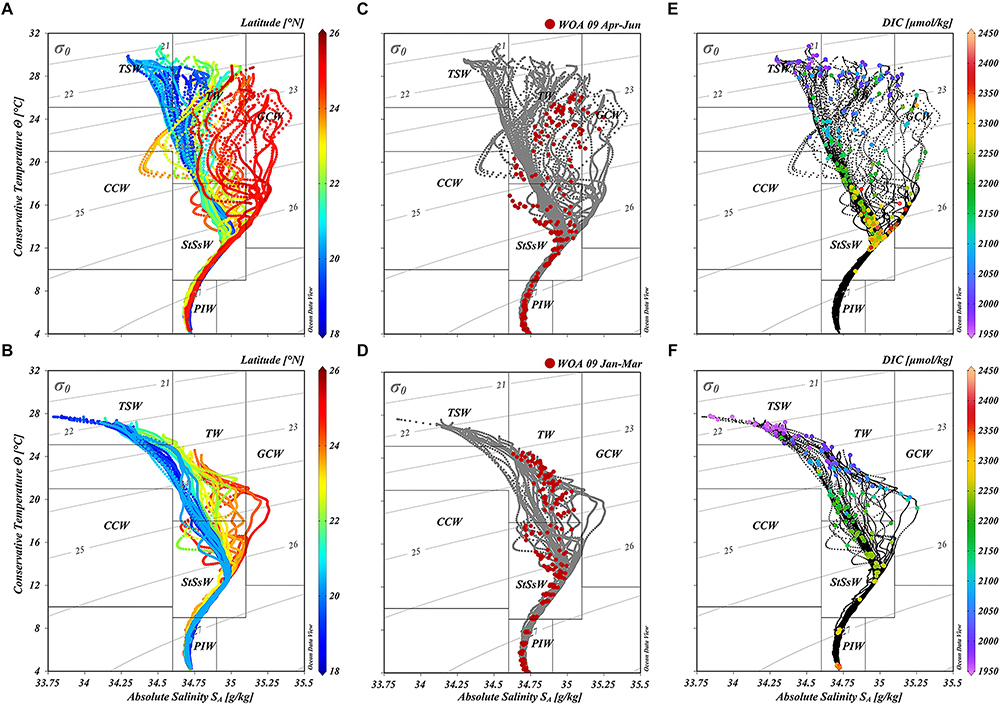
Figure 2. Conservative temperature (Θ,°C) and absolute salinity (SA, g/kg) diagram. Top figures, June 2015; bottom figures, March 2016. In color: (A,B) latitude in °N, (C,D) seasonal climatology was taken from World Ocean Atlas 2009, (E,F) dissolved inorganic carbon (DIC). The acronyms utilized are Gulf of California Water (GCW), California Current Water (CCW), Transitional Water (TW), Tropical Surface Water (TSW), Subtropical Subsuperficial Water (StSsW), and Pacific Intermediate Water (PIW). Water masses were classified according to Portela et al. (2016).
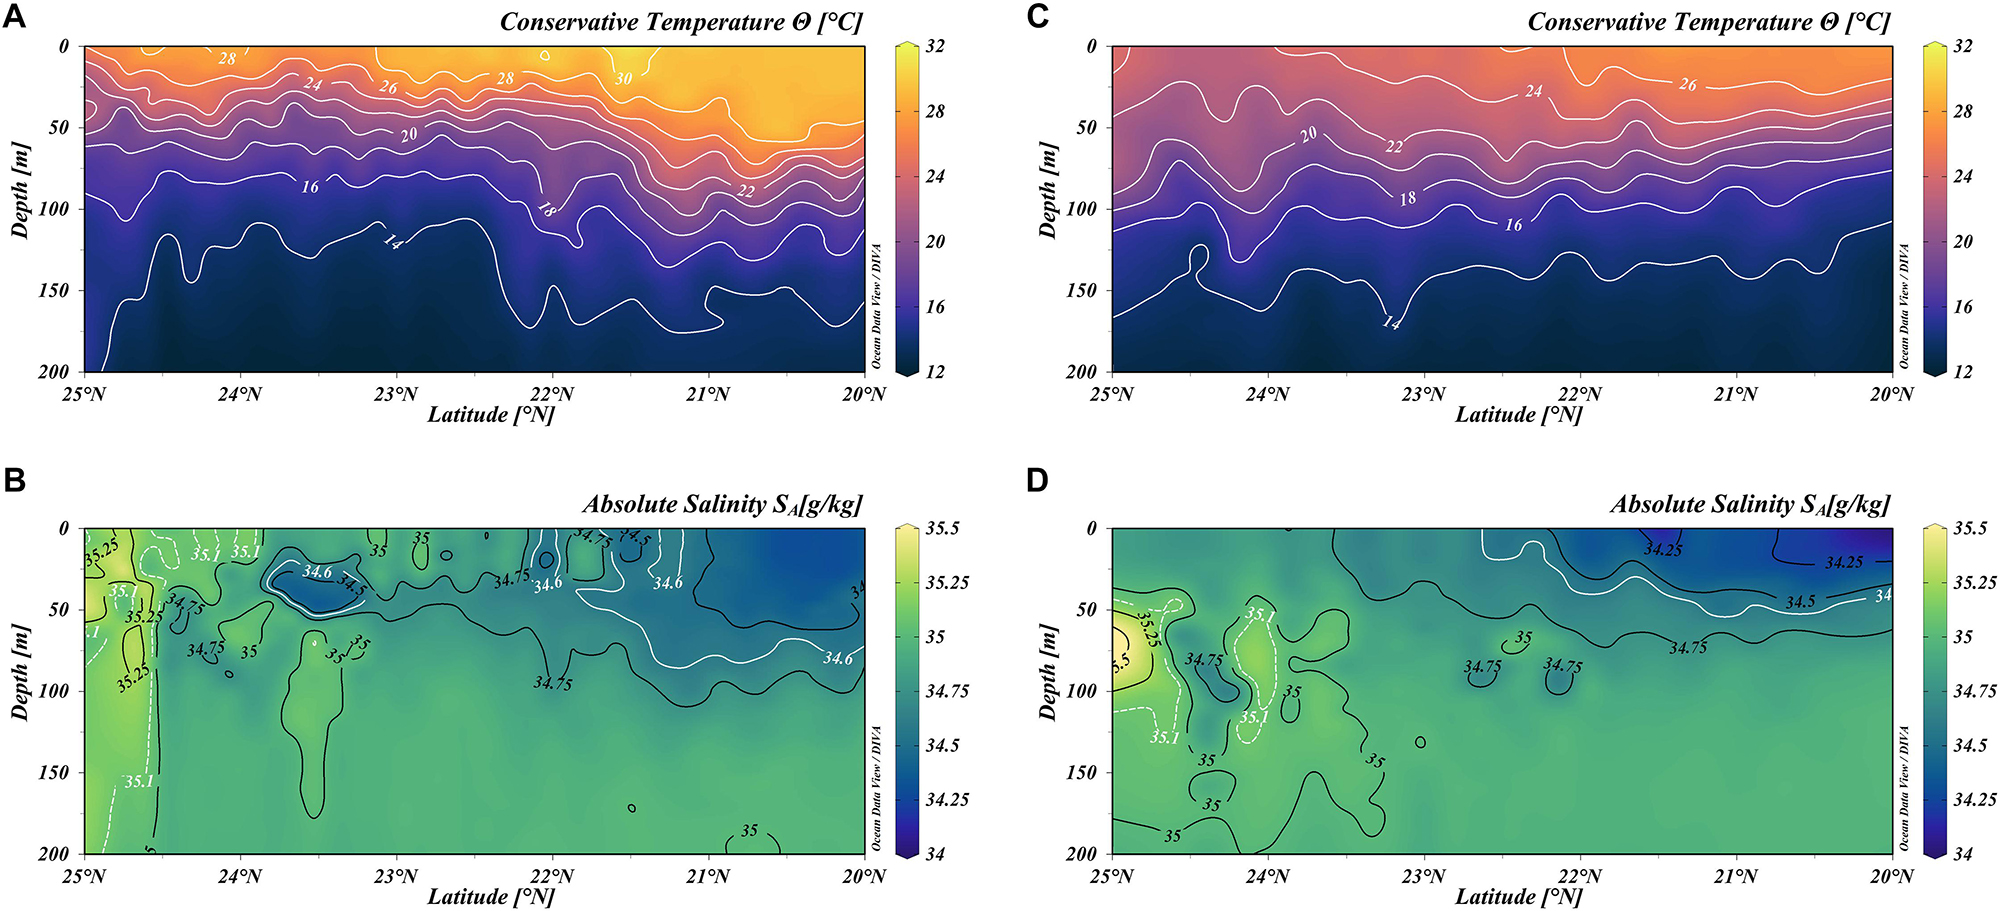
Figure 3. Vertical distribution of conservative temperature (Θ,°C) and absolute salinity (SA, g/kg) over transect 1 (see Figure 1). Respectively, (A,B) correspond to June 2015 and (C,D) to March 2016. Isohaline limits for Tropical Surface Water and Californian Current Water (<34.6 g/kg) and Gulf of California Water (>35.1 g/kg) appear in white.
In order to contrast the vertical distribution of oceanographic variables observed in each cruise, seasonal average profiles were extracted from the World Ocean Atlas 2009 (WOA09), specifically for spring and winter corresponding to June 2015 and March 2016 cruises, respectively. Also, to evaluate spatial variability in the study zone, the daily composition of the mean sea level anomaly (MSLA) from Aviso2, sea surface temperature from GHRSST3, and satellite chlorophyll (Chlasat) distributed by Copernicus platform4 were obtained.
Results
Water Masses
Five water masses were detected in the first 400 m during the June 2015 cruise. TSW was observed in front of Cabo Corrientes, between 18 and 21.5°N (blue colors in Figure 2A). The water column exhibited a strong thermal stratification in this zone. Conversely, GCW was observed from the surface to 176 m and confined within the entrance to the gulf at latitudes greater than 24°N (Table 2). In addition, the presence of the Tropical Branch of Californian Current was detected in five oceanic stations between 34 and 53 m depth near the tip of the peninsula (23.5°N). However, due to the previously defined objectives of the cruise, samples were not taken for this water mass and its DIC and pH content were unable to be characterized (Table 2). The water column is oftentimes unstable in this region and water column profiles in the T-S diagram (Figure 2) exhibit abrupt changes in salinity over a few meters. This pattern is typically associated with the presence of eddies that modify and disturb the vertical structure of the ocean. The presence of TW was detected in latitudes greater than 22°N where TSW loses its surface influence, as well as in the northern region within the Gulf of California up to 25.5°N. Toward the interior of the ocean, StSsW was present across all latitudes between 45 and 520 m depth (Figure 2A and Table 2).
The March 2016 cruise was comprised of fewer sampling stations (48 compared to 83 during 2015), with the notable absence of a cross gulf transect within the Gulf of California and another oceanic northwest-southeast section. However, the cruise comprised nearly the same latitudinal coverage as the previous year (Figure 1). GCW was only registered in four northern stations between 24 and 26°N and between 40 and 110 m depth. TSW was registered from 18–22°N, showing a relatively greater spatial coverage than during June 2015, although 30 m shallower (Table 2). In addition, TSW presented a lower average salinity and temperature than during the previous cruise. StSsW was present below superficial waters along with all latitudes in the study region (Figure 2A); in addition, the upper and lower limits of StSsW were like to those for June 2015 (Table 2). CCW was not registered during this period.
A comparison between the seasonal average taken from the World Ocean Atlas 2009 (WOA09) database and data from the June 2015 (spring) and March 2016 (winter) cruises shows that, for our particular region of the TPCM, TSW is typically absent during spring (Figure 2C) while water with characteristics similar to GCW was present during winter. Portela et al. (2016) indicate that the similarity to GCW is more pronounced below 250 m. Typical seasonality was not observed during spring when TSW was present in various southern stations and a large portion of TW was found to have thermohaline characteristics similar to TSW. Expanding this comparison, the winter season climatology (Figure 2D) showed a distribution where water mass characteristics were close to TSW. However, TSW is typically not present in the study region during this season; instead, a strong presence of TSW was detected during March 2016. In summary, for the June 2015 and March 2016 cruises, the presence of seasonally anomalous TSW was found within the study region.
The DIC concentration for each of the water masses defined is shown in Figures 2E,F. Most notably, superficial peaks and a greater variation in DIC were present in June 2015 when compared with March 2016, which presented less variability and a typical gradient in DIC concentration toward the interior of the ocean. The concentration of DIC in TSW during March 2016 was largely homogenous with values typically below 2000 μmol⋅kg–1. TW presented similar superficial DIC concentrations (between the 23 and 24 isopycnals) in all profiles, with increases in DIC up to 2200 μmol⋅kg–1nearing StSsW. For June 2015, TSW presented values in the same range as those present in 2016 but with greater superficial variability. The same occurred with the TW for this period, when values of up to 2200 μmol⋅kg–1 were present in surface waters. Finally, GCW presented the greatest variability, both near the surface with values of 2200 and 2300 μmol⋅kg–1, as in the deeper portion where concentrations similar to the maximums present in StSsW (∼2400 μmol⋅kg–1) were observed (Table 2).
Profiles
Conservative Temperature and Absolute Salinity
Conservative temperature (O°C) and absolute salinity (SA g/kg) profiles along transect 1 (white line in Figure 1) are shown in Figure 3. In June 2015 (Figure 3A), the temperature in the first 200 m of the water column was greater than during March 2016 (Figure 3C) and also notably, in the southern portion where the incursion of TSW was detected. The thermocline also appeared to be more intense during June 2015. Markedly, the 18°C isotherm deepened from 50 m near the entrance to the Gulf of California to 100 m under TSW toward the south. In this transect, the haline limits of the water masses were also detectable (white lines in Figures 3B,D and Table 1). TSW ventured to the north as a surface layer of low salinity (<34.6 g⋅kg–1) with greater depth during June 2015 (Figure 3B), but was shallower and less saline during March 2016. In June 2015, the exit of GCW (>35.1 g⋅kg–1) can also be noted, dominating above 150 m and extending 50 km outside the Gulf of California. In addition, the intrusion of CCW (<34.6 g⋅kg–1) at approximately 40 m depth was observed, which generated instability and mixing. During March 2016, the intrusion of GCW between 50 and 150 m depth near the entrance to the Gulf of California was also detected.
Positive sea surface temperature (SST) anomalies along the North Pacific were reported for winter 2014 (Hartmann, 2015; Stramma et al., 2016) and due to their intensity and extension, these anomalies have been referred to as “The Blob” (Bond et al., 2015). Following its establishment in the region, intense signals indicating the development of an El Niño-Southern Oscillation (ENSO) event were detected in the tropical Pacific5. Sánchez-Velasco et al. (2017) constructed an index of standardized SST anomalies using satellite images from 1981 to 2016 to determine if the local warming of surface waters was present in the TPCM as a result of the advance of the ENSO along the Mexican coast. The results of this index are shown in Figure 2 of their article where a relationship between low southern oscillation index values (SOI) associated to strong ENSO events and positive and intense local anomalies in SST for the TPCM during 2015 and part of 2016 can be observed.
These temperature anomalies did not only appear on the surface. In Figure 4, these temperature anomalies are apparent along transect 1 toward the subsurface layer. The same database comparison was carried out, as with Figures 2C,D, to evaluate the temperature anomalies present, namely observed values from each cruise minus the corresponding seasonal climatology obtained from WOA09. For June 2015, the most intense positive anomalies were registered for either period in southern latitudes (21.5–20°N; Figure 4A) around Islas Marías (Figure 1). There we observed positive anomalies throughout the first 200 m, with values above 4°C from 100 m depth toward the surface. The greatest anomaly intensity in this area was near the vertical limit between TSW and StSsW (Figures 3B, 4A), between 50 and 75 m depth. For the rest of transect to the north, positive anomalies were principally registered in the surface layer from 50 m depth. During March 2016, positive temperature anomalies in the water column were also registered. Despite being of lower intensity than the previous season (2–4°C), the positive anomaly manifested along the entire transect, from the surface to 100 m depth in northern latitudes and decreasing in depth toward southern latitudes (Figure 4B). This behavior is observed during an ENSO in decline (Abellán et al., 2017; Santoso et al., 2017), with superficial temperature anomalies that are still positive but with oceanographic conditions close to those of the seasonal climatology (Figure 2D). The weakest thermal anomaly signal observed during March 2016 may be due to the residual effect of the dissipating ENSO and the onset of conditions that are closer to the expected climatology.
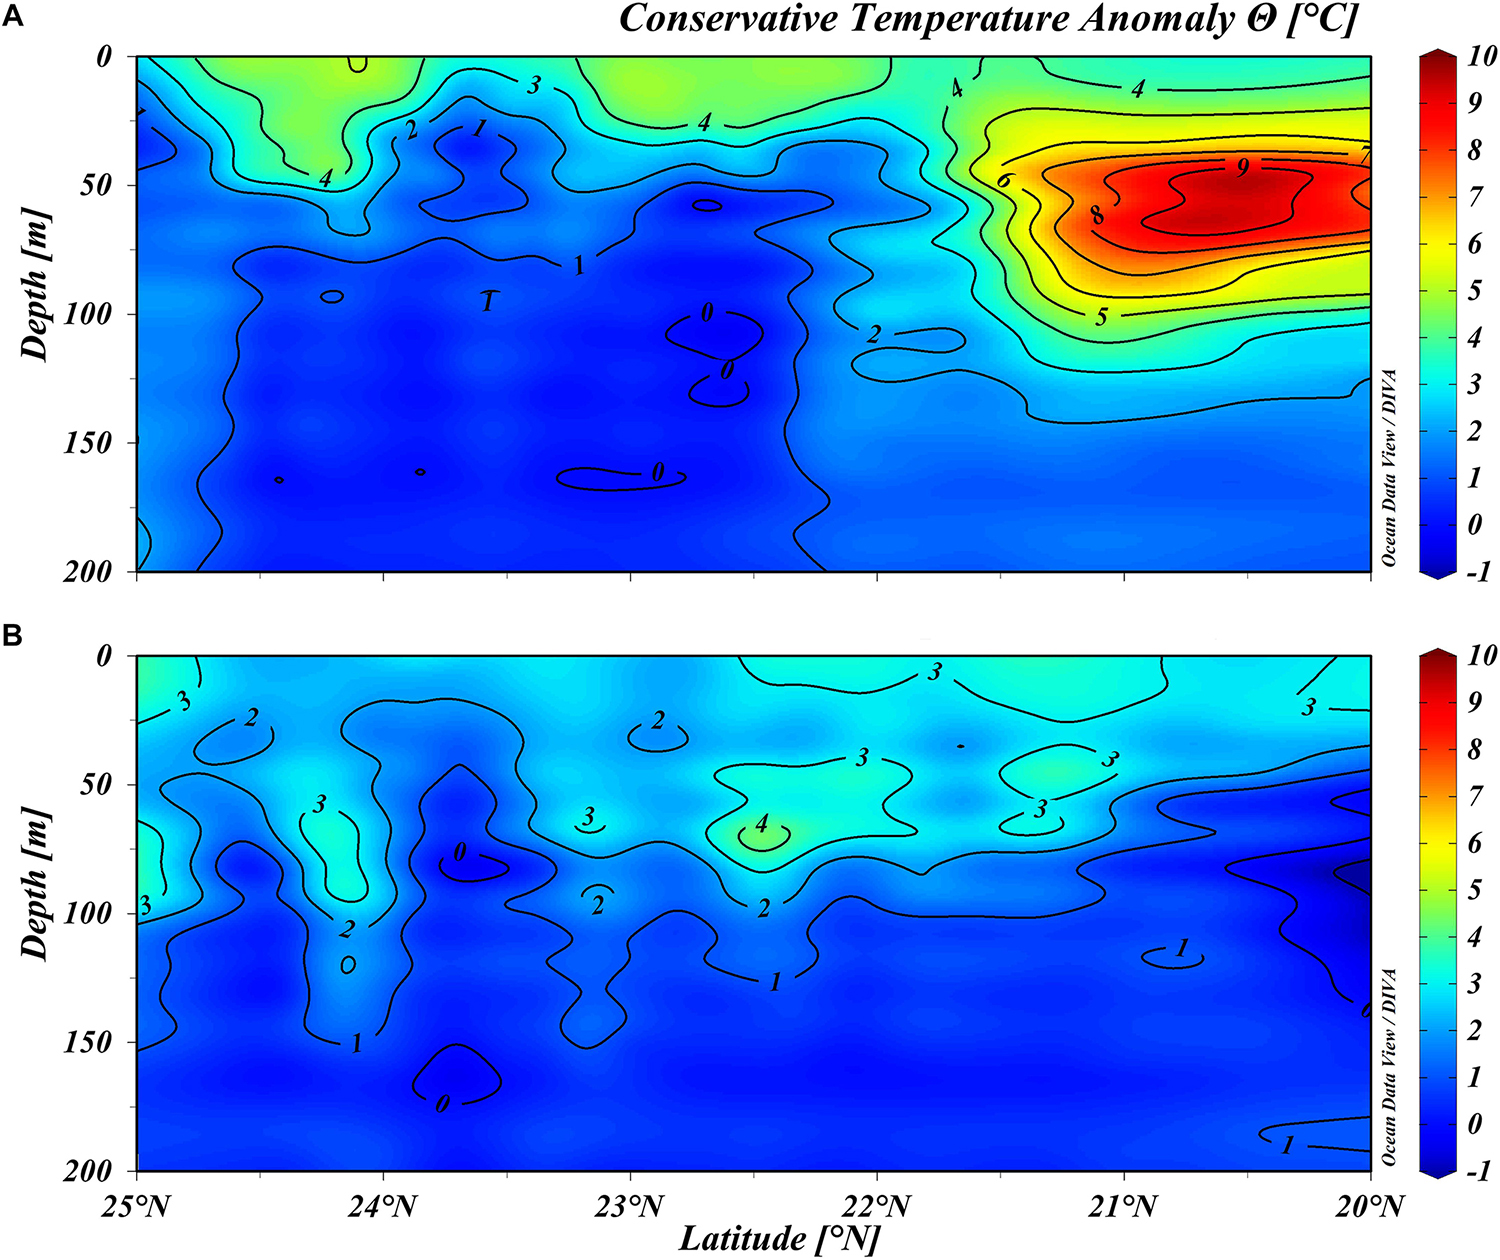
Figure 4. Vertical distribution of conservative temperature (Θ,°C) anomalies along transect 1 (see Figure 1). (A) June 2015 and (B) March 2016. Refer to text for anomaly construction.
Dissolved Oxygen
There is no consensus regarding the definition of OMZ limits (Hofmann et al., 2011); however, in order to understand their distribution, characteristics, and biogeochemical relevance, it is important to define reference boundaries as a function of the concentration of DO. These horizons have been established from different biological and chemical approximations and they have been assigned different terms (Hofmann et al., 2011). In the present study, we follow the limits established by Paulmier et al. (2011) for oxic levels (>200 μmol⋅kg–1) and Sánchez-Velasco et al. (2017) for hypoxic (<44 μmol⋅kg–1) and suboxic levels (<4.4 μmol⋅kg–1). These levels have been set on the function of the possible effects on the biology present. This is, under hypoxic conditions, epipelagic species may be subject to stressful conditions, while suboxic conditions can result in the death of epipelagic and mesopelagic species.
In June 2015, a narrowing of a layer with DO concentrations greater than suboxic levels but below oxic levels was observed from 50 m to below 175 m depth around 24.5°N (gray color in Figure 5A). This may be associated with the exit of GCW (>35.1 g⋅kg–1, Figure 3B), which rapidly loses its influence a few kilometers south of the entrance to the Gulf of California. Adjacent to this front, two relevant structures were observed, namely a downward 100 m displacement of the suboxic horizon to 200 m depth and an intrusion throughout the surface layer of waters from 50 m with oxygen concentrations between 140–160 μmol⋅kg–1. For the remainder of the surface layer (>75 m) waters with oxic conditions dominated, except in the southern zone around Islas Marías were the advance of TSW was detected (<34.6 g⋅kg–1 in Figure 3B, and >25.1°C in Figure 3A). The upper horizon of the OMZ is defined by Cepeda-Morales et al. (2013) as a concentration of 9 μmol⋅L–1and despite the fact that it is not shown in Figure 5, the 4.4 μmol⋅kg–1 isoline follows nearly the same distribution and is the one that will be used to define the upper and lower limit of the OMZ throughout this study. The upper portion of the OMZ is found shallower in the central portion of the transect (∼70 m), gradually deepening toward the south underneath TSW. The depth of the oxycline was defined as described by Maske et al. (2010), taking the depth of the maximum difference in DO calculated in a range of 4 m.
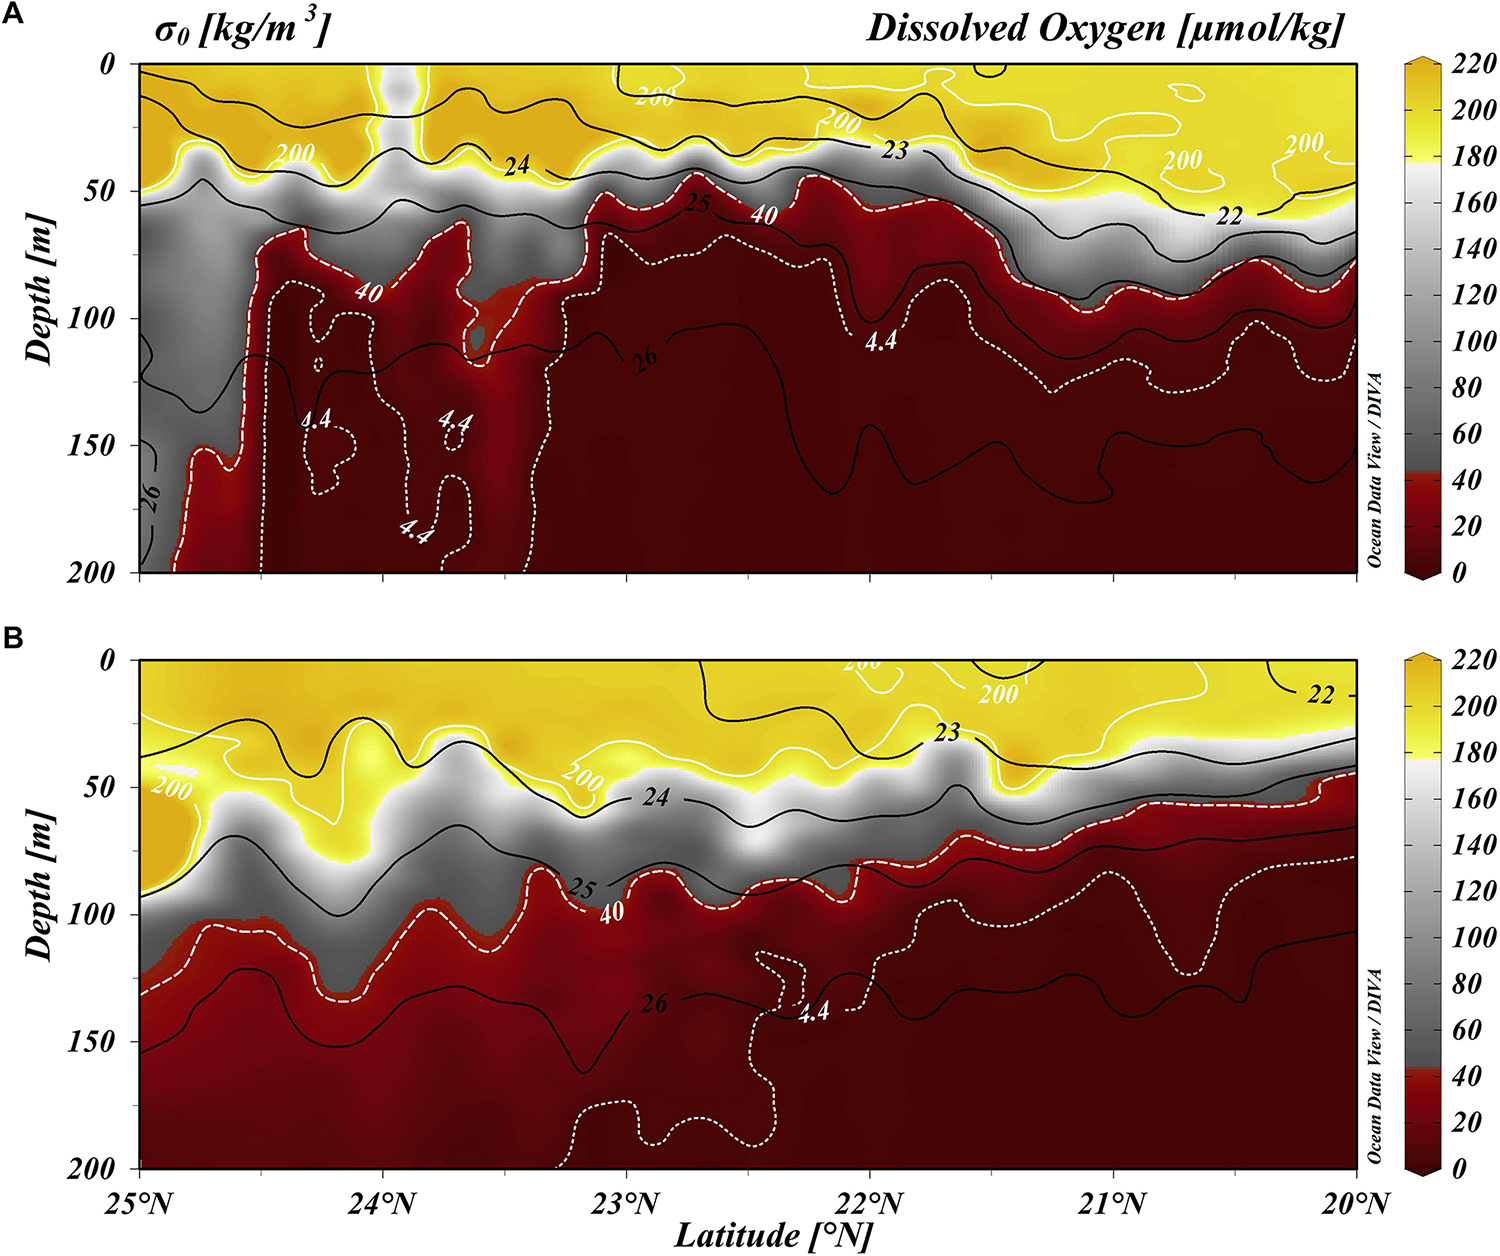
Figure 5. Vertical distribution of dissolved oxygen (DO, μmol/kg) and potential density anomaly (σ0, kg/m3) along transect 1 (see Figure 1). (A) June 2015, (B) March 2016. Refer to text for DO limits.
In contrast, March 2016 exhibited a scenario in accordance with oxygen winter climatology (Cepeda-Morales et al., 2013). A latitudinal gradient, where the OMZ deepens from its most shallow area around Cabo Corrientes (∼60 m) until it reaches approximately 300 m in front of the entrance to the Gulf of California.
Important anomalies in the concentration of DO were also observed latitudinally and toward the interior of the ocean. The analysis was carried out in the same manner as that for the T-S diagrams, taking into account only those depths that had more than four observations for the construction of the seasonal climatology (typically six observations, with a maximum of 15 observations, were used for oxygen, while 60 observations, with a maximum of 250 observations, were used for temperature). In Figure 6A, it can be noted that during June 2015, the incursion of TSW (from 20° to 21.5°N and from 75 m to the surface) appeared as a superficial wedge of low salinity (isohaline of 34.6 g⋅kg–1) that brought a relatively high concentration of subsurface DO with values >75 μmol⋅kg–1. In the northern region around the entrance to the Gulf of California (∼25°N), a similar behavior was observed to what was described for the southern region. The exit of GCW (>35.1 g⋅kg–1) generated a near-vertical saline front that extended to 200 m depth. Collins et al. (2015) reported and described the mechanisms that participated in the formation of these fronts, highlighting that their generation is more prone to occur during autumn. The front associated with GCW generated positive DO anomalies with values above 25 μmol⋅kg–1 at depths between 50 and 200 m. Adjacent to where we observed the presence of GCW, between 50 and 150 m and between 25 m and the surface, anomalous values of DO below −25 μmol⋅kg–1 were detected. This occurs where an incursion throughout the surface layer of waters from 50 m depth with DO concentrations between 140 and 160 μmol⋅kg–1 (Figure 5A) was found. Further south (∼24°N), an intrusion was observed around 50 m depth of CCW (<34.6 g⋅kg–1) that generated positive anomalies above 25 μmol⋅kg–1.
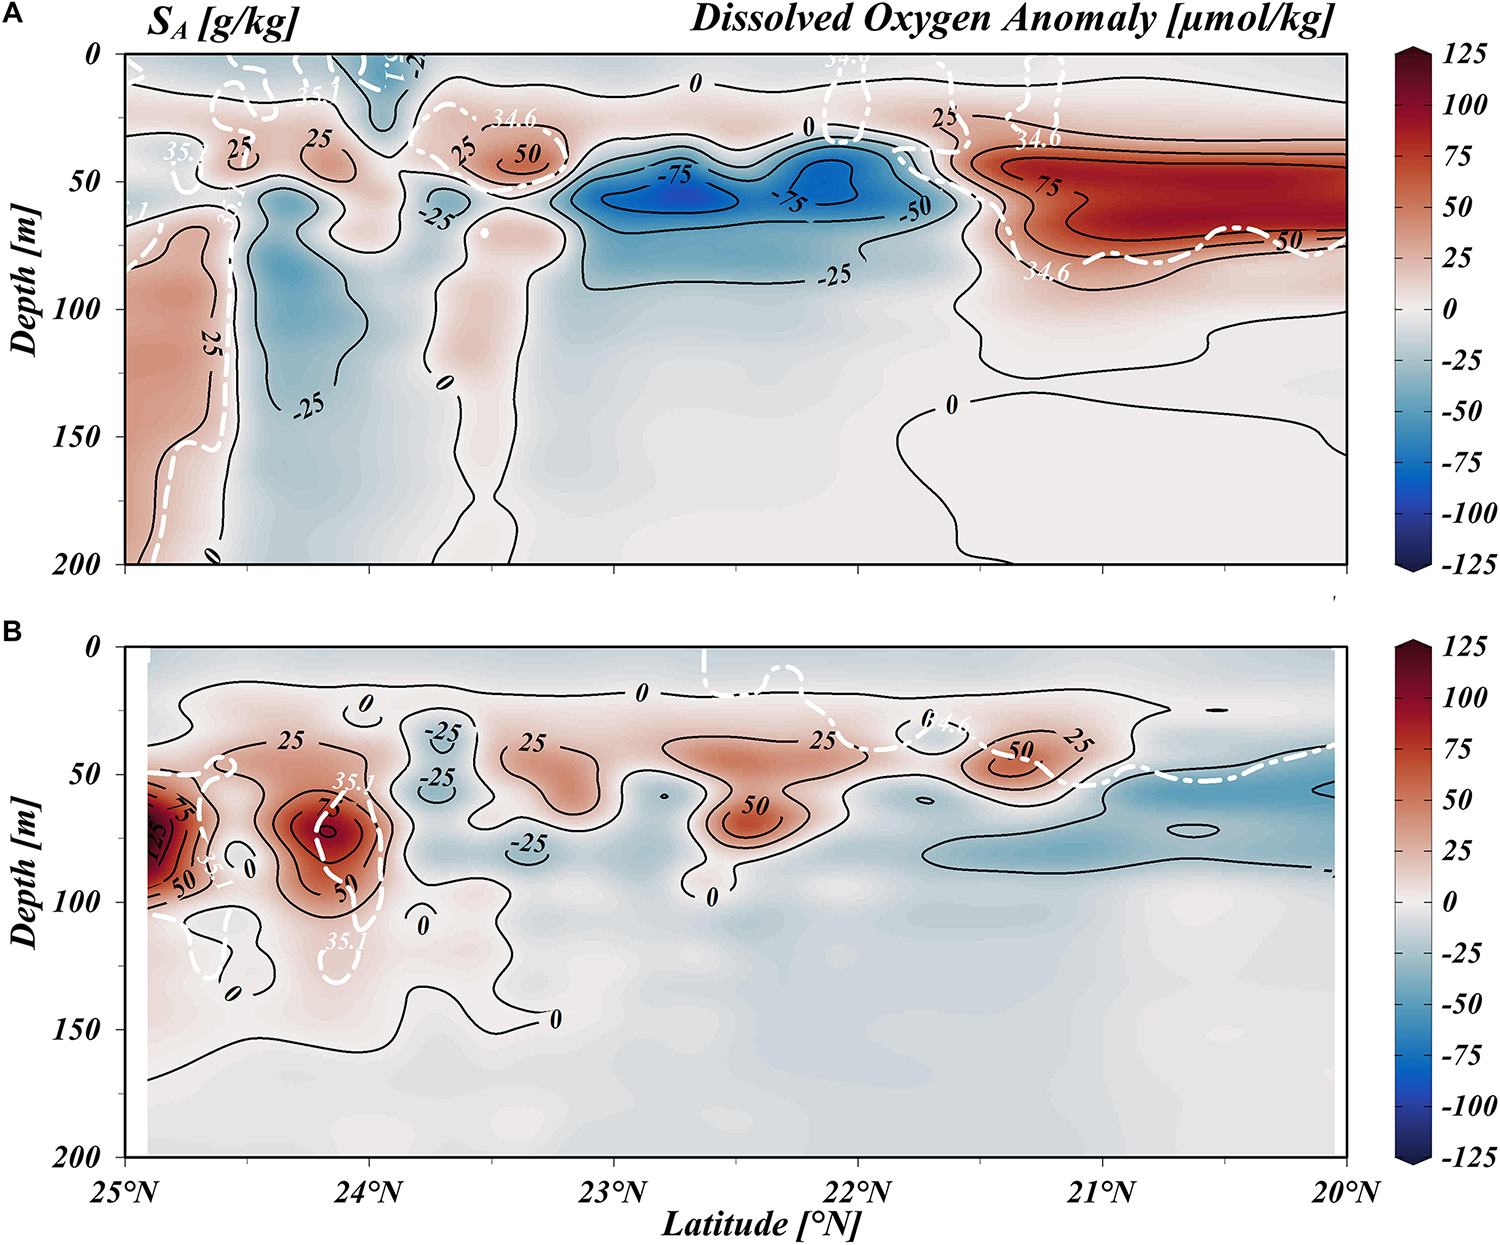
Figure 6. Vertical distribution of dissolved oxygen (DO, μmol/kg) anomalies and absolute salinity (SA, g/kg) along transect 1 (see Figure 1). (A) June 2015, (B) March 2016. Isohaline limits for Tropical Surface Water and Californian Current Water (<34.6 g/kg) and Gulf of California Water (>35.1 g/kg) appear in white. Refer to text for anomaly construction.
For the following year in March 2016 (Figure 5B), the distribution of DO returned to near-seasonal conditions. However, a band of a positive anomaly (>25 μmol⋅kg–1) along the entire transect around 50 m depth was present (Figure 6B). A plausible explanation for this process is (as also previously observed with temperature anomalies) that this band is the remnant effect of the incursion of warm southern oxygenated waters registered in the previous period. Moreover, around 25°–24°N, we observe positive DO anomalies of 50–125 μmol⋅kg–1 between 50–100 m depth that is related to the presence of GCW.
Despite the dispersion of data between the relationship of DO and DIC, these variables were highly correlated (rp = 0.851, p < 0.001 for June 2015 and rp = 0.867, p < 0.001 for March 2016; Figure 7), showing a clear tendency toward a decrease in DO as DIC values increase. For June 2015, the dispersion of the data clearly shows DO above 200 μmol⋅kg–1 (i.e., surface values; Figure 5A) and below 40 μmol⋅kg–1 (hypoxic concentration near the OMZ; Figure 5A). This dispersion is mainly attributed to the instability of the water column observed throughout this period (Figure 2A). TSW was mainly characterized by being well oxygenated (∼ 200 μmol⋅kg–1), with greater dispersion in the concentration of DIC during June 2015 (2016 ± 60 μmol⋅kg–1) than in March 2016 (1971 ± 48 μmol⋅kg–1; Table 2). This pattern was observed for StSsW, with DO values below 50 μmol⋅kg–1 and greater variability during late spring 2015 than during winter 2016.
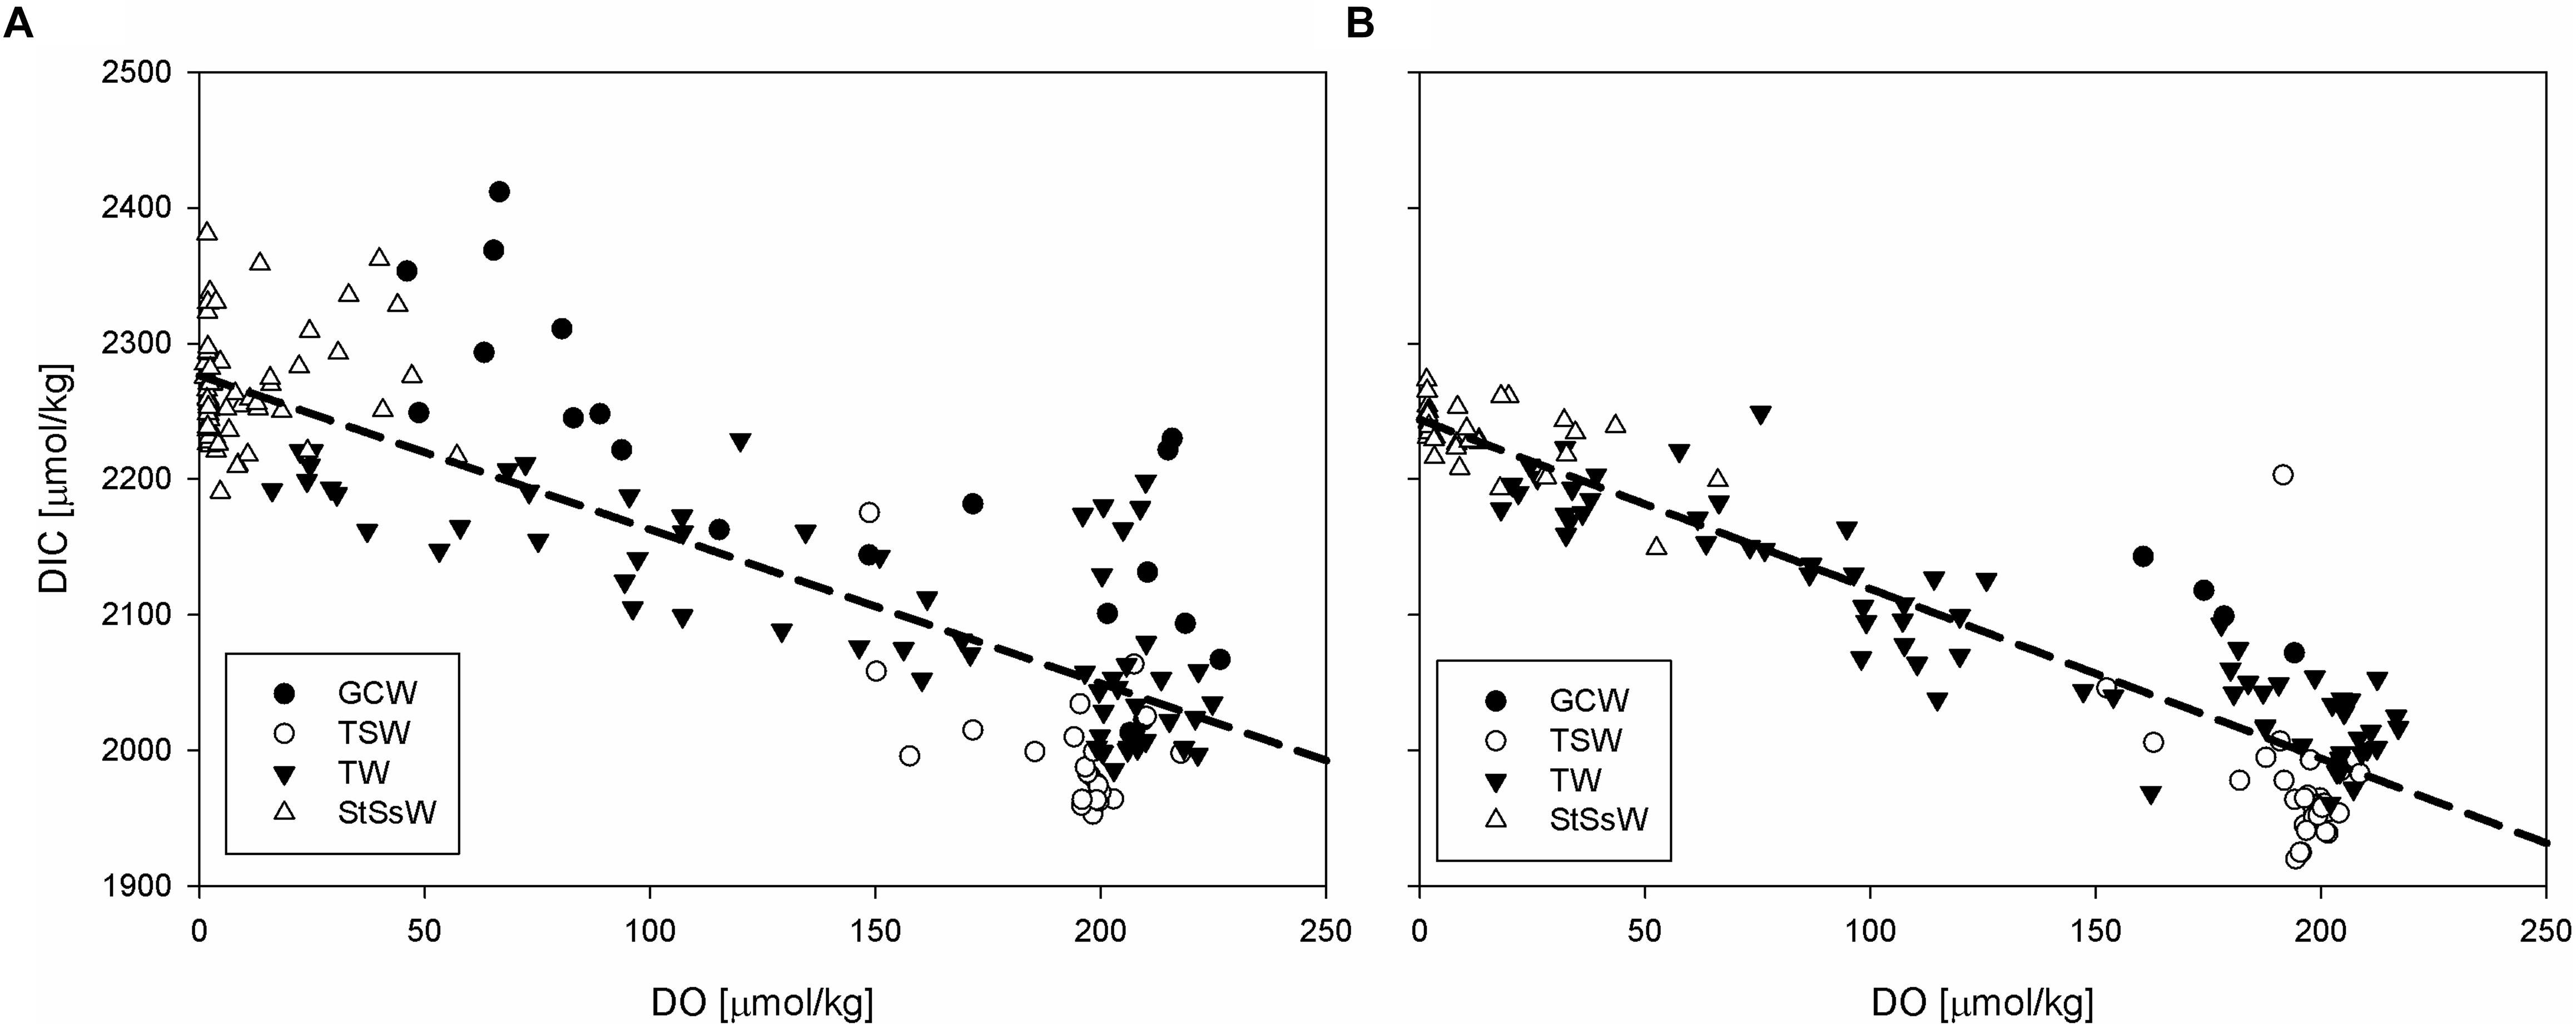
Figure 7. Comparison between dissolved oxygen (DO, μmol/kg) and dissolved inorganic carbon (DIC, μmol/kg).The acronyms utilized are Gulf of California Water (GCW), California Current Water (CCW), Transitional Water (TW), Tropical Surface Water (TSW), and Subtropical Subsuperficial Water (StSsW). (A) June 2015, (B) March 2016.
Discussion
Brewer (2018) exhorts that changing ocean oxygen field to be viewed and dealt with as a complex process of multiple forcing factors acting simultaneously. Furthermore, Respandly (2018) discuss the possible shifts in time between the expansions and contractions of the OMZ. Here we present another plausible forcing factor for the local ventilation of the upper OMZ that should be contemplated, according to Brewer’s statement, in our understanding of the variability of these zones. An anomalous incursion of tropical water during El Niño 2015–2016 increased the availability of oxygen in previously deprived depths. This oxygen availability is reflected in the intensification of the oxycline where the intrusion was detected and in a higher molar ratio of DIC/AOU than prior studies have been reported (Maske et al., 2010).
Spatial Differentiation of DO and DIC Dynamics
In our analysis, we have identified three principal regions (I, II, and III in Figure 8), with regard to the processes that distribute and modify the spatial structure of DO and DIC. In this section, we have constructed the discussion about the characteristics observed during spring 2015 and we contrasted those characteristics with the scenario found during winter 2016.
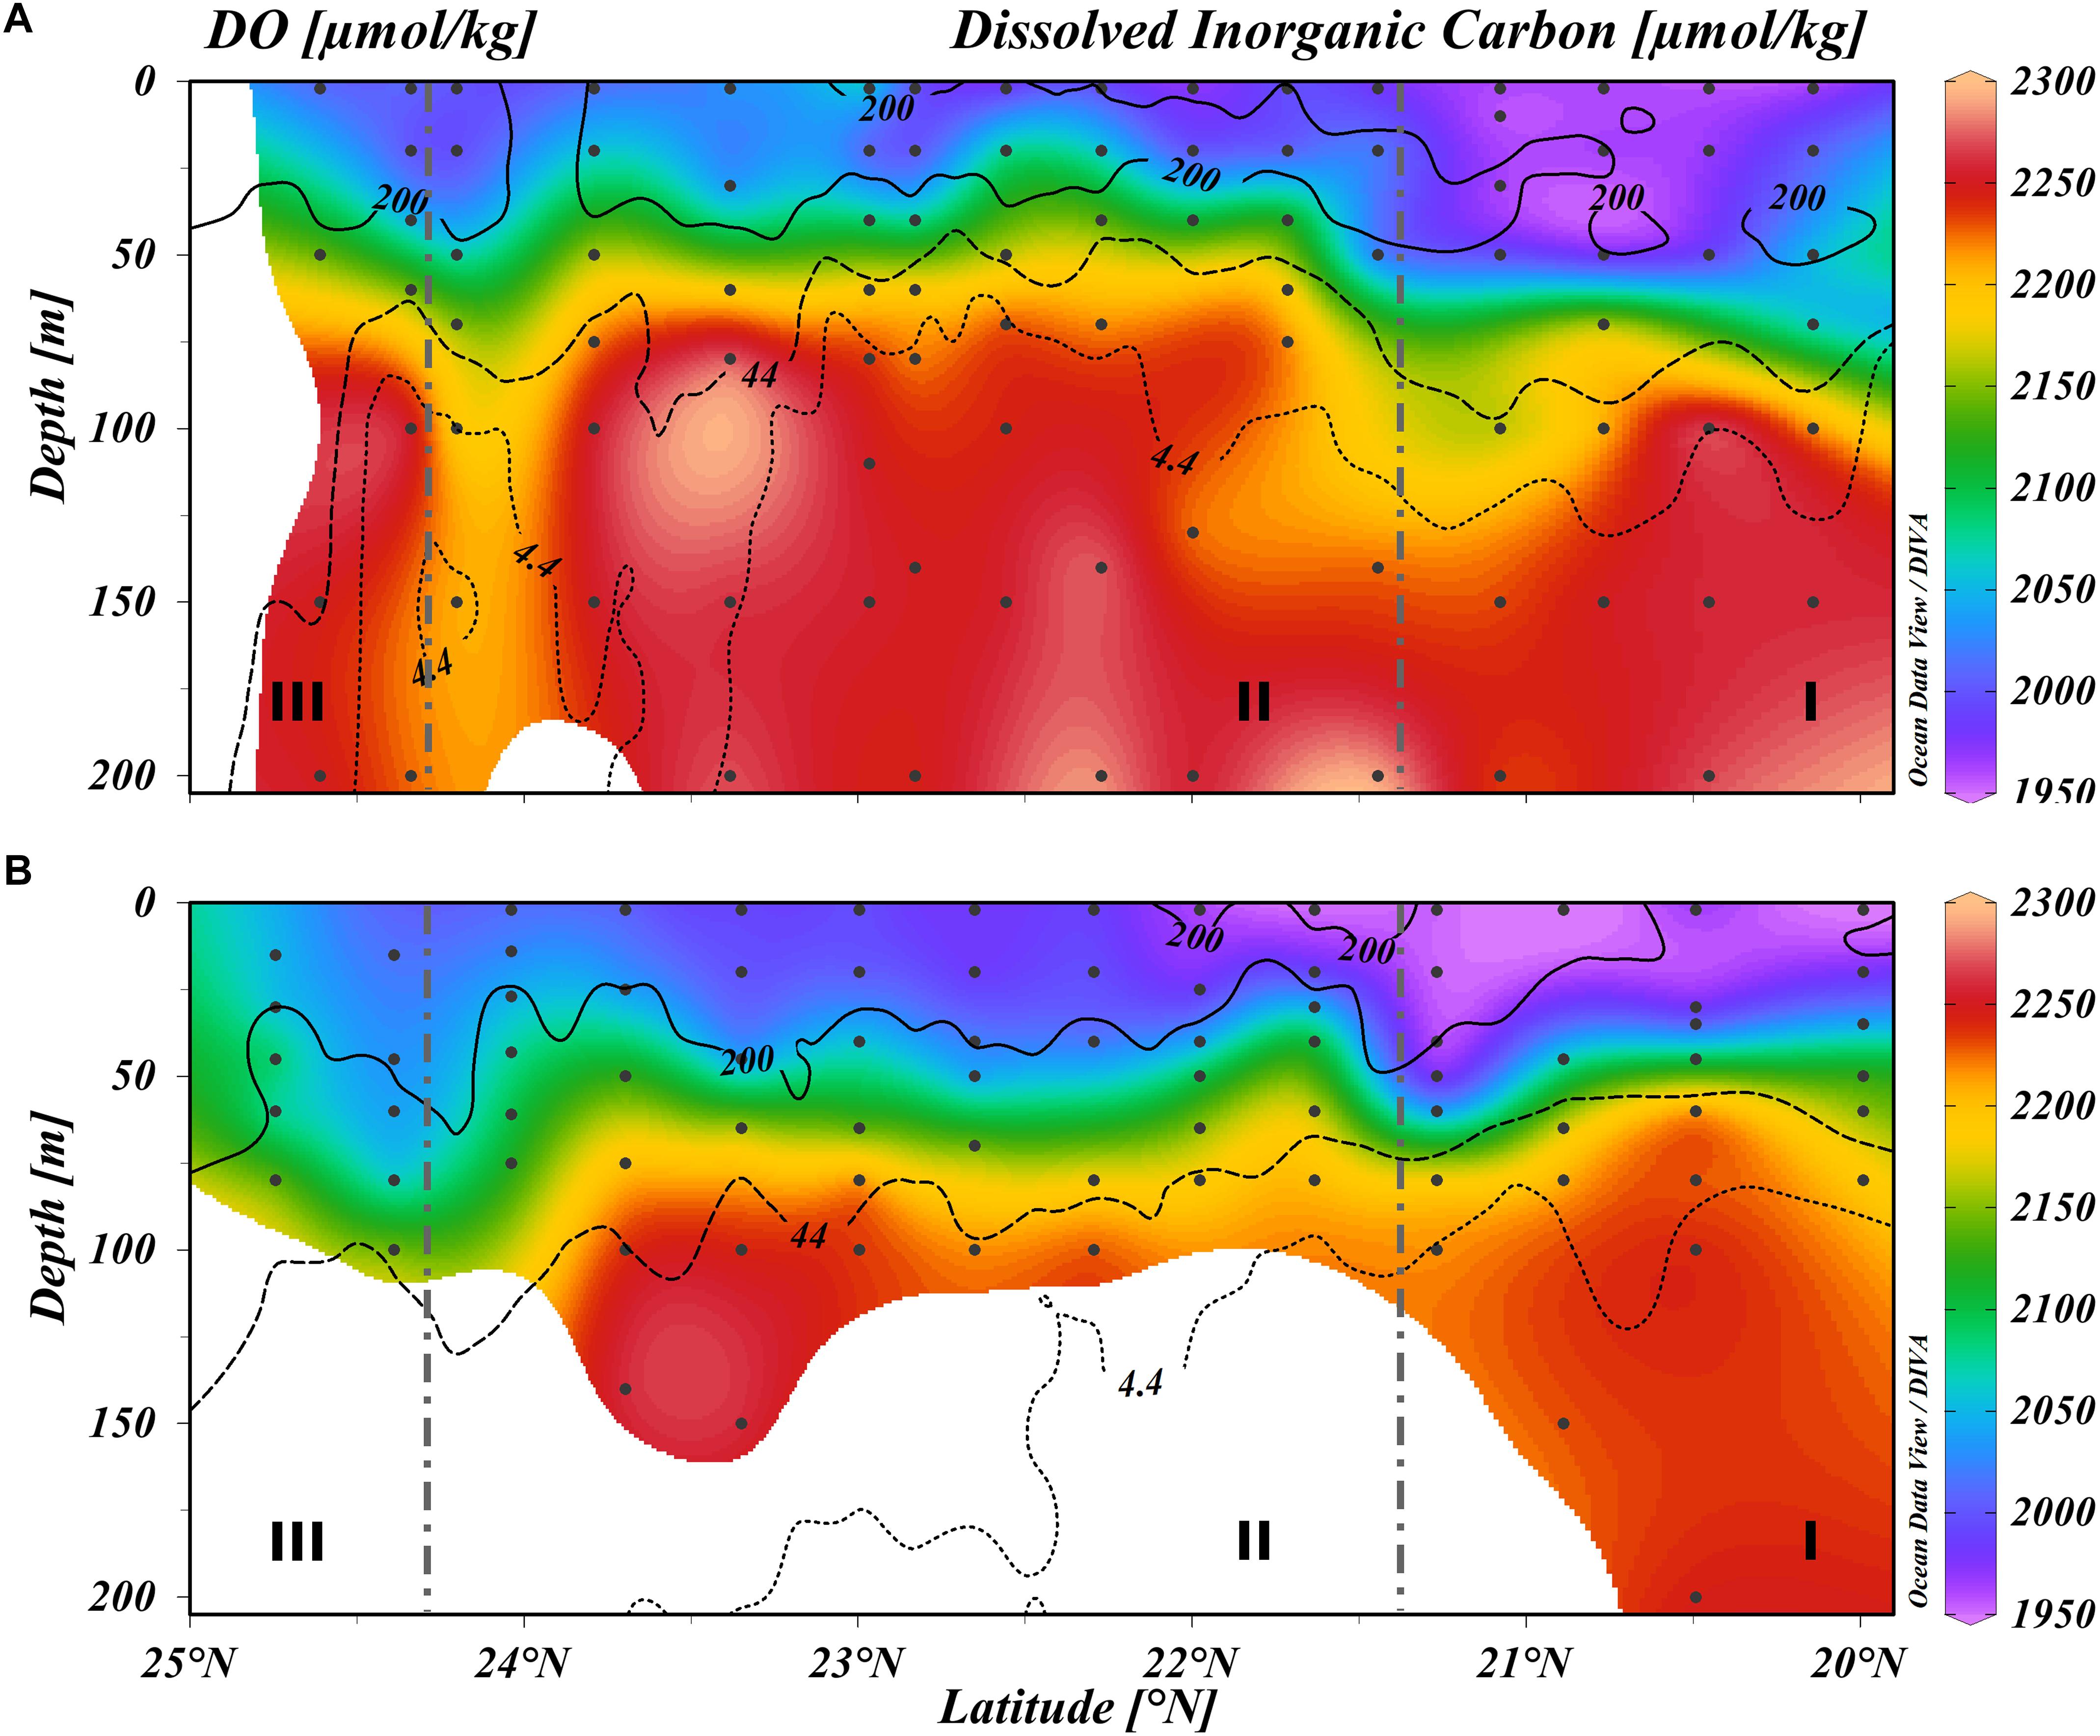
Figure 8. Vertical distribution of dissolved inorganic carbon (DIC, μmol/kg) and dissolved oxygen (DO, μmol/kg) along transect 1 (see Figure 1). (A) June 2015, (B) March 2016. Refer to text for DO limits. Cabo Corrientes region (I), Transitional region (II), and entrance to the Gulf of California region (III).
June 2015
Cabo Corrientes (Region I)
In southern latitudes, below 22°N for coastal stations and 20.5°N for oceanic stations, the surface layer was dominated by the incursion of TSW. Its anomalous presence was related to the seasonally expected pattern, associated with a developing ENSO event (Sánchez-Velasco et al., 2017). In this region, the greatest stratification in our study period was registered, from 1000 to 1400 J⋅m–3 along an ocean-coast gradient (Figure 9A). These values are typically found in front of the coasts of Oaxaca (Chapa-Balcorta et al., 2015) and in the eastern Pacific warm pool (Fiedler et al., 2013), progressively decreasing toward our study region with values around 1200 J⋅m–3 (Fiedler et al., 2013; Franco et al., 2014). Temperature is the main factor controlling stratification in our region (Fiedler et al., 2013) and in the TPCM area, we can observe that the intensification of stratification was associated with an ocean-coast and north-south temperature gradient (Figures 10, 11). However, for some coastal stations, where the influx of fresh water was detected (around Cabo Corrientes; Figure 1), salinity becomes the most relevant factor controlling stratification.
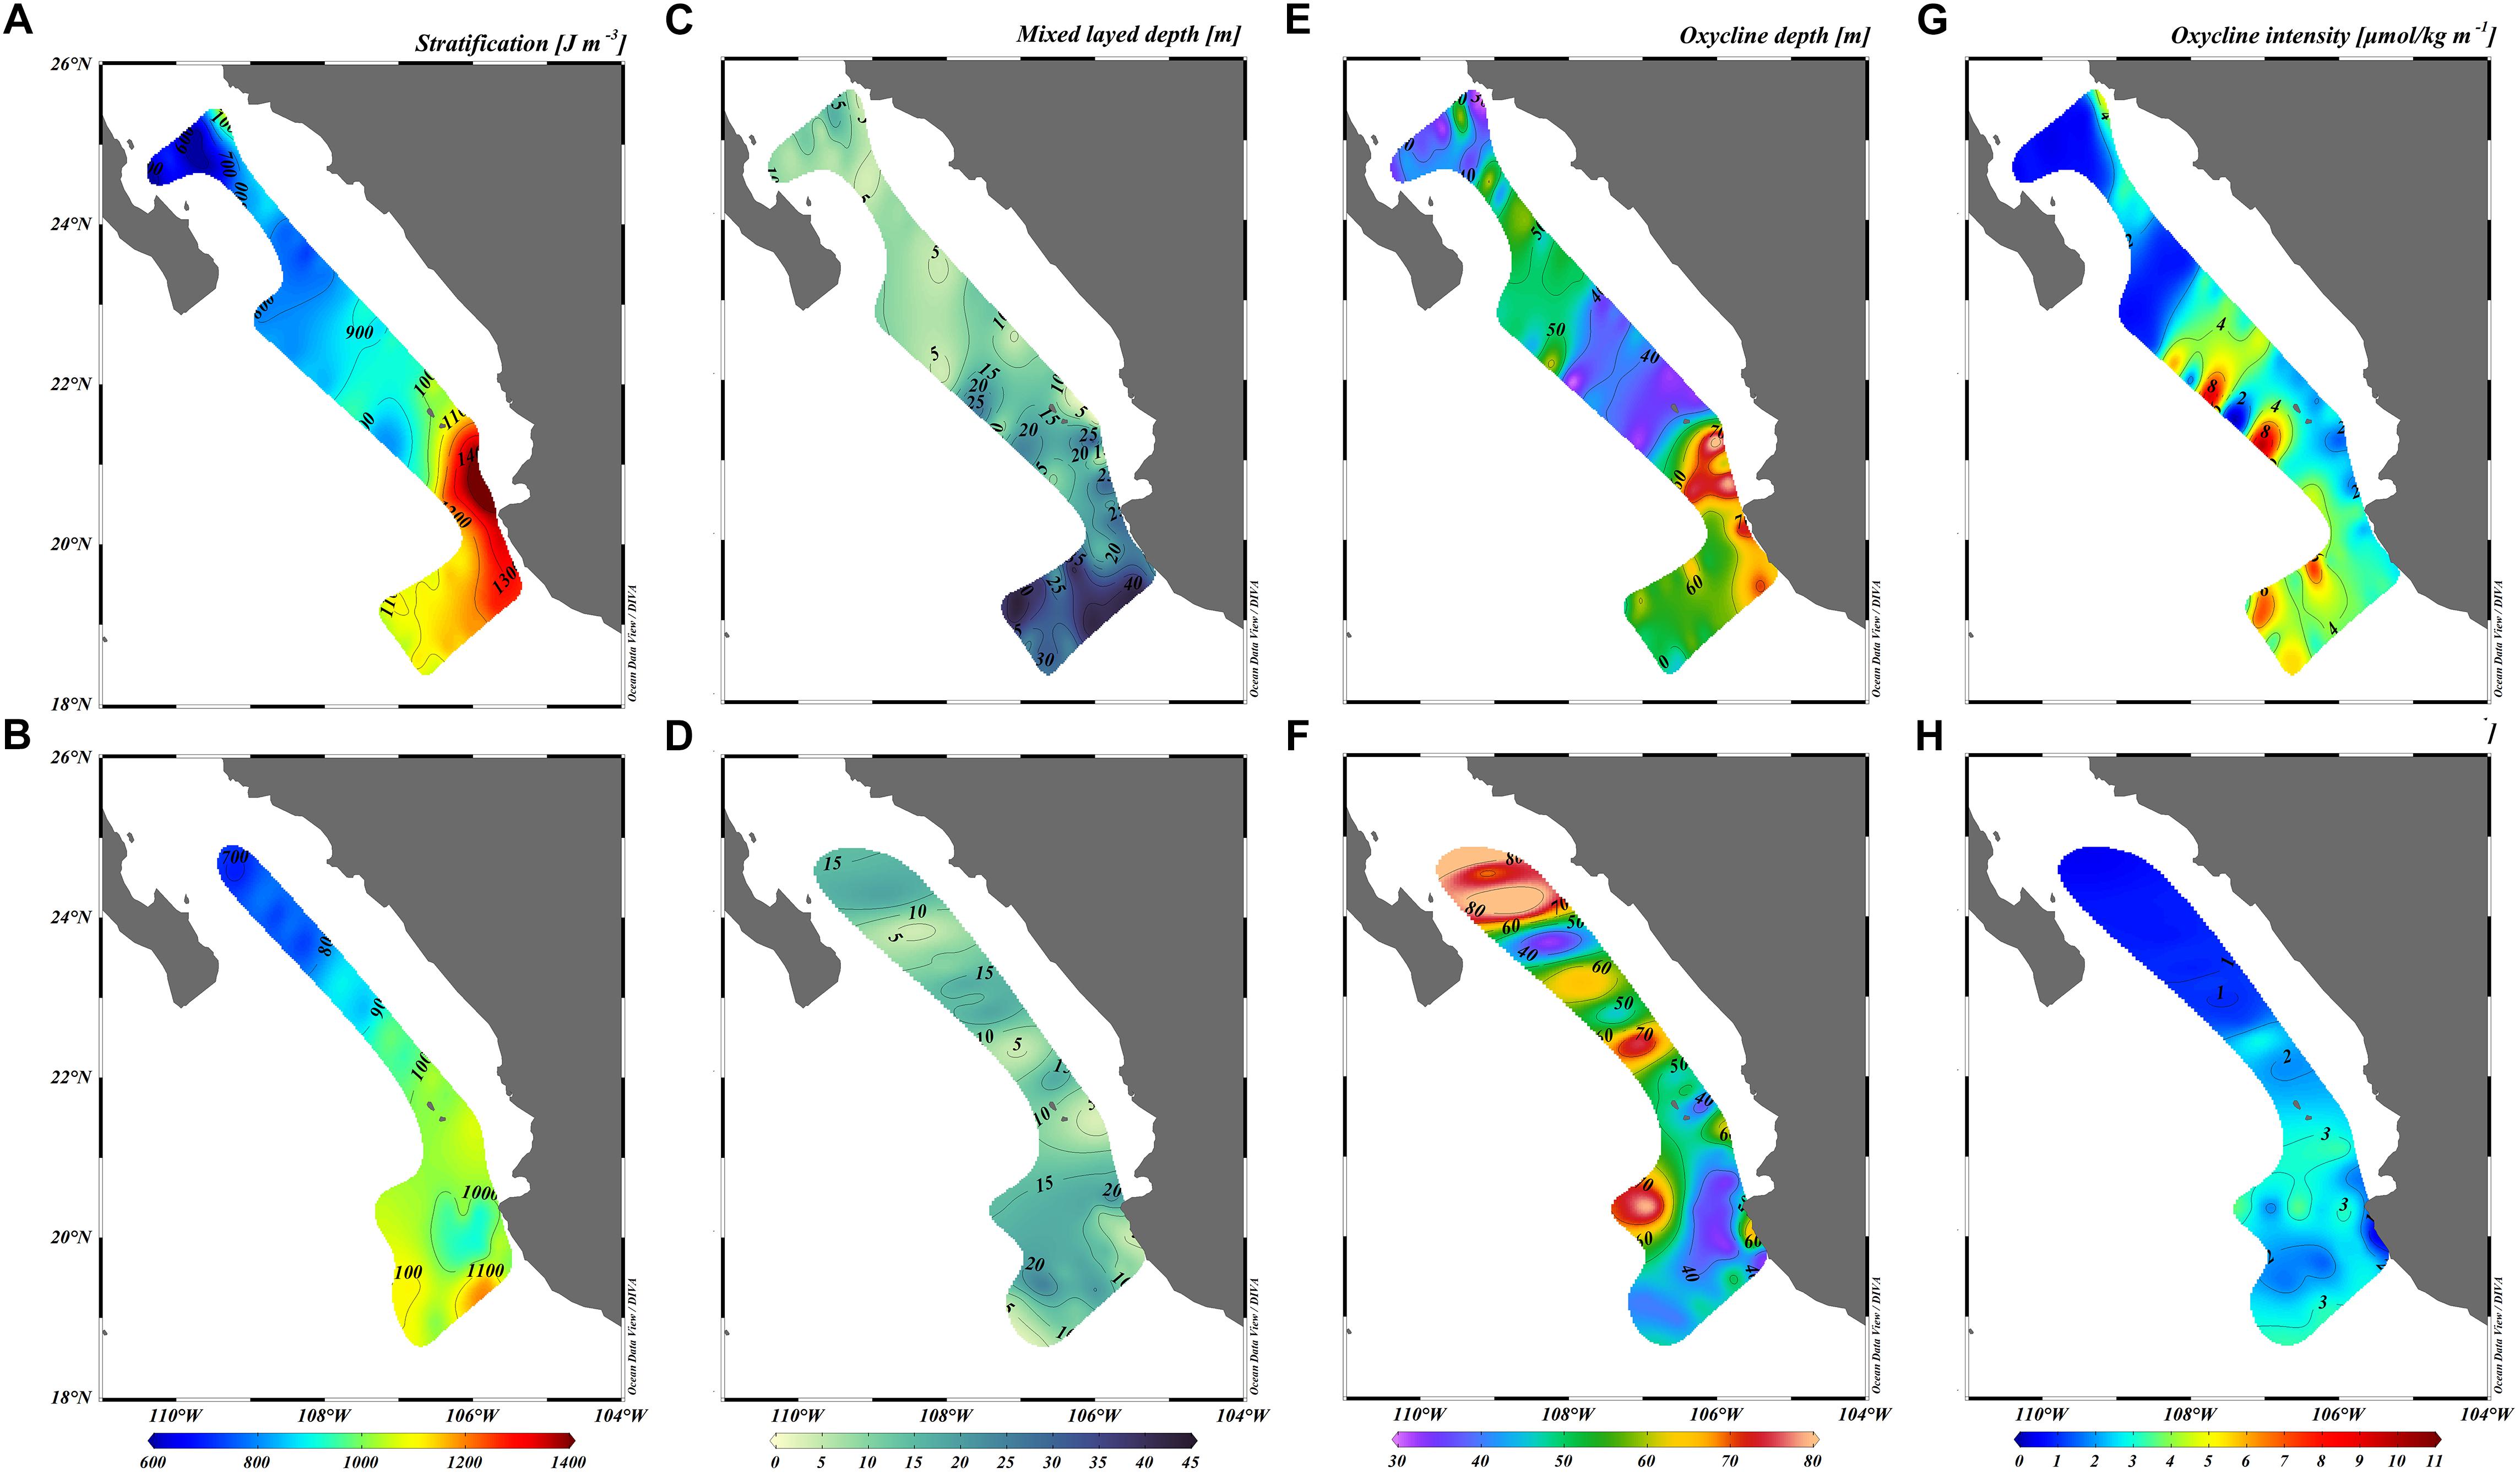
Figure 9. Isosurfaces of stratification (A,B) calculated for the first 300 m, mixed layer depth (C,D), oxycline depth (E,F), and oxycline intensity (G,H). Top figures, June 2015; bottom figures, March 2016.
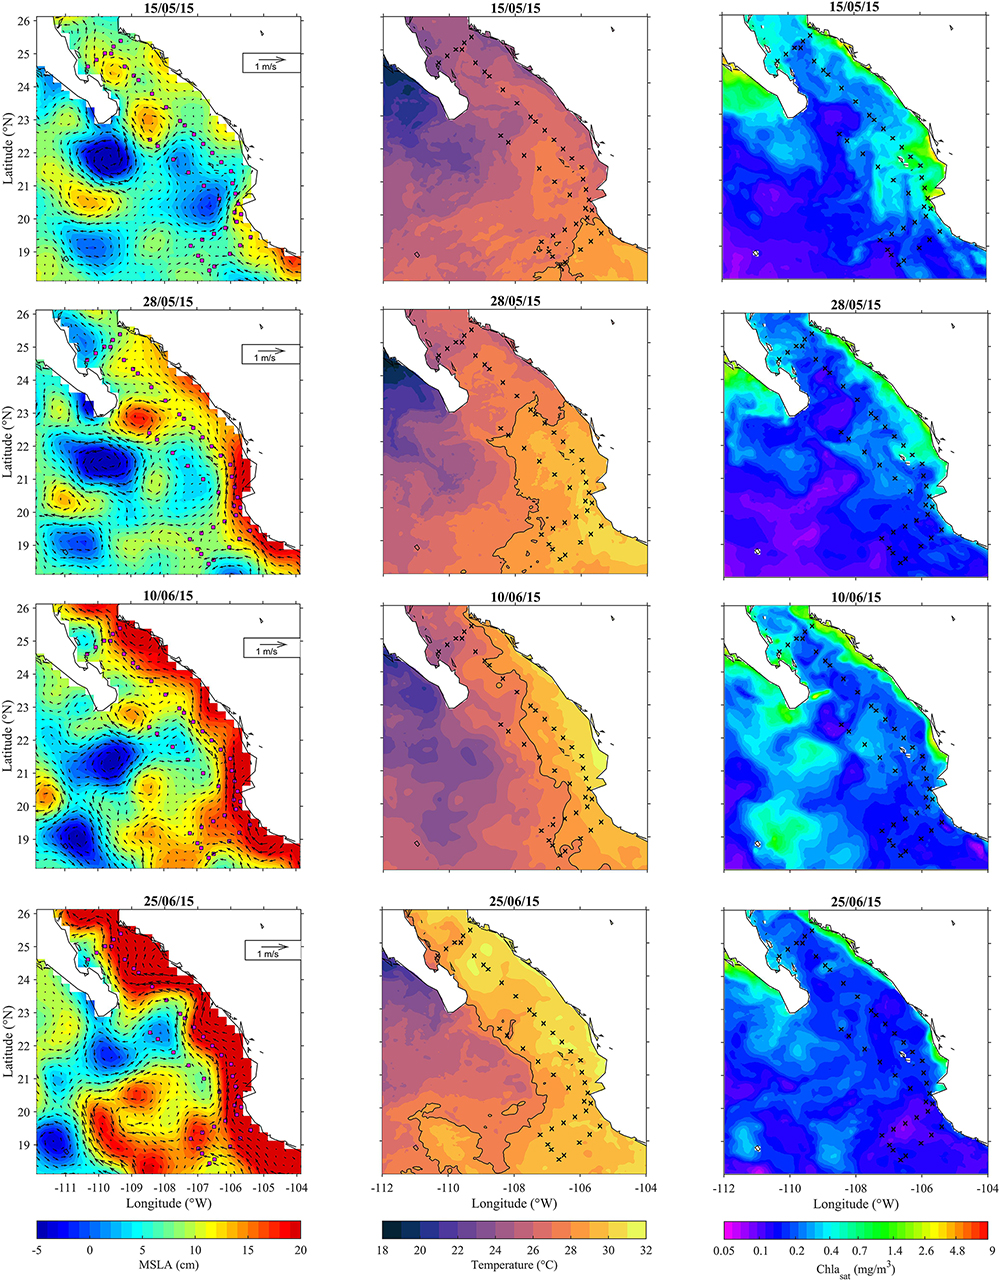
Figure 10. Daily composition of mean sea level anomaly (MSLA, distributed by Aviso), sea surface temperature (GHRSST, the isotherm of 28°C in solid line), and satellite chlorophyll (Chlasat distributed by Copernicus).
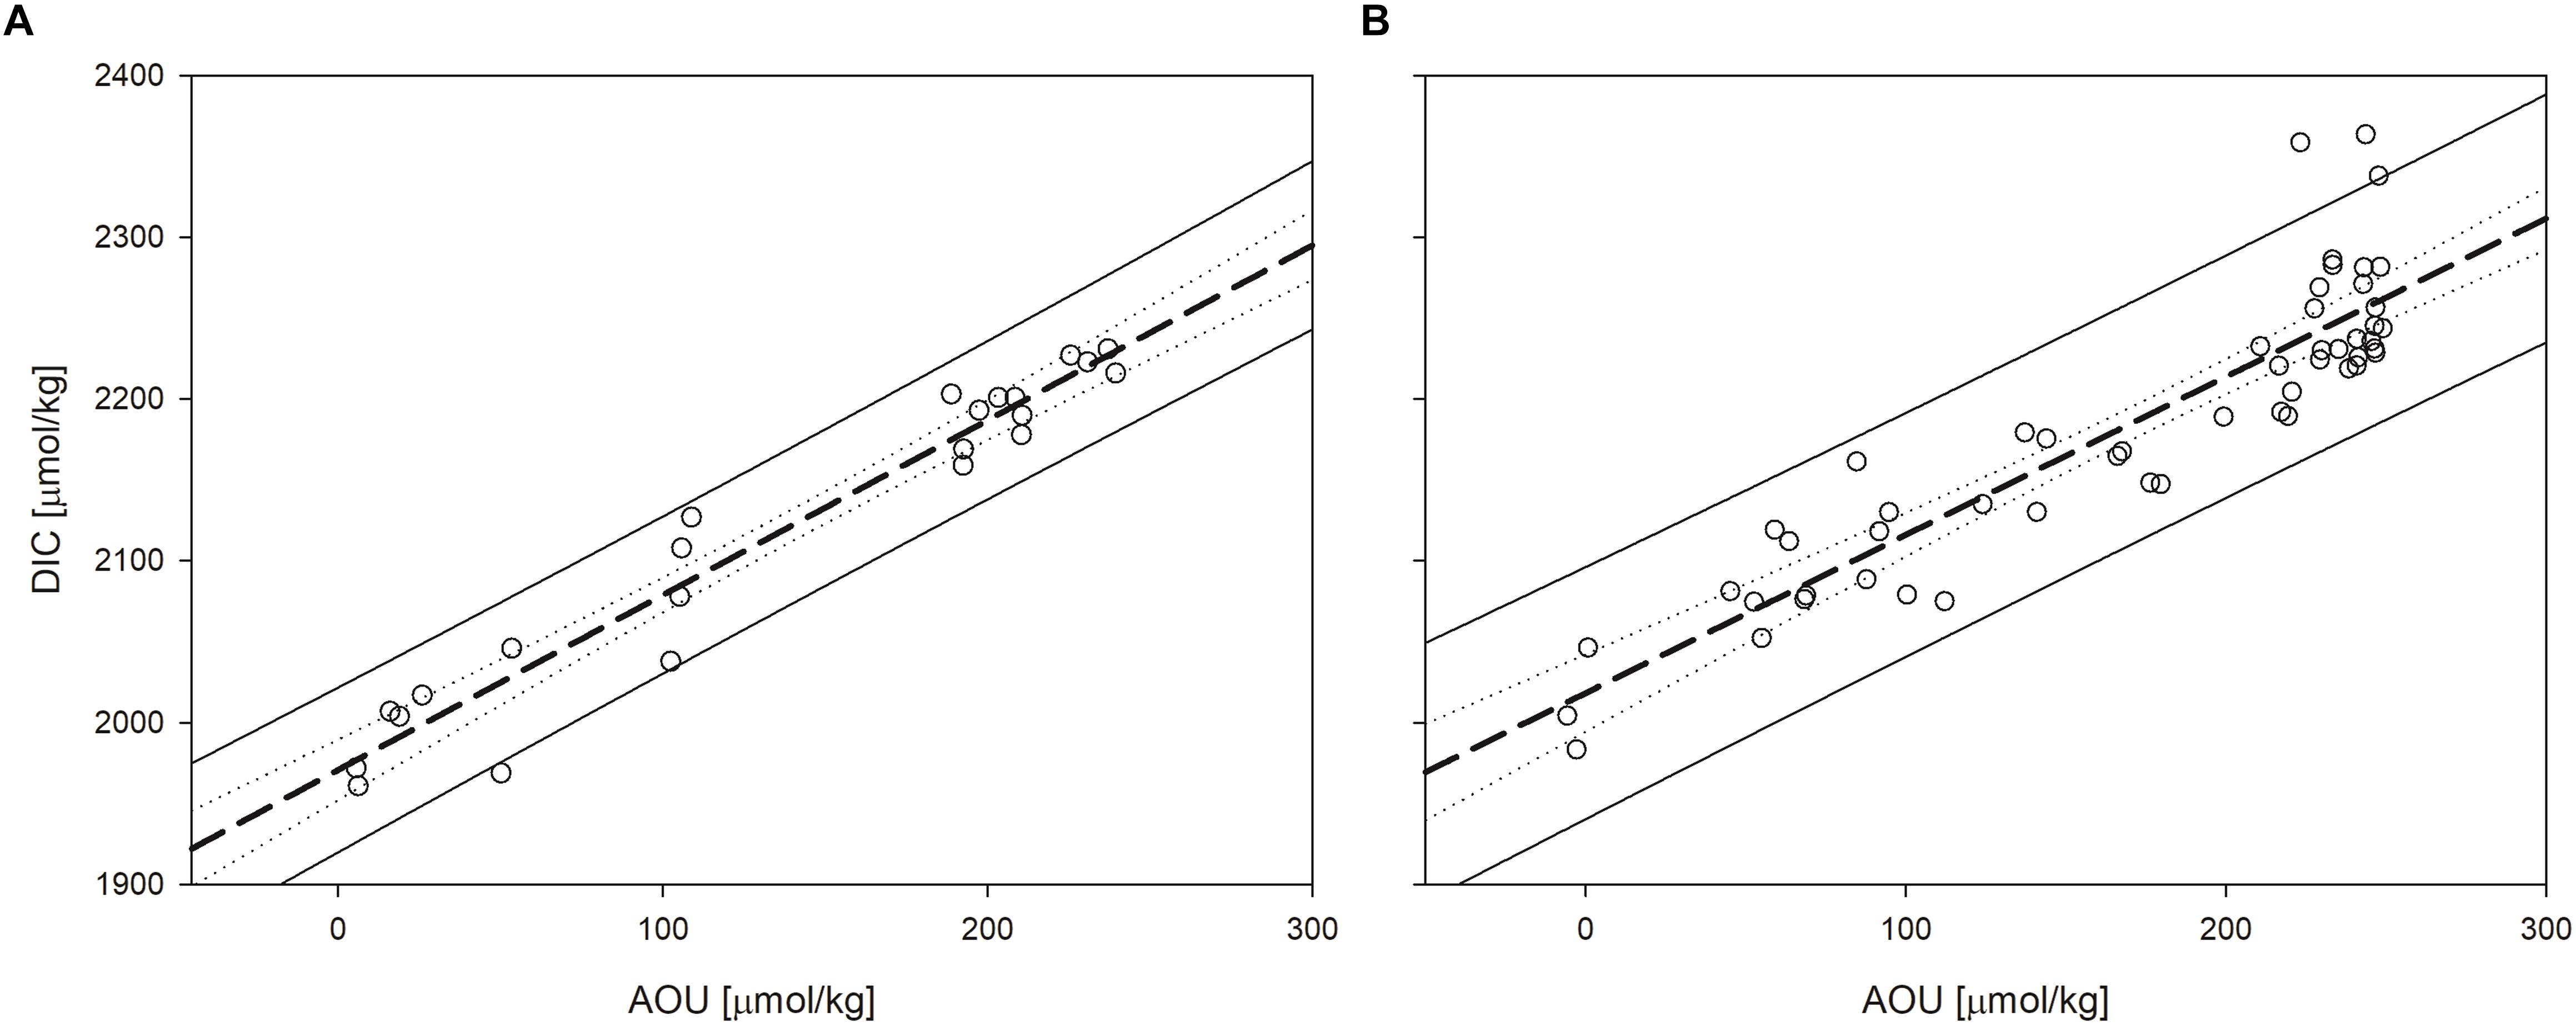
Figure 11. Comparison between apparent oxygen utilization (AOU) and dissolved inorganic carbon (DIC) along the oxycline. See text for references. (A) June 2015 and (B) March 2016.
The oxycline has been proposed as a local mechanism where the OMZ is maintained through intense remineralization processes (Paulmier et al., 2006). Given the proximity of the oxycline to the surface and the wide range of DO concentrations present (from oxic > 200 μmol⋅kg–1 to suboxic < 4.4 μmol⋅kg–1), aerobic/anaerobic and photic/aphotic processes can coexist within the oxycline, which may have concomitant repercussions in DIC and carbocline distributions (Paulmier et al., 2011). In Figure 9E we can observe how the depth of the oxycline is displaced from 40 m in the oceanic areas to below 80 m in front of Cabo Corrientes. The depth of the oxycline is closely associated with the distribution of stratification, caused by the entry of TSW with characteristics that were previously defined. This mechanism of the deepening and partial erosion of the oxycline has been described for equatorial zones (Fuenzalida et al., 2009) and Peruvian coasts (Stramma et al., 2016). The mixed later is associated with local processes, like winds, insolation, and rain (Fiedler et al., 2013). The greatest variability in the depth of the mixed layer can be found in the region of Cabo Corrientes, where sampling was carried out after the close passage of hurricane Blanca. Despite the high variability, an ocean-coast pattern can be observed (Figure 9C) where the oxycline appears close (∼10 m) to the mixed layer in the oceanic sections yet separated by 60 m near the coast. Paulmier et al. (2006) hypothesize that remineralization is more sensitive to the availability of O2 than to superficial biomass, suggesting that remineralization is “driven by oxygen.” Our results support this hypothesis as the most intense oxyclines are found when the depth of the mixed layer is close to the depth of the oxycline and stratification is reduced, favoring the availability of oxygen in this layer and driving remineralization.
In Figure 8 we presented the variation of DIC and DO along transect 1 for both latitude and depth. We also showed the established limits as a function of the analyses that were presented in this section. These limits were established according to physical-chemical characteristics determined during June 2015 and they were conserved to observe changes in the same sector during March 2016. These characteristics are dynamic and their presence can vary seasonally, principally as a function of the extension of the water masses present, but also due to forcing factors that favor dispersion and mixing.
In the region of Cabo Corrientes (region I, Figure 8A), TSW showed low DIC concentrations (∼1950 μmol⋅kg–1) associated with slightly lower dissolved oxygen concentrations (180–200 μmol⋅kg–1) than other superficial waters in the TPCM (typically > 200 μmol⋅kg–1). OMZs present associated CMZs and analogous to OMZs, CMZs also contain a carbocline in their structures (Paulmier et al., 2011; Franco et al., 2014). The vertical resolution of our sampling does not allow for a detailed description of the carbocline and, as was mentioned in the observations carried out for Figure 8, there is a certain degree of dispersion between the relationship between DIC and DO depending on the water mass observed and on the latitude in which it is found. This is mainly due to the fact that DIC, in contrast to O2, is a buffered system and responds more slowly to vertical perturbations (Paulmier et al., 2011). However, in part of the Cabo Corrientes region, a good association between the oxiplets of 4.4 and 44 μmol⋅kg–1 with DIC concentrations of 2300 and 2150 μmol⋅kg–1 was observed, related to StSsW that deepened due to the entry of TSW.
Transitional (Region II)
As the name suggests, this region is dominated at the surface by TW, which reached depths of up to 100 m (Table 2), and is the region in which the greatest instability in the water column is observed (Figure 2). The region is bounded to the north at 24.5°N by the exit of GCW as an oceanic front (Figure 3), while the southern border next to the Cabo Corrientes region is defined by the incursion of TSW (observable in Figure 9A as a stratification >1000 J⋅m–3). Stratification is lower in the transitional region, with an average of 850 J⋅m–3 and declines in a south-north gradient (∼900–700 J⋅m–3, Figure 9). In addition, this area can be divided into two separate sections by the depth of the oxycline, one section with the shallowest oxycline in all TPCM with depths less than 35 m (i.e., purple colors in Figure 9E) and another section with oxycline depths between 40 and 60 m (i.e., green colors in Figure 9E). In this region, a shallow oxycline occurred with a deep mixed layer (Figure 9C) and it is here that the greatest intensities in the oxycline were observed for all the TPCM (>8 μmol⋅kg−1⋅m–1; Figure 9G). Godínez et al. (2010) reported that 30% of the global variance in the observed circulation of the TPCM can be explained by mesoscale processes, such as the presence of eddies that can have relevant effects on the distribution of chemical variables in this region. Taking into consideration the closeness of the oxycline to the mixed layer, a lifting of the 22 kg⋅m–3 isopycnal from 50 m to the surface was found, which was also seen with the 26 kg⋅m–3 isopycnal (between 23.5 and 22°N in Figure 5A) and was associated with the passing of a cyclonic eddy between 21°N and 107°W in the days prior to beginning the cruise (Figure 10). It is around this area that we also found the greatest values of superficial pCO2 (data not presented).
Two relevant structures were observed in the vertical distribution of DIC and DO (Figure 8). The first was a lifting of waters with greater DIC concentrations and lower DO concentrations around 23–22°N associated with a reduction in the influence of highly stratified TSW waters and the presence of a cyclonic eddy (Figure 10). The second was a highly unstable zone between 23.5 and 24.5°N where a pronounced sinking of the 4.4 μmol⋅kg–1oxiplet of ∼100 m was detected, without a comparable disturbance in the CMZ (>2200 μmol⋅kg–1), along with a simultaneous lifting from 50 m depth to the surface of water with concentrations below oxygenated levels centered around 24°N. In this region, we found an intrusion at 50 m depth of CCW and the instability that was found along the border was attributed to a front between a cyclonic and an anticyclonic eddy (Figure 11).
Entrance to the Gulf of California (Region III)
This area behaved in a similar manner to what has been reported in the literature. Here, the lowest stratification for the entire TPCM was detected, with values around 600 J⋅m–3. The exit of GCW was observed on the peninsular side as a front with high salinity (Castro et al., 2006; Collins et al., 2015) as was the entrance of TW over the continental platform in front of the coasts of Sonora, in accordance with the typical circulation scheme for this zone (Lavín et al., 2009). The depth of the oxycline was shallow in comparison to the region of Cabo Corrientes, but the intensity of the oxycline was amongst the lowest recorded (Sánchez-Velasco et al., 2017). This is due to the GCW being more oxygenated and dominating depths below 150 m (Figures 3, 5), causing the oxycline to become the thickest in this region. StSsW presented shallowly on the continental side, generating a likewise shallow oxycline with intensities of 5 μmol⋅kg−1⋅m–1 and consequently, the superficial pCO2 was greater for this zone (data not shown).
March 2016
Cabo Corrientes (Region I)
With an ENSO in decline (Abellán et al., 2017; Santoso et al., 2017) and with lower stratification than the previous year (Figure 9B; ∼1100 J⋅m–3), the TSW area of influence was recorded up to 22°N (Figures 2C,D). In contrast to what occurred during spring 2015, the shallowest depth of the oxycline was found in this region (<40 m). The relationship between the intensity of the oxycline with respect to the depth of the mixed layer was not as direct as during 2016, and despite maximum intensities being lower compared with 2015 (50% less), it is in the area under the influence of TSW where we find the greatest values of oxycline intensity (2–4 μmol⋅kg−1⋅m–1; Paulmier et al. (2006) define as intense those oxycline > 1 μmol⋅kg−1⋅m–1). The vertical structure of the OMZ appeared to recover toward average conditions (Figure 5), where the oxyplets of 40 and 4.4 μmol⋅kg–1deepen in a south-north gradient (Cepeda-Morales et al., 2013). The content of DIC in the CMZ decreased with regard to the previous year (Figure 3 and Table 2), probably due to a reduced presence of StSsW during March 2016. This same reduction is observed by Franco et al. (2014) for pCO2 in oceanic sampling stations during August 2010.
Transitional (Region II)
The transitional region proved to be more stable than during the previous year; however, fluctuations in various characteristics were still present. The depth of the oxycline was variable throughout the entire region, as shown in Figure 9F, and in the undulations of the 44 μmol⋅kg–1oxyplet shown in Figure 5B. This area shows stratification lower than 900 J⋅m–3 and the depth mixed layer varies between 5 and 15 m. There is also a lifting of the CMZ (Figure 8B), principally due to the entry of GCW between 50 and 100 m (Figure 3D). However, this shallowing does not show significant repercussions in the superficial values of pCO2 (not shown). The region of the entrance to the Gulf of California was only limited to the structure described in the previous sentence.
Ventilation of the OMZ Due to ENSO 2015–2016
For March 2016, in contrast to spring of the previous year, the presence of TSW did not originate apparent variations in the climatological seasonal distribution of DO. This is due to the relaxation of local ENSO effects (Sánchez-Velasco et al., 2017) and to the return of oceanographic conditions closer to the seasonal climatology (Figure 2B), where the influence of TSW in the TPCM during winter periods was still present and was the result of the incursions of this water mass during spring and autumn (Portela et al., 2016).
Cepeda-Morales et al. (2013) showed that a transition zone exists between 23 and 20°N where the influence of StSsW disappears and the upper portion of the OMZ is forced toward greater depths due to the intrusion of CCW transported by the interaction between eddies and the Tropical Branch of the CC. This intrusion has been observed and reported previously (Lavín et al., 2009). This mechanism may explain the positive DO anomaly related to the incursion of CCW and to the presence of two eddies, one cyclonic and one anticyclonic around this area (Figure 10).
Fuenzalida et al. (2009) report the erosion of the oxycline due to ENSO effects along the Peruvian coasts, observing a rapid re-establishment of a shallow mixed layer associated with an intense oxycline. Even though we did not detect a complete erosion of the oxycline during the incursion of TSW in June 2016, our data show that there was an intensification of the same where this water mass was detected (Figure 9G). The latter suggests that in Figure 5B we might be observing the reestablishment of the oxycline in the region.
Due to the relatively high variability in the relationship between DIC and DO, a selection of the stations that presented the greatest intensities of the oxycline (>3 μmol⋅kg−1⋅m–1for June 2015 and >2.5 μmol⋅kg−1⋅m–1for March 2016) and that were contained within the depth range of the oxycline was carried out. This was done to evaluate the relationship between the production of DIC and biological activity in this layer. To do this, a linear regression of DIC versus apparent oxygen utilization (AOU) was carried out. The results are presented in Figure 11 and show a relationship of: DIC = 0.9777 × AOU + 2018.34 (rP = 0.9075, p < 0.0001) for March 2015 and DIC = 1.0807 × AOU + 1970.81 (rP = 0.9727, p < 0.0001) for June 2016. Maske et al. (2010) report a molar relationship for the zone between DIC and AOU of 0.79 during March 2005. It is complicated to interpret this molar relationship in terms of which metabolic activity is acting given the wide range in oxygen concentration. However, we can observe a tendency of AOU to increase in the TPCM with the passage of the ENSO.
In addition, the pHT values were strongly correlated with DIC values for both cruises (Figure 12; rp = 0.90 for June 2015 and rp = 0.88 for March 2016) and the distribution of pHT presented in the same manner throughout each cruise. However, differences are present in the relationship between these two variables and between one year and the next. In general terms, greater pHT values were present during March 2016 for the same observed concentration of DIC than in June 2015. This is more notable for greater concentrations of DIC (>2200 μmol⋅kg–1), while for DIC values close to typical surface values (1900–2000 μmol⋅kg–1), the data for both cruises tend to present greater similarity. This could be possibly explained as the result of a lower presence of StSsW and a relative greater contribution of TSW toward the end of the El Niño 2015–2016. Alternatively, the suppression of nutrient availability as a presence of oligotrophic, warmer, and higher stratified water could cause a drop in the biological pump. Evidence of this explanation is observed in Figure 11, by the presence of the incursion of warmer water (>28°C, solid line) associated to positive MSLA and a marked drop in chlorophyll in the coastal area where this water was present.
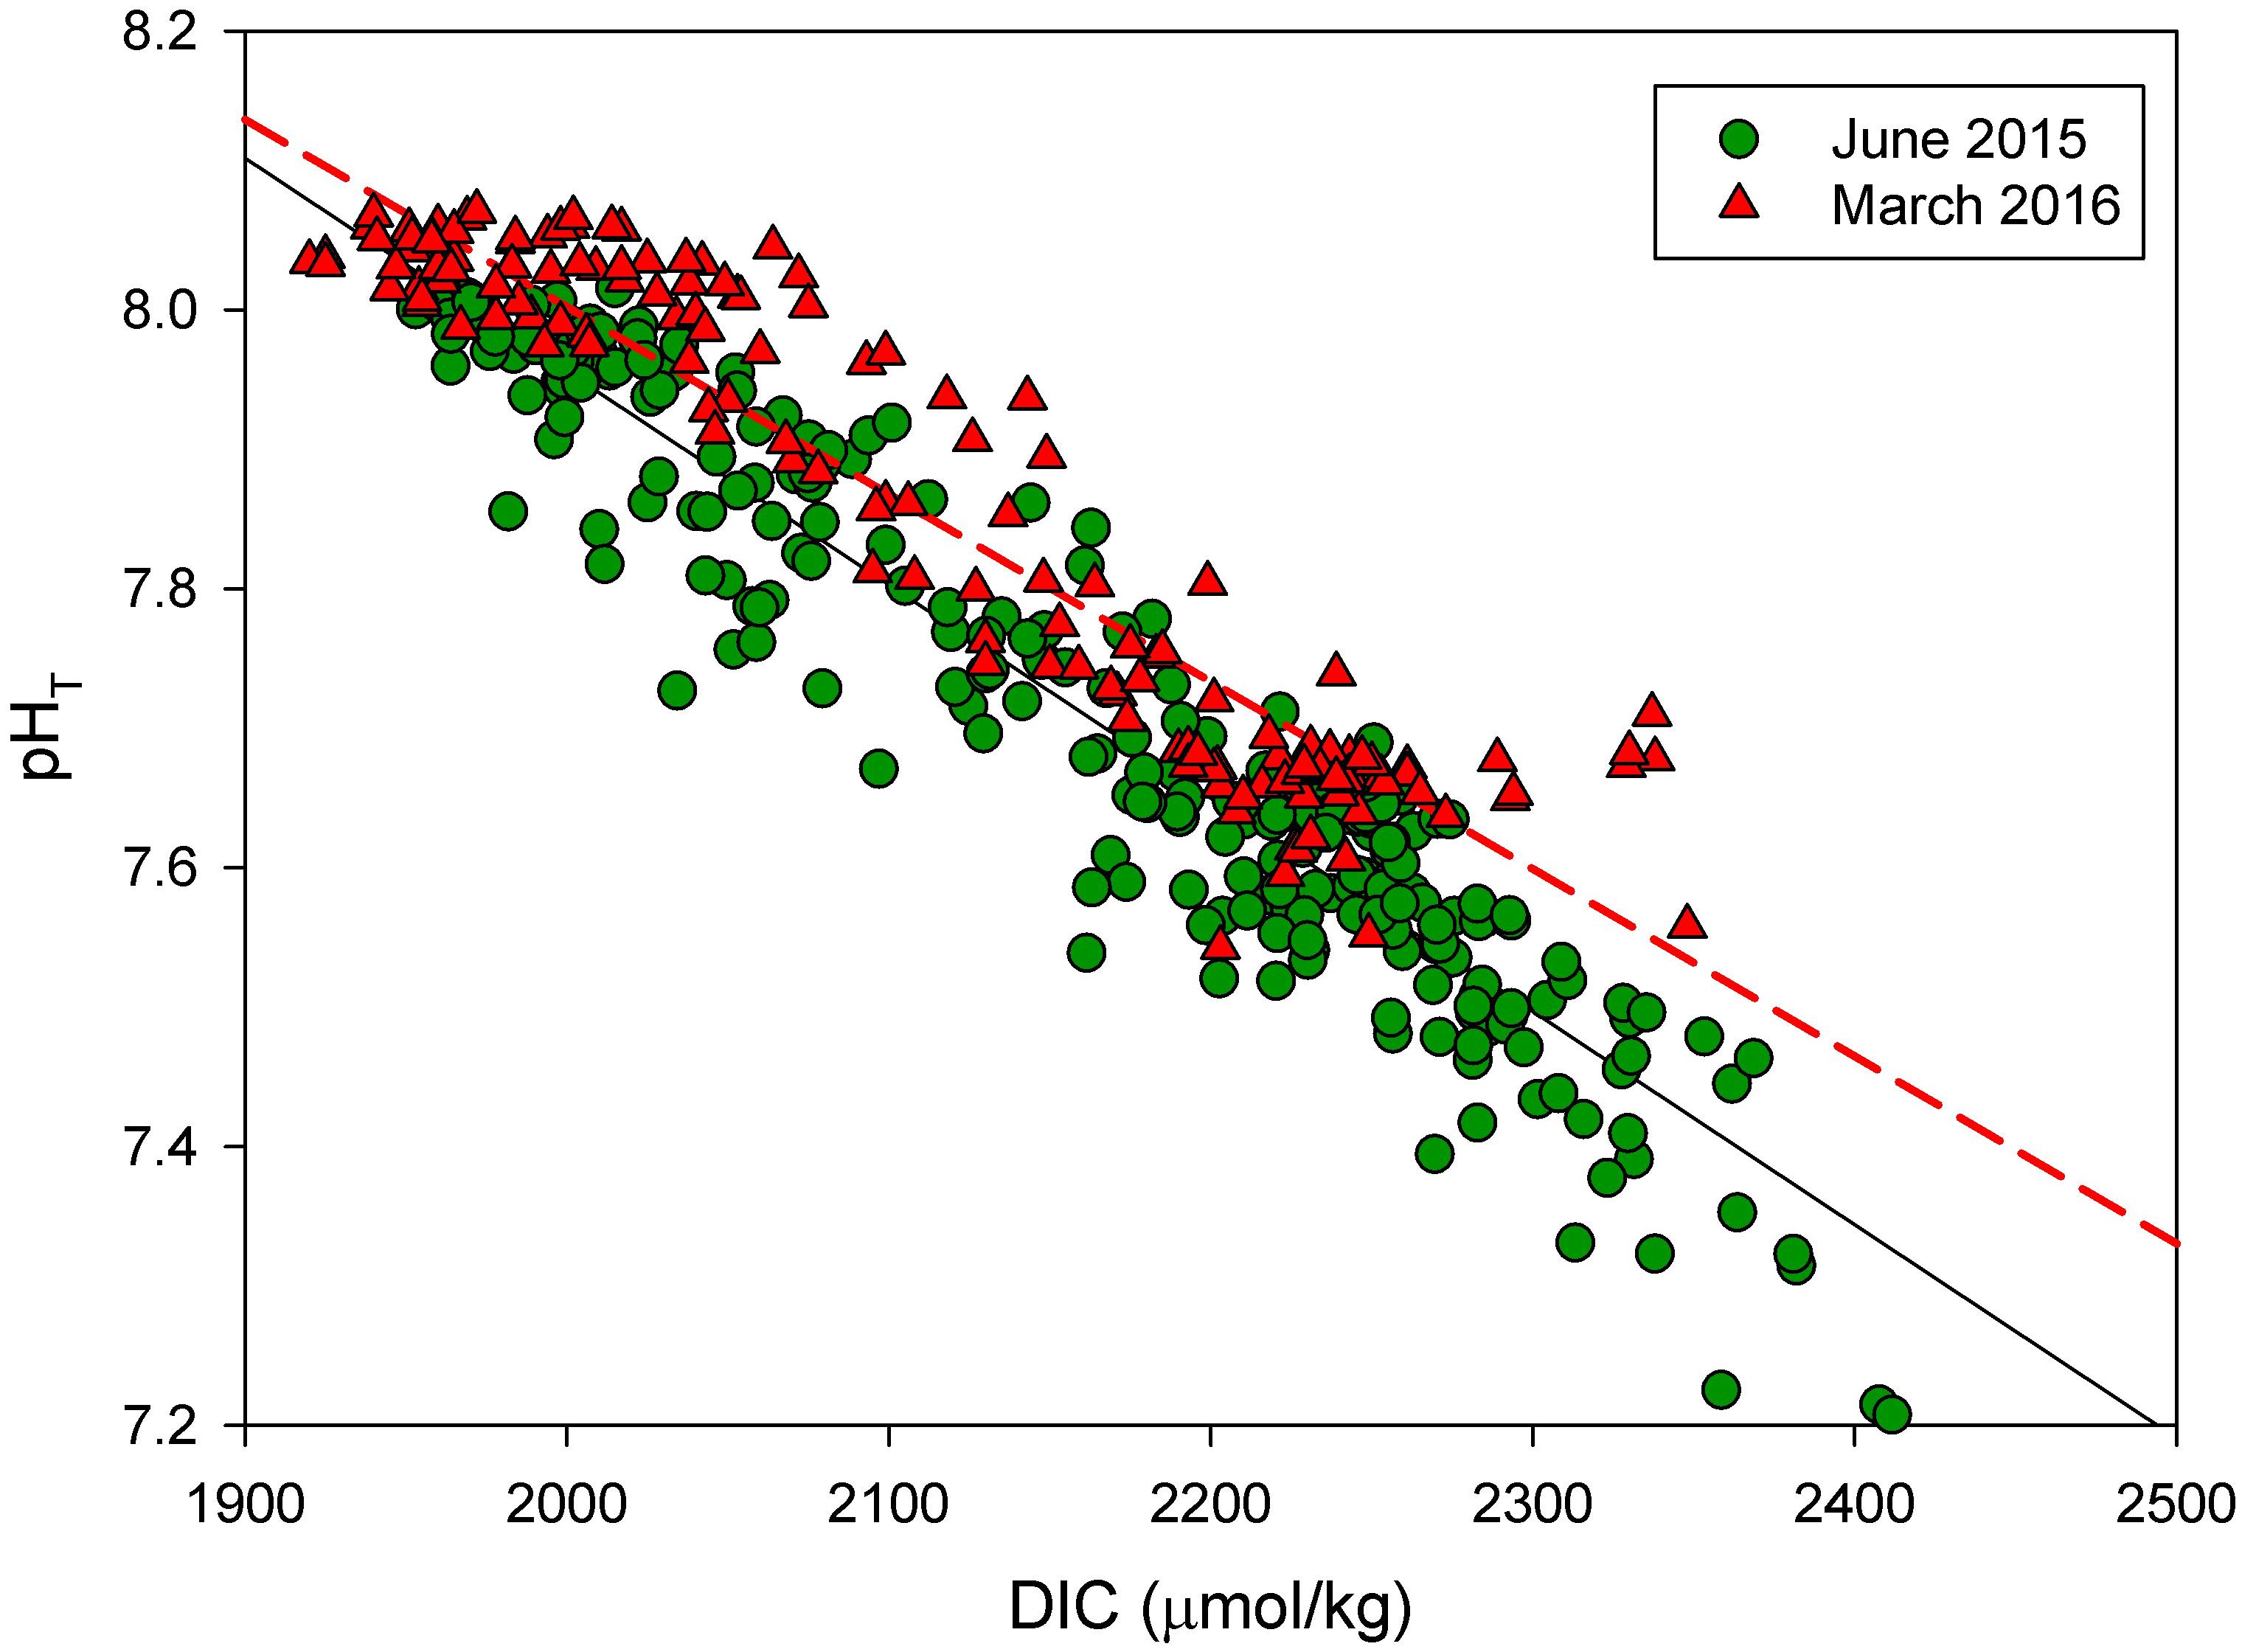
Figure 12. Comparison between dissolved inorganic carbon (DIC) and pH in total scale (pHT).
Paulmier et al. (2006) suggests control over biological activity in the OMZ as a function of the availability of oxygen. Ito and Deutsch (2013), from the results of their biogeochemical modeling of the tropical Pacific, highlight that heat content and respiration rates are highly correlated with the ENSO, suggesting that a deeper and warmer thermocline contains a greater quantity of oxygen because of changes in the biological consumption of oxygen due to a reduction in supply of nutrients from the surface. This mechanism, in conjunction with the sinking of StSsW to below the depth of incursion of TSW, may be operating in the southern portion of our study area, where the greatest anomalies of DO were present (Figure 6) as well as where the lowest values of DIC were found during the sampling periods (Table 2 and Figure 2). These results agree with what has been reported in the literature for other areas, where the influence of the ENSO on the depth and structure of the OMZ and oxycline has been established (Morales et al., 1999; Fuenzalida et al., 2009; Czeschel et al., 2012).
Conclusion
The southern region of the TPCM was dominated at the surface by seasonally anomalous TSW as a result of a developing ENSO. Its presence modified the structure of the OMZ, partially eroding it while intensifying the oxycline, which had repercussions for the structure of the CMZ.
In the transition region, the carbon system was modulated by mesoscale processes. This region was dominated by TW and presented subsurface intrusions of more oxygenated CCW, which deepened the OMZ without altering the distribution of the CMZ. The presence of cyclonic eddies resulted in a lifting of the isopycnals in the central portion and the superficial enrichment of DIC.
The northern region was dominated by the exit of GCW on the peninsular side, where the OMZ deepened to below 200 m, and by the entry of TW on the continental side. In the latter, StSsW was close to the surface resulting in greater concentrations of DIC.
After these events, a return to close-to-average conditions was observed with regard to the structure of the OMZ during winter 2016. DIC concentrations diminished toward the interior of StSsW.
There is a strong regionalization of physical factors that control the distribution of dissolved oxygen and the variables of the seawater CO2 system, which is principally modulated by the advection of water masses in the northern and southern regions and by the presence of mesoscale processes in the central region.
Author Contributions
The conceptualization and arrangement of the original manuscript were under the charge of PT-P, JH-A, ES-d-A, and EB. The conceptual design and financial support of the oceanographic expeditions were under the direction of LS-V. All CTD data were facilitated through LS-V. Preprocessing of all data was carried out by VG. Laboratory analyses were conducted by PT-P and ON. All authors contributed equally to the reworking of the original manuscript toward the submitted version.
Funding
This work was supported by the project (2014-236864) “Influencia de remolinos de mesoescala sobre hábitats de larvas de peces (con énfasis en especies de importancia comercial) en la zona de mínimo de oxígeno del océano Pacífico frente a México: Océano abierto y efecto de islas,” the project SEP – CONACyT (#2011-168034-T) “Un estudio de la Corriente Costera Mexicana y el Pacífico adyacente, con un ‘SeaGlider,’ cruceros oceanográficos y datos de satélite,” and the project CONACyT Fronteras de la Ciencia 180 “Probando paradigmas sobre la expansión de la zona de mínimo de oxigeno: reducción del hábitat vertical del zooplancton y su efecto en el ecosistema pelágico mediante métodos autónomos.” Funding came from CONACyT, Mexico, through the Grant 412049 for the M.Sc. studies of PT-P.
Conflict of Interest Statement
The authors declare that the research was conducted in the absence of any commercial or financial relationships that could be construed as a potential conflict of interest.
Acknowledgments
We would like to thank the crew on board of the R/V Alpha Helix for their support during the sampling cruises. We would also like to give special recognition to Dr. María del Carmen Avila López and José Jonatan Santander Cruz, M.Sc., for their support in analyzing the TA samples, and to the researchers and students in the aquatic biogeochemistry seminar for their comments enriched this work. Finally we want to give special thanks to the reviewers for their excellent comments and suggestions.
Footnotes
- ^ http://odv.awi.de
- ^ https://www.aviso.altimetry.fr/
- ^ https://www.ghrsst.org/
- ^ http://marine.copernicus.eu/
- ^ http://www.cpc.ncep.noaa.gov/
References
Abellán, E., McGregor, S., England, M. H., and Santoso, A. (2017). Distinctive role of ocean advection anomalies in the development of the extreme 2015–16 El Niño. Clim. Dyn. 51, 2191–2208. doi: 10.1007/s00382-017-4007-0
Apango-Figueroa, E., Sánchez-Velasco, L., Lavín, M. F., Godínez, V. M., and Barton, E. D. (2015). Larval fish habitats in a mesoscale dipole eddy in the gulf of California. Deep Res. Part I 103, 1–12. doi: 10.1016/j.dsr.2015.05.005
Bond, N. A., Cronin, M. F., Freeland, H., and Mantua, N. (2015). Causes and impacts of the 2014 warm anomaly in the NE Pacific. Geophys. Res. Lett. 42, 3414–3420. doi: 10.1002/2015GL063306
Canfield, D. E., Stewart, F. J., Thamdrup, B., De Brabandere, L., Dalsgaard, T., Delong, E. F., et al. (2010). A cryptic sulfur cycle in oxygen-minimum-zone waters off the chilean coast. Science 330, 1375–1379. doi: 10.1126/science.1196889
Castro, R., and Durazo, R. (2000). Variación estacional de la temperatura y salinidad en la entrada del Golfo de California, México. Ciencias Mar. 26, 561–583.
Castro, R., Durazo, R., Mascarenhas, A., Collins, C. A., and Trasviña, A. (2006). Thermohaline variability and geostrophic circulation in the southern portion of the Gulf of California. Deep Res. Part I Oceanogr. Res. Pap. 53, 188–200. doi: 10.1016/j.dsr.2005.09.010
Cepeda-Morales, J., Beier, E., Gaxiola-Castro, G., Lavín, M. F., and Godínez, V. M. (2009). Efecto de la zona del mínimo de oxígeno en el segundo máximo de clorofila en el Pacífico Oriental Tropical Mexicano. Ciencias Mar. 35, 389–403.
Cepeda-Morales, J., Gaxiola-Castro, G., Beier, E., and Godínez, V. M. (2013). The mechanisms involved in defining the northern boundary of the shallow oxygen minimum zone in the eastern tropical Pacific Ocean off Mexico. Deep Res. Part I Oceanogr. Res. Pap. 76, 1–12. doi: 10.1016/j.dsr.2013.02.004
Chapa-Balcorta, C., Hernandez-Ayon, J. M., Durazo, R., Beier, E., Alin, S. R., and López-Pérez, A. (2015). Influence of post-Tehuano oceanographic processes in the dynamics of the CO2 system in the Gulf of Tehuantepec. Mexico J. Geophys. Res. Ocean 120, 7752–7770. doi: 10.1002/2015JC011249
Clayton, T. D., and Byrne, R. H. (1993). Spectrophotometric seawater pH measurements: total hydrogen results. Deep Sea Res. Part I Oceanogr. Res. Pap. 40, 2115–2129. doi: 10.1016/0967-0637(93)90048-8
Collins, C. A., Castro, R., and Mascarenhas, A. (2015). Properties of an upper ocean front associated with water mass boundaries at the entrance to the Gulf of California, November 2004. Deep Sea Res. Part II Top. Stud. Oceanogr. 119, 48–60. doi: 10.1016/j.dsr2.2014.06.002
Czeschel, R., Stramma, L., and Johnson, G. C. (2012). Oxygen decreases and variability in the eastern equatorial Pacific. J. Geophys. Res. Ocean 117, 1–12. doi: 10.1029/2012JC008043
Davies, S. M., Sánchez-Velasco, L., Beier, E., Godínez, V. M., Barton, E. D., and Tamayo, A. (2015). Three-dimensional distribution of larval fish habitats in the shallow oxygen minimum zone in the eastern tropical Pacific Ocean off Mexico. Deep Res. Part I Oceanogr. Res. Pap. 101, 118–129. doi: 10.1016/j.dsr.2015.04.003
Dickson, A. G., Afghan, J. D., and Anderson, G. C. (2003). Reference materials for oceanic CO2 analysis: a method for the certification of total alkalinity. Mar. Chem. 80, 185–197. doi: 10.1016/S0304-4203(02)00133-130
Dickson, A. G., Sabine, C. L., and Christian, J. R. (2007). Guide to Best Practices for Ocean CO2 Measurements. Sidney, BC: North Pacific Marine Science Organization.
Douglas, N. K., and Byrne, R. H. (2017). Achieving accurate spectrophotometric pH measurements using unpurified meta-cresol purple. Mar. Chem. 190, 66–72. doi: 10.1016/j.marchem.2017.02.004
Fernández-Álamo, M. A., and Färber-Lorda, J. (2006). Zooplankton and the oceanography of the eastern tropical Pacific: a review. Prog. Oceanogr. 69, 318–359. doi: 10.1016/j.pocean.2006.03.003
Fiedler, P. C., Mendelssohn, R., Palacios, D. M., and Bograd, S. J. (2013). Pycnocline variations in the eastern tropical and north pacific, 1958-2008. J. Clim. 26, 583–599. doi: 10.1175/JCLI-D-11-00728.1
Fiedler, P. C., and Talley, L. D. (2006). Hydrography of the eastern tropical Pacific: a review. Prog. Oceanogr. 69, 143–180. doi: 10.1016/j.pocean.2006.03.008
Franco, A. C., Hernández-Ayón, J. M., Beier, E., Garçon, V., Maske, H., Paulmier, A., et al. (2014). Air-sea CO2 fluxes above the stratified oxygen minimumzone in the coastal region offMexico. J. Geophys. Res. Ocean. 119, 1–15. doi: 10.1002/2013JC009337
Fuenzalida, R., Schneider, W., Garcpes-Vargas, J., Bravo, L., and Lange, C. (2009). Vertical and horizontal extension of the oxygen minimum zone in the eastern South Pacific Ocean. Deep. Res. Part II 56, 992–1008. doi: 10.1016/j.dsr2.2008.11.001
Garcia, H. E., and Gordon, L. I. (1992). Oxygen solubility in seawater: better fitting equations. Limnol. Oceanogr. 37, 1307–1312. doi: 10.4319/lo.1992.37.6.1307
Godínez, V. M., Beier, E., Lavín, M. F., and Kurczyn, J. A. (2010). Circulation at the entrance of the Gulf of California from satellite altimeter and hydrographic observations. J. Geophys. Res. Ocean 115, 1–15. doi: 10.1029/2009JC005705
Gómez-Valdivia, F., Parés-Sierra, A., and Flores-Morales, A. L. (2015). The mexican coastal current: a subsurface seasonal bridge that connects the tropical and subtropical Northeastern Pacific. Cont. Shelf Res. 110, 100–107. doi: 10.1016/j.csr.2015.10.010
Hartmann, D. L. (2015). Pacific sea surface temperature and the winter of 2014. Geophys. Res. Lett. 42, 1894–1902. doi: 10.1002/2015GL063083
Hofmann, A. F., Peltzer, E. T., Walz, P. M., and Brewer, P. G. (2011). Hypoxia by degrees: establishing definitions for a changing ocean. Deep Res. Part I Oceanogr. Res. Pap. 58, 1212–1226. doi: 10.1016/j.dsr.2011.09.004
Ito, T., and Deutsch, C. (2013). Variability of the oxygen minimum zone in the tropical North Pacific during the late twentieth century. Glob. Biogeochem. Cycles 27, 1119–1128. doi: 10.1002/2013GB004567
Kalvelage, T., Lavik, G., Lam, P., Contreras, S., Arteaga, L., Löscher, C. R., et al. (2013). Nitrogen cycling driven by organic matter export in the South Pacific oxygen minimum zone. Nat. Geosci. 6, 228–234. doi: 10.1038/ngeo1739
Kara, A. B., Rochford, P. A., and Hurlburt, H. E. (2000). An optimal definition for ocean mixed layer depth. J. Geophys. Res. 105821, 803–816. doi: 10.1029/2000JC900072
Keeling, R. F., and Garcia, H. E. (2002). The change in oceanic O 2 inventory associated with recent global warming. Proc. Natl. Acad. Sci. U.S.A. 99, 7848–7853. doi: 10.1073/pnas.122154899
Kurczyn, J. A., Beier, E., Lavín, M. F., and Chaigneau, A. (2012). Mesoscale eddies in the northeastern Pacific tropical-subtropical transition zone: statistical characterization from satellite altimetry. J. Geophys. Res. Ocean 117:C10021. doi: 10.1029/2012JC007970
Kurczyn, J. A., Beier, E., Lavín, M. F., Chaigneau, A., and Godínez, V. M. (2013). Anatomy and evolution of a cyclonic mesoscale eddy observed in the northeastern Pacific tropical-subtropical transition zone. J. Geophys. Res. Ocean 118, 5931–5950. doi: 10.1002/2013JC20437
Lavín, M. F., Beier, E., Gómez-Valdés, J., Godínez, V. M., and García, J. (2006). On the summer poleward coastal current off SW México. Geophys. Res. Lett. 33, 2–5. doi: 10.1029/2005GL024686
Lavín, M. F., Castro, R., Beier, E., and Godínez, V. M. (2013). Mesoscale eddies in the southern Gulf of California during summer: characteristics and interaction with the wind stress. J. Geophys. Res. Ocean 118, 1367–1381. doi: 10.1002/jgrc.20132
Lavín, M. F., Castro, R., Beier, E., GodInez, V. M., Amador, A., and Guest, P. (2009). SST, thermohaline structure, and circulation in the southern gulf of California in june 2004 during the north american monsoon experiment. J. Geophys. Res. Ocean 114, 1–22.
Lewis, E., and Wallace, D. (1998). Program Developed for CO2 System Calculations. Washington, DC: United States Department of Energy.
Liu, X., Patsavas, M. C., and Byrne, R. H. (2011). Purification and characterization of meta-cresol purple for spectrophotometric seawater ph measurements. Environ. Sci. Technol. 45, 4862–4868. doi: 10.1021/es200665d
Maske, H., Medrano, R. C., Castro, A. T., Mercado, A. J., Jauregui, C. O. A., Castro, G. G., et al. (2010). Inorganic carbon and biological oceanography above a shallow oxygen minimum in the entrance to the Gulf of California in the Mexican Pacific. Limnol. Oceanogr. 55, 481–491. doi: 10.4319/lo.2009.55.2.0481
McDougall, T. J., and Barker, P. M. (2017). Getting Started with TEOS-10 and the Gibbs Seawater (GSW) Oceanographic Toolbox. Paris: SCOR.
Morales, C. E., Hormazábal, S. E., and Blanco, J. (1999). Interannual variability in the mesoscale distribution of the depth of the upper boundary of the oxygen minimum layer off northern Chile (18–24S): implications for the pelagic system and biogeochemical cycling. J. Mar. Res. 57, 909–932. doi: 10.1357/002224099321514097
Paulmier, A., and Ruiz-Pino, D. (2009). Oxygen minimum zones (OMZs) in the modern ocean. Prog. Oceanogr. 80, 113–128. doi: 10.1016/j.pocean.2008.08.001
Paulmier, A., Ruiz-Pino, D., and Garçon, V. (2011). CO2 maximum in the oxygen minimum zone (OMZ). Biogeosciences 8, 239–252. doi: 10.5194/bg-8-239-2011
Paulmier, A., Ruiz-Pino, D., Garçon, V., and Farías, L. (2006). Maintaining of the eastern south pacific oxygen minimum zone (OMZ) off Chile. Geophys. Res. Lett. 33, 2–7. doi: 10.1029/2006GL026801
Portela, E., Beier, E. J., Barton, E. D., Castro, R., Godínez, V., Palacios-Hernández, E., et al. (2016). Water masses and circulation in the tropical Pacific off central Mexico and surrounding areas. J. Phys. Oceanogr. 46, 3069–3081. doi: 10.1175/JPO-D-16-0068.1
Rabalais, N. N., Díaz, R. J., Levin, L. A., Turner, R. E., Gilbert, D., and Zhang, J. (2010). Dynamics and distribution of natural and human-caused hypoxia. Biogeosciences 7, 585–619. doi: 10.5194/bg-7-585-2010
Sánchez-Velasco, L., Beier, E., GodInez, V. M., Barton, E. D., Santamaría-del-Angel, E., Jiménez-Rosenberg, S. P. A., et al. (2017). Hydrographic and fish larvae distribution during the “Godzilla El Niño 2015–2016” in the northern end of the shallow oxygen minimum zone of the Eastern Tropical Pacific Ocean. J. Geophys. Res. Ocean 122, 2156–2170. doi: 10.1002/2016JC012622
Sánchez-Velasco, L., Ruvalcaba-Aroche, E. D., Beier, E., Godínez, V. M., Barton, E. D., Díaz-Viloria, N., et al. (2016). Paralarvae of the complex Sthenoteuthis oualaniensis-Dosidicus gigas (Cephalopoda: Ommastrephidae) in the northern limit of the shallow oxygen minimum zone of the Eastern Tropical Pacific Ocean (April 2012). J. Geophys. Res. Ocean 121, 1998–2015. doi: 10.1002/2015JC011534
Santoso, A., McPhaden, M. J., and Cai, W. (2017). The defining characteristics of ENSO extremes and the strong 2015/16 El Niño. Rev. Geophys. 55, 1079–1129. doi: 10.1002/2017RG000560
IOC, SCOR, and IAPSO. (2010). The International Thermodynamic Equation of Seawater – 2010: Calculation and use of Thermodynamic Properties. Paris: UNESCO.
Simpson, J. H. (1981). The shelf-sea fronts: implications of their existence and behaviour. Philos. Trans. R. Soc. Lond Ser. A 302, 531–546. doi: 10.1098/rsta.1981.0181
Stramma, L., Fischer, T., Grundle, D. S., Krahmann, G., and Bange, H. W. (2016). Observed El Niño conditions in the eastern tropical Pacific in October 2015. Ocean Sci. 12, 861–873. doi: 10.5194/os-12-861-2016
Stramma, L., Johnson, G. C., Sprintall, J., and Mohrholz, V. (2008). Expanding oxygen-minimum zones in the tropical oceans. Science 320, 655–658. doi: 10.1126/science.1153847
Stramma, L., Schmidtko, S., Levin, L. A., and Johnson, G. C. (2010). Ocean oxygen minima expansions and their biological impacts. Deep. Res. Part I Oceanogr. Res. Pap. 57, 587–595. doi: 10.1016/j.dsr.2010.01.005
Keywords: oxygen minimum zones, dissolved inorganic carbon, El Niño 2015–2016, oxycline, eastern tropical North Pacific
Citation: Trucco-Pignata PN, Hernández-Ayón JM, Santamaria-del-Angel E, Beier E, Sánchez-Velasco L, Godínez VM and Norzagaray O (2019) Ventilation of the Upper Oxygen Minimum Zone in the Coastal Region Off Mexico: Implications of El Niño 2015–2016. Front. Mar. Sci. 6:459. doi: 10.3389/fmars.2019.00459
Received: 02 August 2018; Accepted: 09 July 2019;
Published: 24 July 2019.
Edited by:
Emilio Garcia-Robledo, University of Cádiz, SpainReviewed by:
GVM Gupta, Centre for Marine Living Resources & Ecology (CMLRE), IndiaManuel Flores Montes, Universidade Federal de Pernambuco (UFPE), Brazil
Copyright © 2019 Trucco-Pignata, Hernández-Ayón, Santamaria-del-Angel, Beier, Sánchez-Velasco, Godínez and Norzagaray. This is an open-access article distributed under the terms of the Creative Commons Attribution License (CC BY). The use, distribution or reproduction in other forums is permitted, provided the original author(s) and the copyright owner(s) are credited and that the original publication in this journal is cited, in accordance with accepted academic practice. No use, distribution or reproduction is permitted which does not comply with these terms.
*Correspondence: José Martín Hernández-Ayón, am1hcnRpbkB1YWJjLmVkdS5teA==