- 1European Commission, Joint Research Centre (JRC), Ispra, Italy
- 2Department of Biology & CESAM, University of Aveiro, Aveiro, Portugal
A huge variability exists in nutrient concentrations boundaries set for the water (WFD) and the marine strategy framework directives (MSFD), as revealed by a survey to EU member states (MS). Such wide variation poses challenges when checking policy objectives compliance and for setting coherent management goals across European waters. To help MS achieve good ecological status (GES) in surface waters, different statistical approaches have been proposed in a Best Practice Guide (BPG; CIS Nutrients Standards Guidance) for establishing suitable nutrient boundaries. Here we used the intercalibrated results from the WFD for the biological quality element phytoplankton to test the applicability of this BPG for deriving nutrient boundaries in coastal and transitional waters. Overall, the statistical approaches proved adequate for coastal lagoons, but are not always robust to allow deriving nutrient boundaries in other water categories such as estuaries, in transitional waters, or some coastal water types. The datasets available for analysis provided good examples of the most common problems that might be encountered in these water categories. Similar issues have been found in freshwater environments, for which solutions are proposed in the BPG and which are demonstrated here for coastal and transitional waters. The different approaches available and problems identified can be useful for supporting the derivation of nutrient concentrations boundaries both for the Water and the MSFDs implementation.
Introduction
European water policy aims to achieve good ecological status (GES) for all rivers, lakes, coastal and transitional water bodies of European Union (European Commission [EC], 2000). The ecological status is assessed based on biological quality elements (BQEs), accompanied by physico-chemical and hydromorphological quality elements (Borja, 2005; Birk et al., 2012). To achieve GES, river basin management plans should be put in place, addressing all relevant pressures (Hering et al., 2010, 2015). Eutrophication is still the major pressure in European coastal and transitional waters, therefore, setting of nutrient criteria to reach GES is of utmost importance (European Environmental Agency [EEA], 2012).
Transitional and coastal waters (CWs) are among the most highly impacted ecosystems in the world presenting inherently high variability over both spatial and temporal scales (Paerl, 2006; Reyjol et al., 2014). In those environments, the greatest impacts of increasing nutrient concentrations have been observed at sites with restricted water exchange, resulting in phytoplankton and macroalgal blooms (Tett et al., 2003; Salas et al., 2008; Carstensen and Henriksen, 2009; Teichberg et al., 2010).
A significant amount of research has been done in developing and intercalibrating biological indicators to assess impact of eutrophication in coastal and transitional waters (Borja et al., 2013; Garmendia et al., 2013; Marbà et al., 2013). The most suitable BQEs for assessing eutrophication are phytoplankton and macrophytes (angiosperms and macroalgae) due to their more established and direct response to nutrient conditions (Smith et al., 1999; Boström et al., 2002; Devlin et al., 2007).
However, less attention has been directed to linking ecological status to management actions and establishing meaningful and consistent nutrient criteria to support GES (Hering et al., 2010). A comparison of nutrient boundaries set for the WFD and the marine strategy framework directive (MSFD) in transitional, coastal and marine waters across European member states (MS) (Dworak et al., 2016) revealed a huge variability in nutrient concentrations boundaries, but also in other relevant aspects such as the nutrient parameters and metrics used, the time of year assessed, the reference conditions established. It also revealed that often MS boundaries do not follow their regional sea convention (RSC) nutrient standards. The possible implications of the wide variations in the nutrient concentration boundaries set by the European MS need to be understood in the context of establishing appropriate nutrient boundaries to achieve GES, as urged by the Working Group on Ecological Status (ECOSTAT), as part of the Common Implementation Strategy for the WFD. A best practice guide (BPG, Phillips et al., 2018) has been elaborated in this context. Its purpose is to help MS achieving GES in surface waters. It complements previous guidance on eutrophication assessment (European Commission [EC], 2009) by providing more targeted advice on how to link nutrient concentrations in surface waters to specific policy objectives. The new guide includes a tool kit to facilitate the application of the different statistical approaches proposed to establish the nutrient targets.
On the other hand, one major achievement of the WFD implementation has been the establishment of a common view of ecological status through an intercalibration exercise (Birk et al., 2013; Poikane et al., 2014, 2015). This has ensured that the concepts of ecological status are transferable between groups of organisms (fish, invertebrates, macrophytes, algae) and between countries within the EU. This, in turn, provides a robust view of GES (and other status classes) that can be used as the starting point for the development of nutrient targets. However, so far, this concept has been applied only to freshwaters (Dolman et al., 2016; Free et al., 2016; Poikane et al., 2019).
The aim of this work is to demonstrate the applicability of the statistical approaches proposed in the BPG, hereafter guidance, in coastal and transitional waters. The work focuses on the pressure-response relationships found between nutrients and the BQE phytoplankton in transitional and CWs. The phytoplankton was selected because it is deemed more responsive to the type of pressure under study, i.e., nutrients (Devlin et al., 2007; Suikkanen et al., 2007). The WFD requirement for assessing the ecological status of the phytoplankton quality element, in transitional and CW bodies, includes taxonomic composition, abundance and biomass of phytoplankton, as well as bloom frequency. However, most of the MS use the concentration of Chlorophyll a (Chl a) as a proxy measure for phytoplankton biomass for the intercalibration, whereas most of the indicators of the other sub-elements (phytoplankton composition and blooms) have not yet been intercalibrated (Garmendia et al., 2013). Case study examples with Chl a metrics from the WFD intercalibration (IC) exercise were used for testing the suitability of the different methodologies proposed in the guidance. In addition, where significant pressure-response relationships have been observed, nutrient boundaries were derived, which can be adopted in the respective water types.
Materials and Methods
The Toolkit
The guidance document is designed to assist in the determination of the concentrations of phosphorus and nitrogen that are likely to support GES. It can be used to check existing boundary values or to develop new ones. The guidance is supported by a toolkit in the form of an Excel workbook and a series of scripts which can be run using R, an open-source language widely used for statistical analysis and graphical presentation (R Development Core Team, 2016). The toolkit provides the full R code, together with a series of examples which can be used to explore the methods.
This toolkit includes different statistical approaches to derive nutrient boundaries:
Univariate linear regression: assuming a linear relationship between the ecological quality ratio (EQR) and nutrients, three regression types are implemented: two ordinary least squares OLS linear regressions between EQR and log nutrients concentration, where each variable is alternatively treated like the independent variable (because none of our two variables in practice can be considered to be free of error); and a third, type II regression, the ranged major axis (RMA) regression. The predicted range of nutrient threshold values are then determined from the range of results obtained from these regressions’ parameters.
Logistic regression: this approach treats ecological status as a categorical variable where a logistic model is fitted between categorical data using a binary response, “biology moderate or worse” = 1 or “biology good or better” = 0 and log of nutrient. Nutrient concentrations are determined where the probability of being moderate or worse was 0.5. In the case that additional pressures, other than nutrients, are suspected, a nutrient concentration value was determined at a probability of 0.75 instead.
Categorical methods: nutrient concentrations associated with a particular ecological status class could also be expressed as a distribution from which an upper quantile might be chosen to indicate a nutrient concentration above which good status was very unlikely to be achieved, or a lower quantile below which good status was very likely to be achieved (average of upper and lower quartiles of adjacent classes), so long as nutrients are the main driver of status. The average of the median of adjacent classes and the upper 75th percentile distribution are two additional categorical approaches tested.
Minimisation of mismatch of classification: estimates the nutrient threshold value that minimizes the mismatch between status (good or better and moderate or worse) for the ecological and the supporting element.
Linear quantile regression: useful alternative when the nutrient-biology interactions are confounded by other stressors, or environmental factors, leading to wedge-shape, or inverted-wedge, type of distributions. In such cases, the quantile regression allows different rates of change in the response variable to be predicted along the upper (in the presence of stressors) or lower (in the presence of mitigating environmental factors) quantiles of the distribution of the data (Cade and Noon, 2003).
Detailed information about the methods included in the toolkit is provided in the Guidance (Phillips et al., 2018).
The boundaries predicted using the different toolkit methods were compared with the national nutrient boundaries established by MS, where available.
Datasets
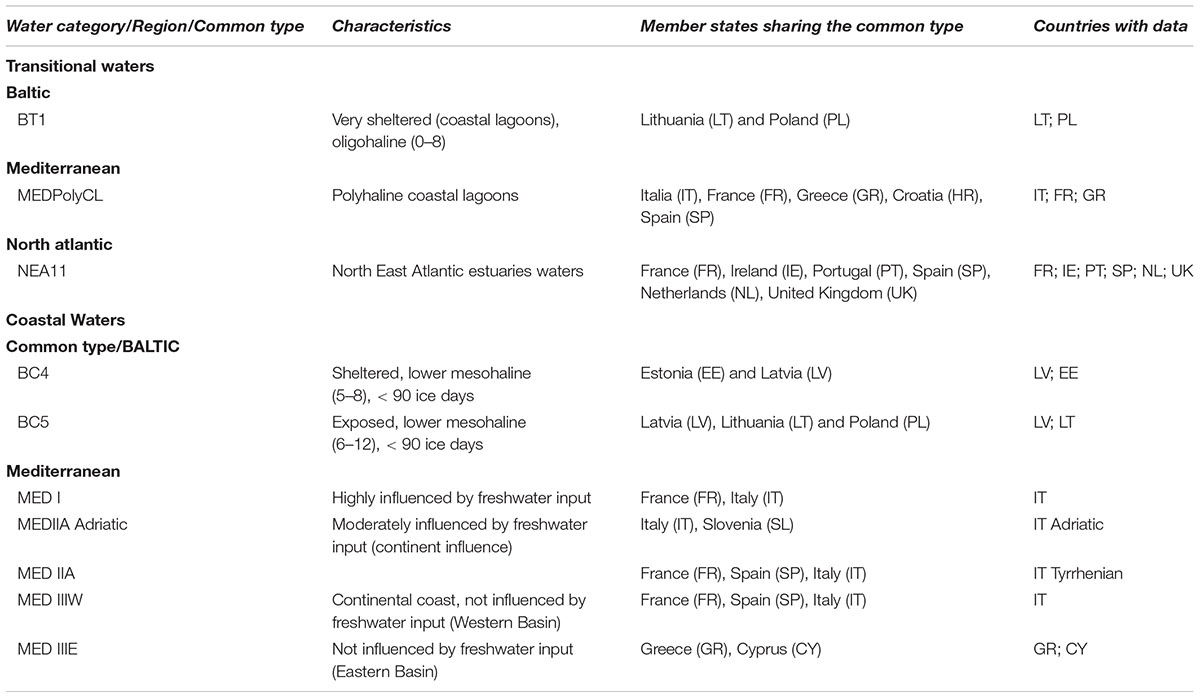
The datasets used in this study represent systems in some of the common IC types across geographic intercalibration groups (GIG) in the water framework directive (WFD). For the Baltic, this work includes data for the single transitional waters (TRW) common type defined and also for two of the nine CWs common types in this GIG. For the Mediterranean, there is data for five of the six CWs common types defined for phytoplankton, and also for one TRW common type. For the North East Atlantic there is data for the single TRW common type defined (Table 1).
Data from 13 MS was compiled (Table 2), which included essentially nutrient parameters and EQR values for the BQE Phytoplankton. In most cases the parameter indicative of biomass (i.e., Chl a) was intercalibrated, and not the full national classification system. In a few cases, datasets included also the raw Chl a data and supporting environmental data such as: turbidity (Turb), flushing regime, tidal range (T), and distance to shore, salinity (Sal), pH, and dissolved oxygen (DO).
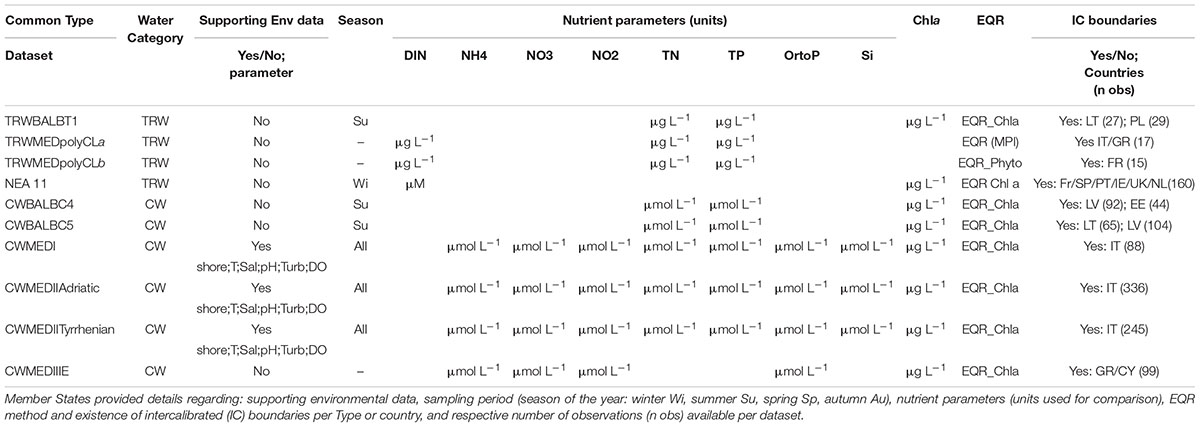
Table 2. Summary of datasets available for the current exercise for coastal (CW) and transitional (TRW) waters.
The nutrient parameters available varied across water categories (CW and TRW), and also across regional GIG, but they were common within IC types. To keep the examples comparable, in this study we have focused the analysis in the phytoplankton response to total Nitrogen (TN), total Phosphorus (TP) and dissolved inorganic Nitrogen (DIN) parameters, since these are the most commonly applied across GIG and common types in both water categories (Table 2). Nutrient data refers to specific seasons of the year, either Summer (Su) or Winter (Wi), but in some cases all year round data was considered (Table 2). In a few cases, for the Mediterranean, the season information was not available. The nutrient units used by the MS were kept for the analyses, in order to facilitate the comparison with their own established nutrient boundaries.
All datasets considered in the present study have associated EQR IC boundaries (European Commission [EC], 2018) that allow their use for deriving nutrient boundaries. Some MS use a full intercalibrated phytoplankton EQR method (e.g., Italy, Greece, and France in TRW); however, the majority of the MS reported a partially intercalibrated EQR method based only on the Chl a parameter. Where different methods have been used within a common type, and with different IC boundaries, in such cases, the datasets were analyzed separately. Only in the case of the common type NEA 11 statistical analyses have been applied on a common data set, and not separately for each country. The NEA11 common dataset was derived after EQR’s normalization (nEQR), for which the full set of MS quality classes’ boundaries were used where available, otherwise assumed equidistant for the missing classes. The toolkit normalize template was used, which is available with the Guidance documentation (Phillips et al., 2018). As relationships within national datasets are often relatively weak, there is a good case for combining data to produce a single dataset spanning several countries. This was the case for the NEA11 dataset.
Datasets were provided by EU MS and compiled by the Joint Research Centre and are only available for results’ checking purposes.
Data Check and Exploration
The recommended steps in the guidance protocol (Phillips et al., 2018) were largely followed and thus, initially, we checked and explored the datasets in order to identify:
(i) Outliers (using box plots, Cleveland plots, and xy scatter plots), and, if justifiable, excluding these from subsequent analysis.
(ii) Collinearity among covariates (using Pearson correlation and/or VIF-Variance inflation factor), in case bivariate or multivariate regressions are required for some of the case studies.
(iii) Relationship between pressure and response (using box plots, xy scatter plots and interaction coplots, GAM- Generalized Additive Models and segmented regression), also to check for an adequate coverage of the gradient of disturbance, and to help identify linear parts of the relationship which should be used for fitting regressions. For some of the methods tested, it is important to only use data within a linear range, since the regression based methods that are currently proposed in the guidance assume a linear response between the variables.
(iv) Nutrient distribution across ecological quality classes in particular High (H), Good (G), and Moderate (M) classes (using box plots, Wilcoxon Rank Sum Test).
Potential outliers were identified if data points fell above or below the 0.975 percentile of residuals, corresponding to 5% of data points that would fall outside of the orthogonal regression line. However, they were only excluded from the analysis if they were considered isolated points, resulting from either measurement errors or sampling situations responding to unusual factors (e.g., samples representing punctual extreme hydrological events); in which case, they are identified in the results’ plots. If the outliers reflected instead, for example, data points falling outside the linear range or trends in data dispersion, then their exclusion /inclusion was evaluated for each statistical method. The point was to allow comparison of the performance of different methods toward different features commonly found in real datasets. In any case, data truncated are identified in the results and the nutrient range modeled or used to set boundaries by each method is acknowledged. The log10 transformation of nutrient concentrations, applied prior to some of the analysis, is commonly used for reducing right skewness in a variable distribution. This transformation is often appropriate for measured variables, which is the case of this dataset. It is also one of the options to get a linear relationship between the nutrients and phytoplankton EQR. Since we are testing OLS regression models, this transformation allows stabilizing the variance of the given variable when the standard deviation is proportional to the mean (too wide variance), bringing it more close to a normal distribution.
Selection of the Method
The Guidance includes a road map for the selection of the most appropriated methods. For the linear methods, the selection is based on the strength of the relationship between the BQE and nutrients. To apply these univariate regressions, the dataset should span ideally four ecological quality classes and show a linear relationship for at least the range of the High (H), Good (G), and Moderate (M) classes. In addition, the strength of the observed relationship should be good enough to allow making predictions, and we suggest that the regression model coefficient of determination is r-squared > 0.36. This correlation value (r > 0.6) follows recommendations by Smith (2009) based on Jolicoeur’s (1990) work when using type II linear regression methods, as the RMA considered in our work. If the observed linear relationship is weaker, then categorical methods (including logistic regression) should instead be tested and applied to derive nutrient thresholds. However, for some of the categorical methods, it is required that significant differences between the nutrients distribution across ecological status classes are observed before nutrient boundaries can be derived from such methods (Phillips et al., 2018).
Results
Univariate Regressions
Relationships between nutrients and biological elements that are meaningful enough to allow establishing nutrient boundaries, i.e., significant and with an r-squared near or higher than 0.36, were found in Lithuanian and Polish transitional waters (common type BT1), in French, Italian and Greece polyhaline coastal lagoons (TRW MED common type), and in Estonian CWs (common type BC4). In Estonia, only TN presented a robust relationship (R2> 0.36).
For Lithuanian transitional waters referring to oligohaline very sheltered coastal lagoons (BT1), the univariate regression of EQR with TN showed a significant acceptable relation (R2 = 0.41, n = 25) and predicted a concentration for good/moderate boundary of 1228 μg L-1. For Polish water bodies of the same common type, univariate regression results between TN and the EQR Chl a predicted a slightly lower G/M nutrient concentration of 1042 μg L-1 (R2 = 0.78, n = 14). Here it was considered a range of nutrient concentration between 400 to 1640 μg L-1 where a linear trend was observed. Observations out of the linear range were previously dropped from the analysis. Those 12 excluded samples corresponded to three sites showing consistently strong phosphorus limited patterns (N:P molar ratio > 32), and not responding to TN enrichment as the remaining samples of a different site. In the case of TP, for this BT1 common type in Lithuanian waters, the relation was slightly lower and the G/M boundary was predicted at 91 μg L-1 nutrient concentration (R2 = 0.34, n = 27). With the Polish data, in this same type, a stronger relationship with TP was observed (R2 = 0.46, n = 22), after excluding nitrogen limited samples. A similar G/M TP concentration was predicted (100 μg L-1).
In the Mediterranean, all the French, Italian and Greek water bodies of the common type polyhaline coastal lagoons showed significant (p < 0.001) and strong relationship between nutrients and phytoplankton metrics (Tables 3, 4). For Italian and Greek coastal lagoons, the nutrients’ relationships were established with a multimetric phytoplankton index (MPI) score (TN R2 = 0.61, n = 14; TP R2 = 0.60, n = 15). Despite a good and highly significant relationship is found for TN, the predicted TN G/M boundary (1749 μg L-1) falls beyond the nutrient range used for model predictions (454–1515 μg L-1), which requires caution. In the case of France, regressions where established for a different Phytoplankton EQR method (only Chl a) with nutrients, but results found were equally good: TN (R2 = 0.64; n = 13) and TP (R2 = 0.86, n = 13). The EQR Chl a relationship with TP (log10 transformed data) shows a clear linear trend (Figure 1), as captured by the BPG toolkit graphical output of the three types of univariate regressions considered: ordinary least square of nutrient on EQR and vice-versa, and also type II regression of EQR on log10 nutrient concentration. Predicted boundaries are indicated in Tables 3, 4.
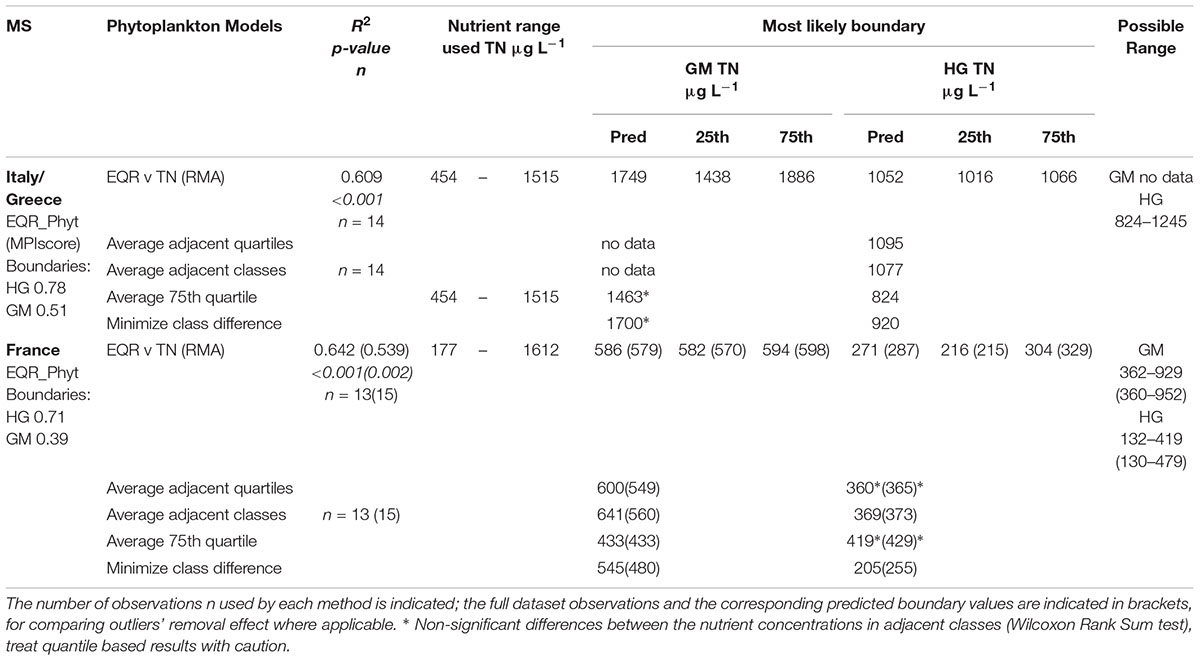
Table 3. Summary of predicted values of nutrient concentration at the Good/Moderate (GM) and High/Good (HG) boundaries of TN (μg L-1), per countries (IT/GR, and FR), within Mediterranean TRW common type polyhaline coastal lagoons (TRWMEDpolyCL), obtained by regression and categorical analyses.
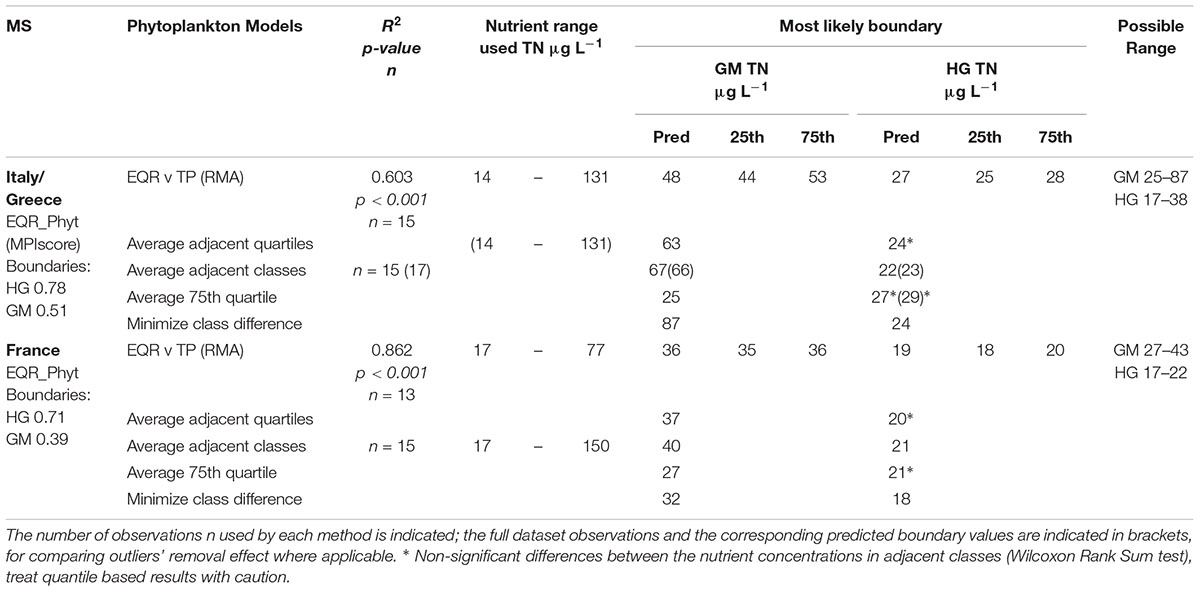
Table 4. Summary of predicted values of nutrient concentration at the Good/Moderate and High/Good boundaries of TP (μg L-1), per countries (IT/GR, and FR), within common type TRWMEDpolyCL, results obtained by regression and categorical analyses.

Figure 1. Regressions with phosphorus (TP) for France (Mediterranean polyhaline coastal lagoons common type): OLS regression of EQR v log10 nutrient concentration; OLS regression of log10 nutrient concentration v EQR; (m) RMA type II regression of EQR v log10 nutrient concentration. Nutrient values back transformed for plotting. Solid points are the values used for models. Open circles are the excluded data (data beyond linear range). Black cross marks mean of data. Solid lines show fitted regression, broken lines upper and lower (25th, 75th) quantiles of residuals. Good/Moderate boundary point marked, as well as likely boundary range (25th, 75th).
For the CW types analyzed in this study, only Estonian water bodies of the common type BC4 showed good univariate linear relationships with one of the nutrients tested. The linear regression obtained for EQR∼TN (Figure 2) was the only relationship robust enough (R2 = 0.58, n = 31) for deriving boundaries (TN G/M = 25 μmol L-1). For this analysis, the non-linear portion of the data was excluded (TN > 33 μmol L-1), as well as a data point with extreme EQR = 2.9. Nevertheless, this dataset presented a high overlap between nutrient concentrations distribution across ecological status classes, in particular for the G/M boundary, both for TN and TP (Figure 2).
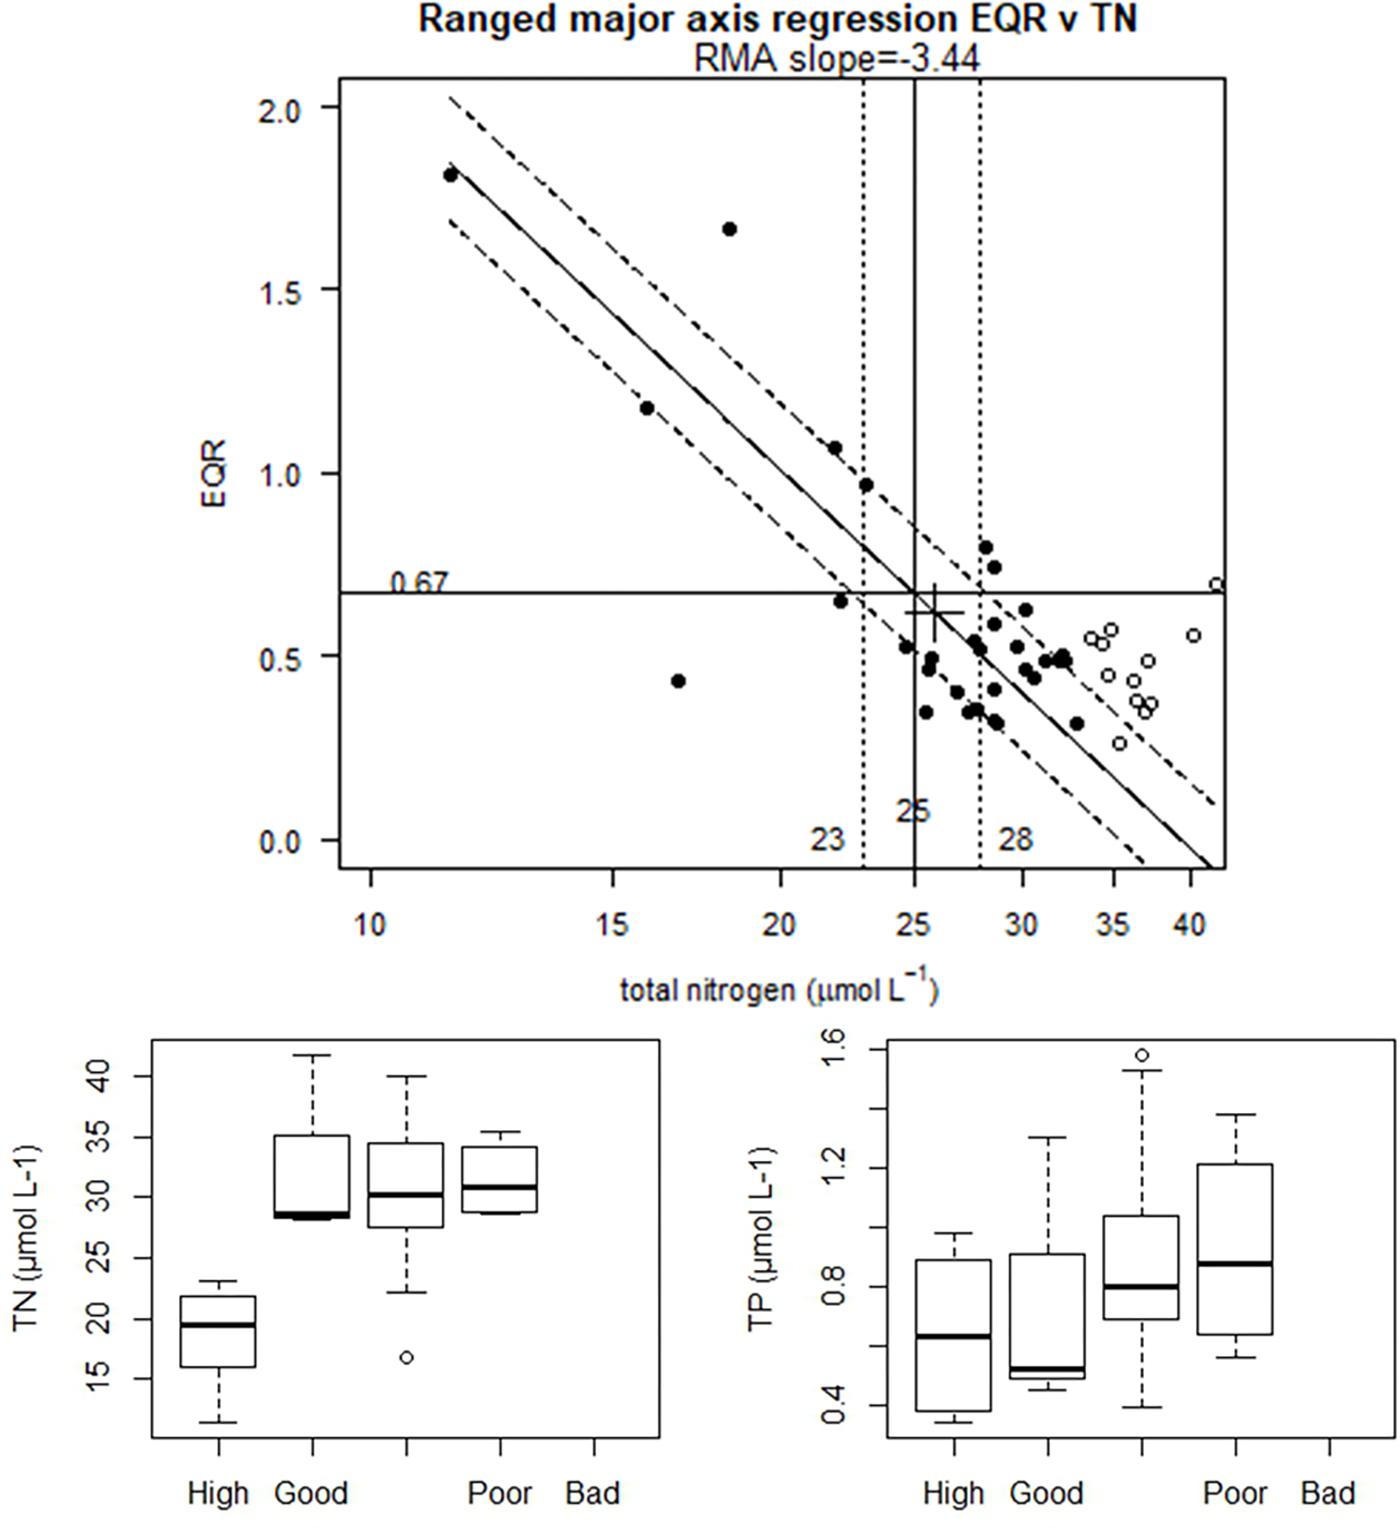
Figure 2. Baltic coastal waters (CWs) type BC4 (Estonian data): RMA type II regression of EQR v log10 Total Nitrogen (TN) concentration (top). Nutrient values back transformed for plotting. Solid points are the values used for models, open circles are the excluded values beyond linear region. Black cross marks mean of data. Solid lines show fitted regression, broken lines upper and lower (25th, 75th) quantiles of residuals. Good/Moderate boundary point marked, as well as likely boundary range (25th, 75th). Bottom panels show range of nitrogen (TN) and phosphorus (TP) concentrations across ecological quality status (EQS) classes: High, Good, Moderate, Poor and Bad.
Bivariate Regression Models
For Lithuanian transitional waters included in the common type BT1, the bivariate model improves slightly from the univariate models for TN or TP previously presented (adjusted R2 = 0.55; p < 0.001, n = 23). The predicted nutrient boundaries for H/G and G/M, for both nutrients, are very similar to those of the univariate approach (Table 5) and are presented in Figure 3.
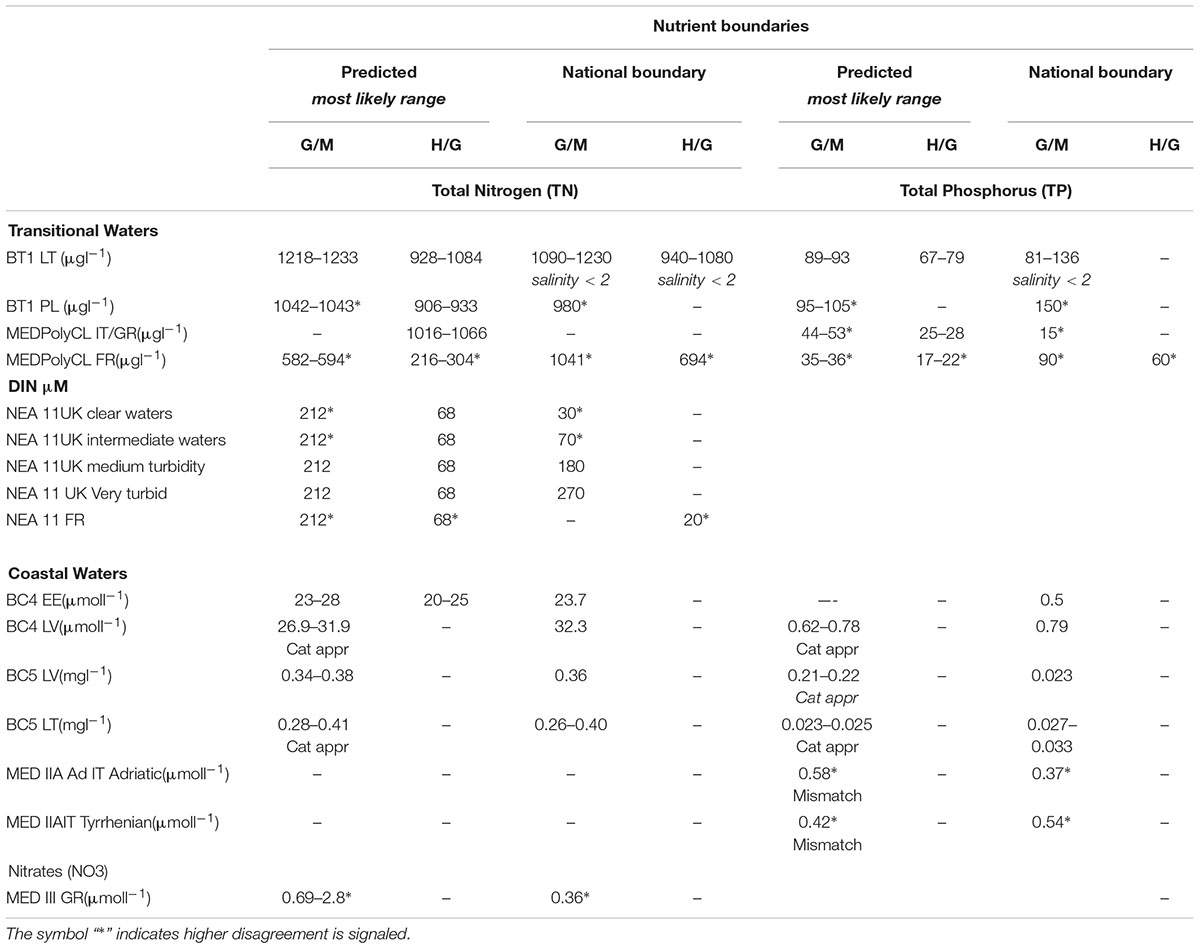
Table 5. Comparison of range of nutrient boundary values for TN and TP, obtained with linear regression and/or categorical approaches, with the range of national good/moderate and high/good boundary values for some transitional (TRW) and coastal (CW) waters common IC types across Europe (where data are available).
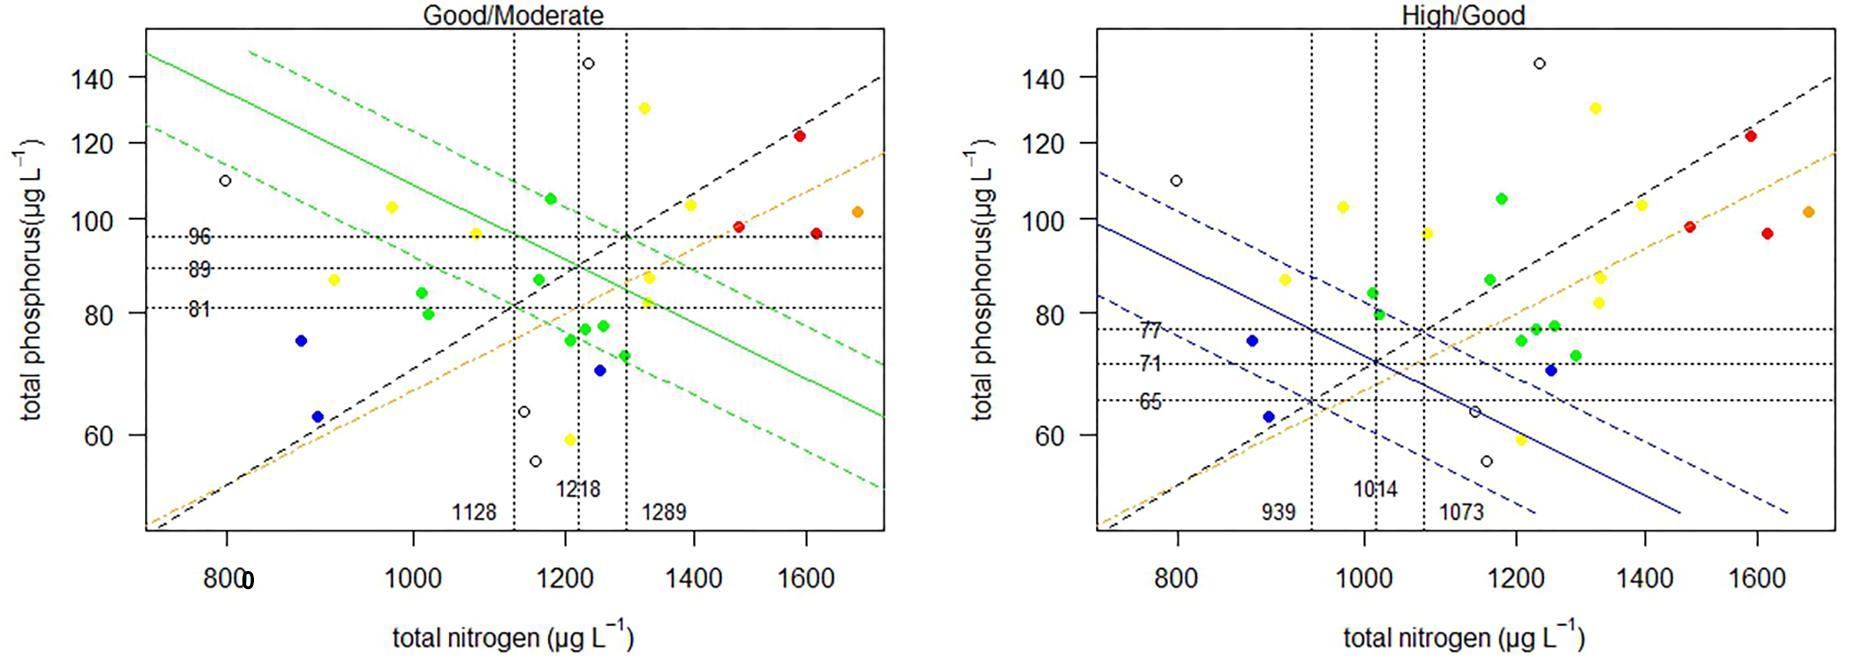
Figure 3. Relationship between TN and TP for Lithuania (common type BT1). Points colored by phytoplankton EQS class (H, blue; G, green; M, yellow; P, orange; B, red), dotted line marks the mean N:P molar ratio, broken orange line ratio of 15:1. Green and blue lines mark contours of the good/moderate and high/good boundaries predicted from the bivariate model. The vertical and horizontal dotted lines indicate the predicted boundaries and respective upper and lower range.
Logistic Regression Models
Binomial logistic regression was applied on the NEA 11 data set, as this statistical analysis is the most reliable and flexible categorical method, included in the toolkit, when linear modeling is not appropriate. A good example is in the presence of weak nutrient-biology relationships as observed for NEA11 common type (R2 = 0.21). This method is not substantially influenced by the mean of the data set and is only slightly influenced by scatter in the data (Phillips et al., 2018; Phillips et al., unpublished). The binomial logistic regressions of DIN on biology (for normalized nEQRs, and excluding the French dataset that presented opposite trend), for both the H/G and the G/M range are presented in Figure 4. Nutrient boundary estimates are presented for a 50% probability of being in moderate or worse status for the G/M, or in good or worse for the H/G, but nutrient values at lower and higher probability thresholds (25% and 75%) are also presented, which provide precautionary and non-precautionary values.
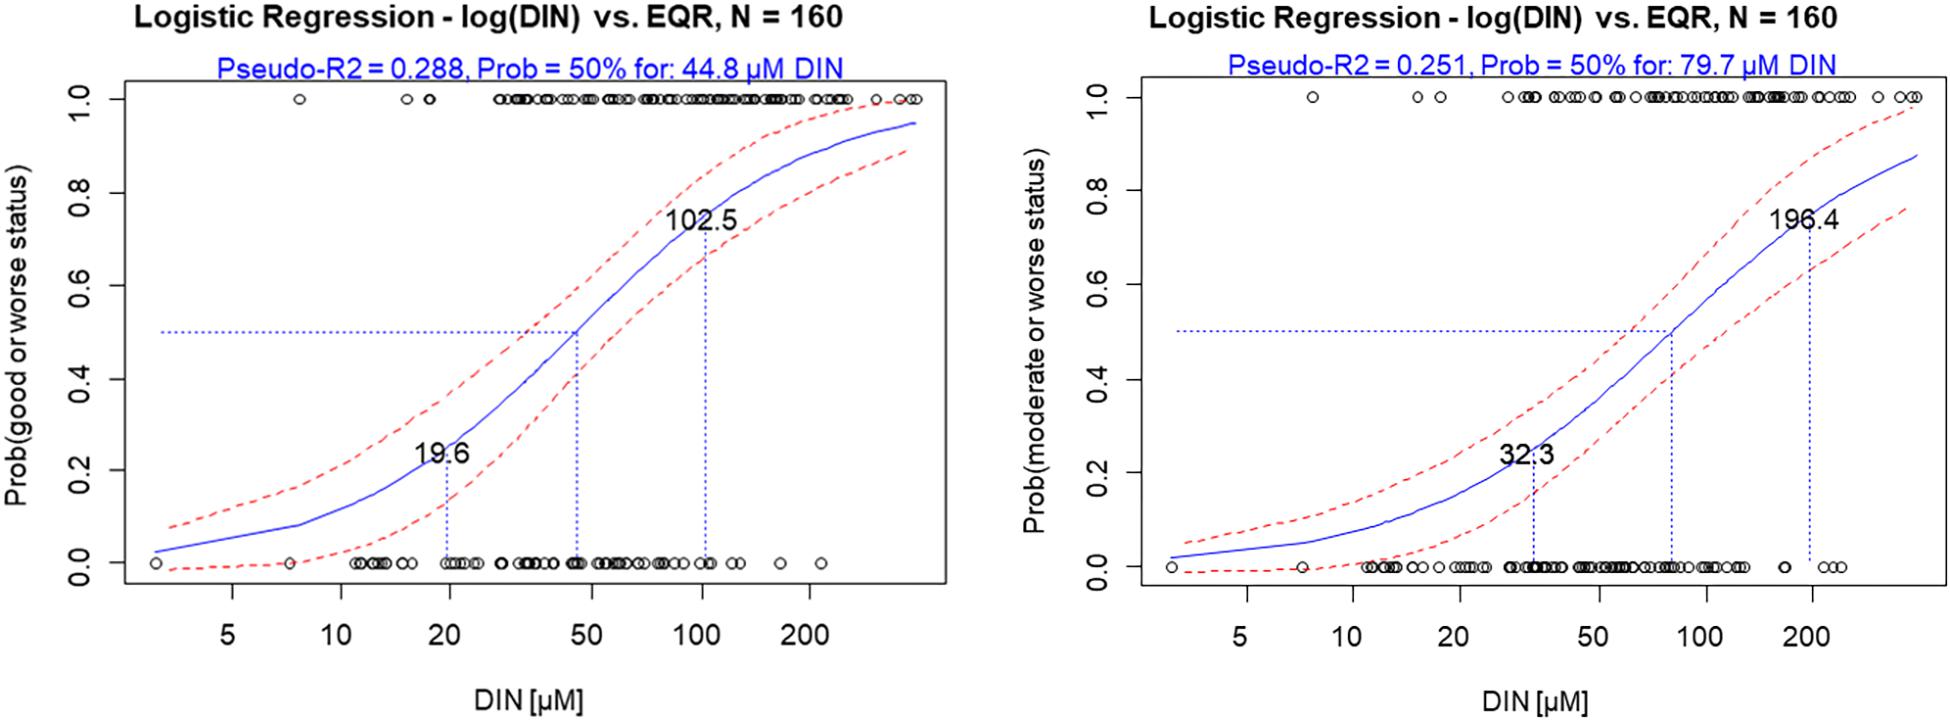
Figure 4. Binomial logistic regression of DIN on probability of being at good or worse status (left) and at moderate or worse status (right) (normalized EQRs used), for the NEA11 common type. Lines show potential boundary values at different probabilities of being in good or worse status and moderate or worse.
However, like other methods, boundary estimates may still be unreliable if other pressures are operating. This is often the case in estuaries, where multiple pressures are frequently encountered. The very scattered regression observed for the NEA11 data suggests that other pressures besides DIN are contributing to decrease the EQR, influencing data distribution (i.e., wedge-shaped distribution observed in Figure 5) and masking the nutrient relationship with biological data.
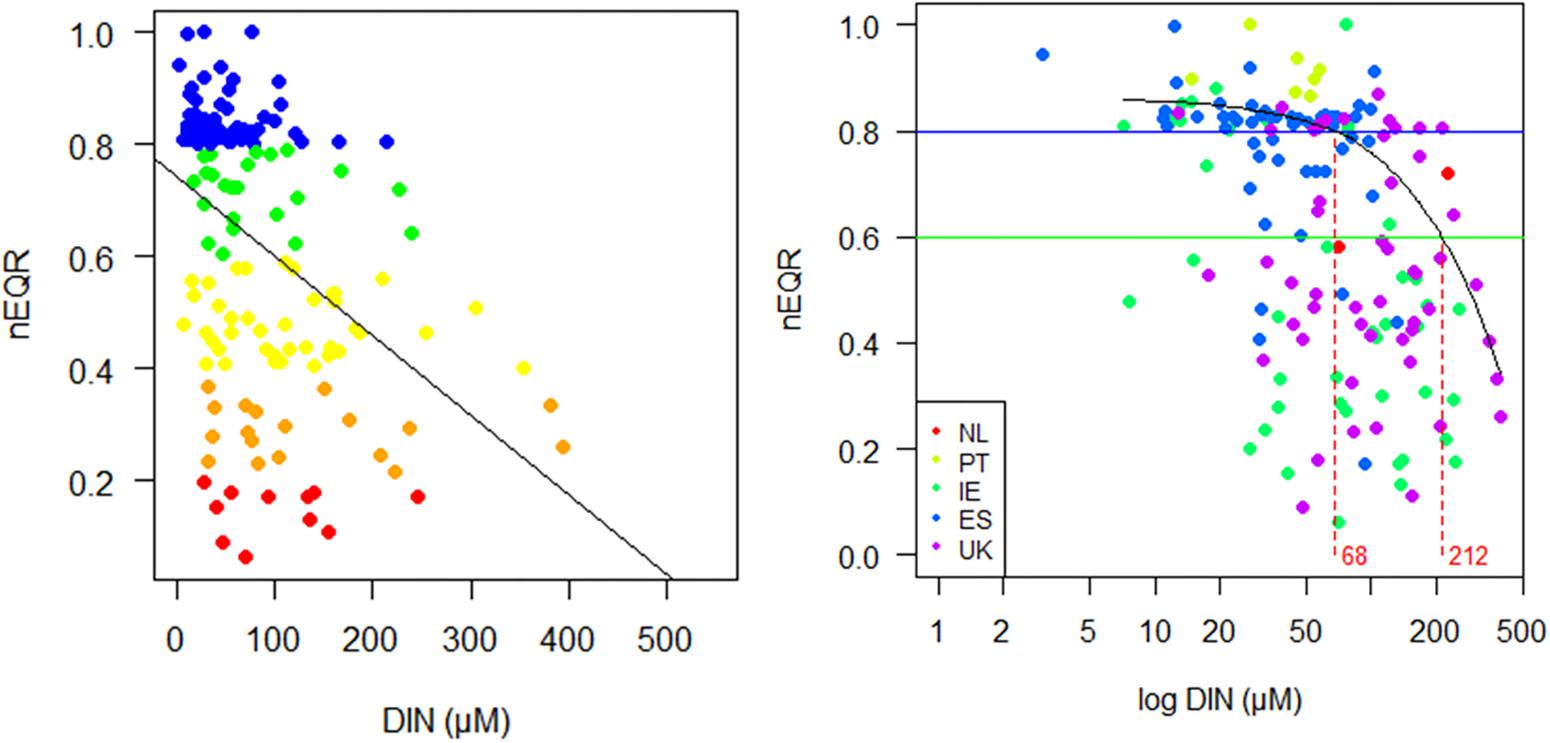
Figure 5. Relationship of nutrient Dissolved inorganic nitrogen (DIN) concentrations (μM) with intercalibrated normalized nEQRs in the NE Atlantic estuaries (NEA11 common type), including observations from Netherlands (NL), Portugal (PT), Ireland (IE), Spain (ES) and the United Kingdom (UK): (left) scatter plot and linear trend, with sites colored according to ecological status (High, blue; Good, green; Moderate, yellow; Poor, orange; Bad, red) and (right) quantile regression fit (Additive Quantile Regression Smoothing rqss using quantreg R package by Koenker) for nEQR v DIN (μM), where horizontal lines indicate EQR boundaries at H/G and G/M, and vertical lines the nutrient boundaries, respectively for H/G and G/M, at the 70th quantile.
Quantile Regression Models
An additional alternative approach tested for establishing guiding nutrient boundaries in such widely scattered NEA11 data, suspected to be caused by the influence of unaccounted pressure variables, was a quantile regression model. For this NEA11 available dataset, a higher quantile has been adopted, for coping with the influential role of potential unknown stressors (or environmental features) in the shape of the data, as the modeling is only possible to do it with this portion of the dataset. The univariate model fitted indicated that the maximum DIN levels (using the 0.7 quantile) that could still support High/Good and Good/Moderate Ecological Status correspond to nutrient concentrations of 68 and 212 μM, respectively (Figure 5). However, the 95% confidence intervals obtained for the G/M boundary are too wide; indicating that, at such nutrient concentrations, large EQRs variation (ranging from 0.39 to 0.81) could be expected.
Minimize the Mismatch Between Biological and Supporting Element Classification
Another possibility of the statistical approach to establish the nutrient boundaries is the minimisation of mis-match method, as this is the least sensitive to outliers and non-linear relationships.
This is the case for Mediterranean CWs, as well as for all coastal common types, which showed, in general, weak results both for TN and Phosphorus. In most of the cases a wedge-shape data distribution did not allow the use of linear regression approaches. Therefore, only categorical approaches should be adopted for deriving nutrient boundaries from intercalibrated EQR data. Results obtained for this categorical approach with the toolkit are indicated in Table 5.
In the case of the common type NEA 11, using this approach (Figure 6) the mean estimated high/good boundary for DIN is 52.5 μM, within a range of 47–59 μM, with a total mismatch classifications rate of 30%, ranging from 28–34%. For the good/moderate the mean estimated boundary is 74.5 μM, which is within the range of 66–83 μg L-1 reported in Table 6. At this point the total mis-match of classifications is 28% and lies within the range of 24–34%.
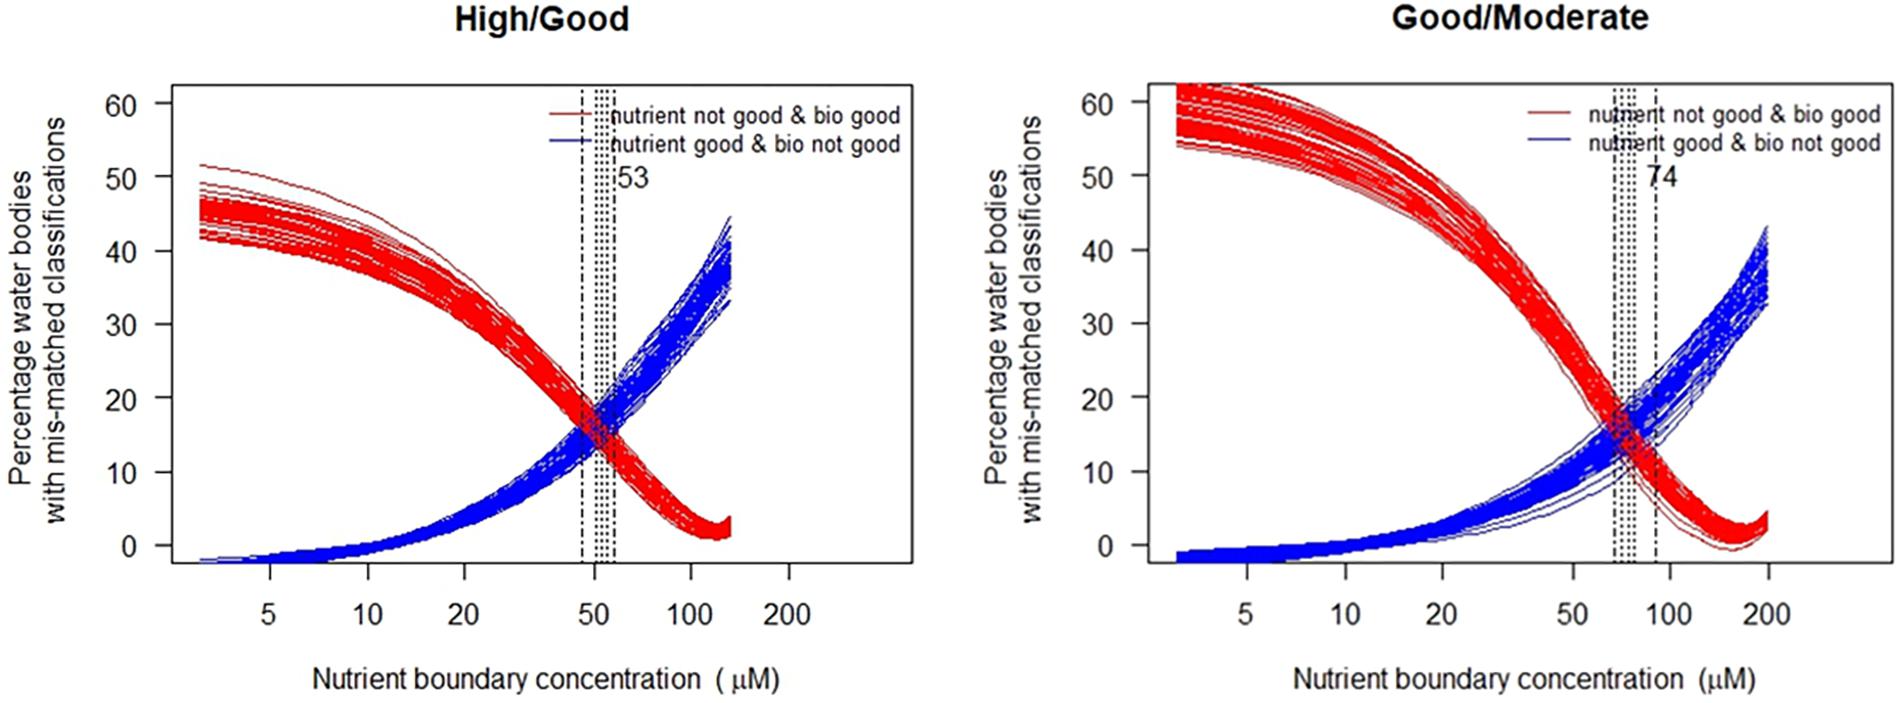
Figure 6. Relationship between percentage of mis-classified records when biological and nutrient classifications are compared for the NEA11 common estuarine type. Vertical lines mark the range of cross-over points where the mis-classification is minimized, together with the mean nutrient concentration. (each line shows a sub-sample of the data set selected at random).
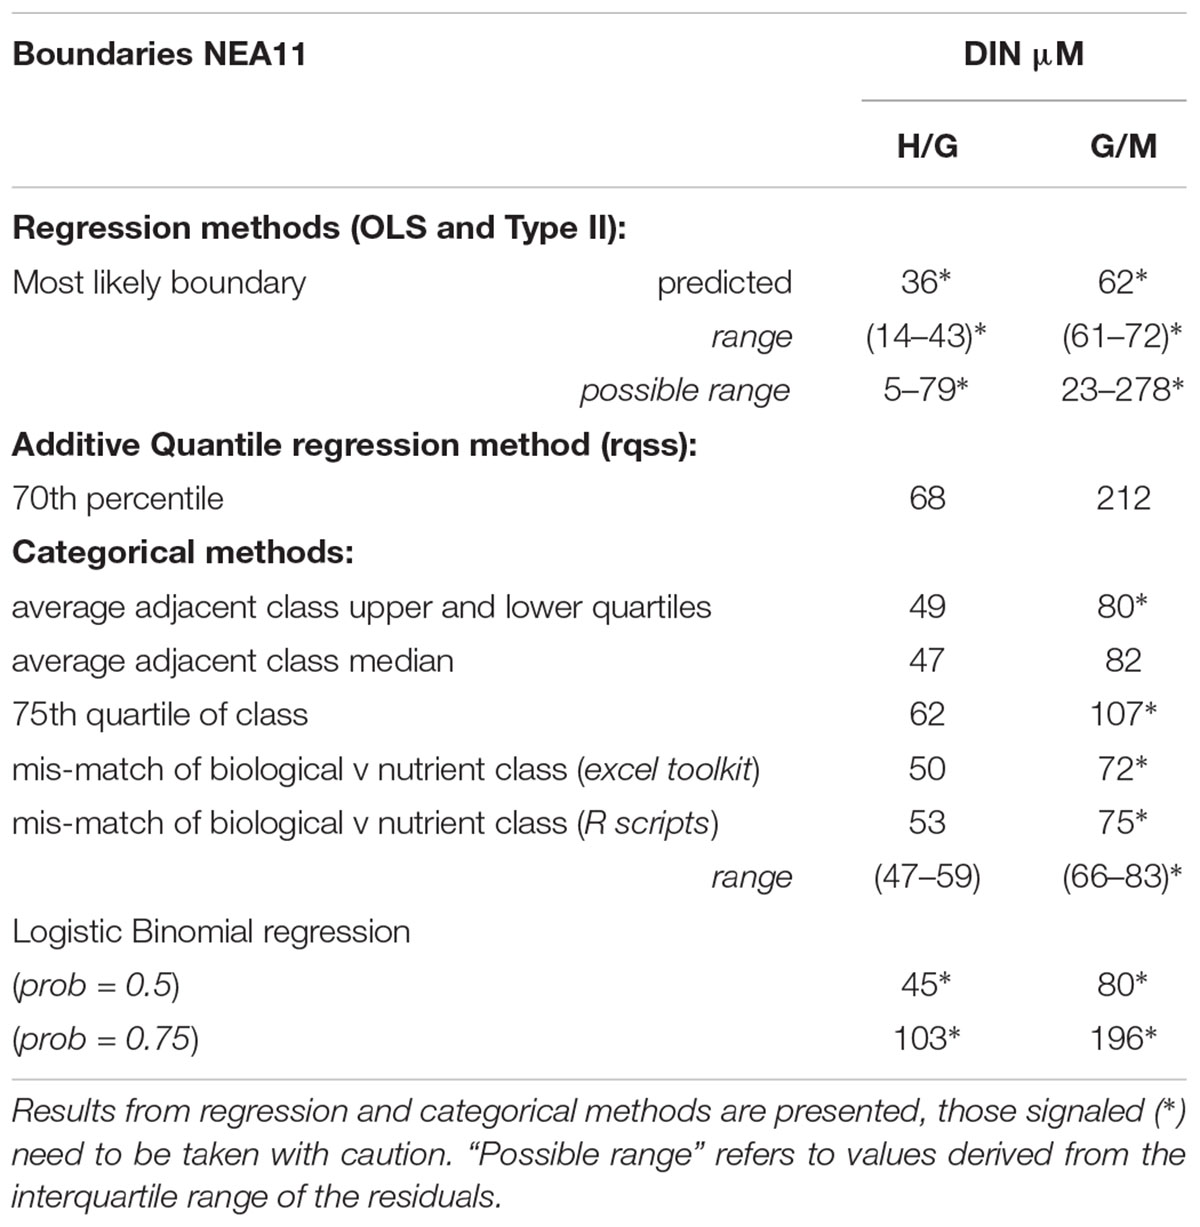
Table 6. Predicted boundary values for DIN (μM) in common type NEA11 (n = 160), derived from the most adequate approaches for this dataset.
Overview and Comparison of the Nutrient Boundaries
Where national Good/Moderate and High/Good nutrient boundaries (Country; Table 5) within common IC types were available, those values were compared with the range of nutrient boundary values resultant from the application of the BPG toolkit analyses. When linear regression results were not significant then the results from the categorical approaches (Cat appr) are used and indicated instead (Table 5). However, where the differences between the nutrient concentrations in adjacent classes are not significant, quantiles derived methods need to be treated with extreme caution (e.g., Table 3). Overall, the nutrient boundaries predicted by the different statistical approaches included in the toolkit are broadly similar to those established by the MS, and similar within the common types.
Discussion and Conclusion
The WFD (European Commission [EC], 2000) introduced, amongst other requirements, a comprehensive ecological status assessment of all surface waters, based on a number of biological, hydromorphological, chemical and physico-chemical quality elements (cf. Annex V 1.1 and V 1.2). Nutrient concentrations are only used as supporting parameters in the assessment of the ecological status. Coastal and estuarine nutrient concentrations are, however, key parameters for the management of eutrophication, since they can be directly linked to nutrient inputs, which can be addressed by abatement measures (Vollenweider, 1992; Paerl et al., 2011). In this context it is important that EU MS set consistent and comparable nutrient boundaries.
In addition, marine strategy directive (MSFD) considers nutrient concentrations as indicators of equal importance as that of the biological indicators (Ferreira et al., 2011). Within the scope of the MSFD, nutrient levels (nutrient concentrations in the water column and nutrient ratios for nitrogen, phosphorus and silica, where appropriate) are amongst the relevant primary criteria in marine waters under Descriptor 5: “Human-induced eutrophication” (European Commission [EC], 2017). Setting consistent nutrient boundaries for the WFD and MSFD is therefore important for a consistent management approach across the continuum of transitional, coastal and marine waters. The recommendations proposed in the guidance and toolkit can promote such consistency, thus having important implications in coastal and estuarine management, but we have found some problems during its application.
In many datasets the EQR values presented a significant percentage of the data (nearly 25%) beyond the expected EQR range [0–1], and often with very pronounced deviations. This occurred mainly where Chl a based EQR was being used for intercalibration. In such cases, only extreme EQR values were removed from the analysis, since removing all EQR values > 1 would decrease the amount of data available for analysis and, more importantly, could influence the observed statistical properties of the relationship between the phytoplankton BQE and the nutrient pressure. However, these EQR ranges may indicate a problem in the established reference conditions, in certain types. If the natural ranges of Chl a in the new datasets differ considerably from the ones used for establishing reference conditions and/or used in the intercalibration exercise, then the intercalibrated phytoplankton (Chl a) boundaries, defined within a 0–1 range, may compromise the prediction of robust nutrient boundaries. We suggest that these cases should be further scrutinized, in order to check the influence of this aspect in the predicted nutrient boundaries.
Some datasets have relatively few observations which may compromise their use to apply the regression analyses proposed and also some of the categorical ones, since results might not be robust and representative enough. Many do not have a proper coverage of the full gradient of disturbance, and in particular of the range of interest to derive nutrient boundaries, i.e., from High to Moderate status. Both situations might be partially overcome if datasets within common types are normalized and pulled together for the analyses. This would allow increasing the number of observations and the coverage of the gradient of disturbance. This is particularly relevant for MS lacking either good or bad quality samples/sites/conditions, since the full gradient of disturbance could still be captured at the scale of the common type.
Evidence of potential interaction between nutrient parameters, of factors masking the pressure-response relationship (either positively, e.g., when the pressure is mitigated by other factor(s); or negatively, e.g., when multiple stressors occur simultaneously), and of overdispersion in the data, make good cases for the use of alternative statistical approaches, to univariate linear regressions. Other methods might be necessary to predict nutrient boundaries in such datasets. For example, when dealing with the lack of environmental information for predicting relevant features and potential sub-types across broadly defined types (as e.g., the NEA11 type); or with the likelihood of the presence of other pressures, quantile regression would still allow predicting boundaries. However, it must be noticed that, while boundaries derived from a high quantile may be appropriate (or even the single available option), when unmeasured pressures other than nutrients are downgrading the biological status, such boundaries are not precautionary and pose a high eminent risk of negative effects on the biota at those predicted values. It is often the case, where these pressures might be operating together with environmental factors to control phytoplankton growth dynamics, which makes it more difficult to disentangle the most relevant factors. The nutrient boundaries indicated by such an approach should therefore be taken with caution until additional environmental factors are considered and further guidance on adequate quantile selection for this purpose is developed.
Nevertheless, although data quality was demonstrated to be a frequent obstacle for deriving nutrient boundaries, the results show that for about 71% of the examples considered in the current study there is an agreement between the national nutrient boundaries established by the countries and the expected nutrient range derived from the application of the different toolkit approaches.
Most of the disagreements are on the TP boundaries. This fact could be related to the limiting nutrient effect. It is generally considered that nitrogen is the nutrient that limits primary productivity in most oceans (Tyrrell, 1999). This is not the case for the Mediterranean basin where phosphorus appears as the most important limiting nutrient, although it is closely followed by nitrogen in this limiting role (Krom et al., 1991; Estrada, 1996; Pitta et al., 2005; Thingstad et al., 2005). In estuarine and CWs, nitrogen vs. phosphorus limitation can change both temporally and seasonally, depending on the inputs from rivers, agriculture and sewage drainage (Painting et al., 2005). It is therefore important to consider local dynamics, as demonstrated for the Baltic, where different N:P ratio patterns among sites of a common typology suggest that type-specific nutrient boundaries determination may not be adequate across all sites. The example shown indicates that type-specific TN boundary values might be unnecessarily restrictive for phosphorus limited systems in some Polish waters of the common type TRW BT1. In lagoon ecosystems, Rinaldi et al. (1992) assume that the algal biomass is limited by nitrogen when the N:P weight ratio is lower than 5 and by phosphate for N:P values higher than 10, while the intermediary values of the ratio indicate that both nutrients regulate algal growth. This ratio can fluctuate, as it was demonstrated in the Papas Lagoon, depending on the season. MS should check the N:P ratio of their water bodies (based on previous studies or in the results of long term monitoring programs) before selecting the right nutrient parameter for the status assessment of their water bodies.
Analyzing the disagreements found between predicted and national boundaries, in the case of the North East Atlantic estuaries (NEA 11), the available intercalibration dataset has shown that the difference between Good and Moderate status was not significant, which compromises the robustness of the results obtained for most of the tested approaches. For the H/G range, however, boundaries suggested by the categorical approaches and quantile regression may be considered for guidance. The categorical and quantile regression results obtained with the analyzed dataset indicate G/M boundaries in line with United Kingdom boundaries adopted for medium to very turbid waters, but do not seem adequate to protect clearer waters. The boundaries are also not in line with the more stringent H/G or G/M French boundaries in either of their NEA11 national subtypes. These results reinforce the need to account for additional environmental factors when setting common datasets for establishing nutrient boundaries across common types, in order to accommodate within type natural variability, particularly for broadly defined types across Europe. A mixed dataset covering a wide gradient of more to less turbid systems would mask the relationship between nutrients and phytoplankton in clearer waters, as turbidity would control phytoplankton growth allowing for good ecological quality values to be attained at higher nutrient values than would be expected for example in non-turbid systems. This is the reason for the widely scattered data observed, and emphasizes the need to evaluate and interpret all values produced using the toolkit.
In the Mediterranean CWs of the common type III E, the disagreements between national boundaries and the values proposed by the toolkit are also observed when compared to the results included in Pagou et al., 2008. In fact, the TN thresholds (0.62–0.65 μmol L-1 for CWs in good status) proposed by these authors are more in line with the range predicted by the toolkit statistical approaches tested.
Souchu et al. (2010) analyzed nutrients concentration along an anthropogenic eutrophication gradient in French Mediterranean coastal lagoons. TN and TP values in oligotrophic lagoons were around 220 and 13 μg L-1, respectively. Also in this case, and for both nutrients, the values are similar or within the H/G range predicted by the toolkit, but in disagreement with the boundaries proposed by France.
On the other hand, results have also shown that relationships found between nutrients and EQR of BQE phytoplankton have been stronger in coastal lagoons than in CWs. This is due to the fact that in CWs and in large and complex estuarine systems such as the Baltic Sea, the relationship between loads and nutrient concentrations is not as simple as in enclosed systems. Loss mechanisms (sedimentation, denitrification) and retention time play key roles but obscure the cause effect relationships. Therefore, we suggest categorical approaches for the establishment of nutrient standards in CWs.
Finally, considering other BQEs (e.g., macroinvertebrates or fish) would not improve the relationships with nutrients, because their responses are more affected by other pressures (e.g., physical disturbance, hydromorphological changes). The improvement of the relationships between BQE phytoplankton and nutrients could be possible if data are collected within a suitable spatio-temporal framework, with sufficiently frequent sampling over a reasonable period of time (Flo, 2017).
Many methods have been developed in the EU and elsewhere to evaluate and track trends in eutrophication in order to fulfill requirements of legislation designed to monitor and protect CW bodies from degradation. In this sense, many assessment tools (Bricker et al., 1999; OSPAR Commission, 2005; HELCOM Eutrophication Assessment Tool – HEAT) have stressed the importance of establishing a more tight linkage between causative factors (nutrients) and direct and indirect effects of eutrophication (Painting et al., 2005).
We conclude that the toolkit applied in the current work is a valuable tool for establishing the nutrient criteria, but attention has to be paid to the quality of data and to the importance of compiling a comprehensive dataset that covers a wider spectrum of conditions, containing as much as possible a balanced number of observations across several EQS classes (at least until the Moderate status).
Author Contributions
All authors were involved in conceiving the ideas and designing methodology. HT led the data analysis. FS led the writing of the manuscript. All authors contributed critically to discussion and gave final approval for publication.
Funding
HT thanks FCT/MCTES for the financial support to the host institution CESAM (UID/AMB/50017/2019).
Conflict of Interest Statement
The authors declare that the research was conducted in the absence of any commercial or financial relationships that could be construed as a potential conflict of interest.
References
Birk, S., Bonne, W., Borja, A., Brucet, S., Courrat, A., Poikane, S., et al. (2012). Three hundred ways to assess Europe’s surface waters: an almost complete overview of biological methods to implement the water framework directive. Ecol. Indicators 18, 31–41. doi: 10.1016/j.ecolind.2011.10.009
Birk, S., Willby, N. J., Kelly, M. G., Bonne, W., Borja, A., Poikane, S., et al. (2013). Intercalibrating classifications of ecological status: europel status: europelogical status: europenditions, catic ecosystems. Sci. Total Environ. 454-455, 490–499. doi: 10.1016/j.scitotenv.2013.03.037
Borja, A., Elliott, M., Henriksen, P., and Marb, N. (2013). Transitional and coastal waters ecological status assessment: advances and challenges resulting from implementing the European water framework directive. Hydrobiologia 704, 213–229. doi: 10.1007/s10750-012-1276-9
Borja, Á (2005). The European water framework directive: a challenge for nearshore, coastal and continental shelf research. Cont. Shelf Res. 25, 1768–1783.
Boström, C., Bonsdorff, E., Kangas, P., and Norkko, A. (2002). Long-term changes of a brackish-water eelgrass (Zostera marina L.) community indicate effects of coastal eutrophication. Estuarine Coast. Shelf Sci. 55, 795–804. doi: 10.1006/ecss.2001.0943
Bricker, S. B., Clement, C. G., Pirhalla, D. E., Orlando, S. P., and Farrow, D. R. G. (1999). National Estuarine Eutrophication Assessment: Effects of Nutrient Enrichment in the Nation’s Estuaries. Silver Spring, MD: National Ocean Service, Special Projects Office and National Centers for Coastal Ocean Science.
Cade, B. S., and Noon, B. R. (2003). A gentle introduction to quantile regression for ecologists. Front. Ecol. Environ. 1, 412–420. doi: /10.1890/1540-92952003001[0412:AGITQR]2.0.CO;2
Carstensen, J., and Henriksen, P. (2009). Phytoplankton biomass response to nitrogen inputs: a method for WFD boundary setting applied to Danish coastal waters. Hydrobiologia 633, 137–149. doi: 10.1007/s10750-009-9867-9
Devlin, M., Best, M., Coates, D., Bresnan, E., O’Boyle, S., Park, R., et al. (2007). Establishing boundary classes for the classification of UK marine waters using phytoplankton communities. Mar. Pollut. Bull. 55, 91–103. doi: 10.1016/j.marpolbul.2006.09.018
Dolman, A. M., Mischke, U., and Wiedner, C. (2016). Lake-type-specific seasonal patterns of nutrient limitation in German lakes, with target nitrogen and phosphorus concentrations for good ecological status. Freshw. Biol. 61, 444–456. doi: 10.1111/fwb.12718
Dworak, T., Berglund, M., Haider, S., Leujak, W., and Claussen, U. (2016). “A comparison of European nutrient boundaries for transitional, coastal and marine waters,” in Proceedings of the 36th Meeting of the WFD CISWorking Group on ecological Status (ECOSTAT), (Tallinn).
European Commission [EC] (2000). Directive 2000/60/EC of the European Parliament and of the Council of 23rd October 2000 establishing a framework for Community action in the field of water policy. Brussels: European Commission.
European Commission [EC] (2009). Guidance Document on Eutrophication Assessment in the Context of European Water Policies. Common Implementation Strategy Guidance Document No. 23. Luxembourg: Office for Official Publications of the European Union.
European Commission [EC] (2017). Commission Decision (EU) 2017/848 of 17 May 2017 laying down criteria and methodological standards on good environmental status of marine waters and specifications and standardised methods for monitoring and assessment, and repealing Decision 2010/477/EU. Brussels: European Commission.
European Commission [EC] (2018). Commission Decision 2018/229/EU. Decision of 12 February 2018 establishing, pursuant to Directive 2000/60/EC of the European Parliament and of the Council, the values of the Member State monitoring system classifications as a result of the intercalibration exercise and repealing Decision 2013/480/EU. Brussels: European Commission.
European Environmental Agency [EEA] (2012). European Waters - Assessment of Status and Pressures. Copenhagen: EEA Report.
Ferreira, J. G., Andersen, J. H., Borja, A., Bricker, S. B., Camp, J., Da Silva, M. C., et al. (2011). Overview of eutrophication indicators to assess environmental status within the European marine strategy framework directive. Estuarine Coast. Shelf Sci. 93, 117–131. doi: 10.1016/j.ecss.2011.03.014
Flo, E. (2017). Opening the Black Box of Coastal Inshore Waters in the NW Mediterranean Sea: Environmental Quality Tools and Assessment. Doctoral thesis, Universitat Politcnica de Catalunya, Barcelona.
Free, G., Tierney, D., Little, R., Kelly, F., Kennedy, B., and Plant, C. (2016). Lake ecological assessment metrics in Ireland: relationships with phosphorus and typology parameters and the implications for setting nutrient standards. Biol. Environ. 116B, 191–204.
Garmendia, M., Borja,Á, Franco, J., and Revilla, M. (2013). Phytoplankton composition indicators for the assessment of eutrophication in marine waters: present state and challenges within the European directives. Mar. Pollut. Bull. 66, 7–16. doi: 10.1016/j.marpolbul.2012.10.005
Hering, D., Borja, A., Carstensen, J., Carvalho, L., Elliott, M., and Feld, C. K. (2010). The European water framework directive at the age of 10: a critical review of the achievements with recommendations for the future. Sci. Total Environ. 408, 4007–4019. doi: 10.1016/j.scitotenv.2010.05.031
Hering, D., Carvalho, L., Argillier, C., BekliogLu, M., Borja, A., and Cardoso, A. C. (2015). Managing aquatic ecosystems and water resources under multiple stress - an introduction to the MARS project. Sci. Total Environ. 503, 10–21. doi: 10.1016/j.scitotenv.2014.06.106
Jolicoeur, P. (1990). Bivariate allometry: interval estimation of the slopes of the ordinary and standardized normal major axes and structural relationship. J. Theoret. Biol. 144, 275–285. doi: 10.1016/s0022-5193(05)80326-1
Krom, M. D., Kress, N., and Benner, S. (1991). Phosphorus limitation of primary productivity in the eastern mediterranean sea. Limnol. Oceanogr. 36, 424–432. doi: 10.4319/lo.1991.36.3.0424
Marbà, N., Krause-Jensen, D., Alcoverro, T., Birk, S., Pedersen, A., Neto, J. M., et al. (2013). Diversity of European seagrass indicators: patterns within and across regions. Hydrobiologia 704, 265–278. doi: 10.1007/s10750-012-1403-7
OSPAR Commission (2005). “Draft report on the north sea pilot project on ecological quality objectives,” in Proceedings of the Meeting in the Biodiversity Committee, (Bonn).
Paerl, H. W. (2006). Assessing and managing nutrient-enhanced eutrophication in estuarine and coastal waters: interactive effects of human and climatic perturbations. Ecol. Eng. 26, 40–54. doi: 10.1016/j.ecoleng.2005.09.006
Paerl, H. W., Hall, N. S., and Calandrino, E. S. (2011). Controlling harmful cyanobacterial blooms in a world experiencing anthropogenic and climatic-induced change. Sci. Total Environ. 409, 1739–1745. doi: 10.1016/j.scitotenv.2011.02.001
Pagou, K., Ioanna Siokou-Frangou, I., and Papathanassiou, E. (2008). Nutrients and their Ratios in Relation to Eutrophication and HAB Occurrence. The Case of Eastern Mediterranean Coastal Waters. Athens: NCMR.
Painting, S. J., Devlin, M. J., Rogers, S. I., Mills, D. K., Parker, E. R., and Rees, H. L. (2005). Assessing the suitability of OSPAR EcoQOs for eutrophication vs ICES criteria for England and Wales. Mar. Pollut. Bull. 50, 1569–1584. doi: 10.1016/j.marpolbul.2005.06.042
Phillips, G., Kelly, M., Teixeira, H., Salas, F., Free, G., Leujak, W., et al. (2018). Best Practice for Establishing Nutrient Concentrations to Support Good Ecological Status, EUR 29329. Luxembourg: EN, Publications Office of the European Union.
Pitta, P., Tambler, N., Tanaka, T., Zohary, T., Tselepides, N., and Rassoulzadegan, F. (2005). Biological response to P addition in the Eastern Mediterranean Sea. The microbial race against time. Deep Sea Res. II 52, 2961–2974. doi: 10.1016/j.dsr2.2005.08.012
Poikane, S., Birk, S., Böhmer, J., Carvalho, L., de Hoyos, C., Gassner, H., et al. (2015). A hitchhiker’s guide to European lake ecological assessment and intercalibration. Ecol. Indicators 52, 533–544. doi: 10.1016/j.ecolind.2015.01.005
Poikane, S., Phillips, G., Birk, S., Free, G., Kelly, M. G., and Willby, N. J. (2019). Deriving nutrient criteria to support ‘good’ ecological status in European lakes: an empirically based approach to linking ecology and management. Sci. Total Environ. 650, 2074–2084. doi: 10.1016/j.scitotenv.2018.09.350
Poikane, S., Zampoukas, N., Borja, A., Davies, S. P., van de Bund, W., and And Birk, S. (2014). Intercalibration of aquatic ecological assessment methods in the European Union: lessons learned and way forward. Environ. Sci. Pol. 44, 237–246. doi: 10.1016/j.envsci.2014.08.006
R Development Core Team (2016). R: A Language and Environment for Statistical Computing. Vienna: R Foundation for Statistical Computing.
Reyjol, Y., Argillier, C., Bonne, W., Borja, A., Buijse, A. D., Cardoso, A. C., et al. (2014). Assessing the ecological status in the context of the European water framework directive: where do we go now?. Sci. Total Environ. 497, 332–344. doi: 10.1016/j.scitotenv.2014.07.119
Rinaldi, A., Montanari, G., Ghetti, A., Ferrari, C. R., and Ferrari, A. (1992). “Eutrophy and dystrophy in the Goro lagoon,” in Marine Coastal Eutrophication, eds R. A. Vollenweider, R. Marchetti, and R. Viviani (Amsterdam: EIsevier Sci. Pub.), 457–470. doi: 10.1016/b978-0-444-89990-3.50043-2
Salas, F., Teixeira, H., Marcos, C., Marques, J. C., and Pérez-Ruzafa, A. (2008). Applicability of the trophic index TRIX in two transitional ecosystems: the Mar Menor lagoon (Spain) and the Mondego estuary (Portugal). ICES J. Mar. Sci. 65, 1442–1448. doi: 10.1093/icesjms/fsn123
Smith, R. J. (2009). Use and misuse of the reduced major axis for line-fitting. Am. J. Phys. Anthropol. 140, 476–486. doi: 10.1002/ajpa.21090
Smith, V. H., Tilman, G. D., and Nekola, J. C. (1999). Eutrophication: impacts of excess nutrient inputs on freshwater, marine, and terrestrial ecosystems. Environ. Pollut. 100, 179–196. doi: 10.1016/s0269-7491(99)00091-3
Souchu, P., Bhu, B., Smith, Val H, Laugier, T., Fiandrino, A., Benau, L., et al. (2010). Patterns in nutrient limitation and chlorophyll a along an anthropogenic eutrophication gradient in French Mediterranean coastal lagoons. Can. J. Fish. Aqu. Sci. 67, 743–753. doi: 10.1139/f10-018
Suikkanen, S., Laamanen, M., and Huttunen, M. (2007). Long-term changes in summer phytoplankton communities of the open northern Baltic Sea. Estuarine Coast. Shelf Sci. 71, 580–592. doi: 10.1016/j.ecss.2006.09.004
Teichberg, M., Fox, S. E., Olsen, Y. S., Valiela, I., Martinetto, P., and Iribarne, O. (2010). Eutrophication and macroalgal blooms in temperate and tropical coastal waters: nutrient enrichment experiments with Ulva spp. Global Change Biol. 16, 2624–2637.
Tett, P., Gilpin, L., Svendsen, H., Erlandsson, C. P., Larsson, U., Kratzer, S., et al. (2003). Eutrophication and some European waters of restricted exchange. Cont. Shelf Res. 23, 1635–1671. doi: 10.1016/j.csr.2003.06.013
Thingstad, T. F., Krom, M. D., Mantoura, R. F. C., Flaten, G. A. F., Groom, S., Herut, B., et al. (2005). Nature of phosphorus limitation in the ultraoligotrophic Eastern Mediterranean. Science 309, 1068–1071. doi: 10.1126/science.1112632
Tyrrell, T. (1999). The relative influences of nitrogen and phosphorus on oceanic primary production. Nature 400, 525–531. doi: 10.1038/22941
Keywords: eutrophication, nutrients, phytoplankton, water framework directive, marine strategy framework directive
Citation: Salas Herrero F, Teixeira H and Poikane S (2019) A Novel Approach for Deriving Nutrient Criteria to Support Good Ecological Status: Application to Coastal and Transitional Waters and Indications for Use. Front. Mar. Sci. 6:255. doi: 10.3389/fmars.2019.00255
Received: 31 August 2018; Accepted: 29 April 2019;
Published: 17 May 2019.
Edited by:
Jesper H. Andersen, NIVA Denmark Water Research, DenmarkReviewed by:
Robinson W. Fulweiler, Boston University, United StatesAkkur Vasudevan Raman, Andhra University, India
Urmas Lips, Tallinn University of Technology, Estonia
Copyright © 2019 Salas Herrero, Teixeira and Poikane. This is an open-access article distributed under the terms of the Creative Commons Attribution License (CC BY). The use, distribution or reproduction in other forums is permitted, provided the original author(s) and the copyright owner(s) are credited and that the original publication in this journal is cited, in accordance with accepted academic practice. No use, distribution or reproduction is permitted which does not comply with these terms.
*Correspondence: Fuensanta Salas Herrero, RnVlbnNhbnRhLlNhbGFzLUhlcnJlcm9AZWMuZXVyb3BhLmV1
 Fuensanta Salas Herrero
 Heliana Teixeira
 Sandra Poikane