
95% of researchers rate our articles as excellent or good
Learn more about the work of our research integrity team to safeguard the quality of each article we publish.
Find out more
ORIGINAL RESEARCH article
Front. Mar. Sci. , 09 April 2019
Sec. Marine Biogeochemistry
Volume 6 - 2019 | https://doi.org/10.3389/fmars.2019.00185
 Xavier Mari1,2,3*
 Benjamin Guinot4
 Chu Van Thuoc2
 Justine Brune1Jean-Pierre Lefebvre5,6
 Pradeep Ram Angia Sriram7
 Patrick Raimbault1
 Thorsten Dittmar8
 Jutta Niggemann8
Black carbon (BC) is emitted to the atmosphere during biomass, biofuel, and fossil fuel combustion, and leaves the atmosphere via dry or wet deposition on land and on the ocean. On a global scale, wet deposition accounts for about 80% of the total atmospheric BC inputs to the ocean. The input of BC particles to the ocean can enrich surface waters with carbon and associated elements, and owing to high porosity and surface-active properties, BC can alter biogeochemical cycles by sorbing dissolved compounds and promoting aggregation. The rain-mediated input of BC to the ocean and its consequences on nutrient concentrations and particle dynamics were studied in Halong Bay, Vietnam, during a 24-h cycle impacted by short and heavy rainfall events. This study suggests that once introduced in the surface ocean via wet deposition, BC sorbs dissolved organic matter (DOM) and stimulates aggregation processes. The observed wet deposition events were characterized by sudden and pulsed inputs of BC particles that created a thin layer of sinking surface-active aggregates, acting as a net-like scavenger for DOM, nutrients (especially phosphate), and small particles. In addition, the wet deposition events coincided with an enrichment of nutrients in the surface microlayer, with an excess input of nitrogen relative to phosphorus leading to an increase of the molar N:P ratio from 24:1 to 37:1. In the underlying water, the molar N:P ratio also increased (i.e., from 39:1 to 64:1), and this can be attributed to the preferential scavenging of dissolved P-compounds on sinking BC-aggregates.
Black carbon (BC) is the product of incomplete combustion of fossil fuels, biofuels and biomass, and is a major component of soot. It is estimated that 2–29 Tg of BC particles are emitted per year (Bond et al., 2013). BC occurs in the atmosphere along a continuum from freshly emitted single nanospheres of ∼50 nm, to aged aggregates of a few micrometers, the chemical nature of which ranges from pure to highly functionalized aromatic rings, respectively (Goldberg, 1985). In addition to BC particles emitted to the atmosphere, aged BC that has been oxidized in soil can also return into the atmosphere associated with soil dust in the form of water soluble BC (WSBC; Bao et al., 2017). Both forms of BC leave the atmosphere via dry or wet deposition, on land and oceans.
The atmospheric lifetime of BC particles and dust associated WSBC, which is determined by the size spectra and the concentration of aerosols, and by the atmospheric conditions, ranges from a few days in rainy climates up to 1 month in dry regions (Ogren and Charlson, 1983; Ogren et al., 1984), providing enough time for BC particles and dust associated WSBC to reach the most remote oceanic sites. Deposition of BC particles on the surface of the ocean has been estimated to a global rate of 2 and 10 Tg BC yr-1, for dry and wet deposition, respectively (Jurado et al., 2008), and regional studies confirmed that wet deposition was the dominant mechanism leading to the direct introduction of BC particles into the ocean (Suman et al., 1997; Loosmore and Cederwall, 2004; Pan and Wang, 2015). The global atmospheric deposition of WSBC associated with dust is estimated to ∼1.8 Tg yr-1, with about 70% in the form of wet deposition (Bao et al., 2017). Therefore, wet deposition is the dominant input mechanism of atmospheric BC to the ocean.
In addition to direct atmospheric deposition on the surface of the ocean, BC can also reach the marine system via river runoff. While the fluvial input from large rivers may be the dominant source of BC particles in the coastal zone (Mitra et al., 2002, 2014; Mannino and Harvey, 2004; Coppola et al., 2018), atmospheric deposition is the most important source of open-ocean BC particles (Suman et al., 1997; Masiello and Druffel, 1998). On the global scale, it is estimated that the annual fluxes of BC particles to the ocean via the atmospheric and the river routes are 12 Tg BC yr-1 (Jurado et al., 2008) and 17–37 Tg BC yr-1 (Coppola et al., 2018), respectively. Therefore, the total annual flux of BC particles to the ocean may be on the order of 29–49 Tg BC yr-1, with the major fraction entering in the coastal zone. In addition, it has been shown that river runoff was efficient in mobilizing WSBC from soils and in delivering it to the ocean at a global rate of ∼26 Tg yr-1 (Jaffé et al., 2013). Considering that the total input of BC particles to the ocean is equivalent to the amount emitted to the atmosphere per year, the ocean appears as the main repository for BC.
While atmospheric BC is defined as particulates whose size spans from ∼50 nm for freshly emitted single nanospheres, to >5 μm for aged aggregates, the size-based separation of organic matter used in marine science for methodological convenience defines dissolved and particulate BC fractions. As a result, BC concentrations in seawater are reported for dissolved BC (DBC; BC in the <0.7 μm size fraction) and particulate BC (PBC; BC in the >0.7 μm size fraction). The marine DBC fraction may encompass WSBC and BC particles <0.7 μm, and the marine PBC fraction may encompass larger BC particles, but also BC particles <0.7 μm that aggregated with organic matter into marine aggregates, as well as WSBC sorbed onto large aggregates.
In marine sediments, BC can contribute from 5 to 30% of the total organic carbon concentration (Masiello and Druffel, 1998; Lohmann et al., 2009). In the water column, DBC represents from 1 to 7% of the pool of dissolved organic carbon (DOC) (Mannino and Harvey, 2004; Ziolkowski and Druffel, 2010). The contribution of PBC to the pool of suspended particulate organic carbon (POC) in surface waters decreases from >50% in highly BC-impacted coastal zones (Mari et al., 2017a) to <3% in oceanic surface waters (Fang et al., 2016). Finally, in the surface microlayer (SML), which represents the interfacial boundary layer (typically 40–100 μm thick) between the atmosphere and the ocean (Wurl et al., 2017, and references herein), and which constitutes the main entrance gate for BC into the ocean, BC concentration can be very high and contribute from 11 to 97% of the pool of POC (Mari et al., 2017a).
Considering the large amounts of BC continuously entering the ocean, and especially via wet deposition, one may expect this material to impact pelagic systems (Weinbauer et al., 2017). In the atmosphere, BC is associated with other aerosols, the input of BC to the marine environment may lead to an enrichment in BC-associated elements, such as organic carbon (Willey et al., 2000; Raymond, 2005), nutrients (Mahowald et al., 2008; Kanakidou et al., 2012; Wang et al., 2015), trace metals (Paytan et al., 2009; Ito, 2013), and even pesticides (Kunz et al., 2005), potentially altering the structure and activity of phytoplankton (Paytan et al., 2009; Guo et al., 2012) and bacterial (Cattaneo et al., 2010; Mari et al., 2014; Pradeep Ram et al., 2018) communities. In addition, it has been shown that the BC introduced into marine surface waters sorbs dissolved organic matter (DOM), nutrients and small particles, and stimulate aggregation processes (Mari et al., 2014, 2017a). The introduction of BC to the surface of the ocean may alter the initial steps of the biological carbon pump, i.e., DOM cycling and marine snow aggregate formation (Mari et al., 2014, 2017a).
While it is known that BC moves from the atmosphere to the ocean, and contributes significantly to the pools of dissolved and particulate organic carbon, its effects on element cycling and microbial processes in the sea are still largely unknown. To our knowledge this study is the first to assess the wet deposition of atmospheric BC, and its impacts on the concentration of nutrients and on particle dynamics. The lack of study on the effect of wet deposition of aerosols is largely due to the difficulty of timing in situ sampling to unpredictable rainfall events.
This study has been conducted in Halong Bay, Northern Vietnam (Figure 1), in October 2012. Halong Bay expands to about 1,600 km2 and includes some 2,000 islands and islets. The climate in Halong Bay is wet tropical and strongly depends on the monsoon regime, with the northeast monsoon from November to May (dry season), and the southwest monsoon from May to November (wet season). The study site is located in one of the global hotspots of atmospheric BC concentration (Ramanathan et al., 2007; Ramanathan and Carmichael, 2008), with typical concentration >3 μg BC m-3 and highest concentration during the dry season (Hien et al., 2002, 2004; Gatari et al., 2006; Mari et al., 2017a). Meteorological data (wind speed and direction, and rainfall) were obtained from a weather station (Vantage Pro2; Davis Instruments) installed in Haiphong City, at 30 km from the sampling station.
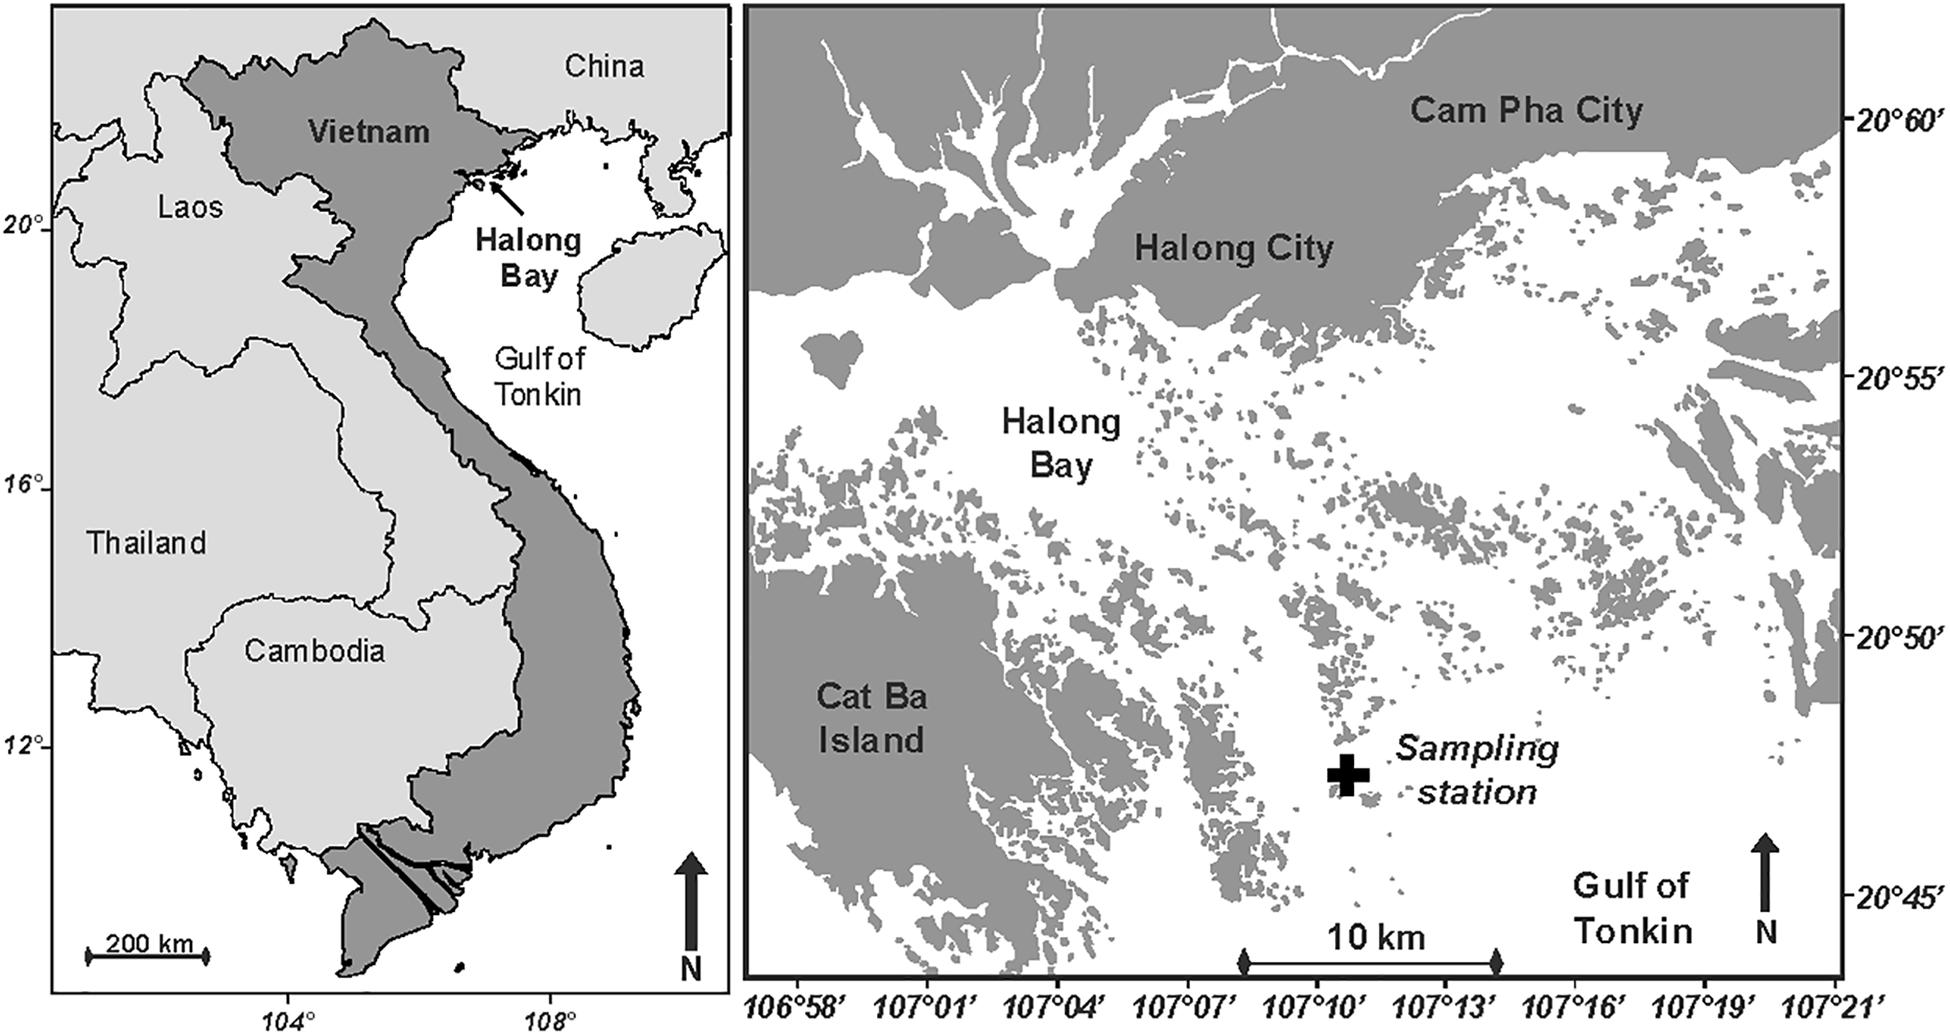
Figure 1. Maps showing the location of Halong Bay in North Vietnam, and the position of the sampling station (20°46′50′′N 107°10′16′′E; Black cross).
Seawater samples were collected every 4 h (i.e., at 11:00, 15:00, 19:00, 23:00, 03:00, and 07:00) at a 4-m deep station located in Halong Bay (Figure 1), using a 15 m coastal vessel anchored at a fixed position during a 24-h cycle, between 19 and 20 October 2012. The vertical stratification was described using a CTD probe (SBE19+, Sea-Bird Electronics, Inc., Bellevue, WA, United States). Salinity was measured from 0.7 m below the surface (conductivity probe at 70 cm from the top of the CTD), down to the bottom. Surface microlayer (SML) samples were collected from the bow of the boat (1 m above sea level) using a glass plate sampler, by vertically dipping, slowly withdrawing, and collecting the SML adhering to the glass plate into Nalgene bottles (Cunliffe and Wurl, 2014). Because each SML sampler dipping allows collecting only about 8-mL of SML, the glass plate was repeatedly dipped through the SML in order to collect enough seawater (i.e., about 1 L) for conducting the different analyses. As a result, each 1 L SML sample is the sum of about 125 successive SML samplings. Because the waters around the anchored boat were slowly moving, the time required to fill up the 1 L Nalgene bottle (about 20 min) integrated a large surface area of SML, which can be estimated to about 25 m2 based on the surface area of the glass plate (i.e., 40 cm × 25 cm). Seawater samples were collected simultaneously in the underlying water (ULW), at 1.5 m depth, using a 5-L Niskin bottle.
Seawater samples were immediately processed for later analyses of dissolved organic carbon (DOC), dissolved BC (DBC), dissolved organic nitrogen and phosphorus (DON and DOP), inorganic nutrients (i.e., NO2-, NO3-, NH4+, PO43-), particulate organic carbon and nitrogen (POC and PON), and particulate BC (PBC). Details on chemical analyses are given below.
Atmospheric BC concentration was continuously monitored for 24 h starting at 08:00 on the 19 October, using a field micro-aethalometer (MicroAeth® Model AE51; AethLabs, San Francisco, CA, United States) installed on the roof of the boat, at about 5 m above sea surface. During the 24-h cycle, the boat engine was turned off, and thus was not emitting BC. The sampling time interval was set to 1 min, and the atmospheric BC concentrations were averaged over 30 min intervals. The aethalometer provides a real-time measurement of light attenuation caused by the atmospheric BC continuously deposited on a quartz filter. BC aethalometer values have not been calibrated on site, and are therefore discussed as relative concentrations.
Samples (1 mL each) for determining the abundances of bacteria and viruses were fixed with paraformaldehyde (1% final concentration) and kept in the dark at 4°C for 30 min before flash-freezing in liquid nitrogen. Abundances were determined using a FACS Calibur flow cytometer (Becton Dickinson, Franklin Lake, NJ, United States) equipped with an air-cooled laser providing 15 mW at 488 nm with standard filter set-up (Brussaard et al., 2010). Briefly, samples were diluted with 0.2-μm pre-filtered TE buffer (10 mM Tris–HCL and 1 mM EDTA, pH 8) and stained with SYBR Green I (10,000-fold dilution of commercial stock, Molecular Probes, OR, United States). Dilution of water samples with TE buffer depends on the in situ viral and bacterial abundances, and sensitivity of the flow cytometer. Before proceeding with counts, we made a validity check and standardization. Dilution did not have any significant bearing on bacterial counts. This methodology has been previously validated and adopted for reporting bacterial and viral counts in Halong Bay (Pradeep Ram et al., 2018). The mixture was incubated for 5 min, heated for 10 min at 80°C in the dark, and cooled for 5 min prior to analysis. Bacteria and viruses differing in fluorescence intensity were detected by their signature in a side scatter versus green fluorescence (530 nm wavelength, fluorescence channel 1 of the instrument) plot. Flow cytometry list modes were analyzed using CellQuest Pro software (BD Biosciences, version 4.0). A blank was routinely examined to control for potential contamination of the equipment and reagents.
Analyses of nitrate (NO3-), nitrite (NO2-), ammonium (NH4+), phosphate (PO43-), dissolved organic nitrogen (DON) and dissolved organic phosphorus (DOP) were performed on duplicate 30-mL subsamples filtered through 47 mm pre-combusted (450°C overnight) Whatman GF/F filters and collected in acid washed 30-mL Nalgene flasks (soaked in 10% HCl). Samples were filtered onboard and the flasks were immediately placed in a cool box filled with ice prior to pasteurization (80 ± 3°C for 6 h; Daniel et al., 2005) in the laboratory after the end of the 24-h cycle. After pasteurization, the flasks were stored in the dark until analysis. For each sample, one 30-mL subsample was analyzed for dissolved inorganic nutrients, the other for total dissolved nitrogen and phosphorus.
Inorganic nutrient concentrations were measured with an Autoanalyzer III Seal Bran Luebbe (Mequon, WI, United States) according to Aminot and Kerouel (2007). To achieve reproducible nutrient measurements, standards were compared to commercially available products (OSIL). The detection limits of NO3-, NO2-, and PO43- were 0.05, 0.05, and 0.02 μmol L-1, respectively. Ammonium concentrations were determined by the sensitive fluorescence procedure according to Holmes et al. (1999) with a detection limit of 5 nmol N L-1. Standard curves were performed with six reference solutions prepared in the concentration range of samples.
Determination of dissolved (i.e., sum of organic and inorganic) nitrogen (DN) and phosphorus (DP) was carried out simultaneously on the same samples using the wet-oxidation procedure (Raimbault et al., 1999), where persulfate was used to digest the organic matter, and the inorganic end-products (i.e., PO43- and NO3-) determined by colorimetry as described above.
The concentrations of DON and DOP were calculated as DN and DP minus dissolved inorganic nitrogen (DIN; nitrate+nitrite+ammonium) or phosphate (i.e., dissolved inorganic phosphorus, or DIP) measured in the same samples. The analytical accuracy, determined on replicates of reference samples, was close to 0.5 and 0.05 μmol L-1 for DON and DOP, respectively.
In order to distinguish between DBC and non-pyrogenic dissolved organic carbon (thereafter defined as DOC) within total dissolved organic carbon (T-DOC; i.e., sum of non-pyrogenic DOC and DBC), we used the following combination of analytical procedures. The concentrations of T-DOC were measured with a TOC VCPH analyzer (Shimadzu), and the concentrations of DBC were measured using an ultrahigh performance liquid chromatography system on DOM extracts obtained by solid-phase extraction. Non-pyrogenic DOC (i.e., thermally unaltered DOC) is defined as the fraction of T-DOC that is not targeted by the benzenepolycarboxylic acids (BPCAs) method used to quantify DBC concentrations (see below). The concentration of non-pyrogenic DOC was obtained by subtracting the concentration of DBC from that of T-DOC.
Analyses of T-DOC were performed on 20-mL subsamples immediately filtered through 47 mm pre-combusted Whatman GF/F filters and collected in pre-combusted (450°C, overnight) 24-mL glass tubes, preserved with 24 μL of 85% phosphoric acid (H3PO4). Samples were stored in the dark until analysis. T-DOC concentration was measured with a TOC VCPH analyzer (Shimadzu) with potassium phthalate calibration standards over the measurement range 0–400 μmol C L-1 (n = 15). Certified reference materials (Hansell Laboratory, University of Miami, FL, United States) were used as external standards to determine the machine blank. Both low carbon water (LCW; ∼1 μmol C L-1) and deep seawater (DSW; ∼45.5 μmol C L-1) standards were analyzed at the beginning of each sample run (i.e., every 10 samples). Ultrapure water (Milli-Q) blanks were regularly injected as “sample blanks” during the analysis sequence to ensure that no sample carry-over occurred. The machine blank, calculated for each run of 10 samples as [(LCWmeasured – 1) + (DSWmeasured – 45.5)]/2, averaged -8.3 ± 2.6 μmol C L-1. The reported T-DOC values are blank corrected by subtracting the machine blank obtained at the beginning of each sample run, and are the average (±standard deviation, SD) of two 20-mL subsamples.
Samples for DBC analyses were collected and prepared according to the solid-phase extraction (SPE) method (Dittmar et al., 2008). For each sampling occasion, 500 mL of SML and 500 mL of ULW samples were filtered through pre-combusted (450°C overnight) 47 mm diameter GF/F filters, directly into acid washed polycarbonate bottles and immediately acidified with hydrochloric acid (37%) to reach a pH of 2. The bottles were stored in a cool box filled with ice (<4°C) until SPE procedure in the laboratory. Solid phase extractable DOM is referred to as SPE-DOM in the following. Cartridges filled with Varian Bond Elut sorbents (PPL; sorbent consisting of a styrene divinyl copolymer used for the retention of highly polar to non-polar substances from large volumes of water) were used to concentrate DOM. The cartridges were rinsed with methanol (HPLC grade), and then flushed with pH 2 ultrapure water (LC/MS Reagent, JT Baker® 9831-03) immediately before use. The filtered and acidified samples were gravity processed through the cartridges at a flow rate of <15 mL min-1. Immediately after extraction, remaining salts were washed off the cartridges with 40 mL pH 2 ultrapure water. The cartridges were dried under a N2 stream, before elution of the SPE-DOM with 8 mL of methanol. The eluates were stored in acid rinsed 8-mL vials at -18°C until analysis. This method allows concentrating DOM molecules, including DBC, in salt free methanol extracts.
Dissolved BC was analyzed as benzenepolycarboxylic acids (BPCAs) after nitric acid oxidation following the method of Dittmar (2008). Aliquots of 1 mL extract, corresponding to ∼2–8 μmol of SPE-DOC, were transferred to combusted (450°C, 4 h) glass ampoules and dried overnight at 50°C. Dry extracts were dissolved in 500 μL of nitric acid (65%), ampoules were sealed and placed in a pressure bomb to be heated for 9 h at 170°C. After cooling, 450 μL of the solution were transferred to sample vials and evaporated to dryness in a vacuum centrifuge (Christ RV2-18). Samples were dissolved in 100 μl of phosphate buffer (pH 7.2) and analyzed on an ultrahigh performance liquid chromatography system (UPLC, Waters Acquity) equipped with a photodiode array absorbance detector. BPCAs were identified based on retention time and absorbance spectra (220–380 nm) and quantified using four-point calibration curves and the respective absorbance signal at 240 nm. DBC concentrations were calculated from BPCA concentrations as outlined in Dittmar (2008), with the modification detailed in Stubbins et al. (2015).
Total particulate organic carbon (T-POC), particulate BC (PBC), and particulate organic nitrogen (PON) were analyzed in duplicate 100-mL subsamples (i.e., one subsample was used to measure T-POC, the other was used to measure PBC) immediately filtered onboard onto pre-combusted (450°C overnight) 25 mm Whatman GF/F filters. After filtration, the filters were individually placed in 2-mL plastic tubes and were immediately frozen in liquid nitrogen. In the laboratory, filters were dried at 60°C for 24 h and stored in sealed plastic bags until analyses. The concentration of non-pyrogenic POC (thereafter defined as POC) was calculated for each sample by subtracting the concentration of PBC from the concentration of T-POC.
For PBC analyses, non-pyrogenic POC was removed by a chemothermal oxidation (CTO) pre-treatment of the filters at 340 ± 0.5°C for 2 h and under an oxidative gas (pure oxygen) flow to prevent charring during the treatment (Cachier et al., 1989; Kuhlbusch, 1995). According to Nguyen et al. (2004), this CTO pre-treatment in oxygen at 340°C (Kuhlbusch, 1995) yields similar results for soot and char as CTO in air at 375°C (Gustafsson et al., 1997), and the remaining carbon on the filters is operationally defined as PBC (Kuhlbusch, 1995; Gustafsson et al., 1997).
Prior to the determination of T-POC and PBC, all the filters were acidified with 100 μL of 0.5 N H2SO4 in order to remove inorganic carbon. Acidified samples were kept in a drying oven (60°C) until analyses. The concentrations of T-POC, PBC, and PON were determined by high temperature combustion (900°C) performed on a CN Integra mass spectrometer (Raimbault et al., 2008).
Particle volume concentration profiles were measured in situ using a LISST-100X Type-C (Laser In-Situ Scattering and Transmissometry; Sequoia Scientific, Inc.). This equipment uses the technique of laser diffraction to obtain particles’ equivalent spherical diameter (μm) and enables measurement of volumetric particulate concentration distributed over 32 logarithmic size classes ranging from 2.5 to 500 μm. The acquisition frequency was set to 1 Hz. This probe performs a non-intrusive measurement of the volume concentration of suspended particles according to their size and per unit volume of water (μm3 mL-1). The data presented herein were normalized to the width of each size class. Because the probe was lowered vertically into the water column, the particle volume concentration profiles were measured from 0.7 m below the surface (optical measurement chamber at 70 cm from the top of the LISST, were the pressure sensor is located), down to the bottom.
At the start of the 24-h cycle, at 08:00 on 19 October, atmospheric BC concentration was high (average 5.1 ± 3.1 μg BC m-3) until the heavy rainfall event of 4 L m-2 that occurred after the first seawater sampling (Figure 2). During this heavy rainfall event that lasted for about one hour, atmospheric BC concentration decreased drastically by a factor of ∼9, i.e., from 5.8 ± 2.9 μg BC m-3 to 0.7 ± 0.4 μg BC m-3. After the end of this first rainfall event, the concentration of atmospheric BC increased rapidly from 12:30 to 13:00 to reach 3.1 ± 1.6 μg BC m-3. Two smaller rainfall events were recorded later during the cycle and also led to a decrease, although moderate, of the concentration of BC in the atmosphere.
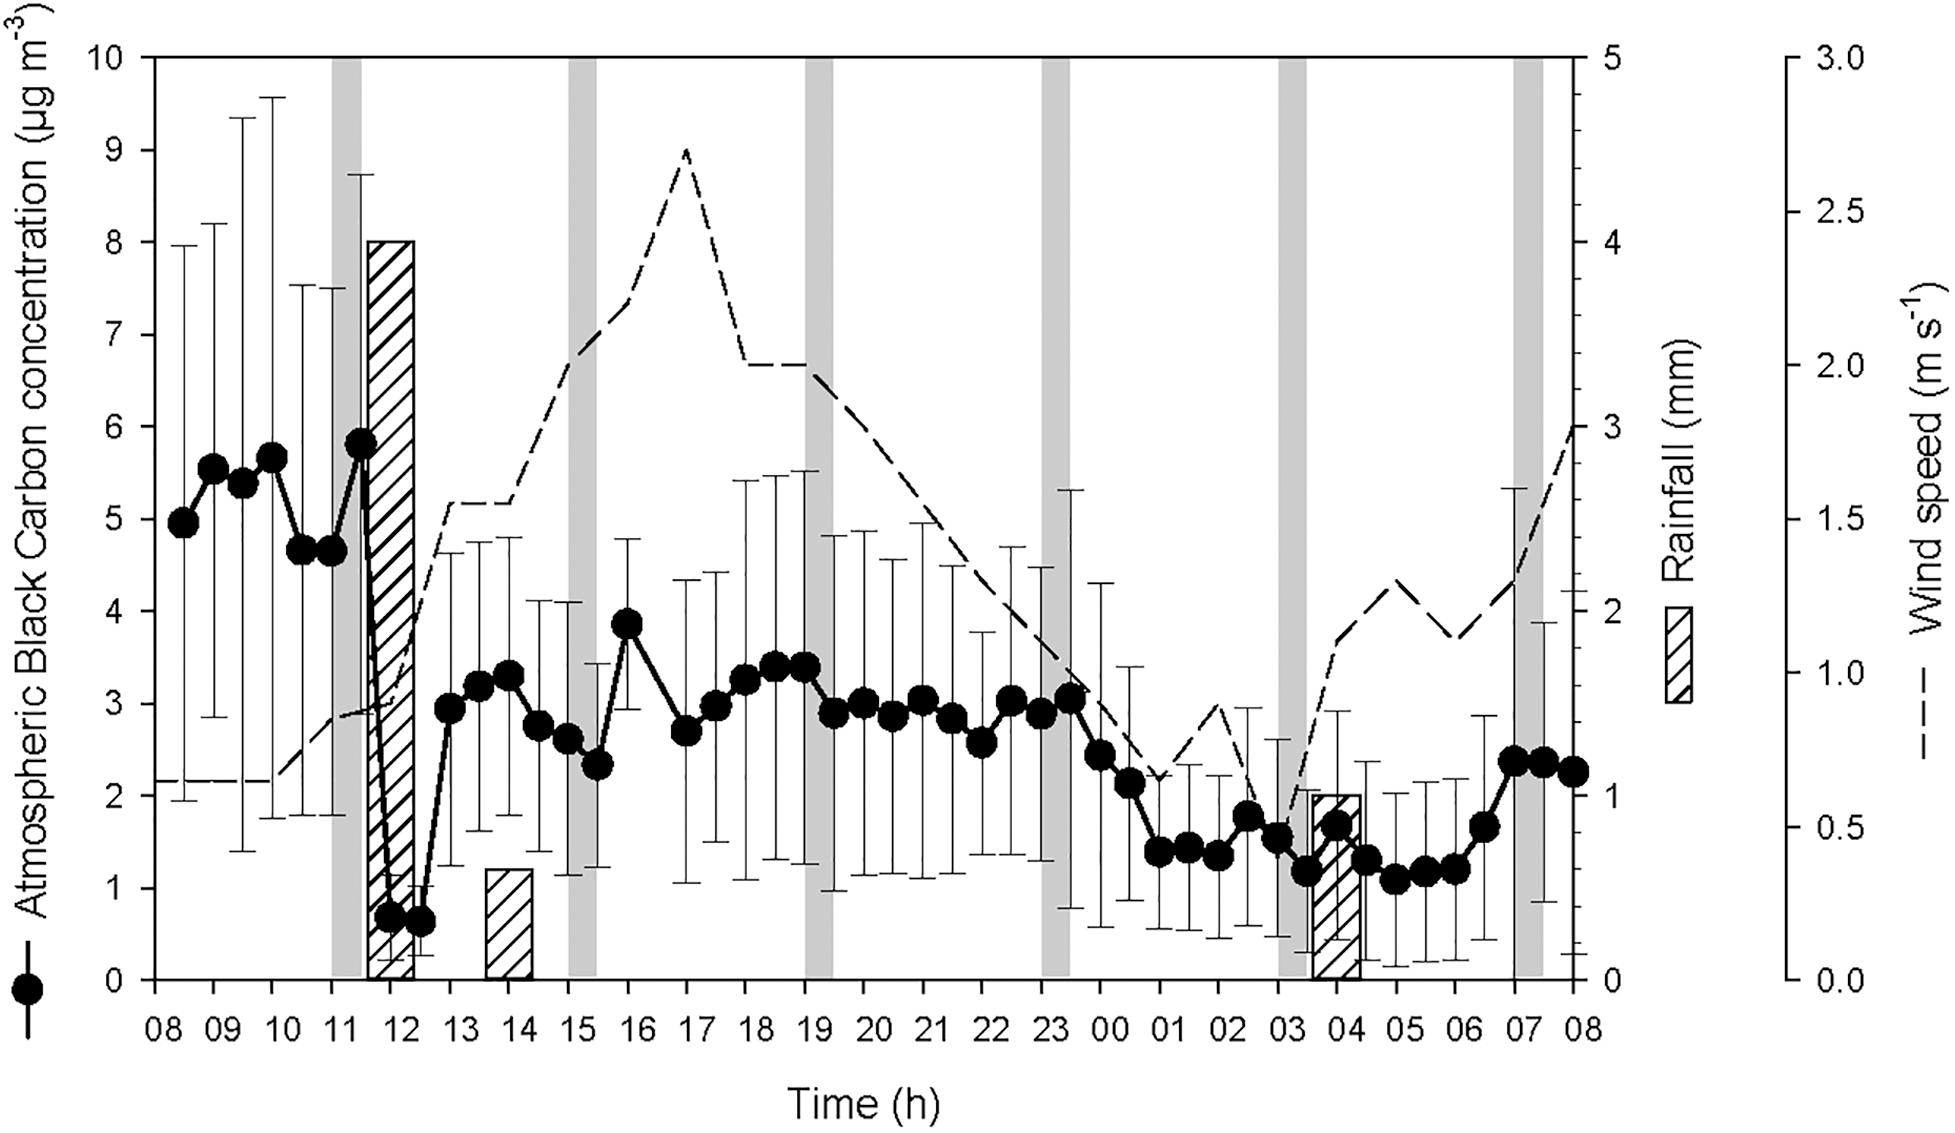
Figure 2. Atmospheric black carbon concentration (average for every 30 min ± SD) at the sampling station, and precipitation and wind speed measured in Haiphong City during the 24-h cycle. The vertical gray bars represent the six sampling occasions.
The two rainfall events recorded by the weather station on the 19 October at 12:00 and 14:00 were observed at the same time at the sampling station. This timing is reflected in the measured timing of atmospheric BC (Figure 2) and the variations of salinity, temperature and density of seawater (Figure 3). The actual timing of the third rainfall event is more difficult to confirm at sea. However, according to the measured diminution of salinity and seawater density, it can be assumed that it started to rain at the sampling station just before 03:00.
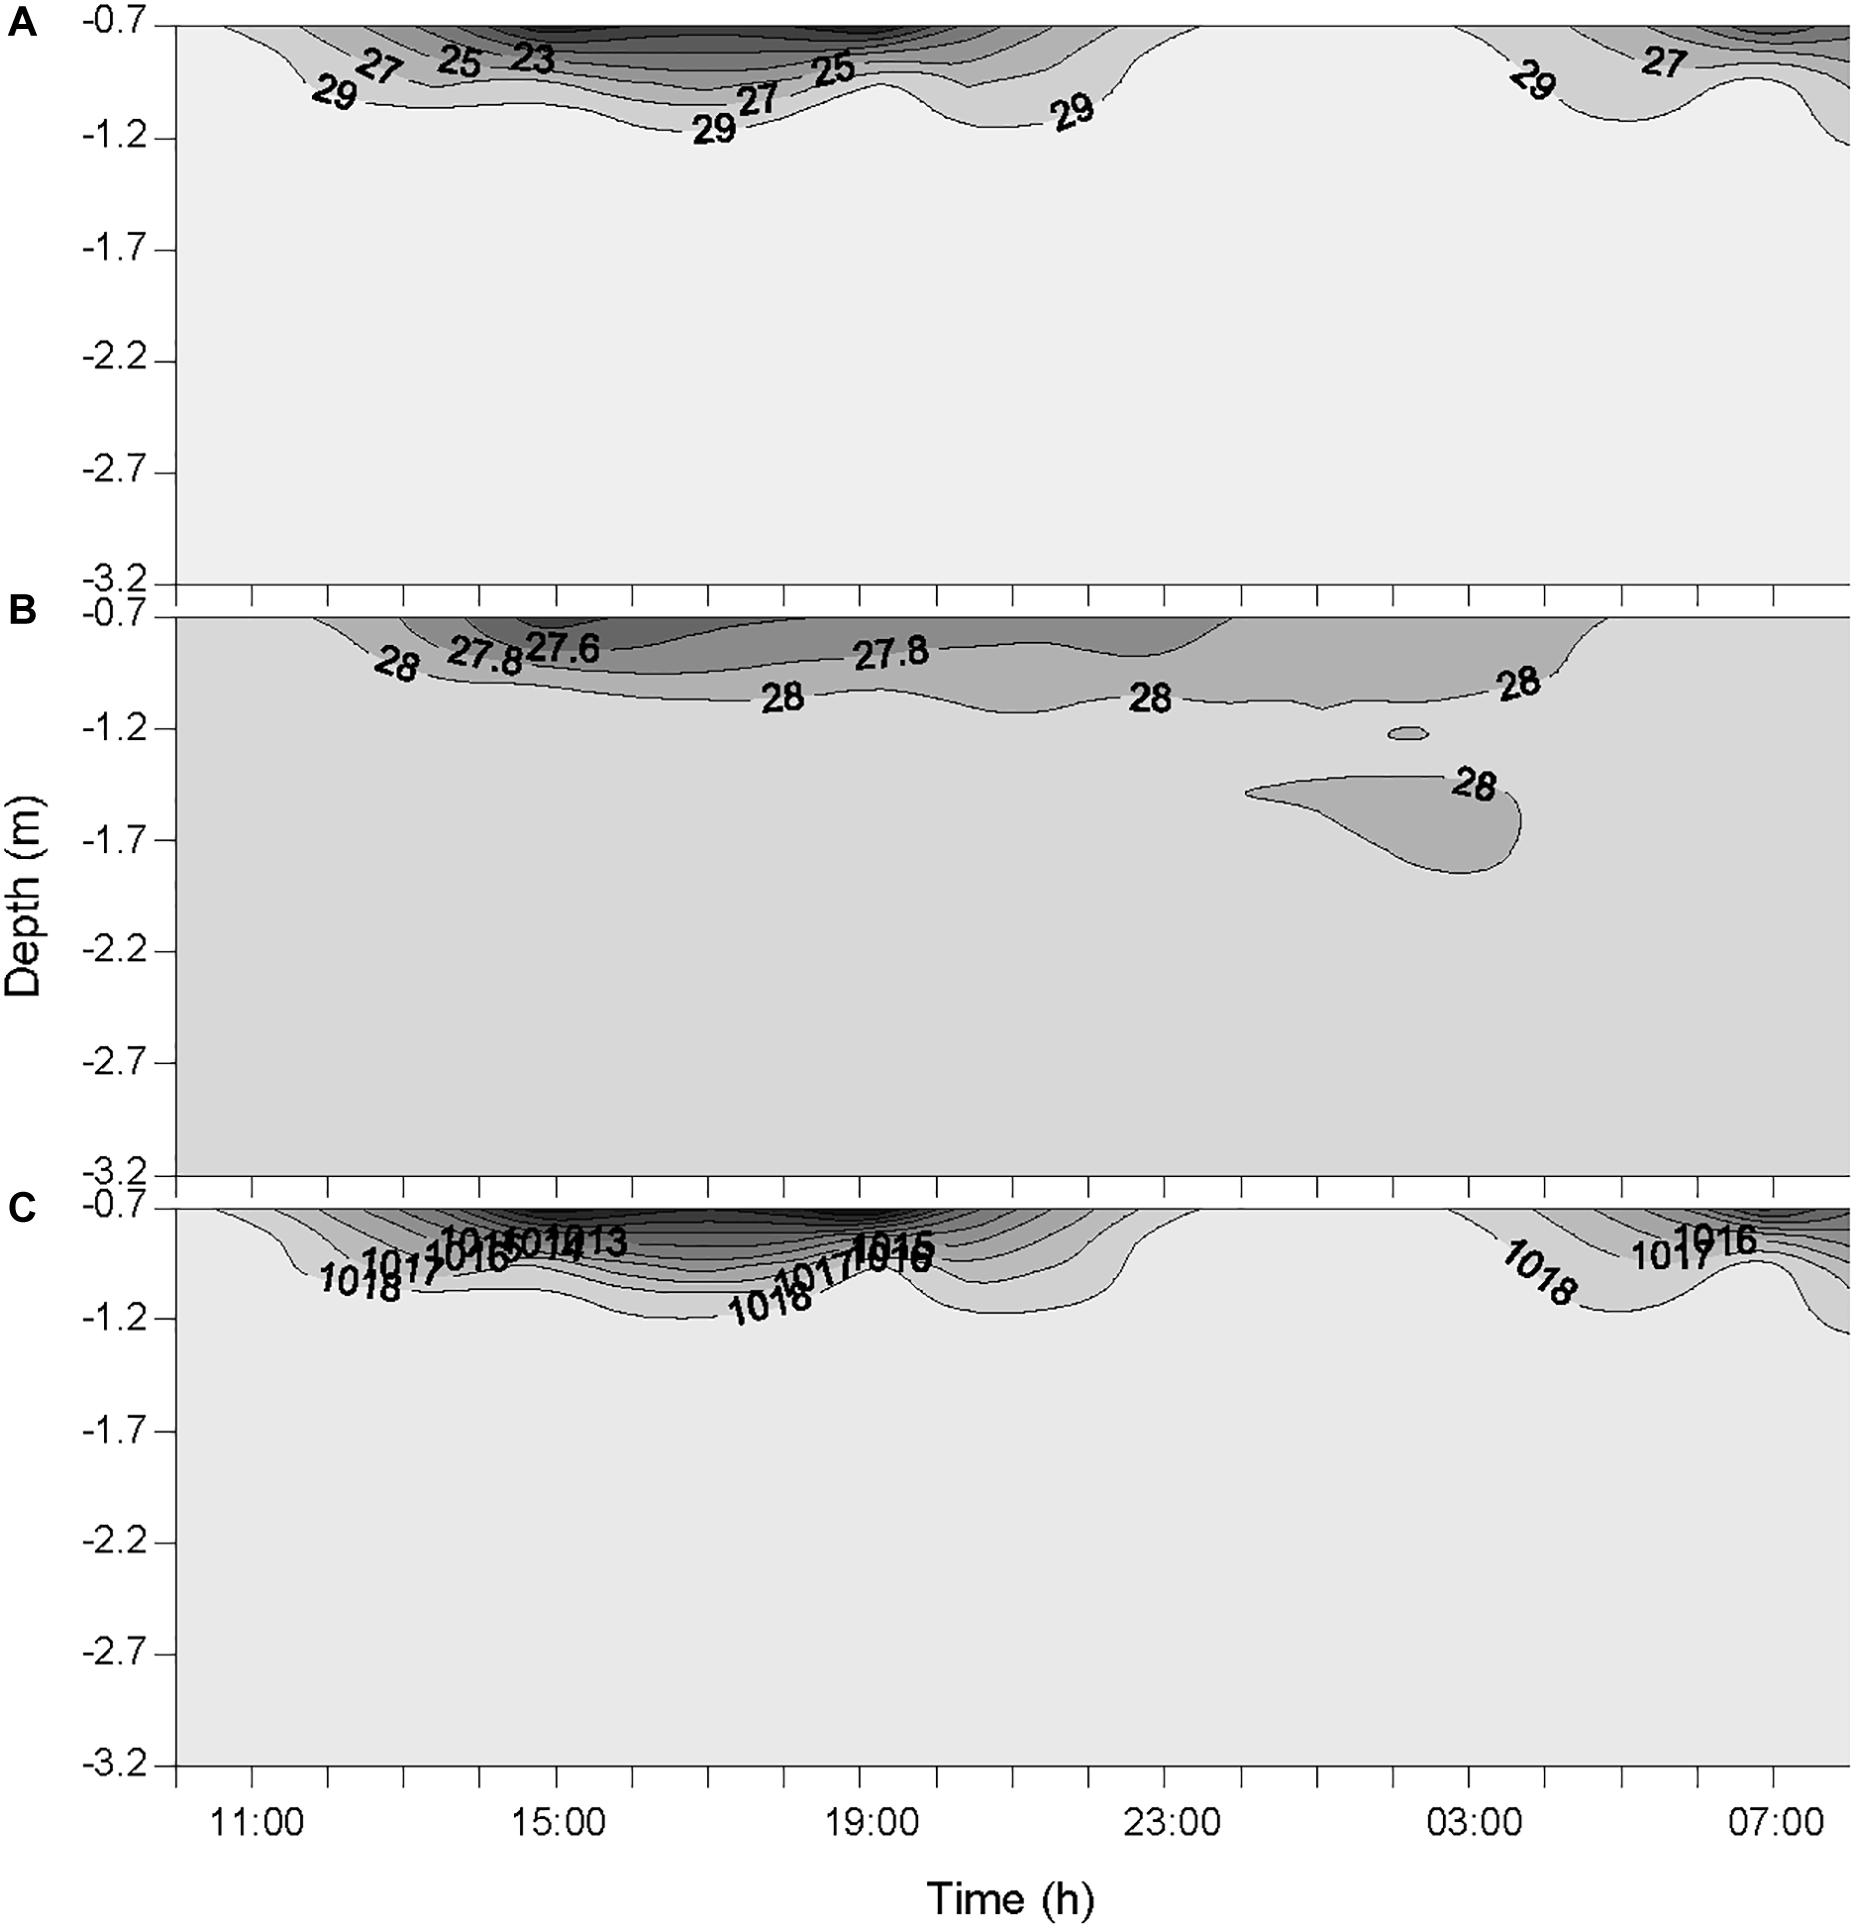
Figure 3. Variations of salinity (A), temperature (°C) (B), and seawater density (kg m-3) (C) in the water column during the 24-h cycle. Each contour plot was obtained from a data grid of >3000 points (i.e., six sampling occasions on the x-axis, and >500 data points on the y-axis).
The temporal offset observed between the rainfall event that was recorded by the weather station the 20 October at 04:00, and the decrease of atmospheric BC concentration that was observed from 23:30 to 01:00 (concentration remained low until 07:00), is most likely due to the 30-km distance between the weather station that measured the rain and the sampling station in Halong Bay. This suggests that it was probably raining slightly all over the area from about 23:30, hence maintaining the overall atmospheric BC concentration at a low level. These rainfall events resulted in salinity drops at the top of the water column (Figure 3). However, since the salinity was measured from 0.7 m below the surface, the actual salinity in the top 70 cm and the SML is not known. As the first two rainfall events occurred between two consecutive samplings, they are considered as a single heavy rainfall event for interpreting the observed biogeochemical changes, and hence are referred as the “first rainfall event” hereafter. As a consequence, the third moderate rainfall event, is referred as the “second rainfall event” hereafter.
The average wind speed was relatively low (i.e., 1.3 ± 0.6 m s-1) during the 24-h cycle, but increased from the start of the two rainfall events (i.e., from ∼0.6 to 2.6 m s-1 after the first event, and from ∼0.5 to 1.5 m s-1 after the second) (Figure 2). The increased wind speed between the rainfall events and the subsequent increase in turbulence generated in the surface layer may explain the increased surface salinity between the two events.
Over the course of the 24-h cycle, the concentrations of POC and PBC averaged 38 ± 12 and 28 ± 30 μmol L-1, respectively, in the SML, and averaged 11 ± 3 and 10 ± 3 μmol L-1, respectively, in the ULW (Figure 4). The contribution of PBC to the pool of T-POC was on average 37 ± 14% in the SML and 47 ± 8% in the ULW. The lower contribution of PBC to the pool of T-POC in the SML is due to the threefold higher concentration of POC in the SML in comparison to the ULW.
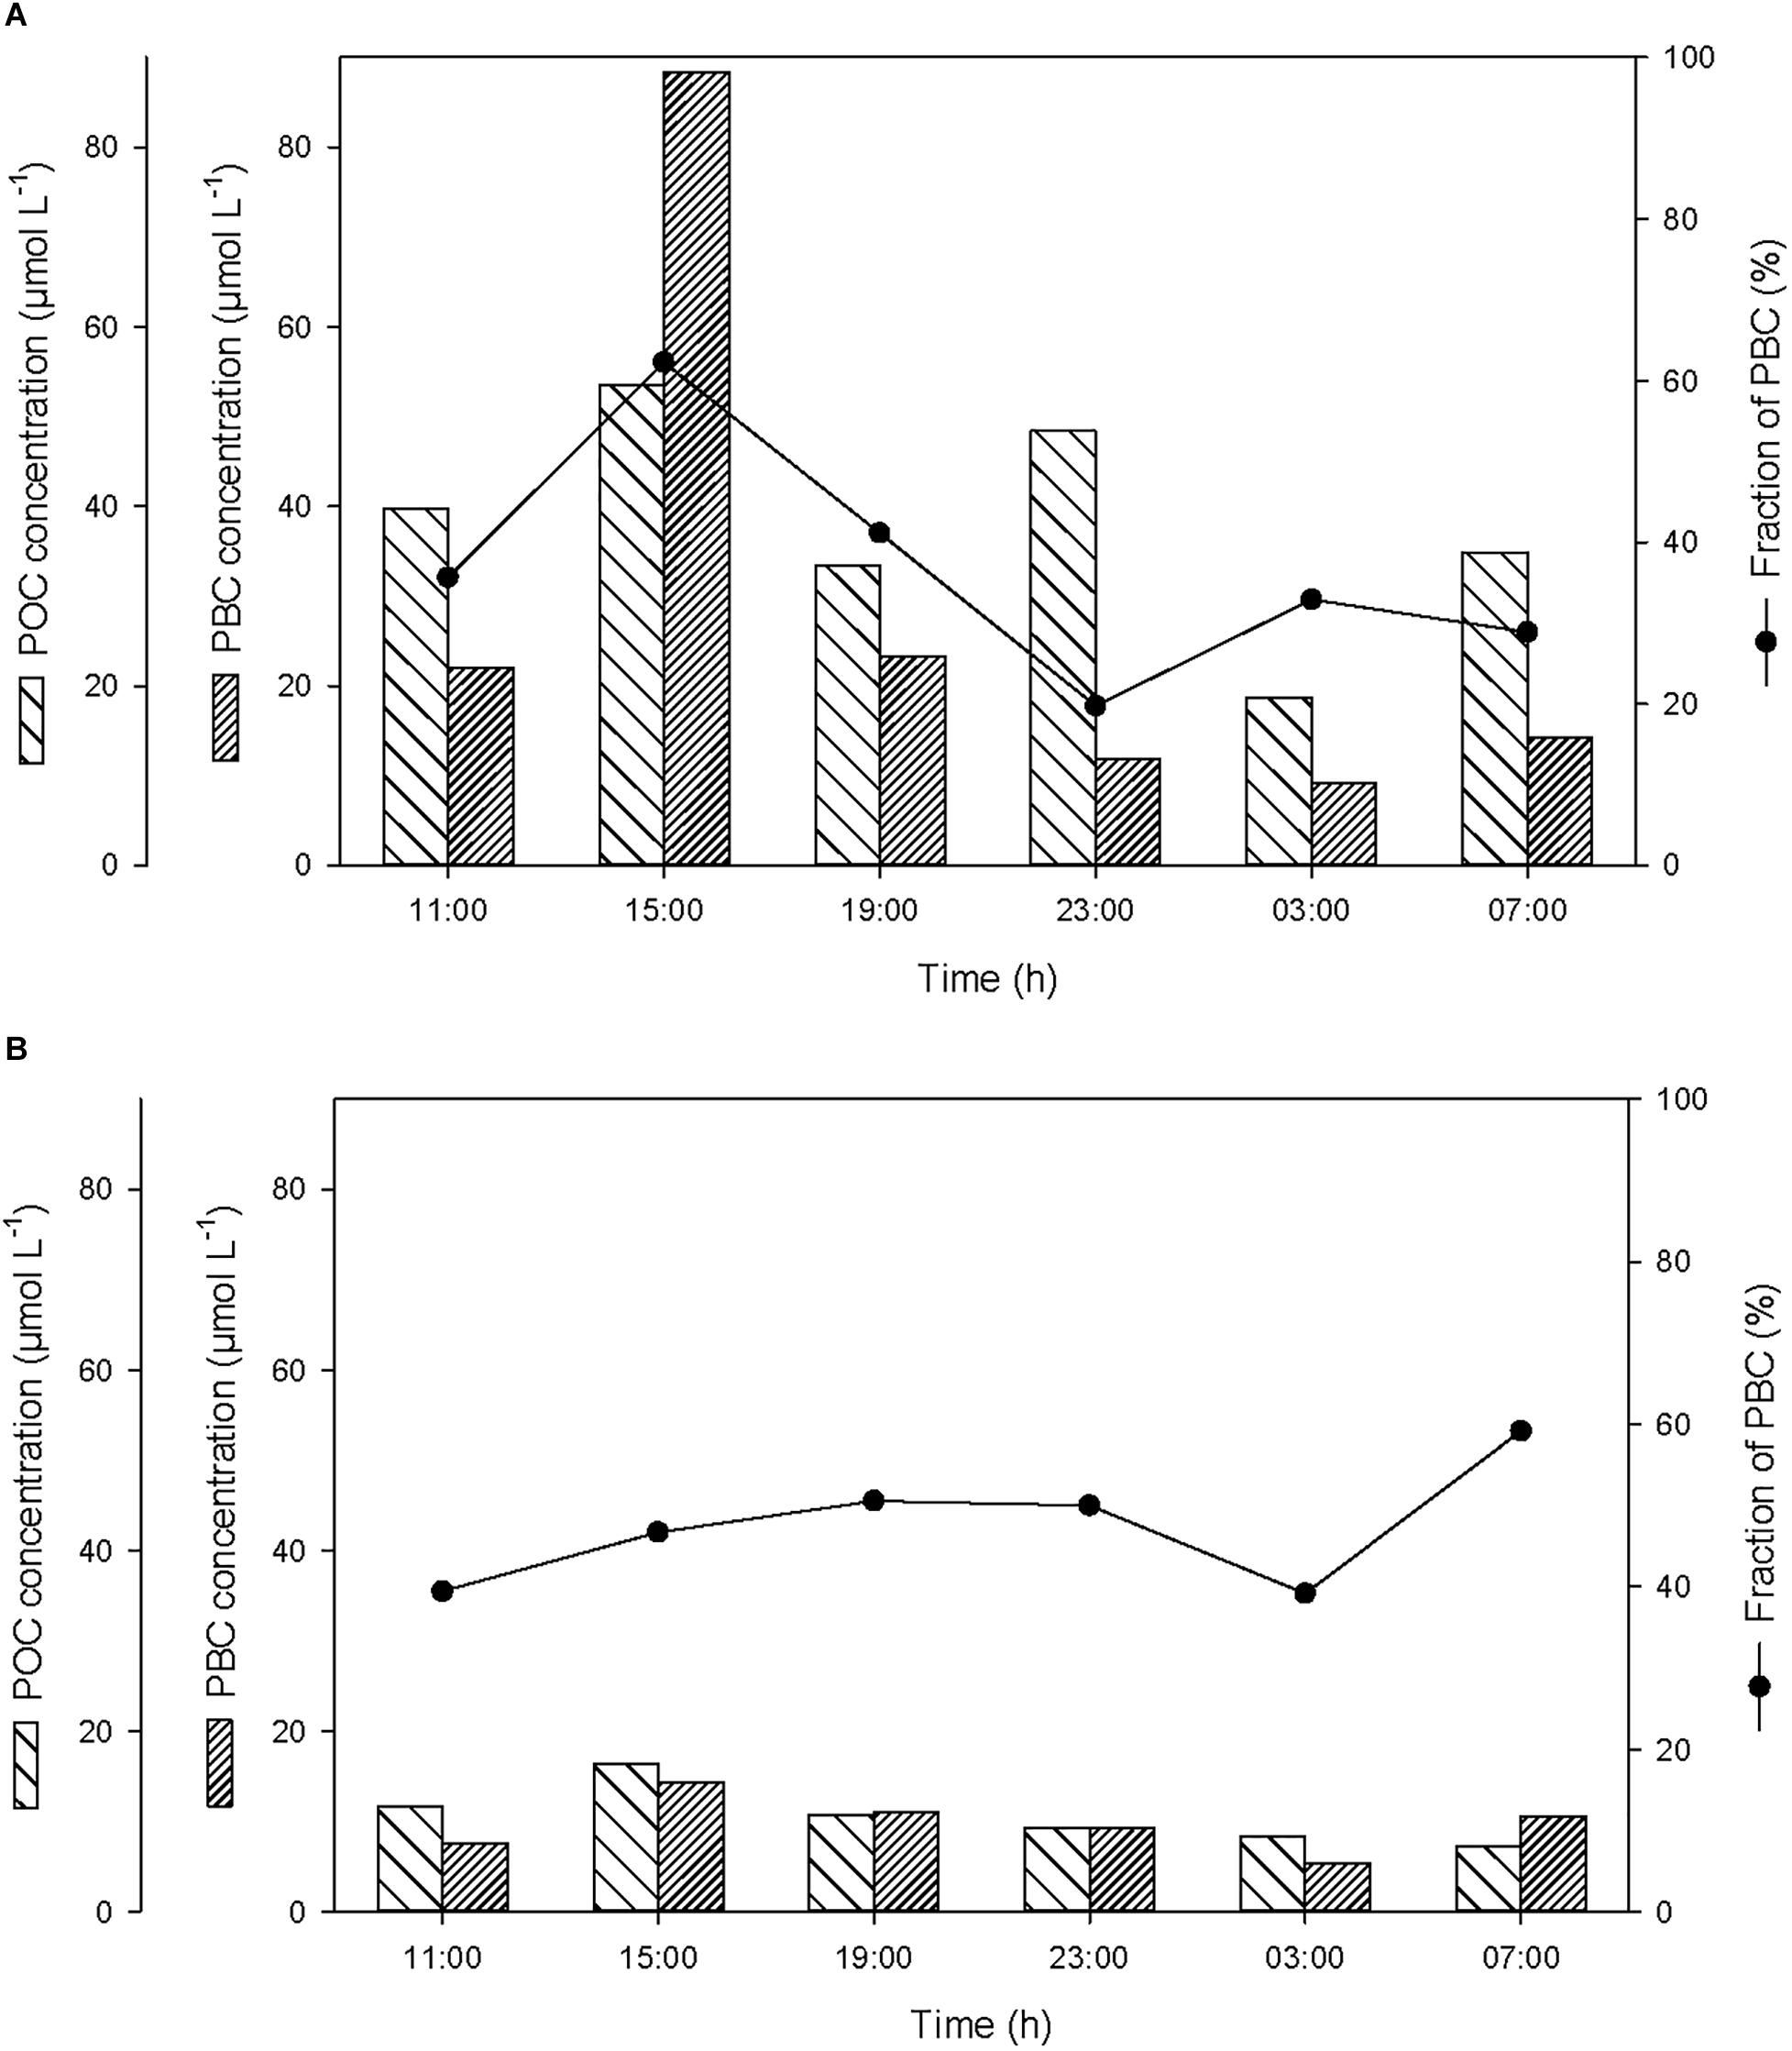
Figure 4. Variations of non-pyrogenic particulate organic carbon (POC) and particulate BC (PBC) concentrations, and fraction of PBC in the pool of total POC (T-POC), (A) in the SML and (B) in the ULW.
At the start of the cycle (at 11:00), the concentrations of POC and PBC in the SML were 40 and 22 μmol L-1, respectively (Figure 4A), and were a factor of 3.4 higher than in the ULW (Figure 4B). After the first rainfall event, the concentrations of POC and PBC increased in the SML by a factor of 1.3 and 4.0, respectively, and in the ULW by a factor of 1.4 and 1.9, respectively. This suggests that the BC removed from the atmosphere during the rainfall ended up in the surface water of Halong Bay, and enriched the SML and the water column with both PBC and POC. This enrichment mainly occurred in the SML and was mostly due to the input of PBC, with the contribution of PBC to the pool of T-POC in the SML increasing from 35 to 62%.
The second rainfall event that occurred before the last sampling, and that induced a moderate decrease of atmospheric BC, was also followed by a small enrichment of POC and PBC in the SML and in the ULW (Figure 4).
Over the course of the 24-h cycle, the concentrations of DOC and DBC averaged 139.5 ± 19.6 and 1.8 ± 0.3 μmol L-1, respectively, in the SML, and averaged 101.4 ± 7.1 and 1.5 ± 0.4 μmol L-1, respectively, in the ULW (Figure 5). The contribution of DBC to the pool of T-DOC was relatively constant and averaged 1.3 ± 0.3% in the SML and 1.5 ± 0.5% in the ULW.
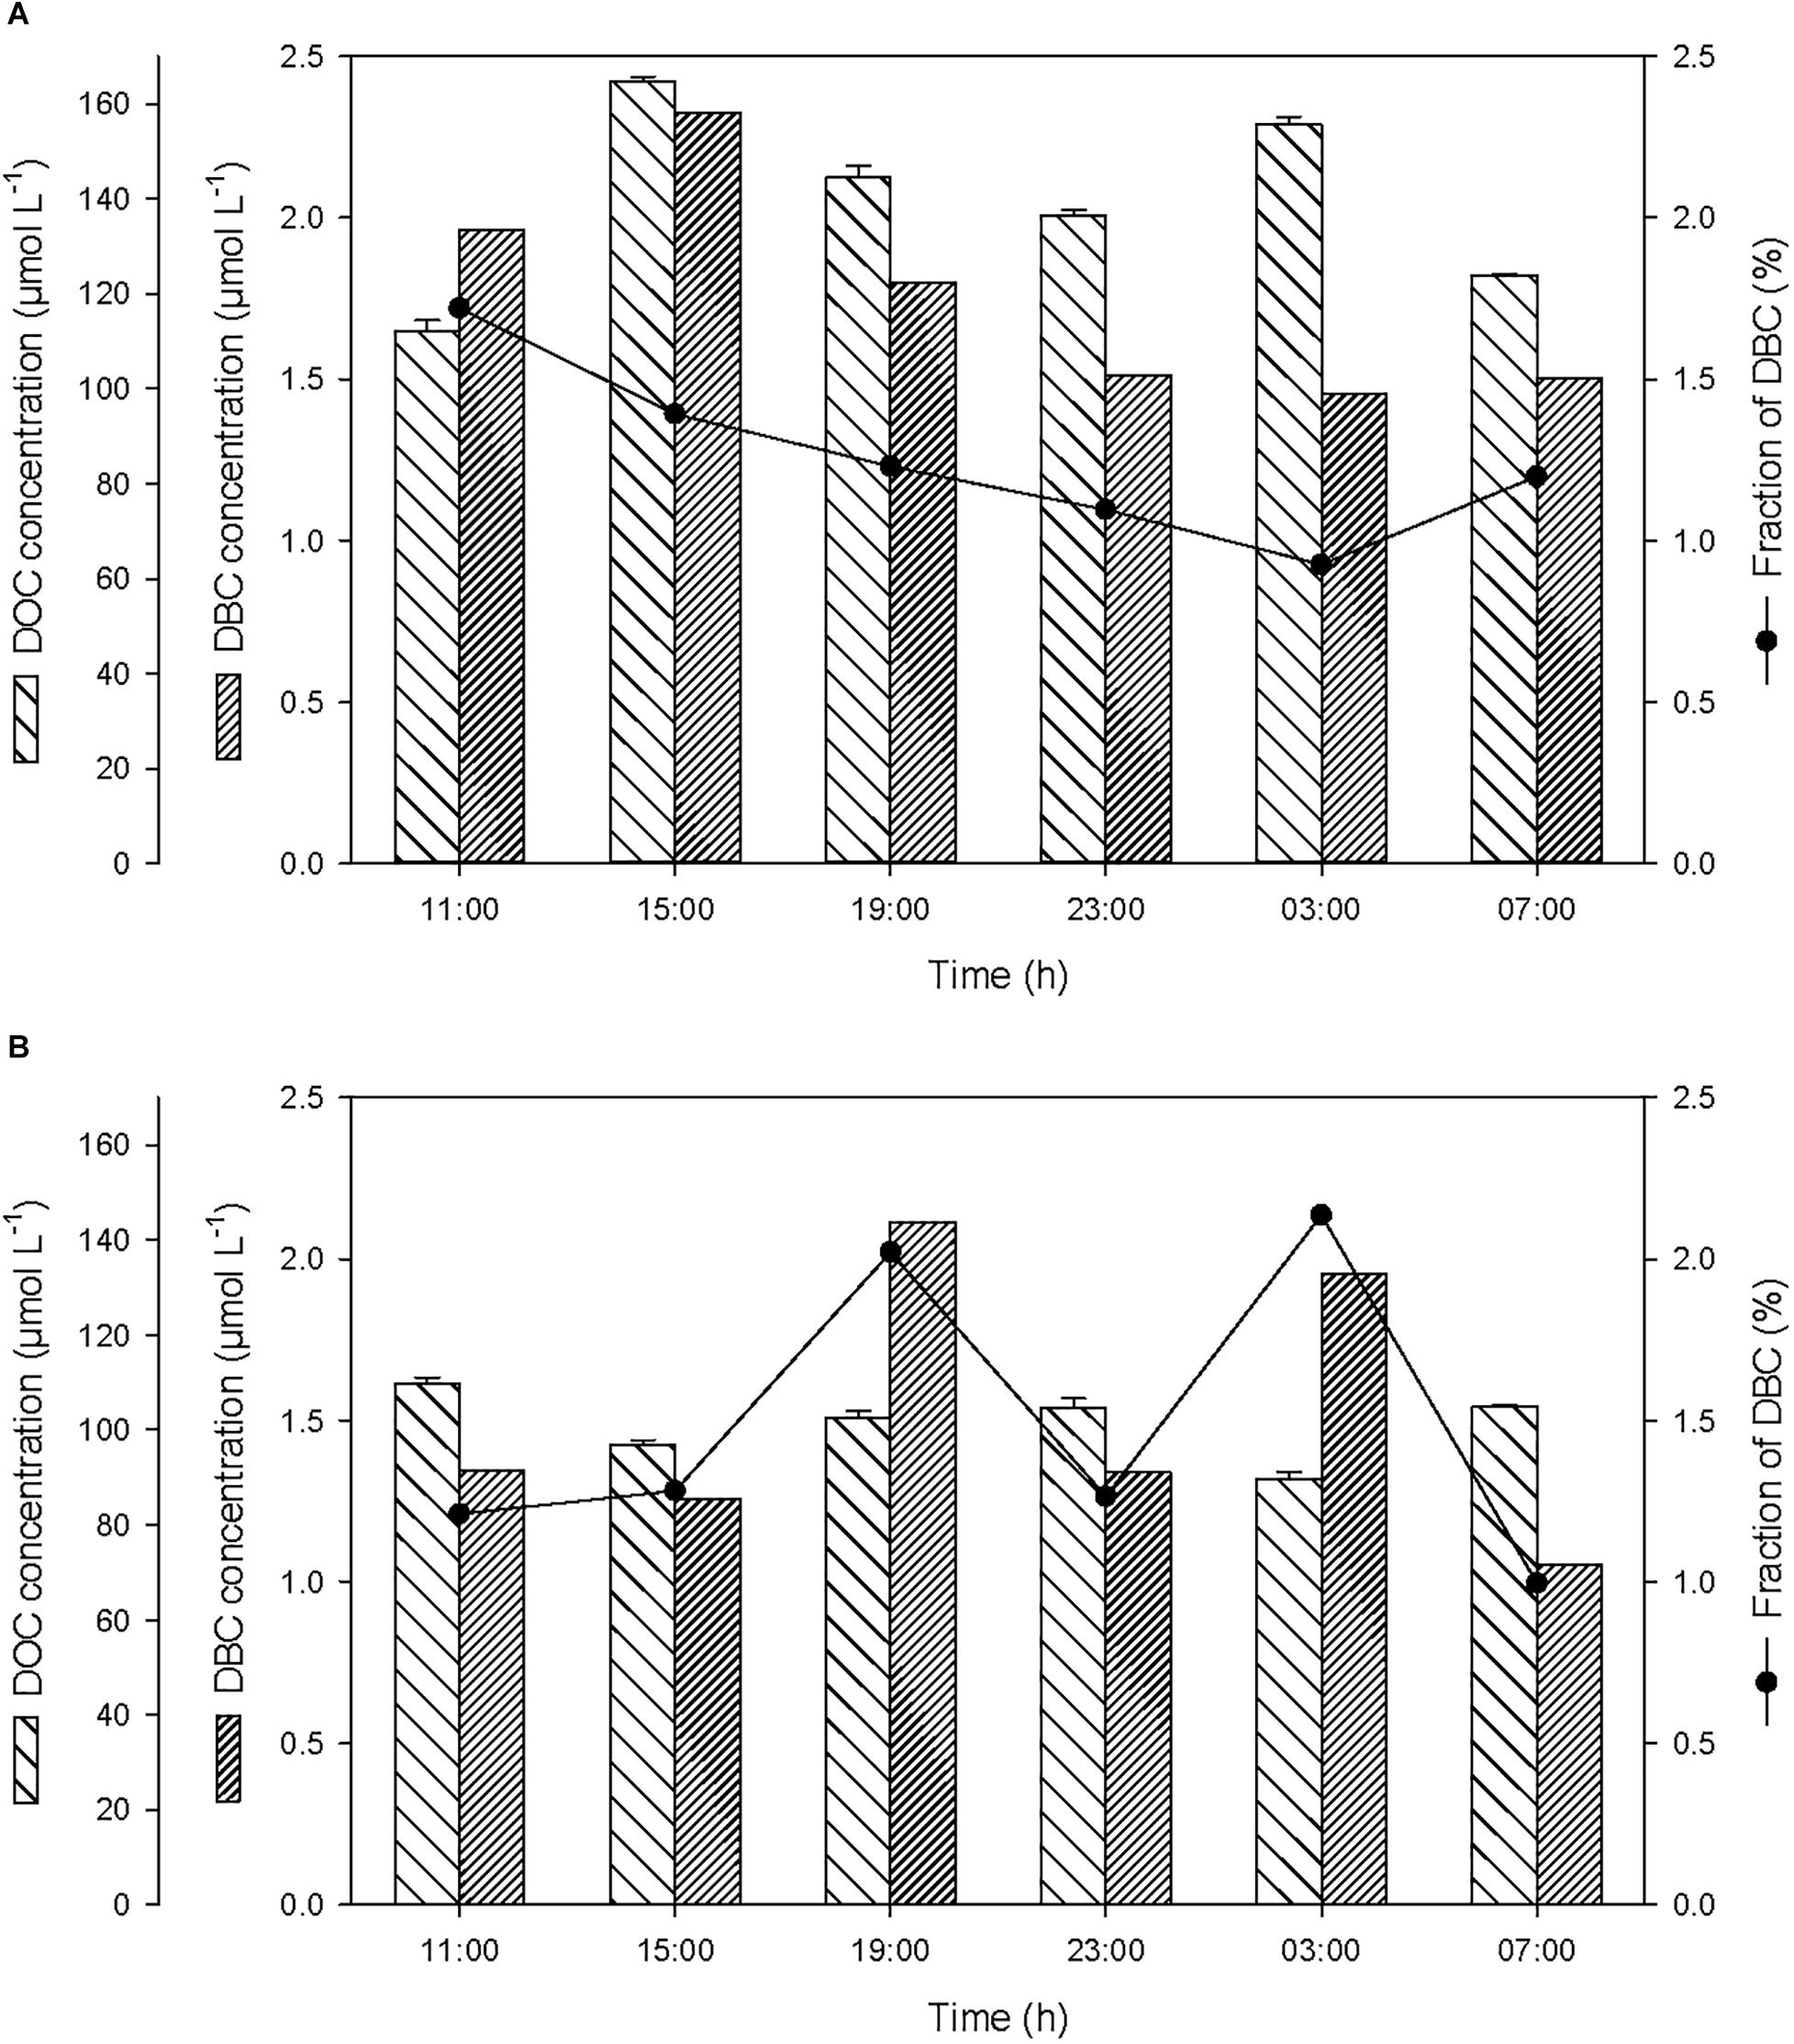
Figure 5. Variations of non-pyrogenic dissolved organic carbon (DOC), and dissolved BC (DBC) concentrations, and fraction of DBC in the pool of total DOC (T-DOC), (A) in the SML and (B) in the ULW.
After the first rainfall event, the concentrations of DOC and DBC increased by a factor of 1.5 and 1.2, respectively, in the SML (Figure 5A). On the contrary, in the ULW, this rainfall event was followed by a moderate decrease (i.e., by a factor of ∼0.9) in DOC concentration (Figure 5B). This decrease coinciding with the drastic increase in the concentration of PBC suggests that DOC may have been sorbed by PBC and removed by sinking.
Wet deposition events coincided with enrichments of the SML in POC, PBC, DOC, DBC, with enrichment factors (EF, calculated as the ratio between the concentration of each variable after versus before the rainfall) due to the first rainfall of EFPOC = 1.3, EFPBC = 4.0, EFDOC = 1.5, EFDBC = 1.2 (Table 1). Assuming that the variations of concentration observed in the SML after the first rainfall event were caused by wet deposition, the carbon content of rainwater should have been distributed as 50% organic carbon (of which 21% are particulate and 79% are dissolved) and 50% BC (of which 99% are particulate and 1% is dissolved). This suggests that the rainwater was composed of 40% dissolved (1% BC and 99% of organic carbon or OC) and 60% particulate carbon (83% BC and 17% OC).
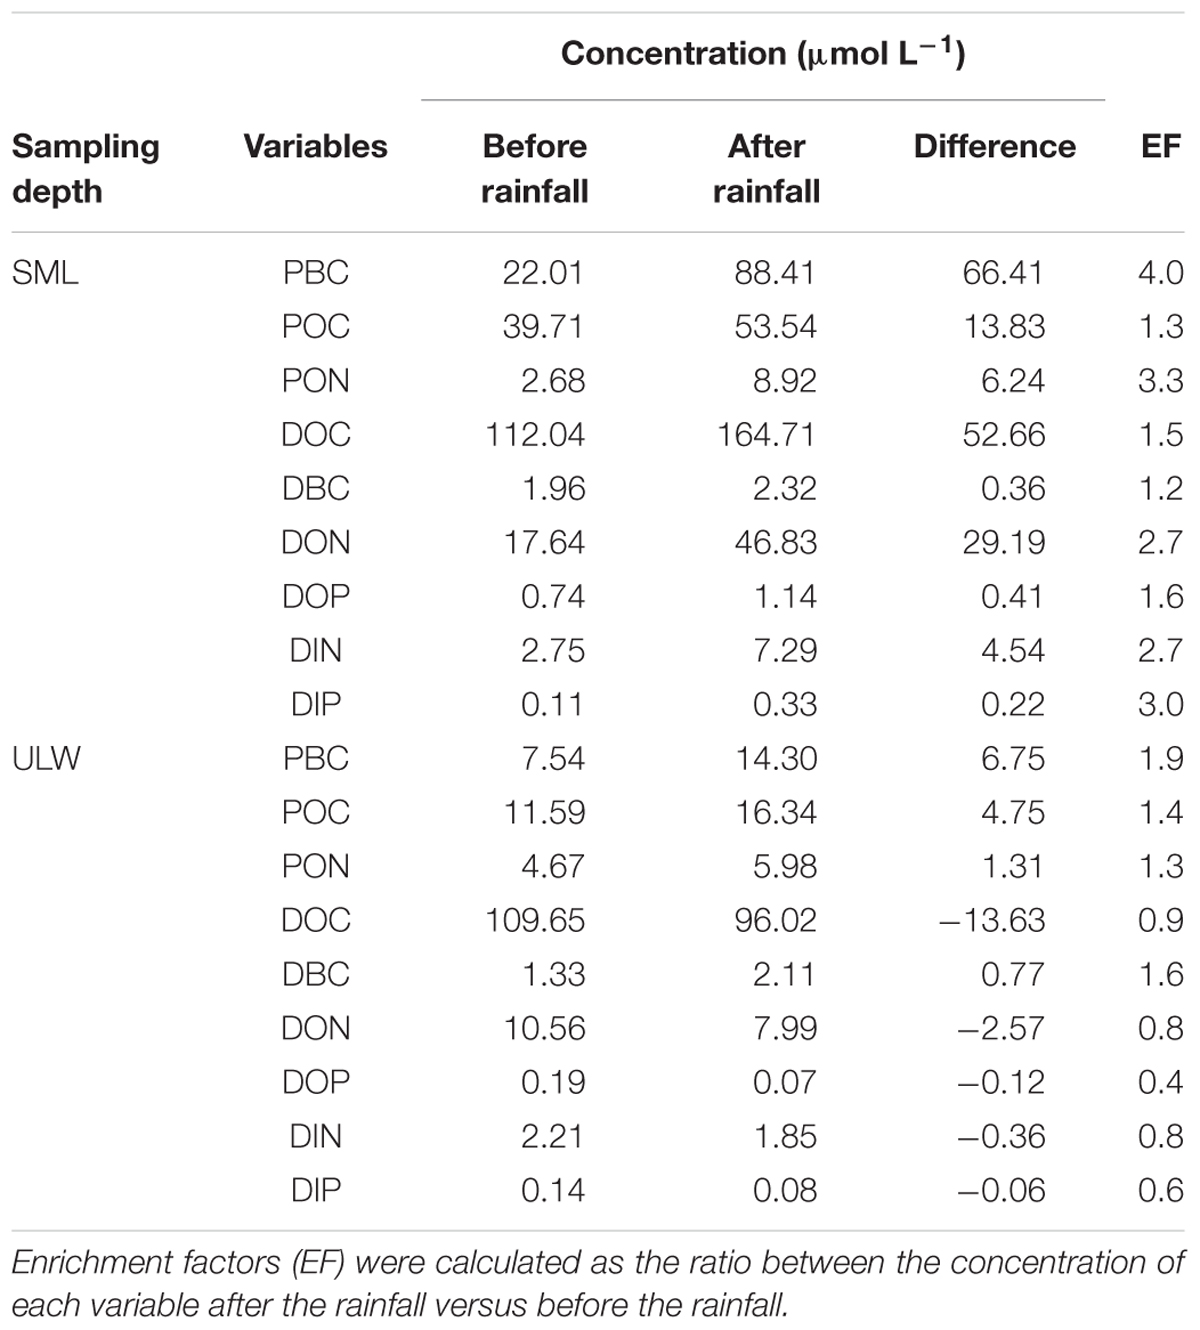
Table 1. Variations of dissolved and particulate inorganic and organic nutrients (DIP, DIN, DOP, DON, PON) and carbon concentrations (DOC, DBC, POC, PBC) in the SML and in ULW during the first rainfall event.
After the first rainfall event, the concentrations of DIN and DIP in the SML increased by a factor of 2.7 and 3.0, respectively, while in the ULW, they decreased by a factor of 0.8 and 0.6, respectively (Figure 6 and Table 1). A similar pattern was observed for DON and DOP, with an increase by a factor of 2.7 and 1.6, respectively, in the SML, and a decrease in the ULW by a factor of 0.8 and 0.4, respectively (Figure 7 and Table 1). The increase in the concentration of nutrients observed in the SML subsequent to the rainfall event suggests that rainwater was enriched in organic and inorganic nutrients.
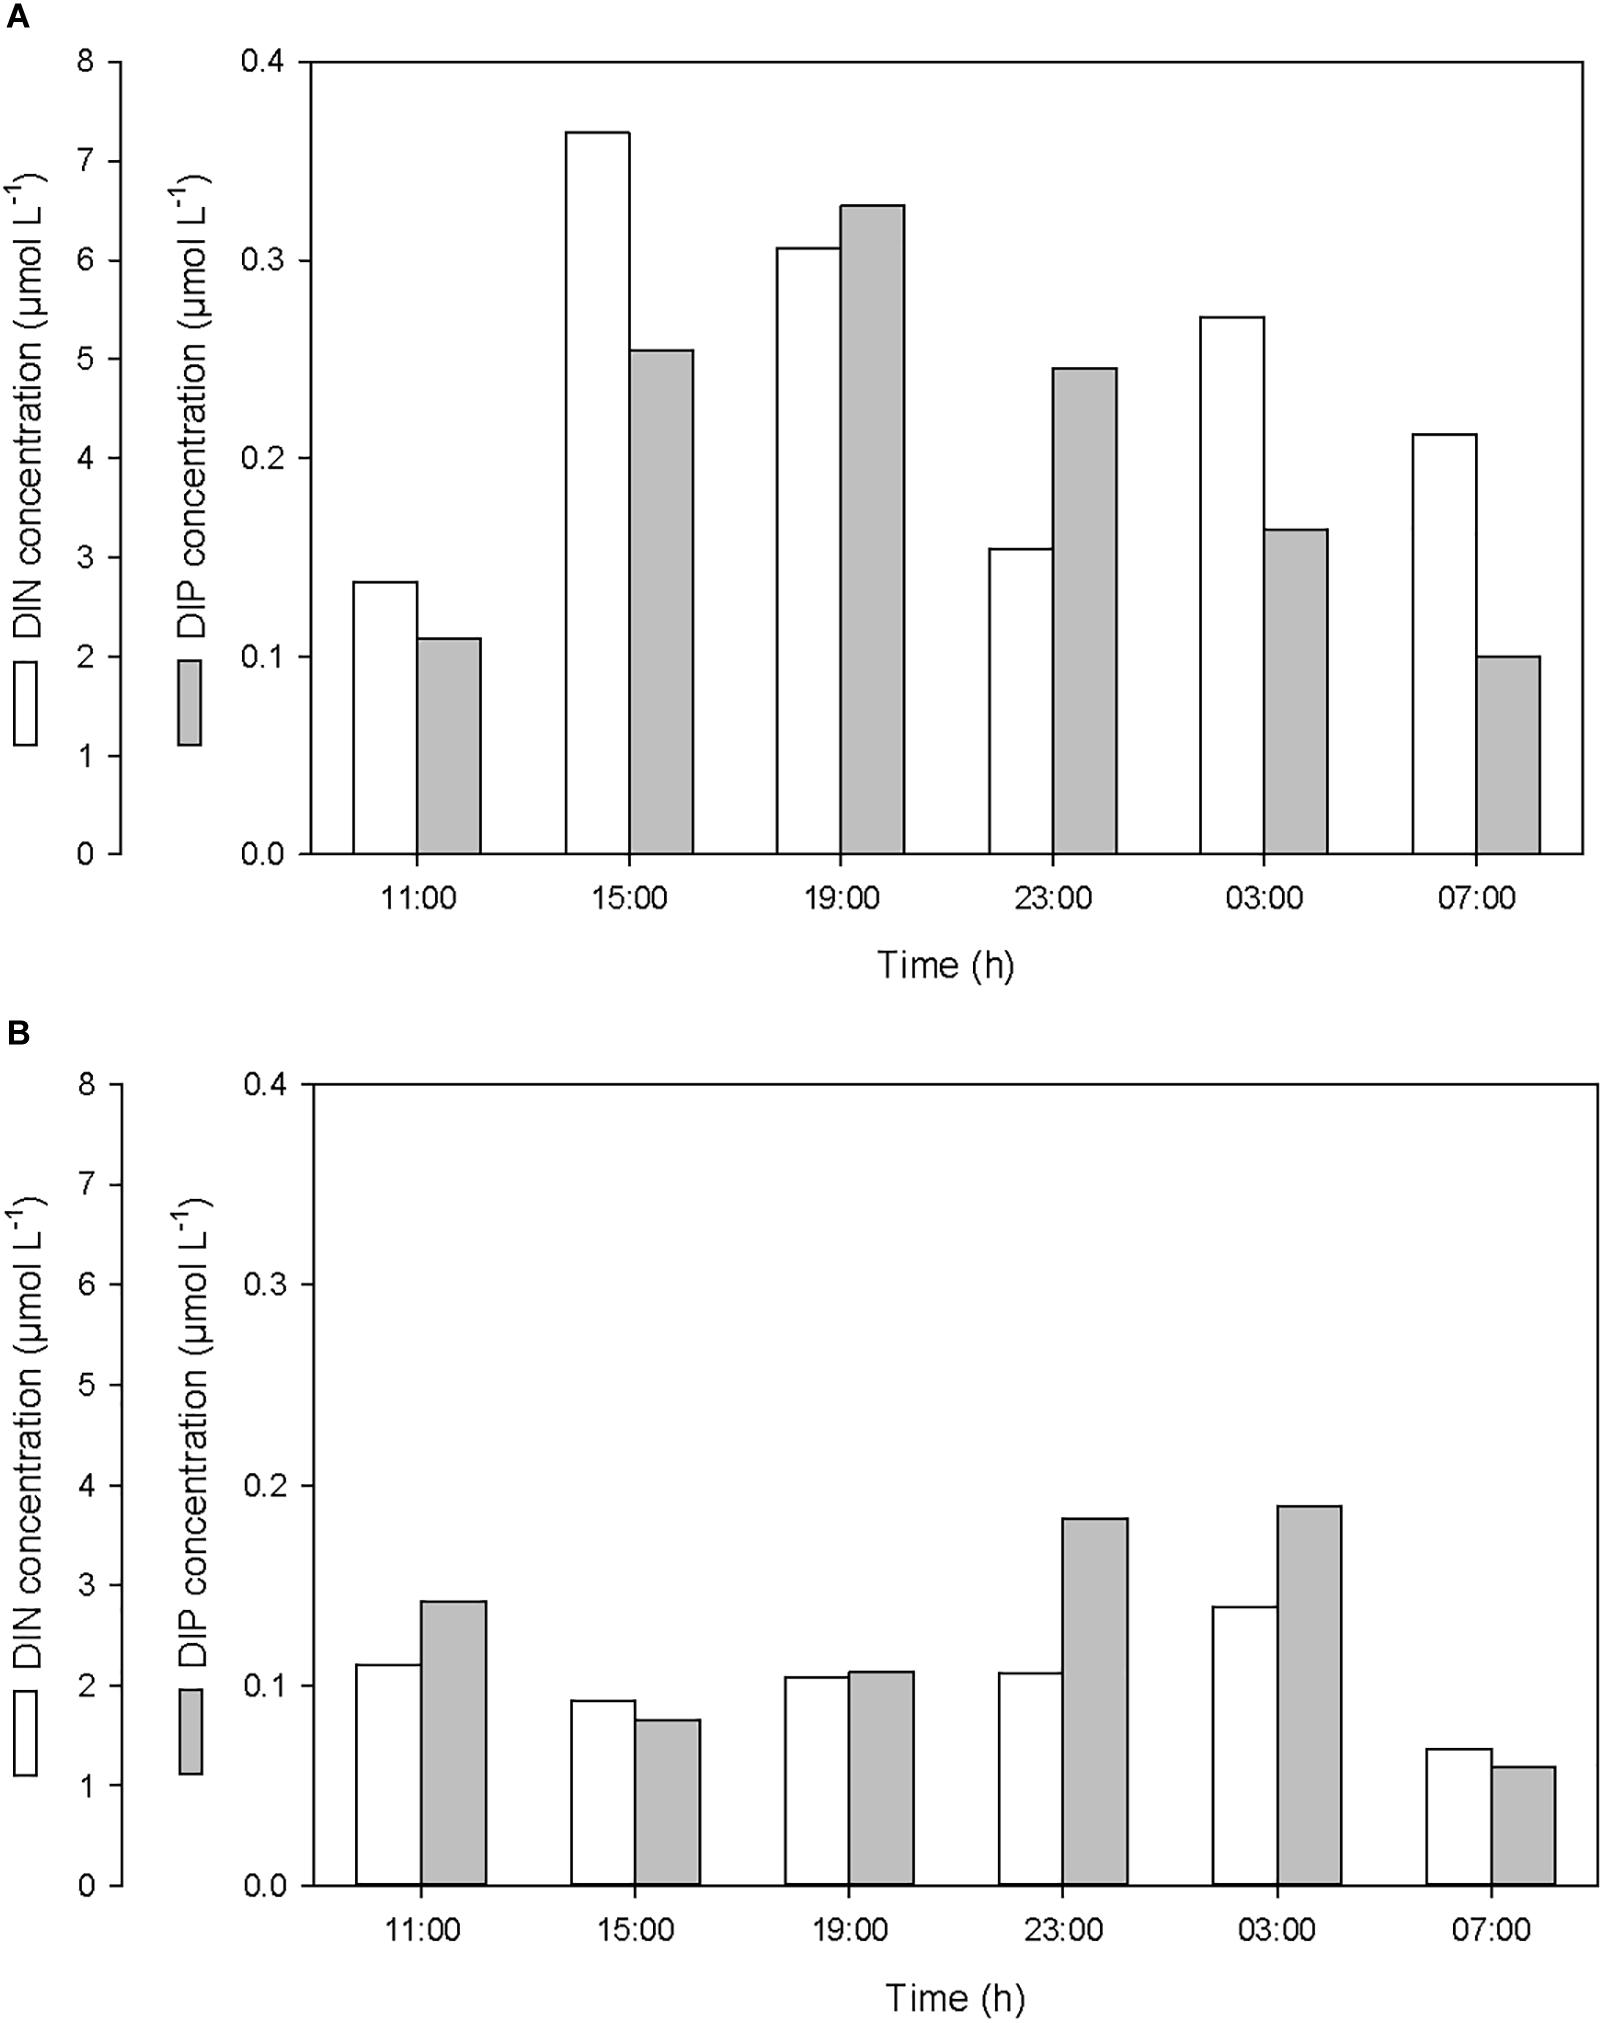
Figure 6. Variations of dissolved inorganic nitrogen (DIN) and phosphorus (DIP) concentrations (A) in the SML and (B) in the ULW.
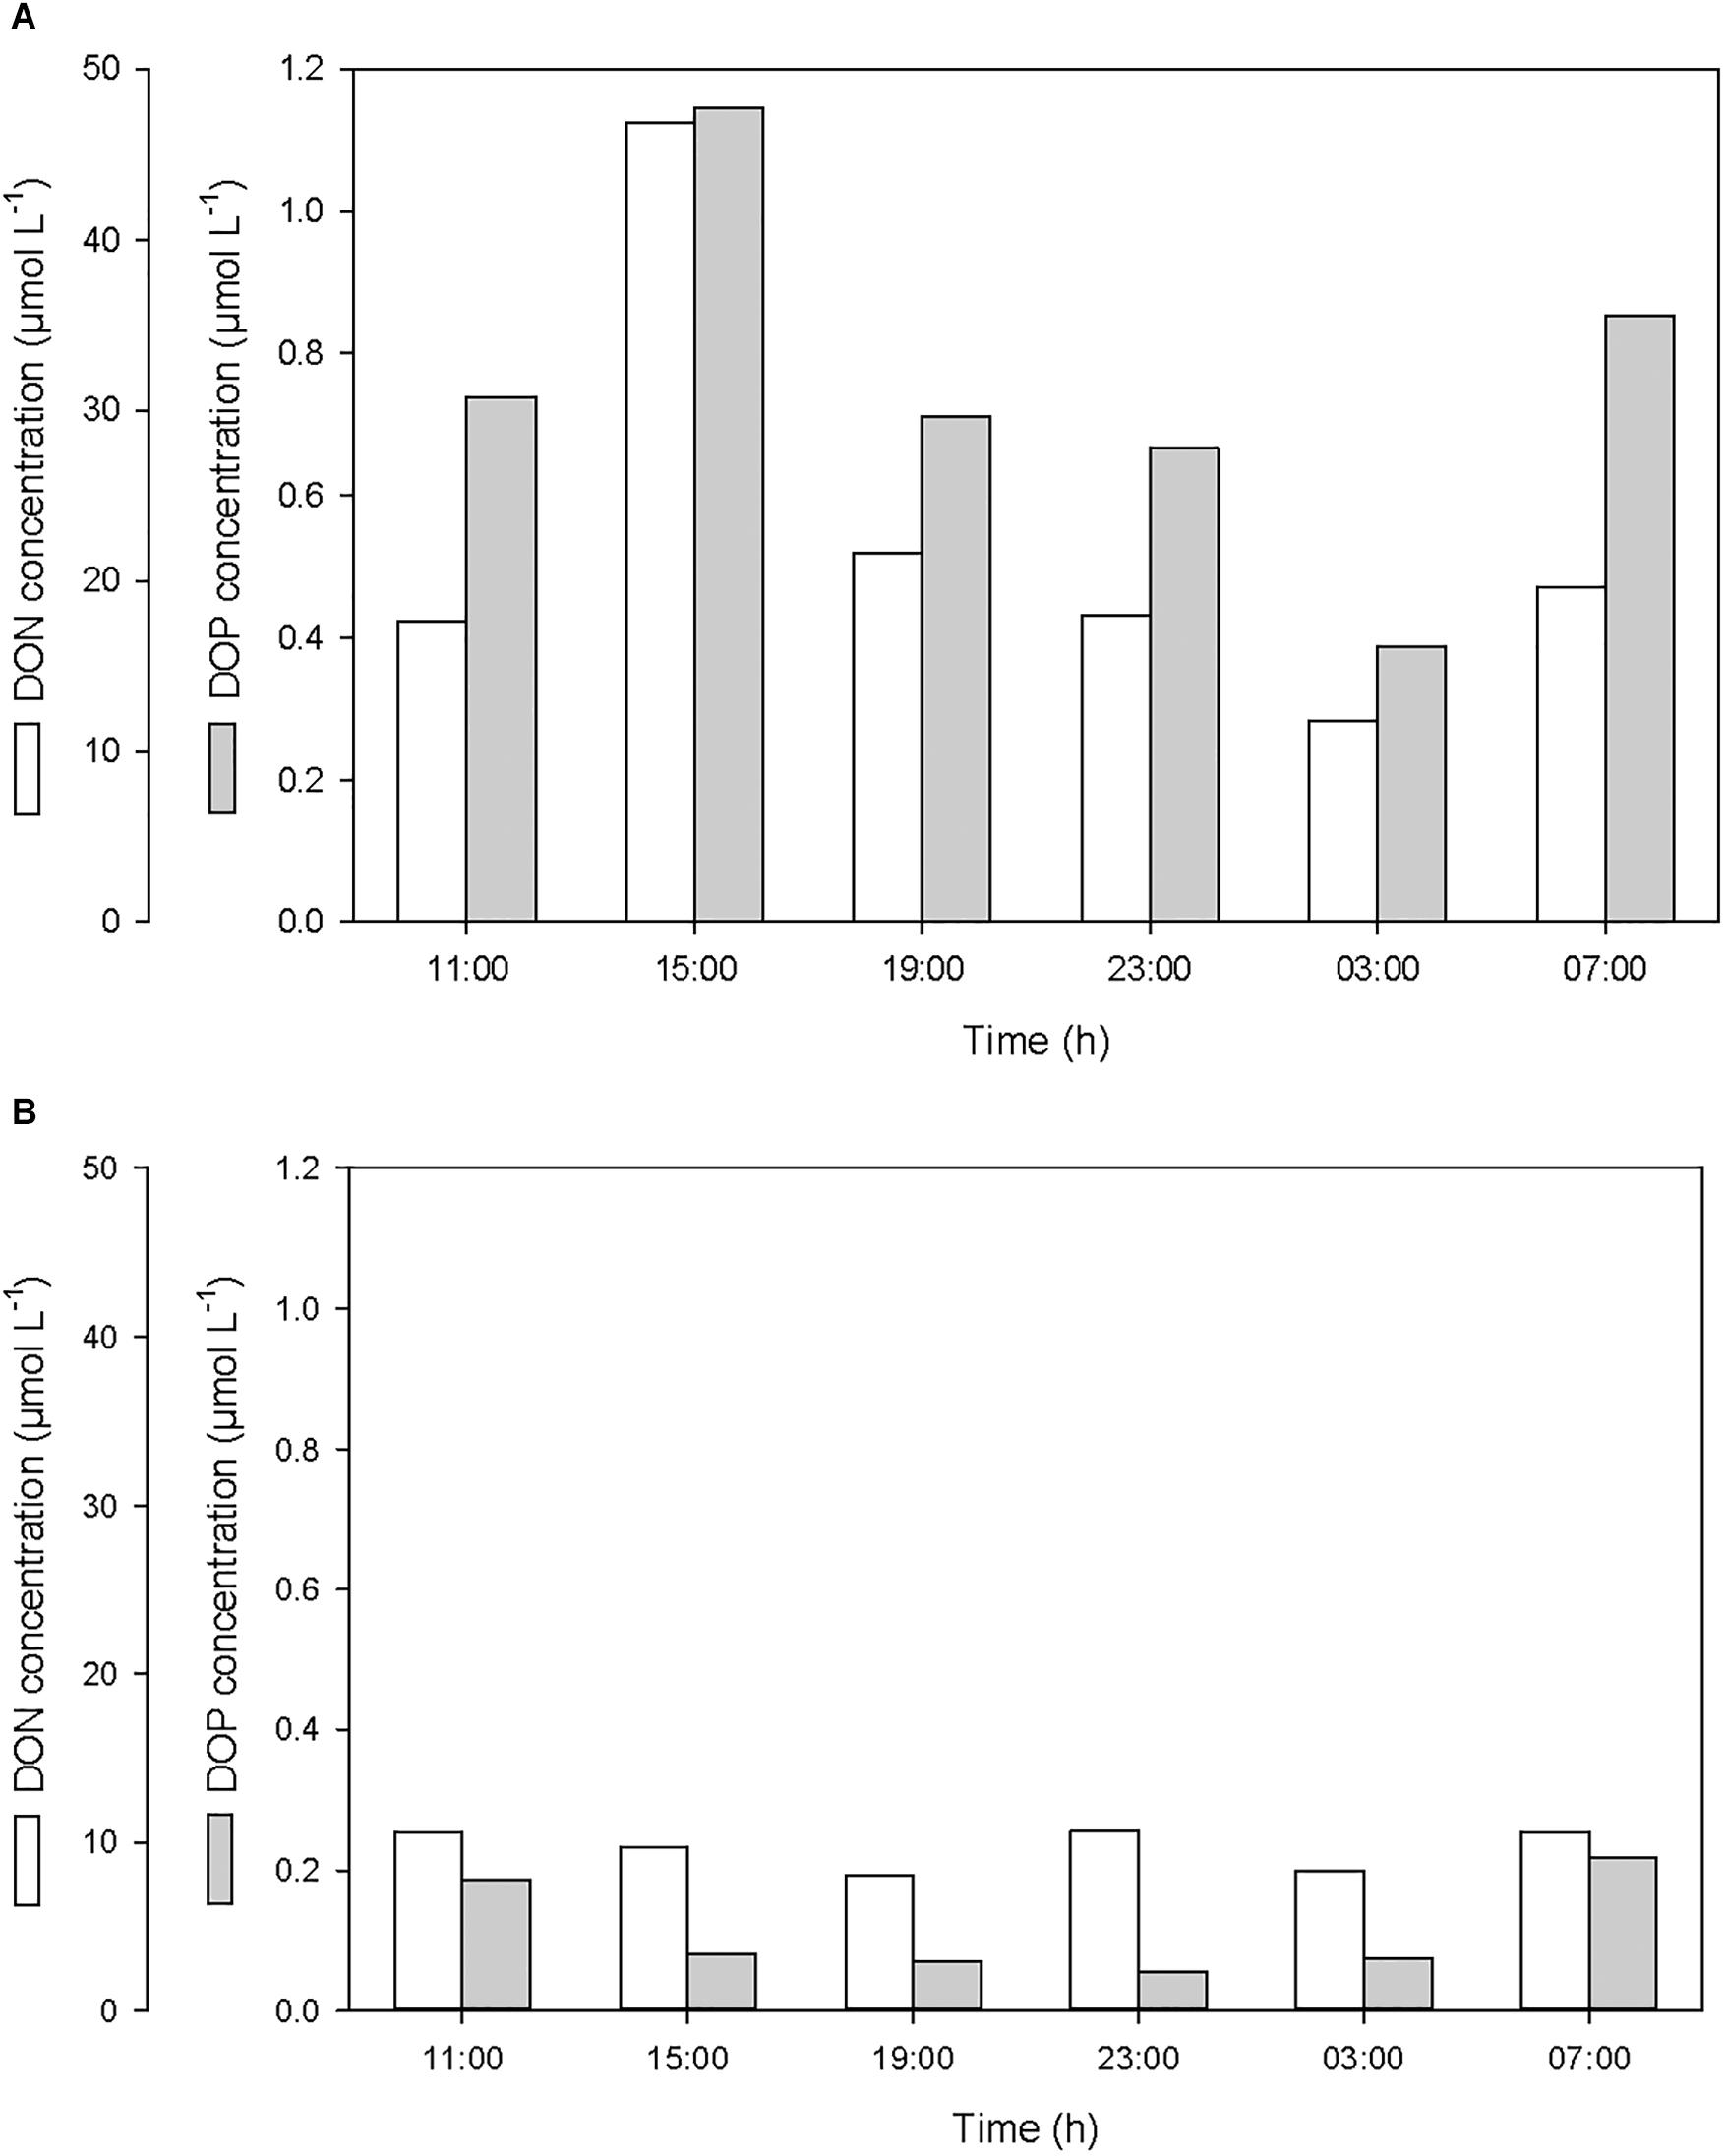
Figure 7. Variations of dissolved organic nitrogen (DON) and phosphorus (DOP) concentrations (A) in the SML and (B) in the ULW.
As for DOC, the decrease in DIN, DIP, DON, and DOP concentrations observed in the ULW subsequent to the first rainfall event suggests that, at this depth, nutrients may have been scavenged by sinking PBC.
According to the relative concentrations of dissolved nitrogen and dissolved phosphorus, the first rainfall event led to an increase of both organic and inorganic N:P ratios. However, while this increase was caused by an input of more nitrogen than phosphorus in the SML (Figures 6A, 7A), it was also linked to a differential removal of dissolved phosphorus and nitrogen in the ULW (Figures 6B, 7B).
The abundance of bacteria in the SML and in the ULW averaged 1.45 ± 0.13 × 10⁶ bacteria mL-1 and 0.45 ± 0.06 × 10⁶ bacteria mL-1, respectively (Figure 8). The abundance of viruses in the SML and in the ULW averaged 8.68 ± 1.21 × 10⁶ viruses mL-1 and 2.78 ± 0.68 × 10⁶ viruses mL-1, respectively. After the first rainfall event, the bacterial abundance increased by 14% in the SML and by 42% in the ULW, and the viral abundance increased by 36% in the SML, while it decreased gradually in the ULW by 47% until the last sampling. In the SML, these variations resulted in an alteration of the virus-to-bacteria ratio (VBR) characterized by an increase of VBR by ∼20% after both the first and second rainfall event. In the ULW, the VBR decreased by 33 and 13% after both the first and second rainfall event, respectively.
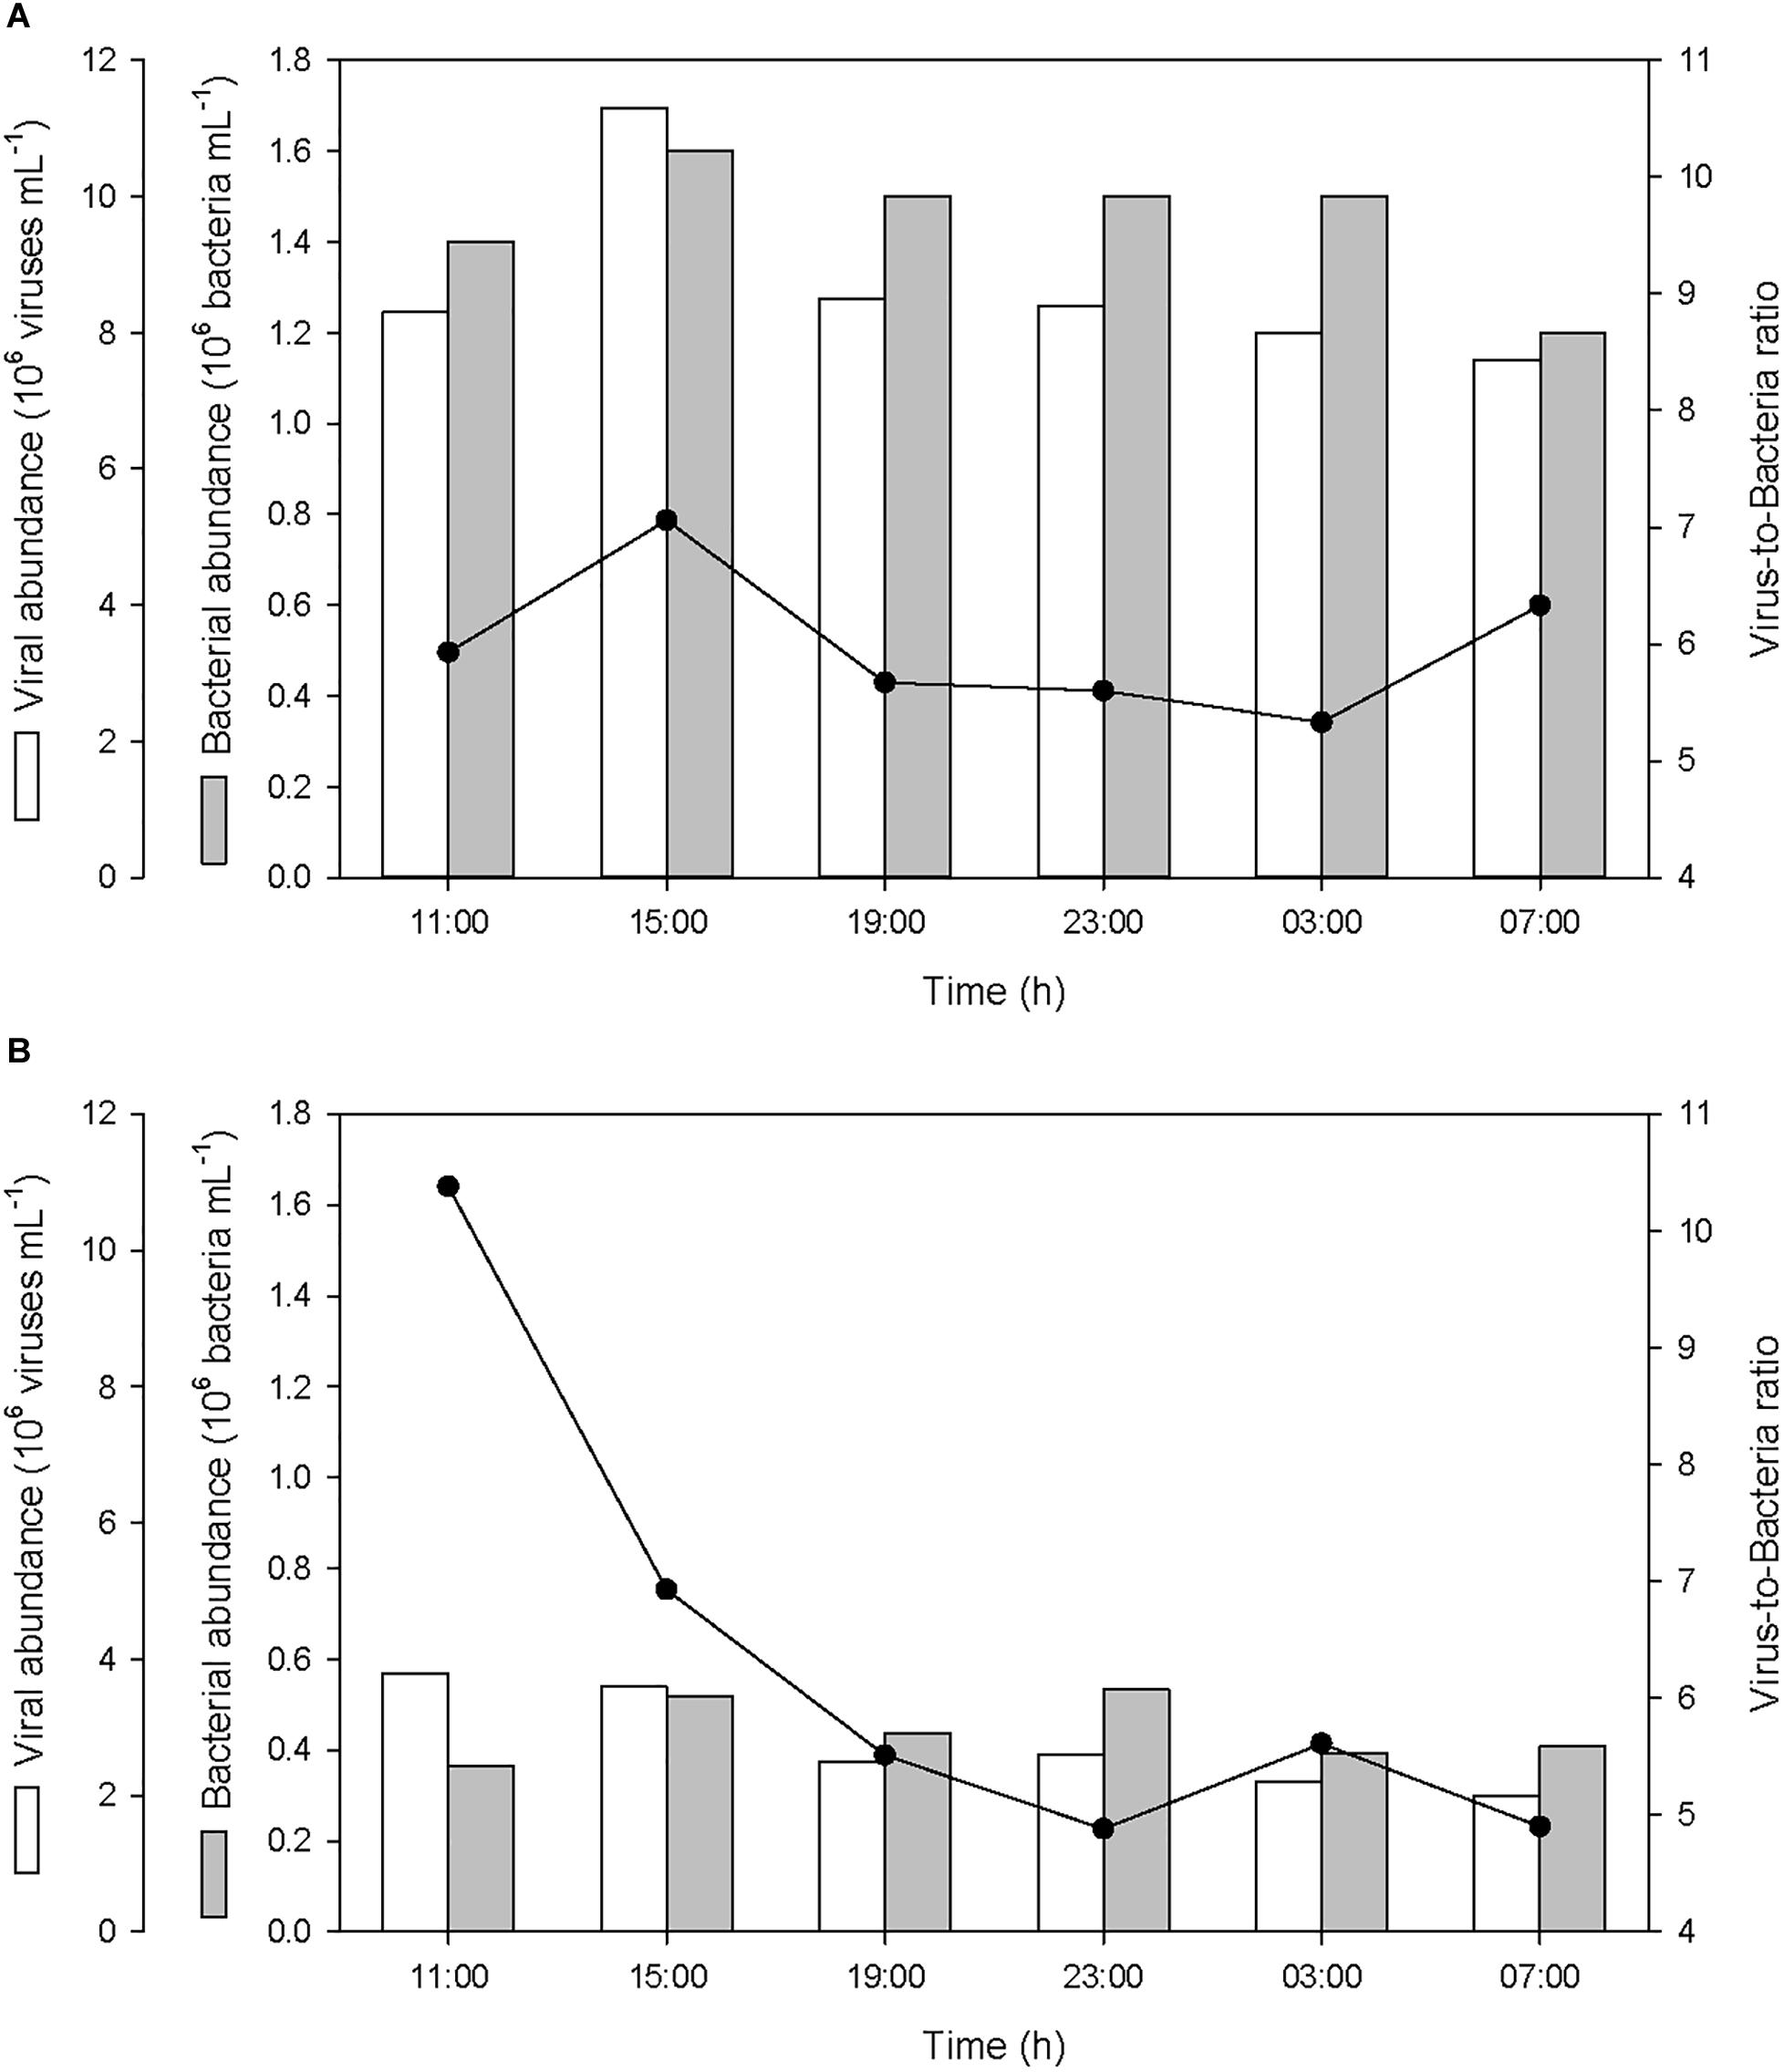
Figure 8. Variations of viral and bacterial abundances, and virus-to-bacteria ratios (VBR) (A) in the SML and (B) in the ULW.
After the two rainfall events, changes in the particle volume concentration per size class were observed at ∼2.3 m depth at 19:00 the 19 October and at ∼1.8 m depth at 07:00 the 20 October (Figure 9). Apart from these changes observed at these two depths a few hours after the rainfall events, the particle volume concentration per size class in rest of the water column did not show any alteration in comparison with pre-rainfall characteristics. Therefore, rainfall events seem to only affect a thin layer of the water column. By comparison with the initial particle volume concentration per size class (i.e., at 11:00 the 19 October) at the depth where the changes occurred, these observed alterations were characterized by a decrease of the volume concentration of small particles (<5 μm; identified in Figure 10 as green maximum), and by concomitant increase in the volume concentration of large particles (from 120 to 390 μm; identified in Figure 10 as red maximum), mostly observed for particles with an equivalent spherical diameter of ∼300 μm. For example, these alterations of the particle size spectra corresponded to a diminution of the concentration of particles in 2.50–2.95 μm size bin by a factor of approximately 5, and to an increase of the concentration of particles in the 257.42–303.75 μm size bin by a factor of approximately 25.
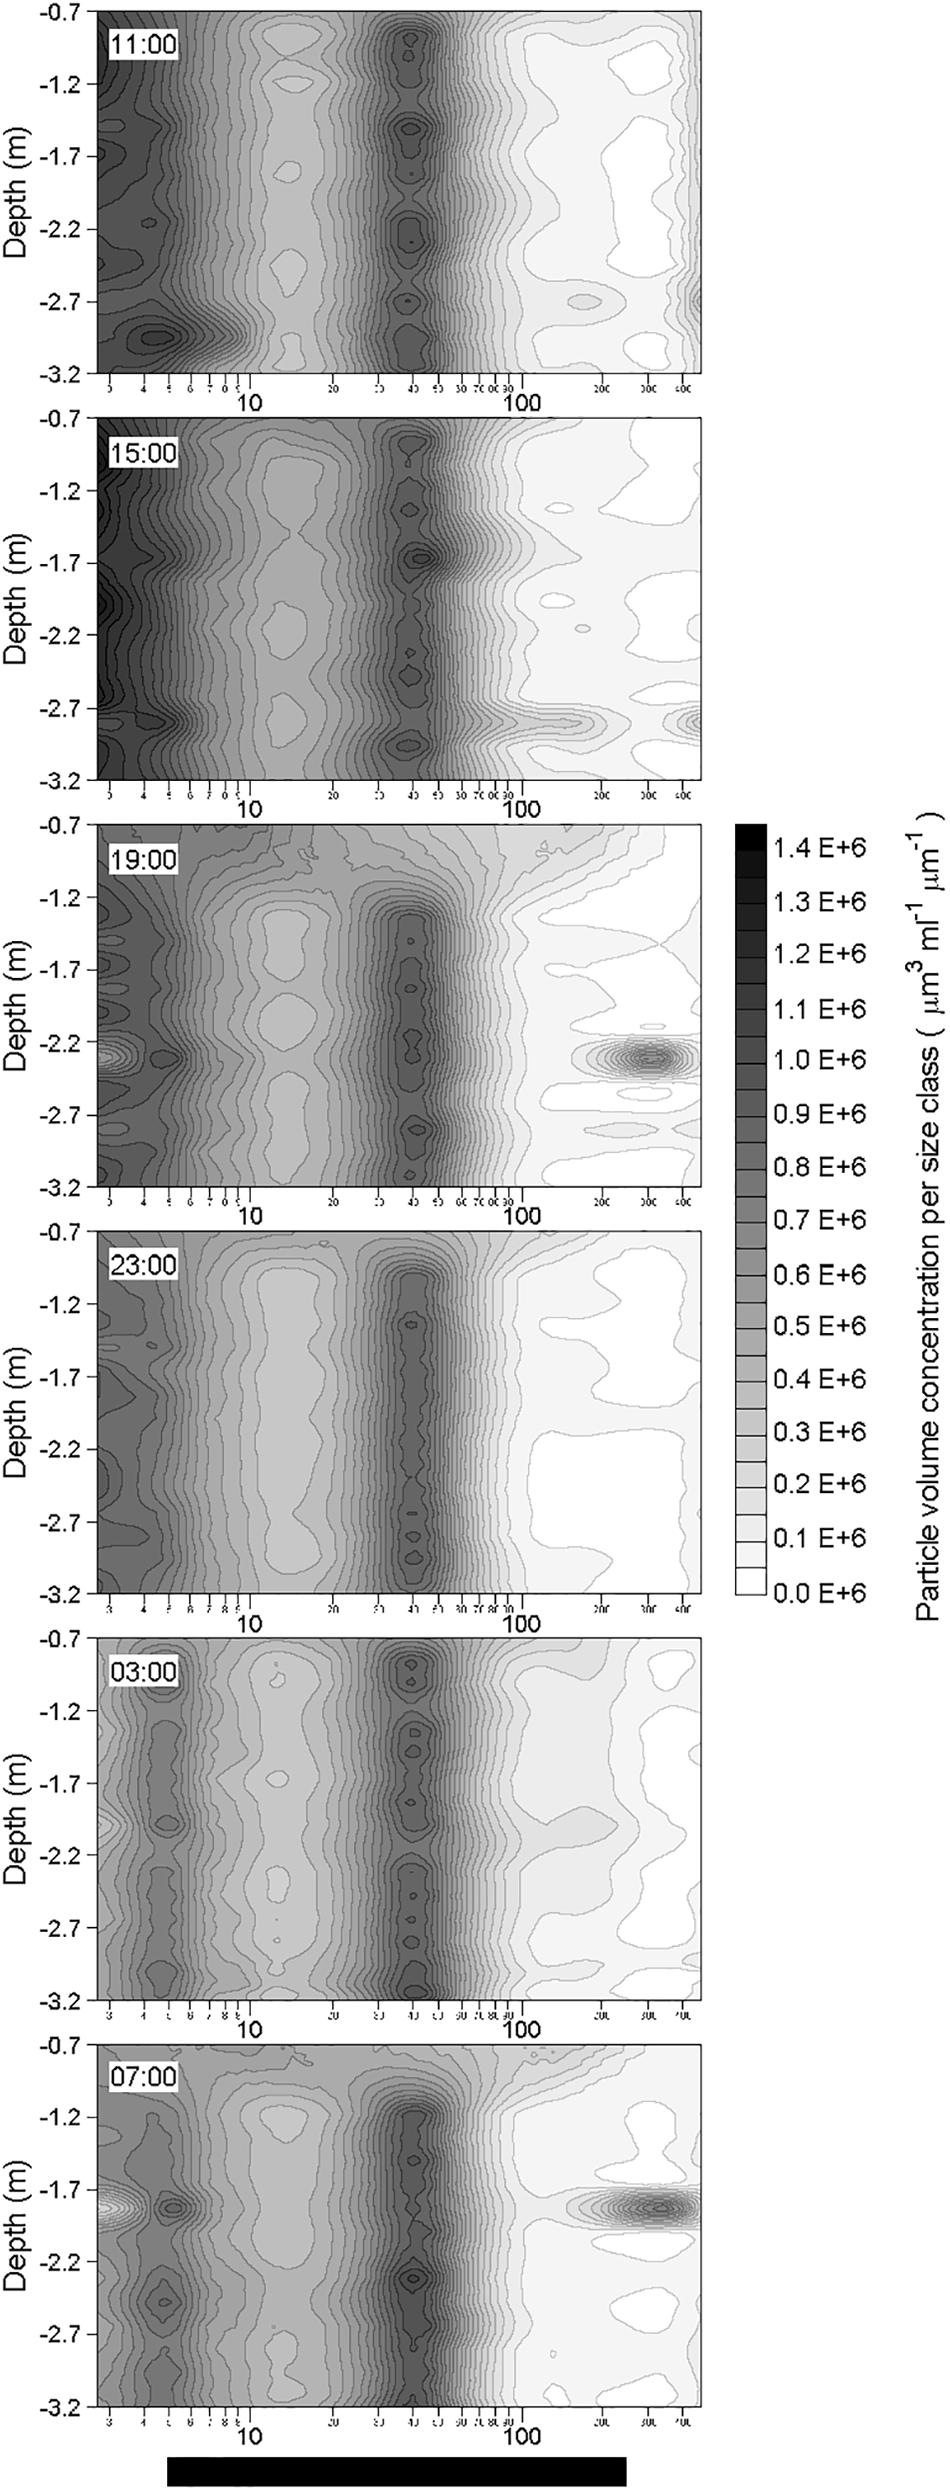
Figure 9. Vertical distributions of in situ volume concentration of particles (μm3 mL-1 μm-1) as a function of their equivalent spherical diameter (μm) in the water column during the 24-h cycle. Each contour plot was obtained from a data grid of about 1300 points (i.e., 32 size classes on the x-axis, and from 30 to 40 size spectra on the y-axis).
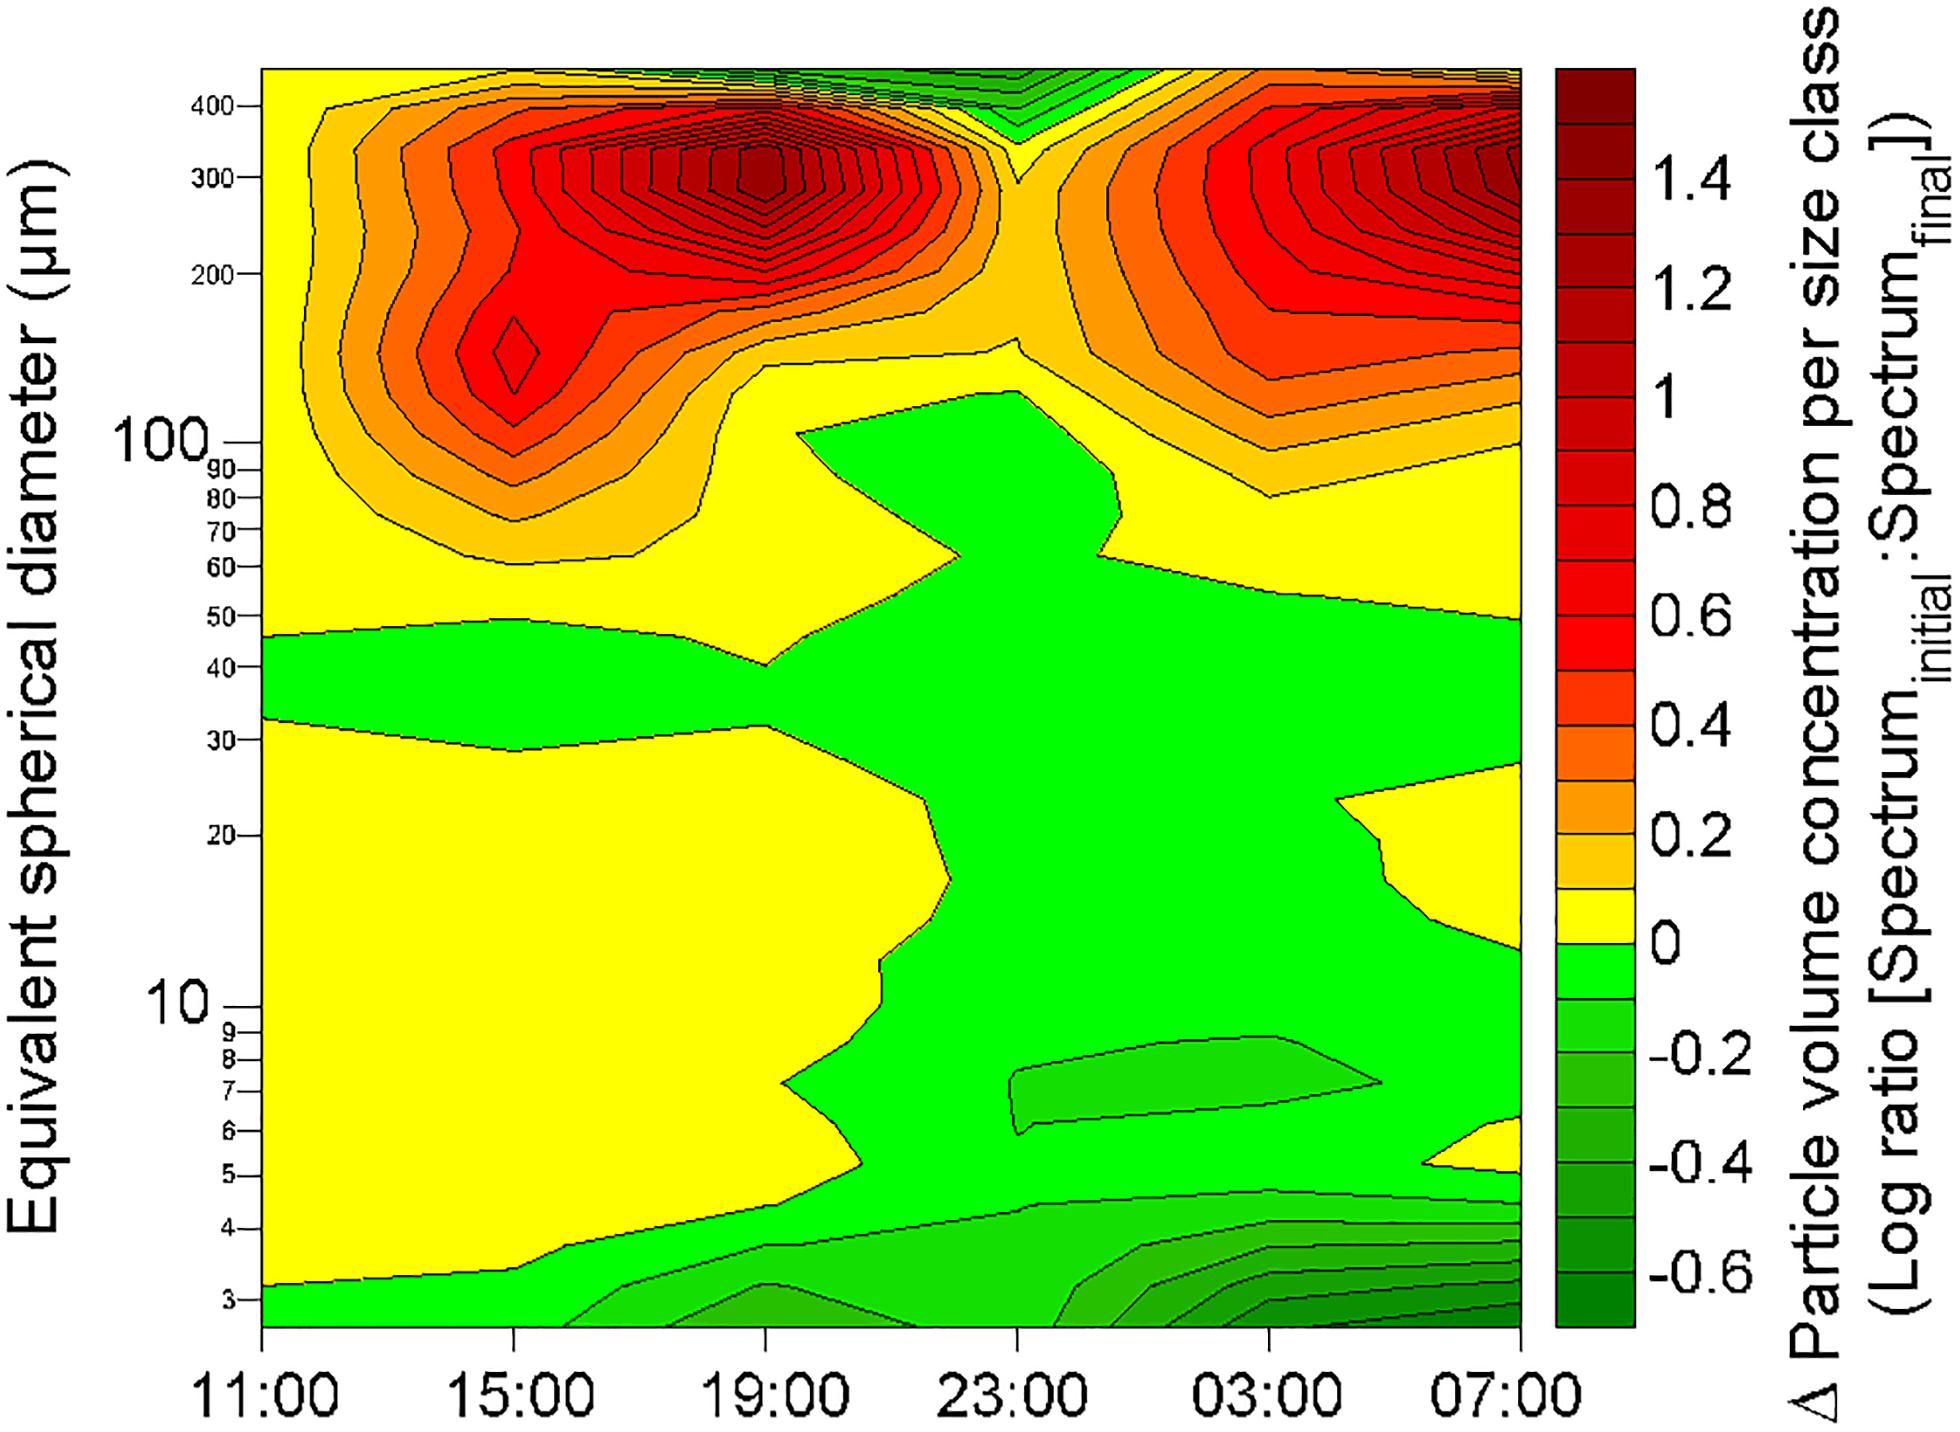
Figure 10. Changes in volume concentration of particles per size class at 2.3 m depth in comparison with the initial volume size spectra (as recorded at 11:00 the 19 October) during the 24-h cycle. The green and red color scales represent decrease and increase of the concentration of particles in a given size class, respectively. The contour plot was obtained from a data grid of 192 points (i.e., 6 sampling occasions on the x-axis, and 32 size classes on the y-axis).
Combustion aerosols are now recognized as a source of nutrients for the surface ocean. It has been estimated that anthropogenic phosphorus and nitrogen emitted during combustion processes deposit at the surface of the ocean at a global rate ranging from 0.1 to 1.8 Tg P yr-1 (Mahowald et al., 2008; Kanakidou et al., 2012; Wang et al., 2015), and from 31 to 77 Tg N yr-1 (Dentener et al., 2006; Doney et al., 2007; Duce et al., 2008), respectively. In addition, atmospheric BC may constitute a vector for other aerosols toward the ocean. For example, it has been shown that organophosphates used in agricultural insecticides could be sorbed by combustion aerosols (Bossan et al., 1995), this pathway potentially contributing an additional 0.01 Tg P yr-1 to P-deposition (Kanakidou et al., 2012).
According to our estimates, the N:P ratios of the dissolved organic and inorganic fractions in rainwater were 71:1 and 21:1, respectively (overall N:P ratio = 54:1) (Table 1). These N:P ratios in rainwater are similar to N:P ratios reported for anthropogenic emissions of combustion aerosols in Asia, i.e., between 40:1 and 50:1, but much lower than those reported for North America and Europe (i.e., between 150:1 and 180:1) (Wang et al., 2015). The different N:P ratios observed for combustion aerosols from Asia and North America/Europe are attributed to the use of high-P fuels such as coal and biomass in Asia, and low-P fuels such as gas and oil in North America and Europe (Wang et al., 2015). The N:P ratio signature of rainwater retrieved from changes observed in the SML after the first rainfall suggests that rainwater was enriched with combustion aerosols emitted in Asia from high-P fuels.
During our study, the wet deposition events coincided with enrichments of the SML both in dissolved nitrogen (DN = DIN + DON) and dissolved phosphorus (DP = DIP + DOP), with rainfall-induced enrichment factors (EF) of EFDN = 2.7 and EFDP = 1.7 (Table 1).
While the first rainfall event induced nutrient-enrichment in the SML, it was followed by a diminution of nutrient concentration in the ULW, as evidenced by enrichment factors of EFDN = 0.8 and EFDP = 0.5 (Table 1). This suggests that the impact of wet deposition on nutrient regime in surface waters is twofold: (1) enrichment of the SML with soluble N and P (principally in the organic form) and atmospheric BC, and (2) removal of DN and DP in the ULW, with a more pronounced decrease for DP compared to DN. Both the SML-enrichment and ULW-depletion resulted in an increase of the N:P ratios from 24:1 to 37:1, and from 39:1 to 64:1, respectively. While the N:P ratio increase in the SML is caused by a proportionally larger input of DN than DP, in the ULW it is linked to a preferential removal of DP in comparison to DN. These changes in N:P ratios increase P-limitation and may alter primary production, and phytoplankton diversity and community structure (Arrigo, 2005).
The atmospheric anthropogenic nitrogen deposition to the ocean has increased by ninefold from 1860 to 2000 (Duce et al., 2008), and it is expected to further increase to reach a 11-fold increase in 2030, compared to 1860 (Dentener et al., 2006; Duce et al., 2008). Such an increase is primarily due to the use of fossil fuels and N-fertilizer, and is concentrated in Asia. As a result, surface waters of the North Pacific Ocean are expected to be highly impacted by anthropogenic N-deposition in excess to P-deposition, hence to be characterized by increasing N:P ratios. Kim et al. (2014) reported a significant increase in N concentration in the upper North Pacific Ocean, with a rate of increase of excess N relative to P highest nearby Asian coasts, and decreasing eastward. Our findings are in line with N-enrichment due to anthropogenic aerosol deposition, and decreasing N:P ratio near Asian coasts.
Recent experimental and field studies have shown that PBC efficiently sorbs DOC in seawater. During a field study in the lagoon of New Caledonia, Mari et al. (2014) have shown that the supply of anthropogenic atmospheric BC originating from an oil-fired power plant to surface waters was followed by a decrease of the DOC concentration by ∼6% attributed to an enhanced transfer of DOC to the particulate phase, via sorption by PBC. The role of atmospheric BC for the removal of DOC observed in the field was confirmed during a laboratory experiment conducted using reference diesel-BC (Mari et al., 2014). During this experiment, the addition of 10 μg BC mL-1 resulted in the removal of 6.4 μmol C L-1 (i.e., diminution of 8% of the initial DOC concentration). A study conducted in Halong Bay, observed a positive correlation between non-pyrogenic POC:DOC ratio and PBC concentration, suggesting that the introduction of PBC to the water column may enhance the transfer of organic carbon from the dissolved to the particulate phase, via sorption of DOC by PBC (Mari et al., 2017a).
There is also indirect evidence that BC has high sorptive properties for dissolved compounds in marine waters. BC containing materials are known to sorb very efficiently a wide variety of dissolved compounds. For example, fly ash (in particular originating from coal combustion), which contains a significant fraction of BC (up to 60 wt% carbon; Külaots et al., 2004), is very efficient in sorbing molecules both from aqueous solutions and from the atmosphere (Wang and Wu, 2006; Ahmaruzzaman, 2010), and sorption by coal fly ash has been directly correlated to its carbon content (e.g., Hassett and Eylands, 1999; Külaots et al., 2004; Hower et al., 2010).
The increase of PBC concentration in the SML of 66.41 μmol L-1 measured after the first rainfall event was followed by a decrease of the concentrations of DOC, DON, DOP, DIN, and DIP (Table 1). Assuming that PBC is responsible for the removal of those dissolved compounds by sorption, and hence transfer to the particulate phase, one can give a crude estimate of the sorptive properties of PBC in the water column. Therefore, PBC may sorb 205.2 mg DOC g-1, 45.2 mg DON g-1, 4.5 mg DOP g-1, 6.4 mg DIN g-1, and 2.3 mg DIP g-1. Although these estimates have to be taken cautiously, they emphasize the potential strong impact of BC on the dissolved-to-particulate balance and on element cycling in the ocean, and in particular in BC-impacted coastal area, such as Halong Bay. Indeed, assuming that these estimates are robust and considering annual average concentrations of about 11 μmol PBC L-1, 93 μmol DOC L-1, 11 μmol DON L-1, 0.2 μmol DOP L-1, 6.4 μmol DIN L-1, 0.1 μmol DIP L-1 in Halong Bay (Mari et al., 2017a), the fraction of dissolved compounds associated with PBC in Halong Bay may average around 2% for DOC, 4% for DON, 1% for DIN, 24% for DOP, and 22% for DIP. This exercise suggests that PBC-sorption of dissolved compounds, and its subsequent transfer to the particulate phase, alleviates P-limitation for heterotrophic prokaryotes attached to particles, but deepens P-limitation for phytoplankton.
While at the global scale, the input of BC particles to the ocean may have a minor effect on DOC partition and export, and primary production, this phase-transfer mechanism may be significant in highly impacted coastal systems, where the regional input of BC can be orders of magnitude higher than average global estimates. However, to our knowledge, no study has been conducted so far to estimate this flux at the regional scale.
The changes observed for the surface salinity and the concentrations of DOC, DON, DOP, DIN, and DIP after the first rainfall event, seem attributable to wet deposition for the enrichment in the SML and decrease of surface salinity, and to sorption of nutrients by sinking PBC for the depletion in the ULW. However, other mechanisms may potentially induce similar variations, such as surface freshwater fluvial inflow for the observed enrichment in the SML, and biological activity for the decrease observed in the ULW.
A significant influence of the river discharge on the observed decrease of surface salinity and enrichment in the SML can be ruled out due to the features of the water body. Most of Halong Bay is shallow (less than 10 m) with a high density of islets. Under these conditions, the water flow is likely to develop turbulences that efficiently mix the water masses from the river mouth toward the open sea. Therefore, a vertical salinity gradient that may establish from the input of freshwater from the river mouth would disappear rapidly seaward. Hence, the salinity gradient observed in the surface layer at the sampling station subsequent to the rainfall events cannot result from horizontal advection of freshwater from the closest river mouth, which is more than 25 km away from the sampling site.
Moreover, the analysis of currents direction and speed, measured with an ADCP (RD Instruments, Workhorse Sentinel 1200 kHz) simultaneously with the surface water sampling (not shown), does not reveal any correlation between presence of surface freshwater and ebb tide. This supports the assumption that the observed episodic changes in surface salinity were due to rainfall events.
We interpret the observed diminution of the concentrations of DOC, DON, DOP, DIN, and DIP in the ULW after the first rainfall event as a result of sorption to PBC. Alternatively, this decrease could be explained by increased bacterial production, as observed in the field after dry deposition of BC and during BC-amendment in laboratory experiments (Mari et al., 2014; Malits et al., 2015). While we did not measure bacterial production, the observed increase of bacterial abundance by 14% in the SML (i.e., increase by ∼200,000 bacteria mL-1) and by 42% in the ULW (i.e., increase by ∼150,000 bacteria mL-1) after the first rainfall suggests that the input of BC and associated elements enhanced bacterial production, hence increasing the bacterial demand for DOC and nutrients in the ULW. Another mechanism that may have stimulated bacterial production in the ULW is a reduced viral lysis caused by the diminution of viral abundance. The viral abundance in the ULW decreased after the first rainfall leading to a decrease of the VBR from ∼10 to ∼5. As previously shown during field (Mari et al., 2014) and laboratory experiments (Malits et al., 2015), attachment of viruses to PBC reduces viral infection and production by inactivating viruses or preventing infection of bacteria.
Each wet deposition event of BC, identified by the concomitant decrease of atmospheric BC concentration and increase of PBC concentration in the bay, resulted in a decrease of the concentration of small particles (<5 μm) and an increase of the concentration of particles in the 120–390 μm size range. Simultaneous to this alteration of the particle size spectra, a decrease of the DOC concentration and of viral abundance was observed in the ULW, probably corresponding to a BC-enriched sinking layer sorbing DOC and small particles, and stimulating aggregation during sinking from the surface to deeper waters. Considering the time lag between the beginning of the two rainfall events (identified from the drop in surface salinity), and the occurrence and depth of these layers of altered particle size spectra (i.e., the layers observed at 2.3 and 1.8 m occurred 7 and 4 h after the beginning of the first and second rainfall event, respectively), and assuming that the large particles that appeared in the 120–390 μm size range were generated near the surface at the beginning of each rainfall event by aggregation induced by PBC introduced during the rainfall events, these aggregates would have settled down at an average sinking velocity of 9.3 m d-1 (i.e., at 7.9 and 10.8 m d-1, after the first and second rainfall event, respectively). As we estimated the sinking velocity of the aggregates formed by BC-induced aggregation by assuming they were starting to sink at the very beginning of the rainfall events (as identified from the observed drop in surface salinity), we could underestimate the actual sinking velocity if the aggregates were starting to sink later than the start of the rainfall events. Therefore, the above estimates should be considered as a minimum sinking velocity for such aggregates.
The estimated sinking velocity is within the lower range of the sinking velocities generally reported for marine aggregates (10–200 m d-1; Asper, 1987; Alldredge and Gotschalk, 1988; Armstrong et al., 2009; McDonnell and Buesseler, 2010). It has been shown that the sinking velocity of aggregates increases with water depth (Berelson, 2002) due to differential degradation rates of the low-density organic matter fraction (Mari et al., 2017b), and to the fact that >60% of the sinking POC flux near the surface ocean consists of slowly settling particles (0.7–11 m d-1; Alonso-González et al., 2010). Therefore, the sinking velocities estimated for the aggregates that appeared after the two rainfall events may even be high for newly formed aggregates in surface waters. A high sinking velocity of newly formed aggregates may be caused by the inclusion BC particles with a high density of ∼1.8 g cm-3 (Park et al., 2004; Schneider et al., 2006). Assuming a sinking velocity of 9.3 m d-1 for the aggregates formed by BC-induced aggregation, such aggregates would have reached a depth of 1.6 m at the time of the second sampling (i.e., at 15:00). Therefore, the observed decrease of DOC, DON, DOP, DIN, and DIP concentrations at 1.5 m (i.e., ULW) may be attributed to sorption by PBC-enriched sinking aggregates, as these aggregates would have already passed through the ULW.
This study of the impact of BC in surface waters of Halong Bay suggests that once introduced in the surface ocean via wet deposition, PBC sorbs DOM, inorganic nutrients, and small particles (<5 μm, down to viruses) and stimulates aggregation processes during differential settling. This is in line with previous observations of the effect of dry deposition of atmospheric BC. During their study in the lagoon of New Caledonia, Mari et al. (2014) have shown that dry deposition of atmospheric BC resulted in an increase of the volume concentration of particles by a factor of up to 30, and to an alteration of the particle size spectra along the water column. The BC-induced modification of the particle size spectra observed subsequent to the dry deposition of atmospheric BC was similar to the one observed in Halong Bay after the wet deposition event, with a decrease of the concentration of small particles and an increase of the concentration of large particles. Together, these findings support the idea that in the water column, PBC provokes a transfer of particles from the small size classes to the large ones, resulting in a bimodal size spectrum. However, contrary to dry deposition that is rather diffuse and long lasting, wet deposition is characterized by a sudden and pulsed input of PBC that seems to create a thin layer of sinking surface-active aggregates, acting as a net-like scavenger for DOM, nutrients and small particles.
XM, BG, and CT designed and planned the study. XM, BG, CT, JB, J-PL, and PAS collected the samples and acquired data during the field study. XM, BG, CT, J-PL, PAS, PR, JN, and TD analyzed the samples and interpreted the data and XM wrote the manuscript with the contribution of all authors.
This work was supported by the French National Institute of Science of the Universe (Project SOOT-EC2CO 2013) (to XM), the French-Vietnamese Hubert Curien Partnership (Contract No. 23971TK) (to XM), the Ministry of Science and Technology of Vietnam (Contract No. 46/2012/HD-NDT) (to CT), and the French National Research Institute for Sustainable Development (IRD) (to XM). The project leading to this publication has received funding from European FEDER Fund under project 1166-39417.
The authors declare that the research was conducted in the absence of any commercial or financial relationships that could be construed as a potential conflict of interest.
We thank Ina Ulber for help with BPCA analysis.
Ahmaruzzaman, M. (2010). A review on the utilization of fly ash. Prog. Energ. Combust. 36, 327–363. doi: 10.1016/j.pecs.2009.11.003
Alldredge, A., and Gotschalk, C. (1988). In situ settling behavior of marine snow. Limnol. Oceanogr. 33, 339–351. doi: 10.4319/lo.1988.33.3.0339
Alonso-González, I. J., Arístegui, J., Lee, C., Sanchez-Vidal, A., Calafat, A., Fabrés, J., et al. (2010). Role of slowly settling particles in the ocean carbon cycle. Geophys. Res. Lett. 37:L13608. doi: 10.1029/2010GL043827
Aminot, A., and Kérouel, R. (2007). “Dosage automatique des nutriments dans les eaux marines: méthodes en flux continu,” in Méthodes d’analyse en milieu marin, ed. Ifremer, 188.
Armstrong, R. A., Peterson, M. L., Lee, C., and Wakeham, S. G. (2009). Settling velocity spectra and the ballast ratio hypothesis. Deep Sea Res. II 56, 1470–1478. doi: 10.1016/j.dsr2.2008.11.032
Arrigo, K. R. (2005). Marine microorganisms and global nutrient cycles. Nature 437, 349–355. doi: 10.1038/nature04159
Asper, V. L. (1987). Measuring the flux and sinking speed of marine snow aggregates. Deep Sea Res. A 34, 1–17. doi: 10.1016/0198-0149(87)90117-8
Bao, H., Niggemann, J., Luo, L., Dittmar, T., and Kao, S. -J. (2017). Aerosols as a source of dissolved black carbon to the ocean. Nat. Commun. 8:510. doi: 10.1038/s41467-017-00437-3
Berelson, W. M. (2002). Particle settling rates increase with depth in the ocean. Deep Sea Res. II 49, 237–251. doi: 10.1016/S0967-0645(01)00102-3
Bond, T. C., Doherty, S. J., Fahey, D. W., Forster, P. M., Berntsen, T., DeAngelo, B. J., et al. (2013). Bounding the role of black carbon in the climate system: a scientific assessment. J. Geophys. Res. 118, 5380–5552. doi: 10.1002/jgrd.50171
Bossan, D., Wortham, H., and Masclet, P. (1995). Atmospheric transport of pesticides adsorbed on aerosols. 1. photodegradation in simulated atmosphere. Chemosphere 30, 21–29. doi: 10.1016/0045-6535(94)00372-2
Brussaard, C., Payet, J. P., Winter, C., and Weinbauer, M. G. (2010). “Quantification of aquatic viruses by flow cytometry,” in Manual of Aquatic Viral Ecology, eds S. W. Wilhelm, M. G Weinbauer, and C. Suttle (Waco: ASLO), 102–109. doi: 10.4319/mave.2010.978-0-9845591-0-7.102
Cachier, H., Bremond, M.-P., and Buat-Ménard, P. (1989). Determination of atmospheric soot carbon with a simple thermal method. Tellus B Chem. Phys. Meteorol. 41, 379–390, doi: 10.3402/tellusb.v41i3.15095
Cattaneo, R., Rouvière, C., Rassoulzadegan, F., and Weinbauer, M. G. (2010). Association of marine viral and bacterial communities with reference black carbon particles under experimental conditions: an analysis with scanning electron, epifluorescence and confocal laser scanning microscopy. FEMS Microbiol. Ecol. 74, 382–396. doi: 10.1111/j.1574-6941.2010.00953.x
Coppola, A. I., Wiedemeier, D. B., Galy, V., Haghipour, N., Hanke, U. M., Nascimento, G. S., et al. (2018). Global-scale evidence for the refractory nature of riverine black carbon. Nat. Geosci. 11, 584–588. doi: 10.1038/s41561-018-0159-8
Cunliffe, M., and Wurl, O. (2014). Guide to Best Practices to Study the Ocean’s Surface. Plymouth: Occasional Publications of the Marine Biological Association of the United Kingdom, 118.
Daniel, A., Kérouel, R., and Aminot, A. (2005). Pasteurization: a reliable method for preservation of nutrient in seawater samples for inter-laboratory and field applications. Mar. Chem. 128, 57–63. doi: 10.1016/j.marchem.2011.10.002
Dentener, F., Drevet, J., Lamarque, J. F., Bey, I., Eickhout, B., Fiore, A. M., et al. (2006). Nitrogen and sulfur deposition on regional and global scales: a multimodel evaluation. Glob. Biogeochem. Cycles 20:GB4003. doi: 10.1029/2005GB002672
Dittmar, T. (2008). The molecular level determination of black carbon in marine dissolved organic matter. Org. Geochem. 39, 396–407. doi: 10.1016/j.orggeochem.2008.01.015
Dittmar, T., Koch, B., Hertkorn, N., and Kattner, G. (2008). A simple and efficient method for the solid-phase extraction of dissolved organic matter (SPE-DOM) from seawater. Limnol. Oceanogr. Methods 6, 230–235. doi: 10.4319/lom.2008.6.230
Doney, S. C., Mahowald, N., Lima, I., Feely, R. A., Mackenzie, F. T., Lamarque, J. -F., et al. (2007). Impact of anthropogenic atmospheric nitrogen and sulfur deposition on ocean acidification and the inorganic carbon system. Proc. Natl. Acad. Sci. U.S.A. 104, 14580–14585. doi: 10.1073/pnas.0702218104
Duce, R. A., LaRoche, J., Altieri, K., Arrigo, K. R., Baker, A. R., Capone, D. G., et al. (2008). Impacts of atmospheric anthropogenic nitrogen on the open ocean. Science 320, 893–897. doi: 10.1126/science.1150369
Fang, Z., Yang, W., Chen, M., Zheng, M., and Hu, W. (2016). Abundance and sinking of particulate black carbon in the western Arctic and Subarctic Oceans. Sci. Rep. 6:29959. doi: 10.1038/srep29959
Gatari, M. J., Boman, J., Wagner, A., Janhäll, S., and Isakson, J. (2006). Assessment of inorganic content of PM2.5 particles sampled in a rural area north-east of Hanoi, Vietnam. Sci. Total Environ. 368, 675–685. doi: 10.1016/j.scitotenv.2006.04.004
Goldberg, E. D. (1985). Black Carbon in the Environment: Properties and Distribution. New York, NY: Wiley.
Guo, C., Yu, J., Ho, T.-Y., Wang, L., Song, S., Kong, L., et al. (2012). Dynamics of phytoplankton community structure in the South China Sea in response to the East Asian aerosol input. Biogeosciences 9, 1519–1536. doi: 10.5194/bg-9-1519-2012
Gustafsson,Ö., Haghseta, F., Chan, C., MacFarlane, J., and Gschwend, P. M. (1997). Quantification of the dilute sedimentary soot phase: implications for PAH speciation and bioavailability. Environ. Sci. Technol. 31, 203–209. doi: 10.1021/es960317s
Hassett, D. J., and Eylands, K. E. (1999). Mercury capture on coal combustion fly ash. Fuel 78, 243–248. doi: 10.1016/S0016-2361(98)00150-1
Hien, P. D., Bac, V. T., Tham, H. C., Nhan, D. D., and Vinh, L. D. (2002). Influence of meteorological conditions on PM2.5 and PM2.5-10 concentrations during the monsoon season in Hanoi, Vietnam. Atmos. Environ. 36, 3473–3484. doi: 10.1016/S1352-2310(02)00295-9
Hien, P. D., Bac, V. T., and Thinh, N. T. H. (2004). PMF receptor modelling of fine and coarse PM10 in air masses governing monsoon conditions in Hanoi, northern Vietnam. Atmos. Environ. 38, 189–201. doi: 10.1016/j.atmosenv.2003.09.064
Holmes, R. M., Aminot, A., Kérouel, R., Hooker, B. A., and Peterson, B. J. (1999). A simple and precise method for measuring ammonium in marine and freshwater ecosystems. Can. J. Fish. Aquat. Sci. 56, 1801–1808. doi: 10.1139/cjfas-56-10-1801
Hower, J. C., Senior, C. L., Suuberg, E. M., Hurt, R. H., Wilcox, J. L., and Olson, E. S. (2010). Mercury capture by native fly ash carbons in coal-fired power plants. Prog. Energ. Combust. 36, 510–529. doi: 10.1016/j.pecs.2009.12.003
Ito, A. (2013). Global modeling study of potentially bioavailable iron input from shipboard aerosol sources to the ocean. Glob. Biogeochem. Cycles 27, 1–10. doi: 10.1029/2012GB004378
Jaffé, R., Ding, Y., Niggemann, J., Vähätalo, A. V., Stubbins, A., Spencer, R. G. M., et al. (2013). Global charcoal mobilization from soils via dissolution and riverine transport to the oceans. Science 340, 345–347. doi: 10.1126/science.1231476
Jurado, E., Dachs, J., Duarte, C. M., and Simóc, R. (2008). Atmospheric deposition of organic and black carbon to the global oceans. Atmos. Environ. 42, 7931–7939. doi: 10.1016/j.atmosenv.2008.07.029
Kanakidou, M., Duce, R. A., Prospero, J. M., Baker, A. R., Benitez-Nelson, C. R., Dentener, F. J., et al. (2012). Atmospheric fluxes of organic N and P to the global ocean. Glob. Biogeochem. Cycles 26:GB3026. doi: 10.1029/2011GB004277
Kim, I. -N., Lee, K., Gruber, N., Karl, D. M., Bulliste, J. L., Yang, S., et al. (2014). Increasing anthropogenic nitrogen in the North Pacific Ocean. Science 346, 1102–1106. doi: 10.1126/science.1258396
Kuhlbusch, T. A. J. (1995). Method for determining black carbon in residues of vegetation fires. Environ. Sci. Technol. 29, 2695–2702. doi: 10.1021/es00010a034
Külaots, I., Hurt, R. H., and Suuberg, E. M. (2004). Size distribution of unburned carbon in coal fly ash and its implications. Fuels 83, 223–230. doi: 10.1016/S0016-2361(03)00255-2
Kunz, R. R., Leibowitz, F. L., and Downs, D. K. (2005). Ultraviolet photolytic vapor generation from particulate ensembles for detection of malathion residues in aerosols. Anal. Chim. Acta 531, 267–277. doi: 10.1016/j.aca.2004.10.085
Lohmann, R., Bollinger, K., Cantwell, M., Feichter, J., Fischer-Bruns, I., and Zabel, M. (2009). Fluxes of soot black carbon to South Atlantic sediments. Glob. Biogeochem. Cycles 23:GB1015. doi: 10.1029/2008GB003253
Loosmore, G. A., and Cederwall, R. T. (2004). Precipitation scavenging of atmospheric aerosols for emergency response applications: testing an updated model with new real-time data. Atmos. Environ. 38, 993–1003. doi: 10.1016/j.atmosenv.2003.10.055
Mahowald, N., Jickells, T. D., Baker, A. R., Artaxo, P., Benitez-Nelson, C. R., Bergametti, G., et al. (2008). Global distribution of atmospheric phosphorus sources, concentrations and deposition rates, and anthropogenic impacts. Global Biogeochem. Cycles 22:GB4026. doi: 10.1029/2008GB003240
Malits, A., Cattaneo, R., Sintes, E., Gasol, J. M., Herndl, G. J., and Weinbauer, M. G. (2015). Potential impacts of black carbon on the marine microbial community. Aquat. Microb. Ecol. 75, 27–42. doi: 10.3354/ame01742
Mannino, A., and Harvey, H. (2004). Black carbon in estuarine and coastal ocean dissolved organic matter. Limnol. Oceanogr. 49, 735–740. doi: 10.4319/lo.2004.49.3.0735
Mari, X., Chu, V. T., Guinot, B., Brune, J., Lefebvre, J.-P., Raimbault, P., et al. (2017a). Seasonal dynamics of atmospheric and river inputs of black carbon, and impacts on biogeochemical cycles in Halong Bay, Vietnam, Vietnam. Elem. Sci. Anth. 5:75. doi: 10.1525/elementa.255
Mari, X., Passow, U., Migon, C., Burd, A. B., and Legendre, L. (2017b). Transparent exopolymer particles: Effects on carbon cycling in the ocean. Prog. Oceanogr. 151, 13–37. doi: 10.1016/j.pocean.2016.11.002
Mari, X., Lefèvre, J., Torréton, J. -P., Bettarel, Y., Pringault, O., Rochelle-Newall, E., et al. (2014). Effects of soot deposition on particle dynamics and microbial processes in marine surface waters. Glob. Biogeochem. Cycles 28, 662–678. doi: 10.1002/2014GB004878
Masiello, C. A., and Druffel, E. R. M. (1998). Black carbon in deep-sea sediments. Science 280, 1911–1913. doi: 10.1126/science.280.5371.1911
McDonnell, A. M. P., and Buesseler, K. O. (2010). Variability in the average sinking velocity of marine particles. Limnol. Oceanogr. 55, 2085–2096. doi: 10.4319/lo.2010.55.5.2085
Mitra, S., Bianchi, T. S., McKee, B. A., and Sutula, M. (2002). Black carbon from the mississippi river: quantities, sources, and potential implications for the global carbon cycle. Environ. Sci. Technol. 36, 2296–2302. doi: 10.1021/es015834b
Mitra, S., Zimmerman, A. R., Hunsinger, G., and Woerner, W. R. (2014). Black carbon in coastal and large river systems. in Biogeochemical Dynamics at Major River-Coastal Interfaces: Linkages With Global Change, eds T. S. Bianchi, M. A. Allison, W. J. Cai (New York, NY: Cambridge University Press), 200–236.
Nguyen, T. H., Brown, R. A., and Ball, W. P. (2004). An evaluation of thermal resistance as a measure of black carbon content in diesel soot, wood char, and sediment. Org. Geochem. 35, 217–234. doi: 10.1016/j.orggeochem.2003.09.005
Ogren, J. A., and Charlson, R. J. (1983). Elemental carbon in the atmosphere: cycle and lifetime. Tellus 35, 241–254. doi: 10.3402/tellusb.v35i4.14612
Ogren, J. A., Groblicki, P. J., and Charlson, R. J. (1984). Measurement of the removal rate of elemental carbon from the atmosphere. Sci. Total Environ. 36, 329–338. doi: 10.1016/0048-9697(84)90284-5
Pan, Y. P., and Wang, Y. S. (2015). Atmospheric wet and dry deposition of trace elements at 10 sites in Northern China. Atmos. Chem. Phys. 15, 951–972. doi: 10.5194/acp-15-951-2015
Park, K., Kittelson, D. B., Zachariah, M. R., and McMurry, P. H. (2004). Measurement of inherent material density of nanoparticle agglomerates. J. Nanopart. Res. 6, 267–272. doi: 10.1023/B:NANO.0000034657.71309.e6
Paytan, A., Mackey, K. R. M., Chen, Y., Lima, I. D., Doney, S. C., Mahowald, N., et al. (2009). Toxicity of atmospheric aerosols on marine phytoplankton. Proc. Natl. Acad. Sci. U.S.A. 106, 4601–4605. doi: 10.1073/pnas.0811486106
Pradeep Ram, A. S., Mari, X., Brune, J., Torréton, J. -P., Chu, V. T., Raimbault, P., et al. (2018). Bacterial-viral interactions in a black carbon dominated tropical marine ecosystem (Halong Bay, Vietnam). Elem. Sci. Anth. 6:13. doi: 10.1525/elementa.276
Raimbault, P., Diaz, F., Pouvesle, W., and Boudjellal, B. (1999). Simultaneous determination of particulate organic carbon, nitrogen and phosphorus collected on filters, using a semi-automatic wet-oxidation method. Mar. Ecol. Prog. Ser. 180, 289–295. doi: 10.3354/meps180289
Raimbault, P., Garcia, N., and Cerutti, F. (2008). Distribution of inorganic and organic nutrients in the South Pacific Ocean – evidence for long-term accumulation of organic matter in nitrogen-depleted waters. Biogeosciences 5, 281–298. doi: 10.5194/bg-5-281-2008
Ramanathan, V., and Carmichael, G. (2008). Global and regional climate changes due to black carbon. Nat. Geosci. 1, 221–227. doi: 10.1038/ngeo156
Ramanathan, V., Li, F., Ramana, M. V., Praveen, P. S., Kim, D., Corrigan, C. E., et al. (2007). Atmospheric brown clouds: hemispherical and regional variations in long range transport, absorption and radiative forcing. J. Geophys. Res. 112:D22S21. doi: 10.1029/2006JD008124
Raymond, P. A. (2005). The composition and transport of organic carbon in rainfall: insights from the natural (C13 and C14) isotopes of carbon. Geophy. Res. Lett. 32:L14402. doi: 10.1029/2005GL022879
Schneider, J., Weimer, S., Drewnick, F., Borrmann, S., Helas, G., Gwaze, P., et al. (2006). Mass spectrometric analysis and aerodynamic properties of various types of combustion-related aerosol particles. Int. J. Mass Spect. 258, 37–49. doi: 10.1016/j.ijms.2006.07.008
Stubbins, A., Spencer, R. G. M., Mann, P. J., Holmes, R. M., McClelland, J. W., Niggemann J., et al. (2015). Utilizing colored dissolved organic matter to derive dissolved black carbon export by arctic rivers. Front. Earth Sci. 3:63. doi: 10.3389/feart.2015.00063
Suman, D. O., Kuhlbusch, T. A. J., and Lim, B. (1997). “Marine sediments: a reservoir for black carbon and their use as spatial and temporal records of combustion,” in Sediment Records of Biomass Burning and Global Change. eds J. S. Clark, H. Cachier, J. G. Goldammer, B. J. Stocks (Berlin: Springer-Verlag), 271–293.
Wang, R., Balkanski, Y., Boucher, O., Ciais, P., Peñuelas, J., and Tao, S. (2015). Significant contribution of combustion-related emissions to the atmospheric phosphorus budget. Nat. Geosci. 8, 48–54. doi: 10.1038/ngeo2324
Wang, S., and Wu, H. (2006). Environmental-benign utilisation of fly ash as low-cost adsorbents. J. Hazard. Mater. 136, 482–501. doi: 10.1016/j.jhazmat.2006.01.067
Weinbauer, M. G., Guinot, B., Migon, C., Malfatti, F., and Mari, X. (2017). Skyfall - Neglected roles of volcano ash and black carbon rich aerosols for microbial plankton in the ocean. J. Plankton Res. 39, 187–198. doi: 10.1093/plankt/fbw100
Willey, J. D., Kieber, R. J., Eyman, M. S., and Avery, B., Jr. (2000). Rainwater dissolved organic carbon: Concentrations and global flux. Glob. Biogeochem. Cycles 14, 139–148. doi: 10.1029/1999GB900036
Wurl, O., Ekau, W., Landing, W. M., and Zappa, C. J. (2017). Sea surface microlayer in a changing ocean–A perspective. Elem. Sci. Anth. 5:31. doi: 10.1525/elementa.228
Keywords: black carbon, wet deposition, sorption, aggregation, DOM, nutrients
Citation: Mari X, Guinot B, Thuoc CV, Brune J, Lefebvre J-P, Angia Sriram PR, Raimbault P, Dittmar T and Niggemann J (2019) Biogeochemical Impacts of a Black Carbon Wet Deposition Event in Halong Bay, Vietnam. Front. Mar. Sci. 6:185. doi: 10.3389/fmars.2019.00185
Received: 28 November 2018; Accepted: 21 March 2019;
Published: 09 April 2019.
Edited by:
Christian Lønborg, Australian Institute of Marine Science (AIMS), AustraliaReviewed by:
Andrea Malits, Centro Austral de Investigaciones Científicas (CADIC-CONICET), ArgentinaCopyright © 2019 Mari, Guinot, Thuoc, Brune, Lefebvre, Angia Sriram, Raimbault, Dittmar and Niggemann. This is an open-access article distributed under the terms of the Creative Commons Attribution License (CC BY). The use, distribution or reproduction in other forums is permitted, provided the original author(s) and the copyright owner(s) are credited and that the original publication in this journal is cited, in accordance with accepted academic practice. No use, distribution or reproduction is permitted which does not comply with these terms.
*Correspondence: Xavier Mari, eGF2aWVyLm1hcmlAaXJkLmZy
Disclaimer: All claims expressed in this article are solely those of the authors and do not necessarily represent those of their affiliated organizations, or those of the publisher, the editors and the reviewers. Any product that may be evaluated in this article or claim that may be made by its manufacturer is not guaranteed or endorsed by the publisher.
Research integrity at Frontiers
Learn more about the work of our research integrity team to safeguard the quality of each article we publish.