- Department of Marine Systems, Tallinn University of Technology, Tallinn, Estonia
Sub-halocline oxygen conditions in the deep Baltic Sea basins depend on natural forcing and anthropogenic impact. HELCOM has a long tradition of characterizing the status of the seabed and deep waters by estimating the extent of anoxic and hypoxic bottoms. A eutrophication-related indicator “oxygen debt” has been used in the recent HELCOM assessments and a more sophisticated “oxygen consumption” indicator has been introduced. We describe the oxygen conditions in the Gulf of Finland (GoF) in 2016–2017 based on observations at the Keri profiling station where vertical profiles of temperature, salinity and oxygen were acquired up to 8 times a day. The main aim of the study is to test the applicability of high-frequency data from this fixed automated station and the three adapted oxygen indicators for the eutrophication-related status assessments. The results show that the GoF bottom area affected by hypoxia varied in large ranges from 900 to 7800 km2 with a seasonal maximum in autumn (>25% of bottoms were hypoxic in autumn 2016). Oxygen debt is the simplest indicator, and the assessment results are less influenced by the wind-induced changes in hydrographic conditions. We suggest that oxygen debt should be assessed just below the halocline and based on data from the stratified season only since, in the GoF, the halocline could be destroyed in winter. For the “oxygen consumption” indicator, a rough oxygen budget, where the contributions of advection and mixing are included, was formulated. Average seasonal consumption values of 0.82 and 0.31 mg⋅l-1⋅month-1 were estimated in the 50–60 m water layer of the GoF in 2016 and 2017, respectively. The found large difference in consumption values between 2016 and 2017 could partly be related to the uncertainties of advection estimates. We concluded that all three indicators have their advantages and methodological challenges. To increase the confidence of eutrophication assessments both high-frequency profiling should be implemented in the monitoring programs and more accurate estimates of changes due to physical processes are required.
Introduction
The Baltic Sea is an area where oxygen conditions are influenced by climate change (Kabel et al., 2012) and increased eutrophication (Conley et al., 2009; Gustafsson et al., 2012). Eutrophication is driven by excessive inputs of nutrients from rivers and atmosphere (mostly land-based sources) which lead to increased sedimentation of organic material and oxygen depletion in the bottom layer and the internal loading of phosphorus (Vahtera et al., 2007). The oxygen conditions in the near-bottom layer of the central deep basins of the Baltic Sea are occasionally improved by the Major Baltic Inflows (MBI) (Matthäus and Franck, 1992; Schinke and Matthäus, 1998). The MBIs also strengthen stratification and therefore potentially increase areas with oxygen depletion by inhibiting ventilation of deep layers (Gerlach, 1994; Conley et al., 2002).
The Gulf of Finland (GoF) is an elongated estuarine basin with the largest single freshwater input and the highest nutrient loading to the Baltic Sea from the Neva River (Alenius et al., 1998). Beside the eutrophication effects, the sub-surface distribution and variability of dissolved oxygen (DO) in the GoF are related to multi-scale physical processes. These processes range from short-term oscillations and mixing events to wind-driven alterations of estuarine circulation, seasonal development and decay of stratification and sub-halocline transport of hypoxic/anoxic waters from the Northern Baltic Proper, for instance, associated with the MBIs (Elken et al., 2003; Liblik et al., 2013, 2018; Lips et al., 2017). The lack of MBIs during stagnation periods affects the GoF in a way that stratification and hypoxia are decreased (Conley et al., 2009; Laine et al., 2007). Oxygen in the near-bottom layer is dependent on wind conditions as north-easterly and northerly winds support the estuarine circulation and strong south-westerly wind forcing causes the reversal of estuarine circulation (Lehtoranta et al., 2017). The estuarine circulation is characterized by the up-estuary (eastward) flow in the deep layer and the down-estuary (westward) in the upper layer. The reversed circulation bears opposite results – the up-estuary flow in the surface layer and the down-estuary (westward) flow in the deeper layer (Elken et al., 2003). Prevailing of the estuarine circulation leads to strengthening of the halocline while reversals cause weakening of stratification. The wintertime deep-water oxygen conditions are strongly dependent on the spatiotemporal variability of the salt wedge originating from the Northern Baltic Proper (Liblik et al., 2013), which moves eastward and westward at the gulf’s bottom depending on wind conditions.
According to the Marine Strategy Framework Directive’s (MSFD; Directive 2008/56/EC of the European Parliament and of the Council, 2008) Article 11, all member states have to establish and implement monitoring programs to assess the status of their marine environment. The monitoring programs have to provide data that enable the application of different indicators in order to assess the status of marine waters, including in regard to eutrophication effects. HELCOM (Baltic Marine Environment Protection Commission – Helsinki Commission) has set out a number of core indicators (according to MSFD) for describing the eutrophication status where nutrient levels are based on dissolved inorganic nitrogen and phosphorus as well as total nitrogen and phosphorus. Direct effects of eutrophication are assessed based on chlorophyll a levels and water transparency (Secchi depth). Oxygen conditions are used to describe the indirect effects. The overall assessment is given using a tool called HEAT (HELCOM Eutrophication Assessment Tool) which determines the distance between the measured value of an indicator and good environmental status (GES, a predefined threshold value), aggregates the indicator evaluations and gives the confidence of the assessment (HELCOM, 2014).
While indicators based on nutrient levels and direct effects for assessing eutrophication status are applicable in all Baltic Sea sub-basins, the use of oxygen indicators, describing the indirect effects, is restricted to the deep basins, including the GoF. The approved core indicator evaluates the oxygen debt (the “missing” oxygen relative to a fully saturated water column) below the halocline found based on salinity profiles and discrete oxygen concentrations measured at standard depths (HELCOM, 2013). The threshold values are uniform for most of the basins, including the GoF (8.66 mg/l). The latest results for oxygen debt assessments in the GoF are 10.54 mg/l for 2007–2011 and 10.67 mg/l for 2011–2016 (HELCOM, 2014, 2018a), both indicating that GES has not been achieved. Data used for oxygen debt indicator assessments originate from temporally sparse monitoring (in Estonia, national monitoring is carried out six times a year) which could miss the variability of deep-water oxygen conditions, and therefore, the assessment results could be biased. To get a more confident assessment of oxygen conditions in the deep water the data acquired with better temporal coverage could be used.
The development of a more uniform indicator was initiated in the frames of the HELCOM EUTRO-OPER project in 2015. The idea was to estimate the oxygen consumption during summer in the layer below the productive surface layer, it means in the so-called stagnant layer located between the thermocline and the halocline. Oxygen consumption is calculated based on oxygen depletion, diffusion and advection. Due to small temporal differences in salinity and temperature within the stagnant layer, advection was neglected in the first tests of this indicator (HELCOM, 2015b).
Oxygen conditions can also be described by the spatial extent of hypoxia which could be one of the possible indicators of indirect effects of eutrophication (Conley et al., 2009). Considering the hypoxic area as a eutrophication status indicator, the natural variability of oxygen, e.g., the changes due to hydrographical influences and the anthropogenic component have to be separated in order to seclude human-induced effects. The yearly extent of the hypoxic and anoxic bottom area in the Baltic Sea is assessed and presented on HELCOM Environment fact sheets (Naumann et al., 2018; Viktorsson, 2018). The results differ a bit between these latest two assessments due to the temporal and spatial coverage of data used. The first estimate, produced by the Swedish Meteorological and Hydrological Institute (SMHI), uses data from the autumn period, August to October for the whole Baltic Sea, and the second, produced by the Baltic Sea Research Institute, Warnemünde (IOW), uses data from May and excludes the Bothnian Sea, Danish straits, Gulf of Riga and the GoF.
In this study, we defined hypoxia by a threshold of 2.9 mg⋅l-1, which is one of the two most commonly used thresholds (the other being 2.0 mg⋅l-1) in literature, based on an extensive review by Vaquer-Sunyer and Duarte (2008). They concluded that a single threshold could not adequately describe the influence of hypoxia to different benthic marine organisms and argue that the conventionally accepted threshold of 2.0 mg/l is well below the oxygen thresholds for more sensitive taxa. It is important to define a proper hypoxia level for the Baltic Sea and GoF, but we do not discuss this issue here since the hypoxia area estimate methodology will still be the same and the hypoxia threshold could be addressed together with setting the border between the GES and sub-GES.
The hypoxic area assessments by SMHI show that the areal extent and the volume of anoxia and hypoxia have continuously been elevated since the regime shift in 1999 (Hansson et al., 2011). The latest results (for 2017, mean areal results) show that anoxic conditions affect around 18% and hypoxia around 28% of the bottom areas in the Baltic Sea, including the GoF and the Gulf of Riga (Hansson et al., 2017). In the IOW hypoxic area estimations, the GoF is unfortunately excluded, but it is seen that the anoxic conditions in the Northern Baltic Proper in 2016 have changed into hypoxic conditions in 2017 (Naumann et al., 2018).
All above-described assessments are based on data from spatially distributed monitoring stations with low temporal resolution. An alternative approach could be to apply data from automated profiling stations which also catch temporal variability due to prevailing hydrographic processes. In the present study, we analyze the high-resolution time series of vertical profiles of oxygen in the GoF in 2016–2017. The main aim is to demonstrate how these observations could be applied to assess the status of this stratified estuary in relation to the eutrophication effects using the adapted versions of the three possible indicators.
Materials and Methods
Core Data Set
The core data set used in the present study originates from the autonomous bottom-mounted profiler, which is deployed at the depth of 110 m near the Keri Island in the GoF since March 2016 (Figure 1). The data acquired in 2016 and 2017 were used. The system was developed by Flydog Solutions Ltd., (Estonia) and includes, as the main measurement device, an OS316plus CTD probe (Idronaut s.r.l., Italy) with Idronaut oxygen sensor and Trilux fluorescence sensor (Chelsea Technologies Group Ltd.). The profiler records temperature, salinity, DO content, chlorophyll-a, phycocyanin and turbidity at a rate of 8–9 Hz while moving up with an average speed of 8–10 cm⋅s-1. In May–June 2017, a Seabird Electronics SBE19plus probe with SBE43 oxygen sensor provided by the Finnish Meteorological Institute was used instead of the OS316plus probe. The accuracy of the used Idronaut oxygen sensors is 0.1 mg⋅l-1.
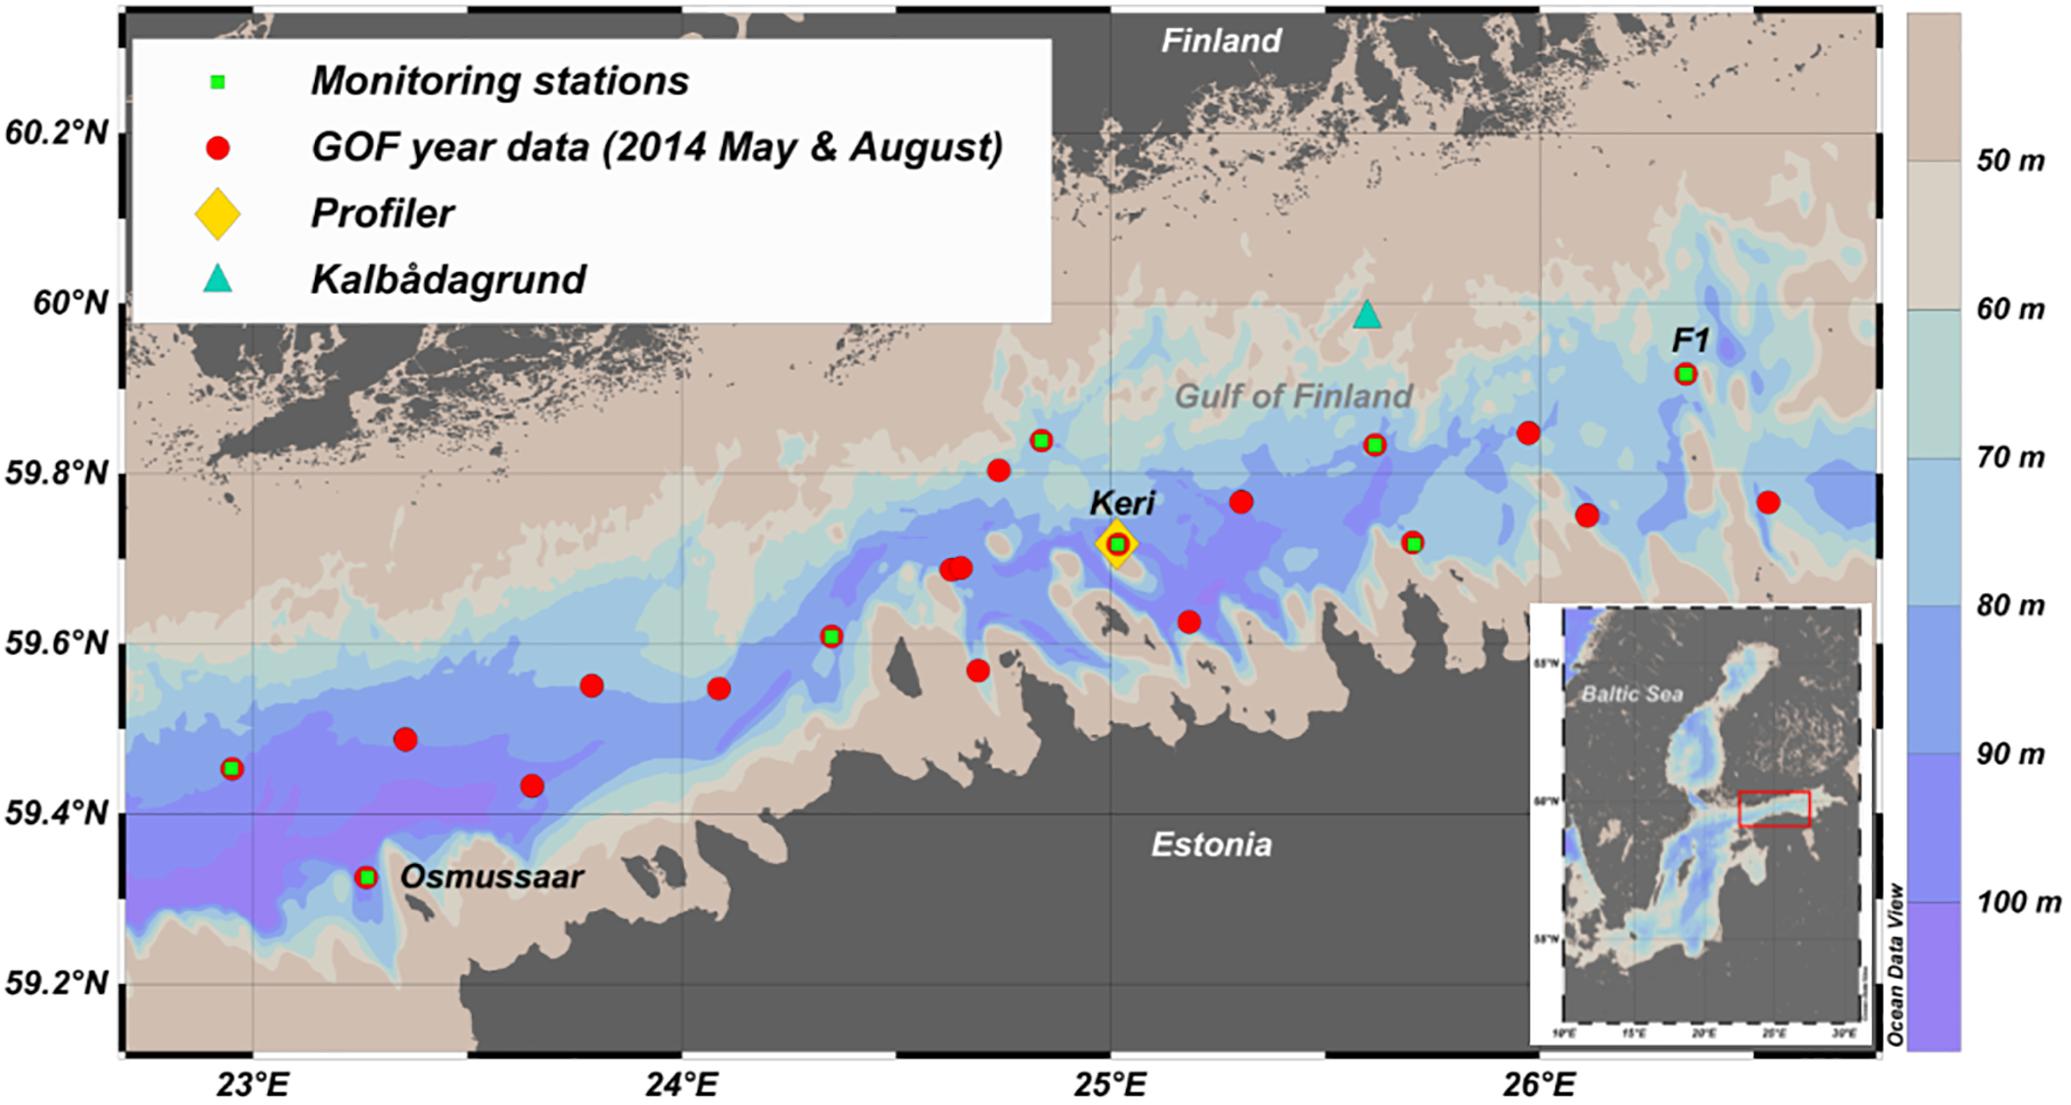
Figure 1. The location of the autonomous bottom-mounted profiler (yellow diamond) in the Gulf of Finland (GoF). National open sea monitoring stations are marked with green squares and CTD-stations from the GoF Year 2014 surveys, used to determine the inclination of the hypoxic layer in the gulf, are marked with red circles. Kalbådagrund wind station is marked with a blue triangle. This map was generated using Ocean Data View 4.7.10 software (Schlitzer, 2018).
The data were pre-processed to exclude spikes and recordings when the probe movement was reversed (e.g., due to waves moving the buoyant probe up and down in the near-surface layer) and to compensate the time lag of sensors. While the Idronaut oxygen sensor has a time constant of about 8 s, the time constant of SBE43 sensor was set to 4 s. After the pre-processing of data, the vertical profiles were stored with a constant step of 0.5 m. The data were collected in the water column between 100 and 4 m.
All used CTD probes and oxygen sensors were calibrated at the factory before the deployment. In addition, the core data set was quality controlled against the quality-assured data from the research vessel based measurements conducted regularly (once a month) close to the profiling station using a CTD probe OS320plus (Idronaut s.r.l., Italy) and laboratory analyses of water samples. See the applied methods and onboard quality assurance procedures in the next sub-section. Since the oxygen sensor had a drift in time, the oxygen profiles were corrected using ship-borne measurement results. For each vessel visit, a linear regression line equation with the intercept set to zero was found by comparison of the ship-borne oxygen profile and the closest oxygen profile from the bottom-mounted profiler. The oxygen profiles between the two consecutive vessel visits were corrected using the coefficient (the slope of the regression line) assuming its linear trend in time. If such ship-borne measurements were not available from a specific period, all data from that period were excluded from the further analysis.
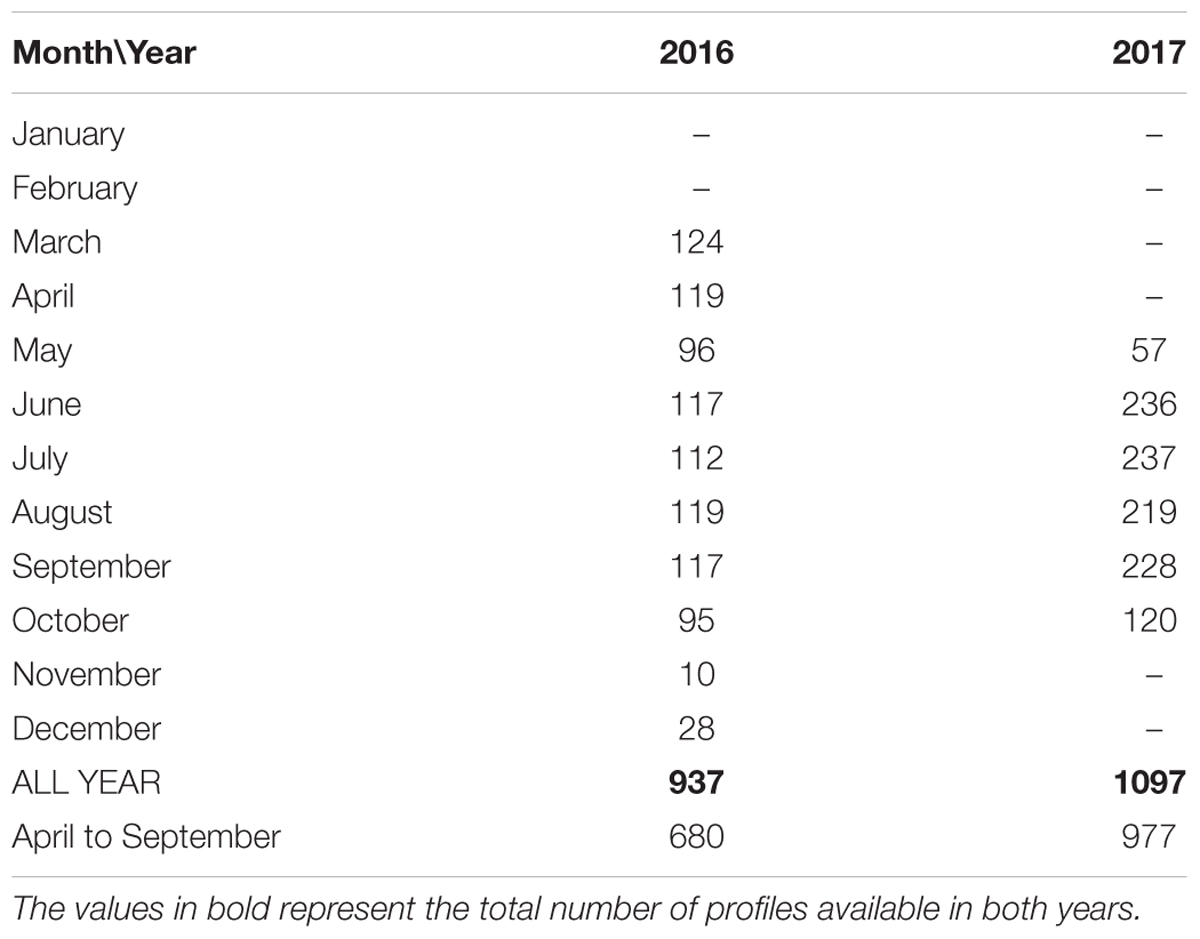
The temporal continuity of the analyzed data can be described by the months covered and the number of quality controlled profiles available (Table 1). In both years, the majority of the productive season is covered. The exclusion of data due to quality problems and the stops in the operation of the bottom-mounted profiler (for instance, in January–April 2017) due to different reasons are seen in Table 1 as well as the next section as blank areas in the graphs. The higher number of profiles per month in summer 2017 was due to the setup of profiling frequency of 8 profiles per day while it was 4 profiles per day in 2016.
Ship-Borne Data Collected in 2014–2017
Data from the research vessel cruises were used for the quality assurance of the measurements by the bottom-mounted profiler and determining the spatial variability in the vertical distribution of DO in the gulf. Also, the relationship between the oxygen and salinity in the sub-surface layers in the vicinity of the profiler was found using the ship-borne observations. The analyzed CTD data were gathered in the frames of national monitoring and GoF Year 2014 programs in 2014–2017 (Figure 1) as well as additional monthly visits to the Keri station in 2016–2017. The oxygen sensor attached to the OS320plus was calibrated before each cruise. Oxygen profiles used for the analysis were quality checked against the laboratory analysis of water samples using an OX 400 l DO (WWR International, LCC). The accuracy of the Idronaut oxygen sensor on board the research vessel is 0.1 mg⋅l-1 while the accuracy of the laboratory DO analyzer is 0.5% of the measured value. Altogether 336 ship-borne vertical profiles of DO were available for the present study.
Also the temperature and salinity data of both, the research vessel CTD and the profiler CTD, were quality checked against water samples analyses using a high-precision salinometer 8410A Portasal (Guildline). The average difference of the salinity values was less than 0.02 g⋅kg-1 that indicated no need for the correction of the CTD data.
Indicators
Extent of Hypoxic Area
Bathymetric data from Andrejev et al. (2010, 2011) with the horizontal resolution of 463 m were used to calculate the hypsographic curve of the GoF, and based on this dataset, the GoF area was set equal to ∼27631 km2 and volume to ∼1042 km3. We selected the threshold for hypoxia of 2.9 mg⋅l-1 (equal to 2.0 ml l-1 and 89.3 μmol l-1) as also applied in HELCOM Baltic Environmental Fact Sheets (Naumann et al., 2018; Viktorsson, 2018) and many research papers (e.g., Diaz and Rosenberg, 2008; Conley et al., 2009). The upper border of the hypoxic layer was defined for each measured vertical profile as the minimum depth where DO content was below the defined threshold (see examples in Figure 2). In some cases (some profiles from March 2016) hypoxic depth was not possible to define from the profiles, and the hypoxic depth was assumed to be deeper than the deepest measured value. Here the depth of hypoxia was found based on the assumption that DO content decreases linearly when moving deeper. The change in DO content with depth was found comparing DO measured at the last depth and DO measured five meters above the last depth.
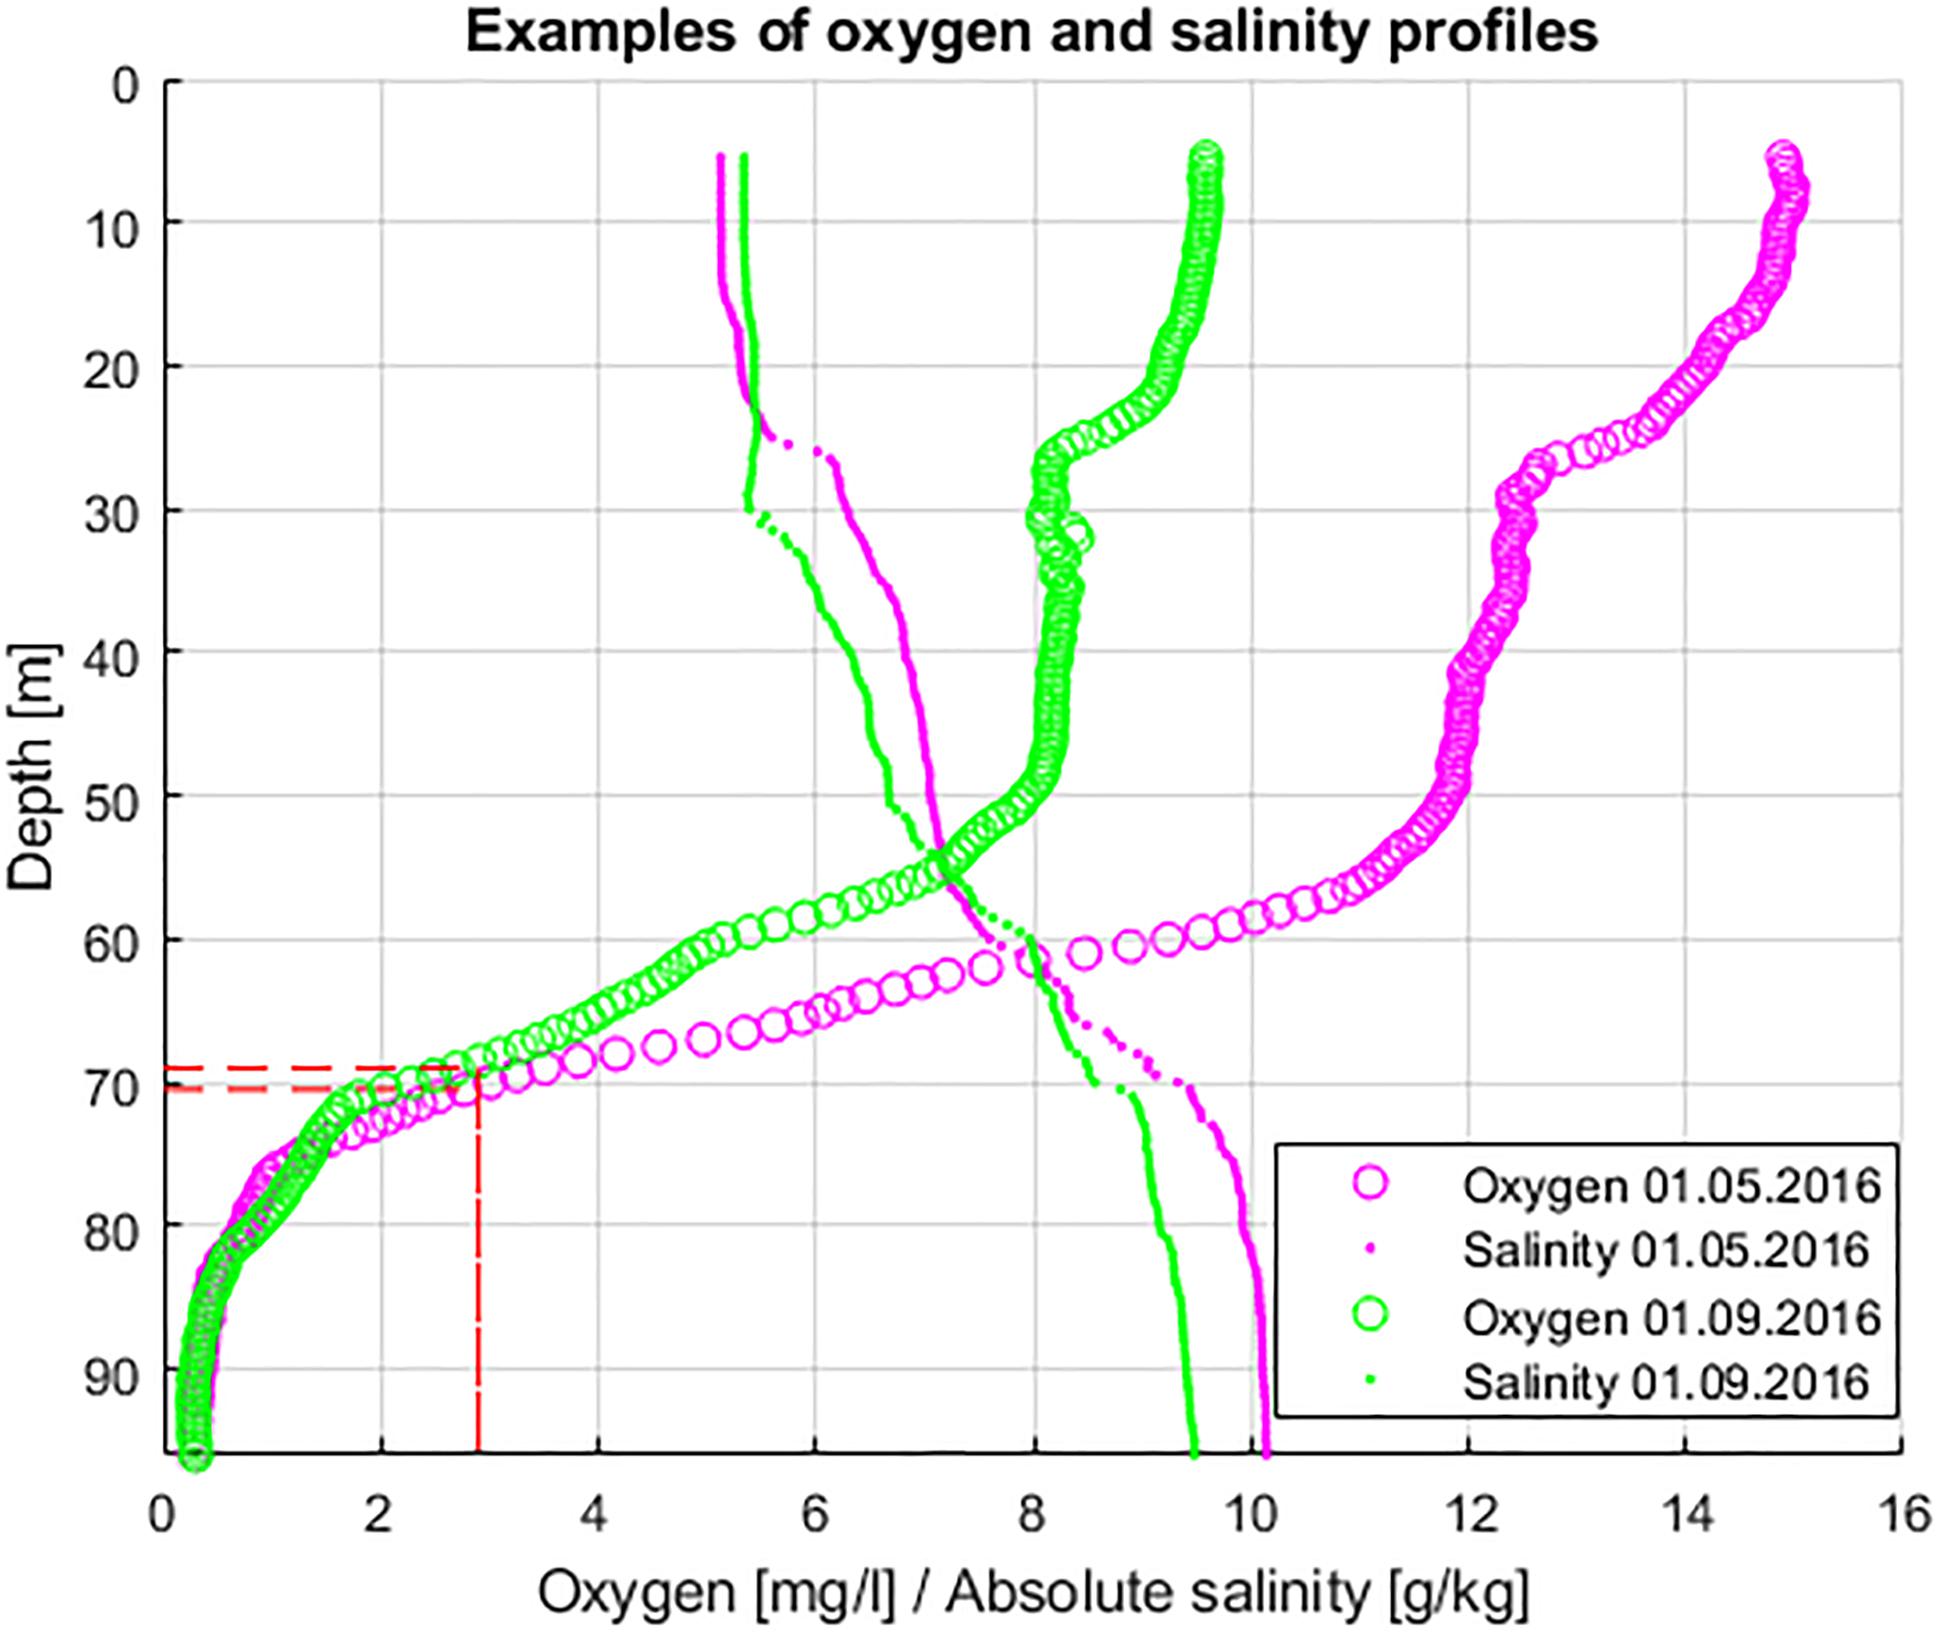
Figure 2. Examples of oxygen and salinity profiles (magenta – 1st of May 2016, green – 1st of September 2016). The upper border of hypoxia (O2 < = 2.9 mg⋅l-1) is marked with the red dashed lines.
where depthmax is the deepest measured depth value and x is the change of depth from last measured depth value to the depth value where DO = 2.9 mg⋅l-1; x was defined as:
where 5 is depth interval (in meters) between the two DO measurements used to find the linear change in DO; 2.9 is the concentration of DO (in mg⋅l-1) which marks hypoxia; DOdepth(max) is the deepest measured DO value and DOdepth(max)-5 is the DO value measured 5 m above the deepest value. If x < 0 or DOhypoxia > 115 m, then the value DOhypoxia = 115 m was used, which is the maximum depth in the Keri area and it is deeper than the maximum depth in the used bathymetric data.
To determine the average spatial inclination of the upper border of the hypoxic layer along the GoF, data from two cruises in May and August 2014 with spatially well distributed station network (Figure 1) were analyzed. First, the start of hypoxia was found (same method as for the indicator) for every measured profile. Then these depths were plotted against station longitude, and the linear regression line, indicating the change of hypoxic depth in the east-west direction, was found.
Based on the found hypoxic depth values and the hypsographic curve, corresponding area and volume of hypoxia in the GoF were calculated by applying a developed script (we used software package MATLAB R2016a). Two estimates of both parameters were found (1) assuming that the border of the hypoxic layer was a horizontal plane and (2) assuming that it had a constant inclination in the east-west direction. The monthly values of the estimates are presented since we suggest that it is a long enough period to filter out the impact of spatial variability at mesoscale (remember that we use observations for a single station).
To compare hypoxic area extent results with prevailing wind conditions we used wind data from the only real open sea automatic weather station (other stations are mainly located near the coast) at Kalbådagrund (59°58′N, 25°37′E) (Alenius et al., 1998). Wind data was corrected to represent wind speed at 10 m (measured wind speed was multiplied by 0.91) (Launiainen and Laurila, 1984). First, the monthly mean hypoxic area extent was related to the prevailing wind direction and speed calculated for the preceding 30 days. For example, the hypoxic area in June was compared with wind data from the 16th of May to the 15th of June. The number of days used for wind analysis was selected to be 30 because that is the time frame used for the calculation of average hypoxic extent. Secondly, the linear correlation between the 3-week average wind stress component from N-NE (20π) and the hypoxic depth was found. This choice of the wind direction and period was based on a study by Liblik and Lips (2011) where they showed that the 3-week average wind component correlated best with the changes in the vertical thermohaline structure in the GoF in summer. Drag coefficient used when finding wind stress was according to Large and Pond (1981).
Oxygen Debt Indicator
In the latest HELCOM eutrophication assessments (HELCOM, 2014, 2018b), an oxygen debt indicator proposed during the HELCOM TARGREV project was used. Because the monitoring data are only available from the standard depths, a special procedure was applied to estimate the sub-halocline DO content. First, the salinity profiles were modeled to identify the halocline. Then, the linear segments of the oxygen profile in the halocline and below it were constructed. Oxygen debt was calculated by subtracting the monitored DO content from the concentration of saturation, taking into account the temperature and salinity values. Finally, the volume specific oxygen debt was found for the sub-halocline layer (see more about the method in HELCOM, 2013).
In the present work, the oxygen debt value just below the halocline and not the volume specific average was used as the oxygen debt indicator. The halocline was determined as the depth range where the vertical salinity gradient was greater than 0.07 g⋅kg-1⋅m-1 (Liblik and Lips, 2011), whereas the salinity gradient was found based on smoothed profiles (over 2.5 m). Temperature, salinity and DO content values just below the halocline were found for each measured profile, and the corresponding oxygen debt values were calculated. In order to assess the eutrophication status, monthly and seasonal averages of oxygen debt were estimated.
For the HELCOM oxygen debt indicator, a constant target value in the GoF, the Northern Baltic Proper and the Eastern Gotland Basin is defined at 8.66 mg⋅l-1 as an annual average (HELCOM, 2013). We suggest that the uniform target value should not be applied since the basins have different depths and a linear oxygen change below the halocline was assumed. However, if the oxygen debt value just below the halocline is used, the targets could be similar, though still to be defined, for all mentioned basins. The other reason not to use the volume specific average oxygen debt is that we lack hydrogen sulfide observations at the profiling station and the oxygen debt estimate near the seabed could be biased.
Oxygen Consumption Indicator
An alternative oxygen indicator is being developed by the experts working with eutrophication-related issues in the HELCOM community, although it is not fully ready nor applied yet (HELCOM, 2015b). The idea is to base the indicator on estimated oxygen consumption in the summer season (June to September) below the productive layer but above the halocline – in a so-called stagnant layer. In the HELCOM report, the sparse monitoring data were used and the advective processes were not taken into account when estimating oxygen consumption. We test this indicator based on vertical profiles of DO content acquired with a high temporal resolution at a fixed position.
According to HELCOM (2015a), oxygen consumption (CONS) in a water layer between its upper (u) and deeper (d) border is calculated as:
where DEPL is oxygen depletion (decrease in oxygen has a positive value) and DIFF and ADV are the change in oxygen content due to vertical diffusion and advection (both horizontal and vertical), respectively. The layer with the borders u and d is selected for a studied year based on vertical thermohaline structure (see section “Oxygen Consumption”).
Changes in DO content due to diffusion are estimated as:
where A(u) and A(d) are the horizontal cross-sectional area of the studied layer, and the vertical gradient of oxygen and κ(u) and κ(d) the vertical diffusivity coefficient at its upper and deeper border, respectively. The latter is calculated as:
where α is an empirical intensity factor of turbulence. N is the Brunt–Väisälä frequency, defined as:
where g is the acceleration due to gravity, ρ0 is density of the seawater and is the vertical gradient of density. In the present study, we assumed that the areas A(u) and A(d) are equal (it is correct for deep enough regions) as well as the empirical intensity factor of turbulence is a constant (α = 1.5⋅10-7 m2⋅s-2).
The increase in oxygen content due to advection was calculated based on the estimated salinity advection and an assumption that a linear correlation exists between the changes in salinity and oxygen. Since neither salinity sources nor sinks exist in the sub-surface layer, salinity advection could be found as:
where CHANGE is the salinity change between the two profiles in the selected layer and DIFF is the estimated change in salinity due to vertical diffusion (a similar formula was applied as for oxygen diffusion). Oxygen advection was thus calculated as:
where a is the oxygen change corresponding to a unit change in salinity. This coefficient was found as the slope value of the linear regression line based on salinity and oxygen data from the monitoring cruise in April of the corresponding year, thus, before the analyzed period. For the regression analysis, a layer from 30 to 70 m was selected which is broader than the stagnant layer where oxygen consumption was estimated in the present study.
Oxygen depletion was calculated based on the monthly mean average oxygen concentrations in the selected layer. For example, to find oxygen depletion between June and May, the average concentration in June was subtracted from the average concentration in May. The total monthly change in DO content due to diffusion was found as the daily average diffusion during 30–31 days (e.g., from mid-May until mid-June) multiplied by the number of days. The monthly changes in both, salinity and oxygen, due to advection were also estimated over the similar monthly time step. Finally, monthly oxygen consumption values were obtained as expressed in Eq. (1). A month was chosen as a minimum time step since the consumption estimates for a shorter period are close to the accuracy of the DO measurements.
Results
High-Resolution View on Temporal Variability of Dissolved Oxygen Content
The time series of vertical distributions of temperature, salinity and DO concentration from spring until autumn in 2016 and 2017 (Figure 3) show both the seasonal course and the short-term variations. The surface layer warming and development of the seasonal thermocline with its sharp down- and upward movements between 10 and 40 m depth were the characteristic features of the temperature distribution time-series. The halocline fluctuated between the depths of 60 to 80 m. If to consider a general temporal development of salinity distribution in the deep layer from May to October, then the halocline penetrated deeper from June to late August and got shallower in late September and October in both studied years.
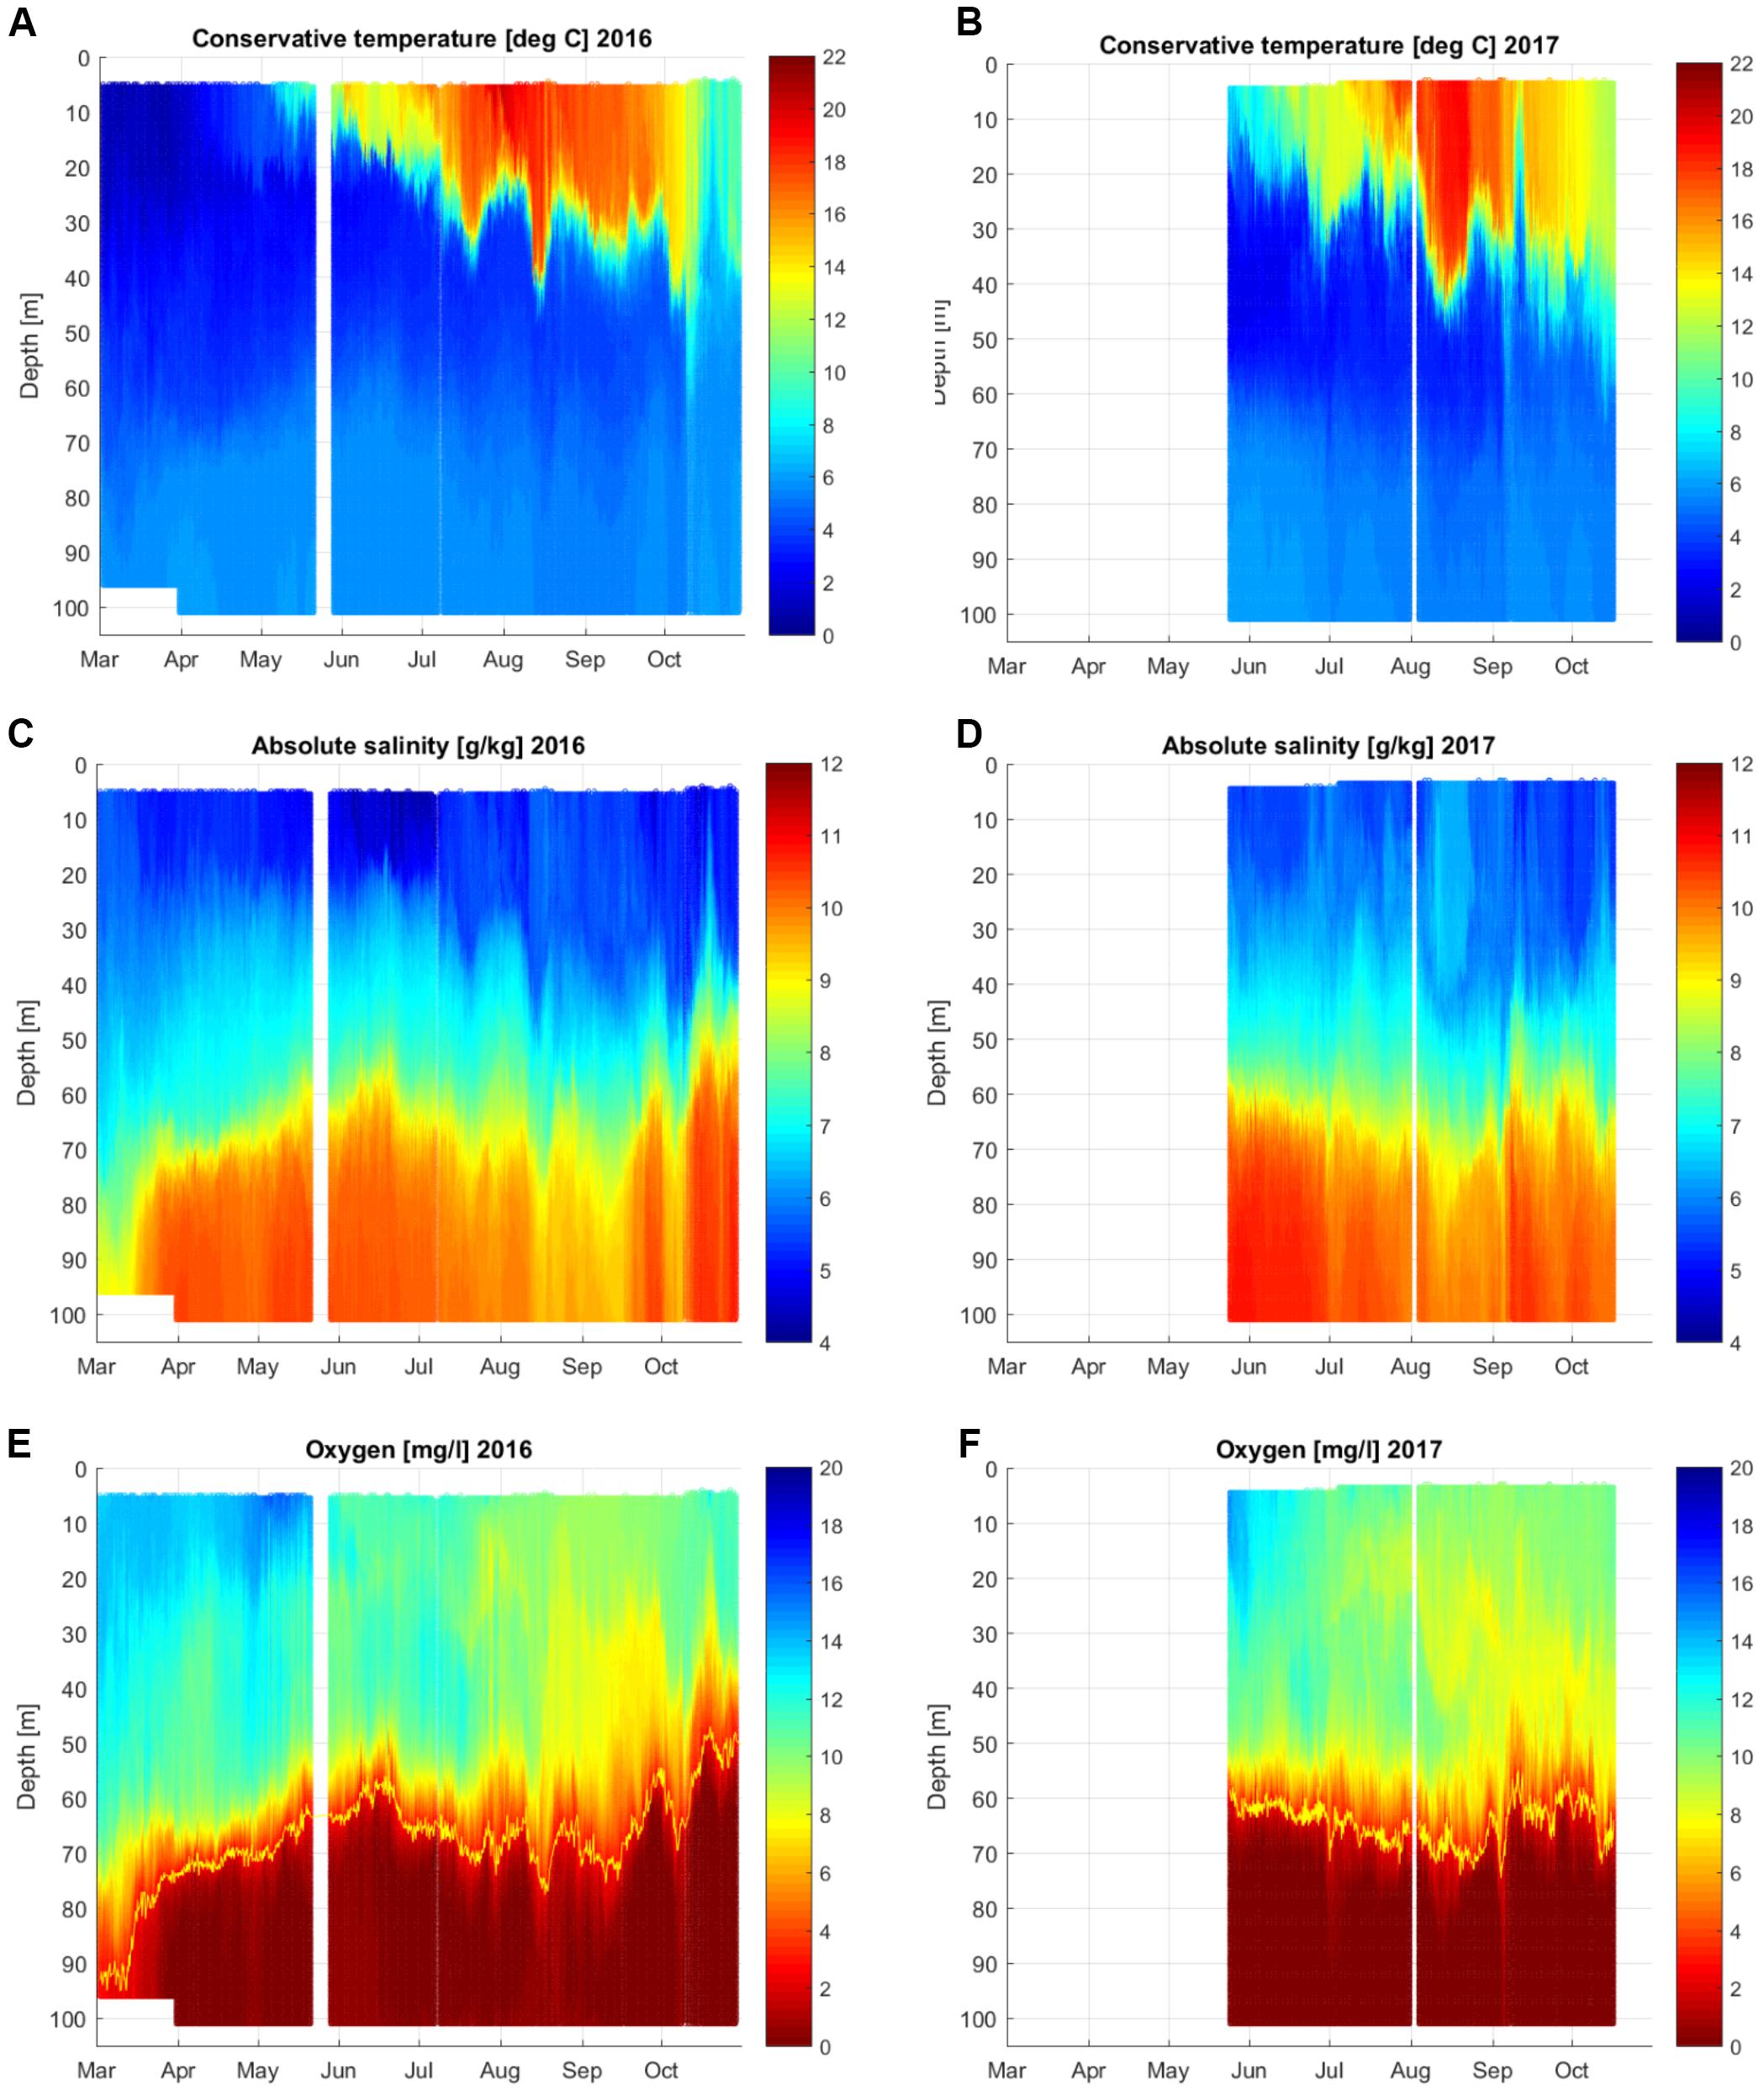
Figure 3. Temporal variability of vertical distributions of temperature (A,B), salinity (C,D) and dissolved oxygen concentration (E,F) at the Keri bottom-mounted station in the GoF in 2016 and 2017. The yellow line in the lower panel shows the border of hypoxia (2.9 mg⋅l-1). White strips/areas indicate periods when no data was available.
The seasonal course of the vertical distribution of oxygen followed the mentioned development of the thermohaline structure. Oxygen concentrations decreased in the upper layer from spring to late summer mostly due to the decay of the vernal phytoplankton bloom and the temperature increase in the summer months, as it leads to the decrease in saturation concentration. The boundary of the near-bottom hypoxic layer, defined here as the oxygen concentration of 2.9 mg⋅l-1 (the yellow line in Figure 3 lower panel), moved up- and downward together with the halocline. It is also seen that the oxygen concentrations decreased in the layer between the thermocline and halocline. At least partly this decrease in oxygen content could be related to the oxygen consumption that will be analyzed in more detail in the present study.
Hypoxic Area
The depth, at which hypoxia starts in the water column, varied throughout the year and between the 2 years (Figure 4) with an average from May to October of 64.5 m in 2016 and 64.6 m in 2017. The upward movement of the border of the hypoxic layer from winter to spring occurred in 2016. In June–September of both years, the hypoxia border moved downward in the water column from about 60 to 70 m, and after that, it rose again to 60 m in both years and even shallower in late October 2016. At the same time, as the hypoxia border deepened, a significant salinity decrease at the minimum depth of the hypoxia was observed (p < 0.05) in both years from May to October (Figure 4). This result suggests either the local consumption of oxygen, since it corresponds to a decrease in oxygen content at a fixed salinity value, or a change in water properties due to physical processes, such as advection of water masses with a different oxygen-salinity relationship.
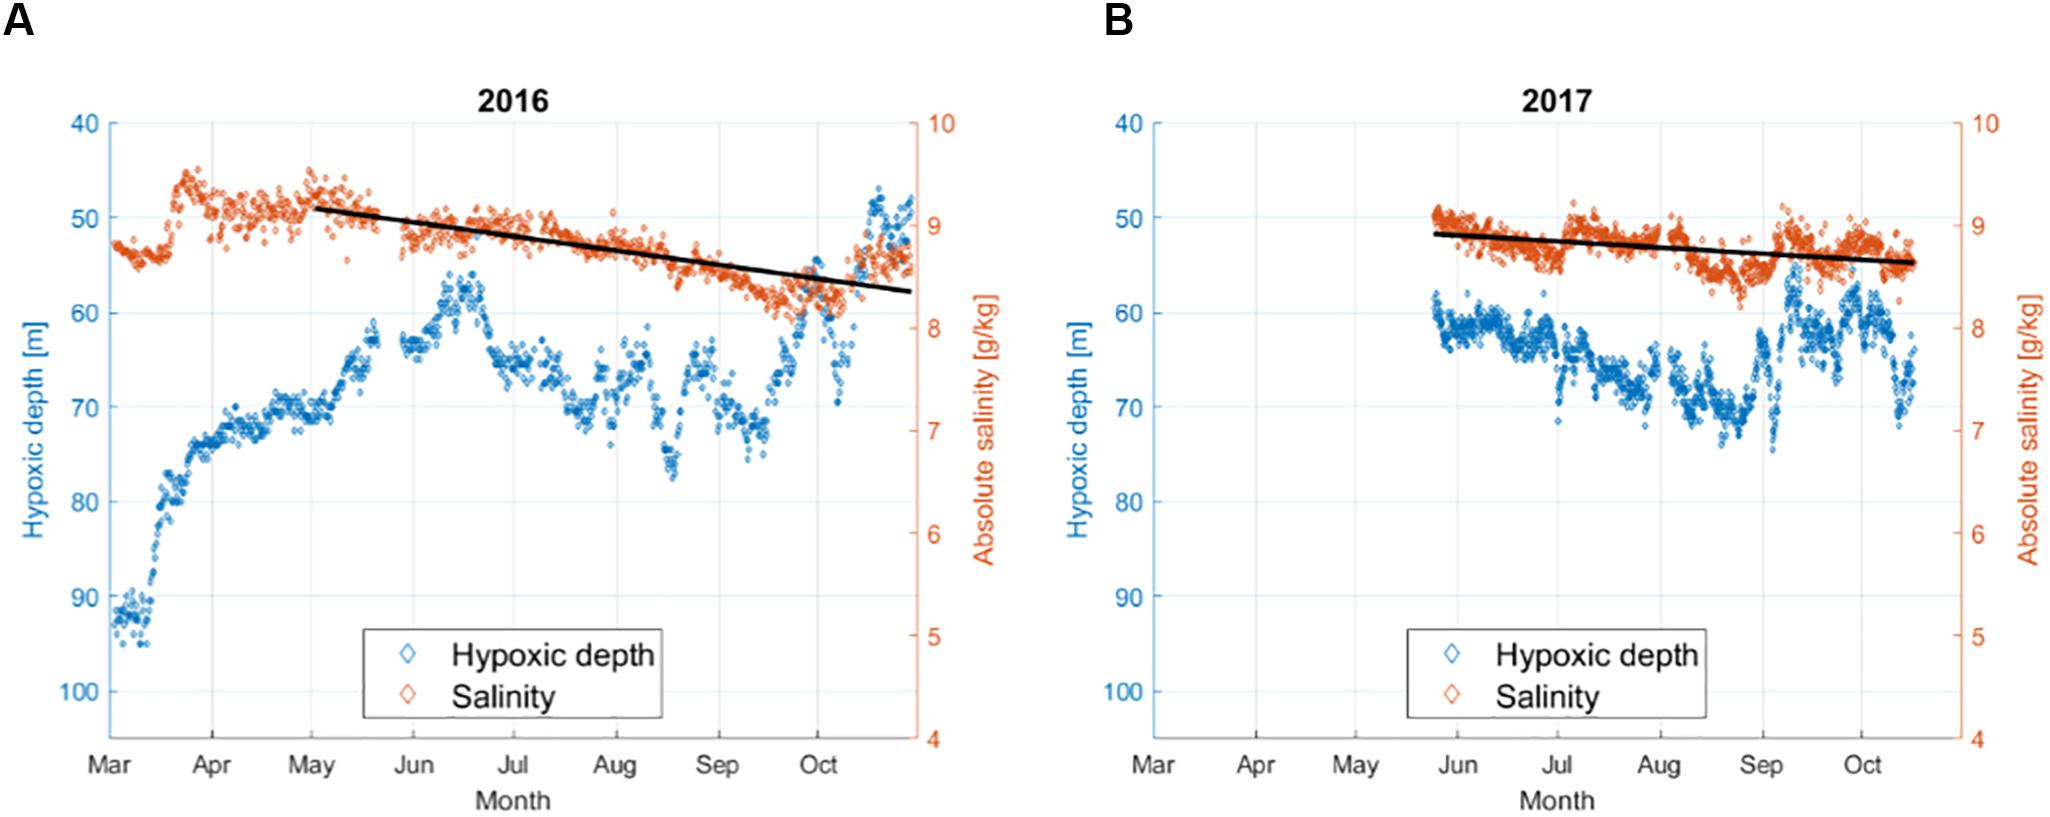
Figure 4. Variability of the hypoxic depth and salinity at the hypoxic depth based on individual profiles acquired at the Keri station in 2016 (A) and 2017 (B). Dashed lines show the linear temporal trend of salinity at the hypoxic depth from May to October. In both years, the trend was significant with R2 = 0.68 (p < 0.05) in 2016 and R2 = 0.25 (p < 0.05) in 2017.
Since the depth of the upper border of the hypoxic layer (hypoxic depth) revealed high short-term variability (Figure 4), the estimates of the hypoxic area and volume of hypoxic waters were analyzed based on the monthly averages. Both approaches, assuming the leveled and the inclined border of the hypoxic layer were applied (Table 2). The linear inclination of the border of the hypoxic layer of 1.9 m per 100 km along the GoF from west to east, found based on the GoF Year 2014 data [see stations network in Figure 1; correlation between the start of hypoxia and longitude was significant (R2 = 0.16, p < 0.05)], was used. As seen in Table 2, the estimates of the area and volume of the hypoxic waters differed only by <2 and <0.5%, respectively, if the estimates based on the leveled and the inclined border of the hypoxic layer were compared. This good coincidence of the estimates, although an average inclination of the border of hypoxia exists, is most probably explained by a central location of the Keri station in the GoF.
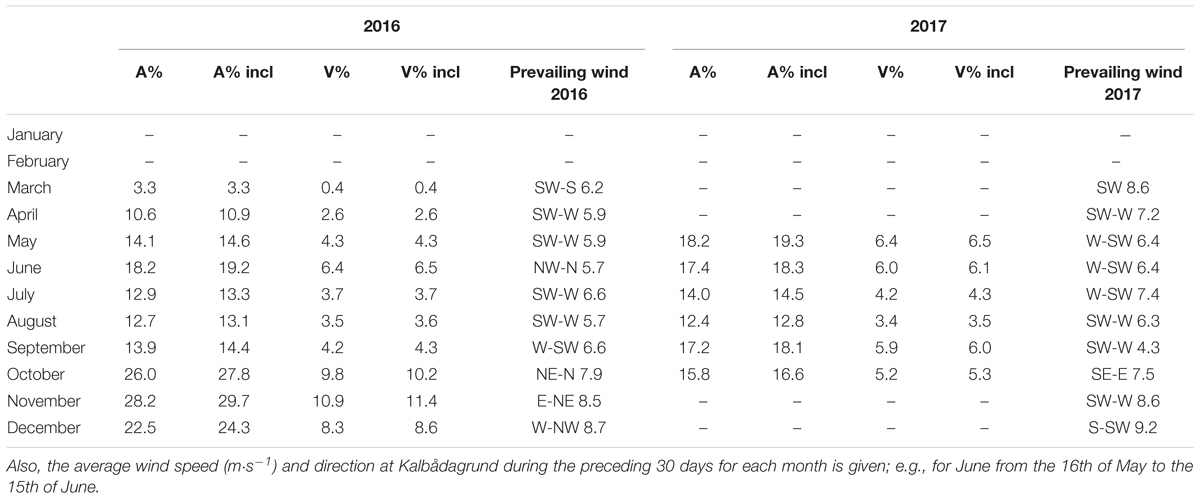
Table 2. Monthly averages of the bottom area and volume (percent of total area/volume) for the leveled and the inclined border of the hypoxic layer in 2016 and 2017; “incl” stands for the inclined layer, “A” for area and “V” for volume.
We compared the monthly average extent of the hypoxic area with the average wind vector from the preceding 30 days (Table 2). It is seen that for 2016, when the N-NE winds prevailed, then the hypoxic area was enlarged, while with the W-SW winds, the area was somewhat smaller. However, in 2017, the wind forcing could not explain the observed changes so well. The hypoxic area was biggest in May–June and in September but the corresponding winds for these months from the sector between east and north were almost absent. We also compared the 3-week average wind component from N-NE (20π) with the hypoxic depth at the Keri station (Figure 5). If the early spring data were excluded, then the linear correlation was significant (p < 0.05) for both years with a much stronger relationship for 2016 May–October than for 2017 May–October (Figure 5).
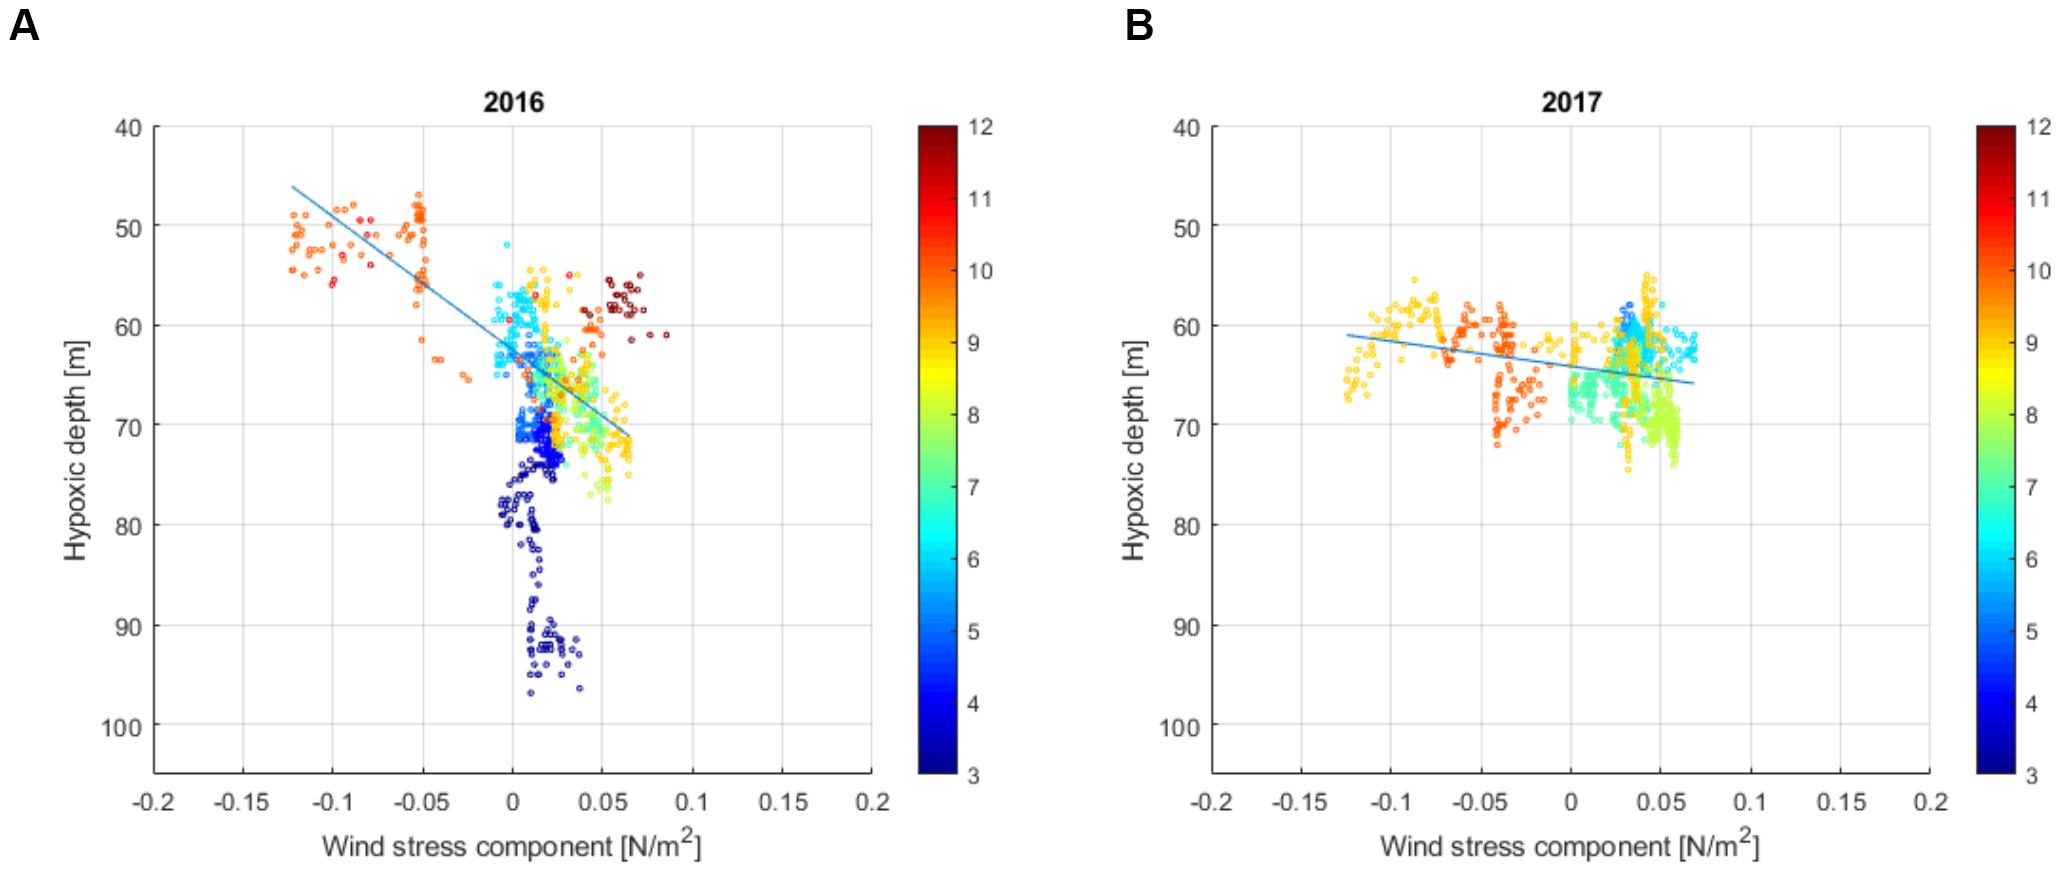
Figure 5. The relationship between the depth of hypoxia and the 3-week average wind stress component from N-NE (20π) at the Keri station in 2016 [(A); R2 = 0.60, p < 0.05] and 2017 [(B); R2 = 0.08, p < 0.05]. Wind data from Kalbådagrund are used (see Figure 1 for location). The color bar shows the time of measurements (in months).
Almost identical seasonal course in the development of the hypoxic area was observed in both summers when the area affected by hypoxia decreased from the early summer until August and started to grow again in September–October (Figure 6). When comparing the hypoxic extent monthly results obtained using different hypoxia thresholds (DO < = 2.9 mg⋅l-1 and DO < = 2.0 mg⋅l-1), the dynamics are the same and the averages differ only slightly. In 2016, the May to October mean hypoxic area was 2.2% bigger with the hypoxic threshold DO < = 2.9 mg⋅l-1 compared to the area found using the threshold DO < = 2.0 mg⋅l-1, while in 2017, the area was 1.6% bigger.
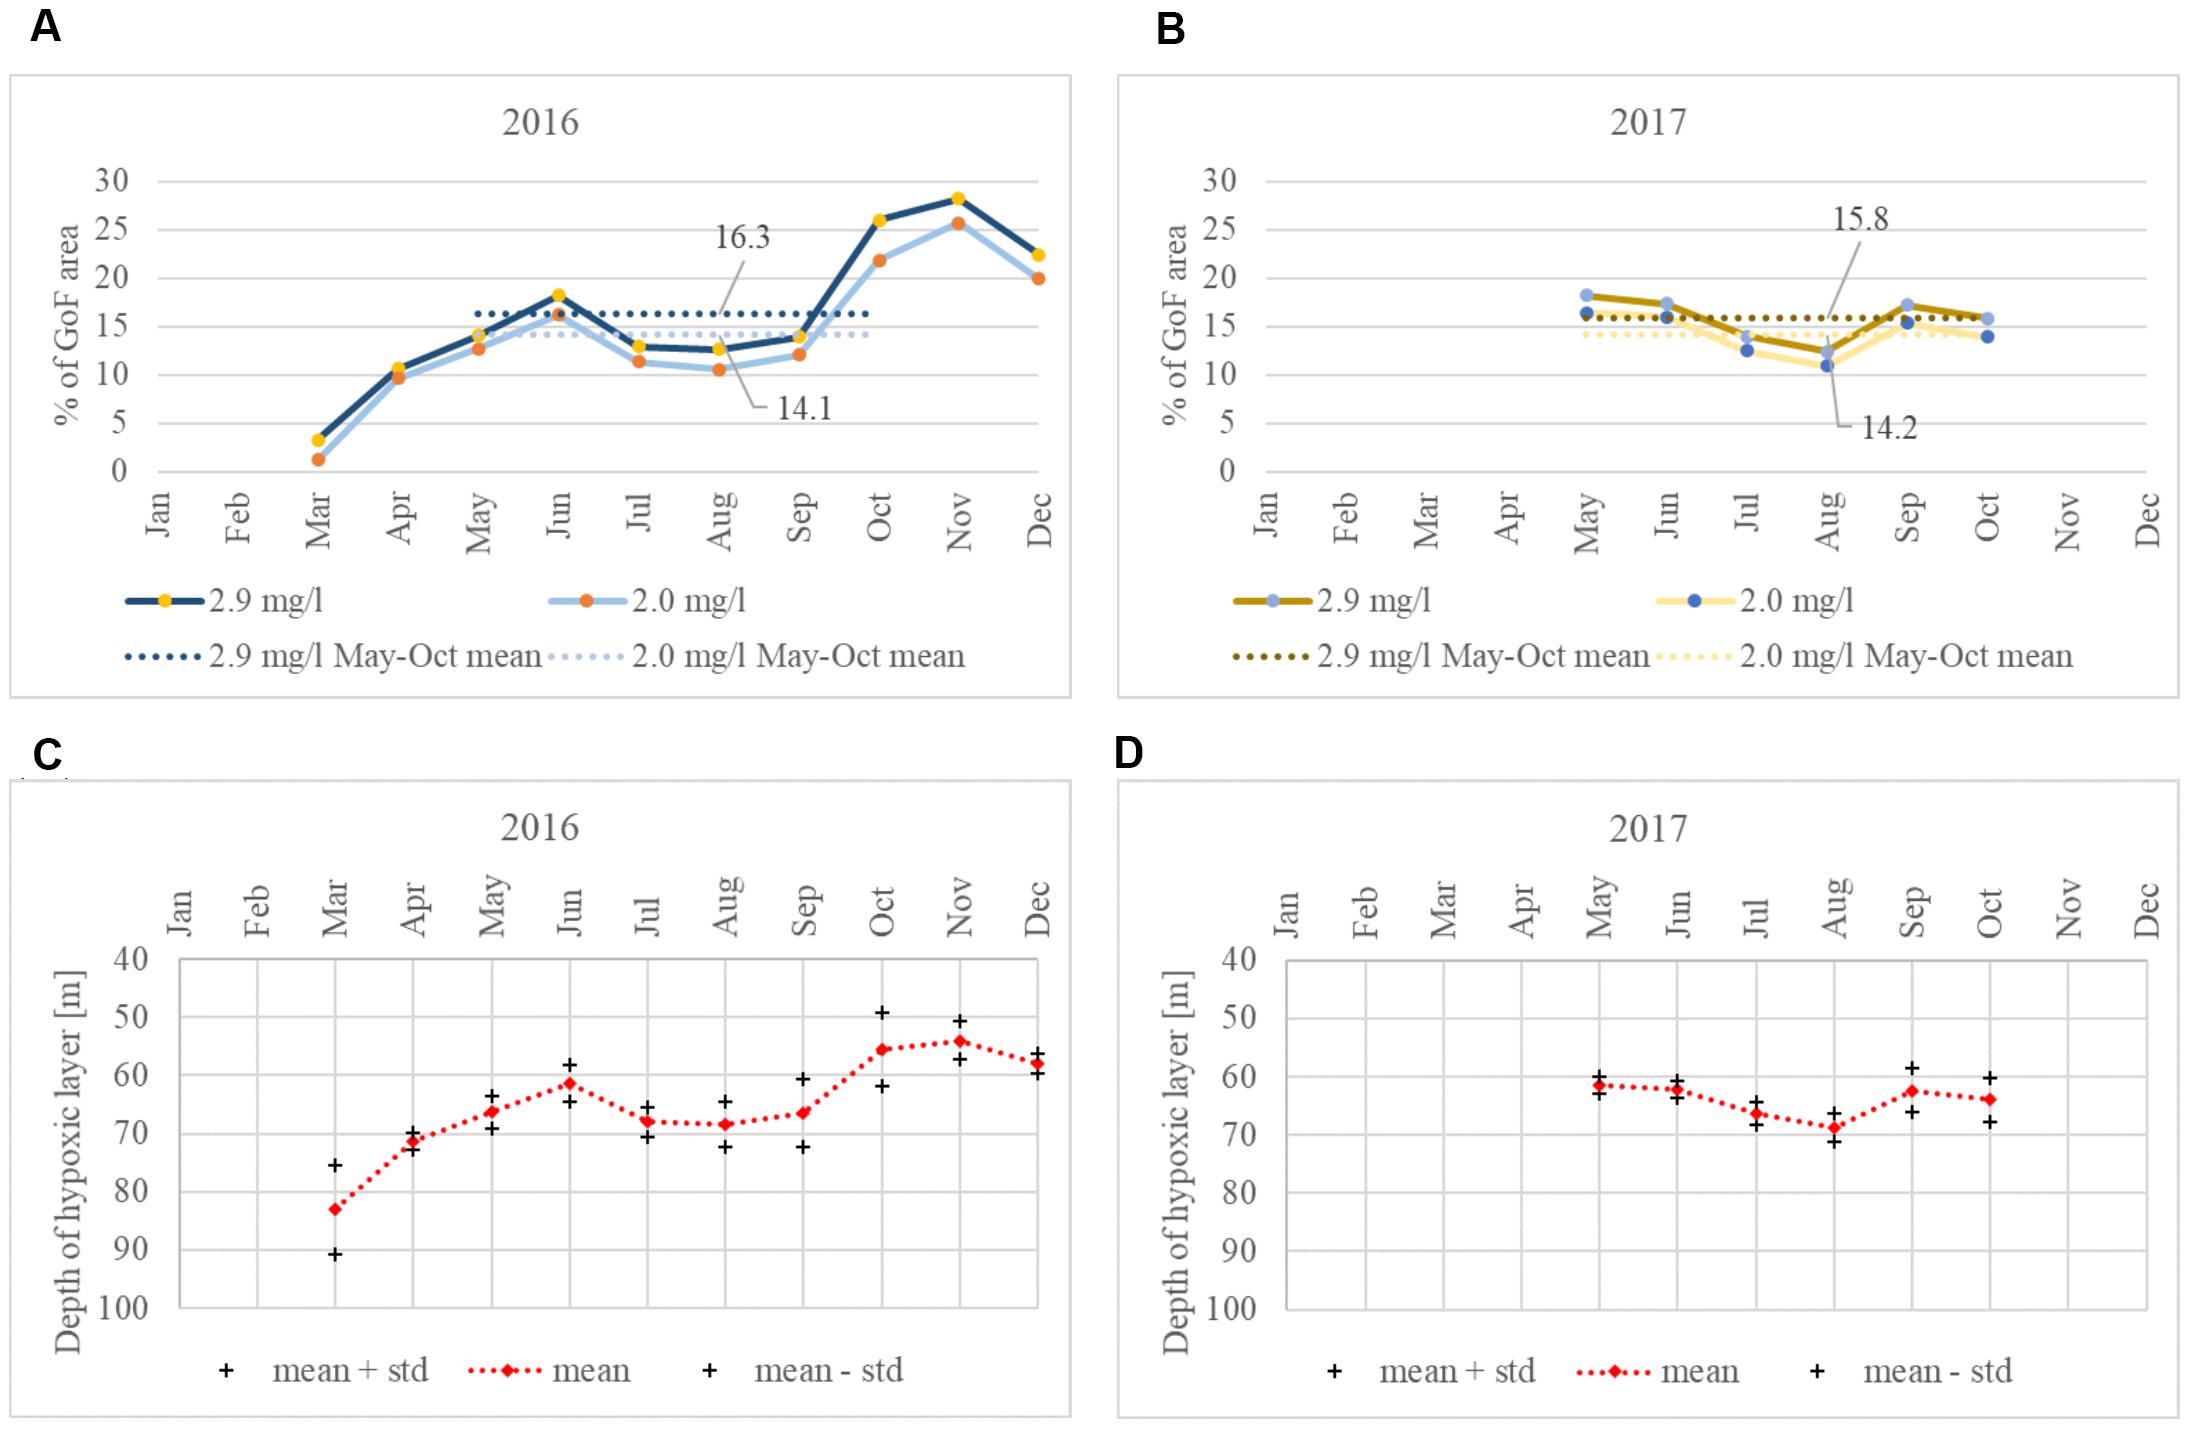
Figure 6. Monthly mean extent of the hypoxic area in the GoF [(A): DO < = 2.9 mg⋅l-1 and DO < = 2.0 mg⋅l-1 in 2016, (B): 2017]. Monthly mean hypoxic (DO < = 2.9 mg⋅l-1) depth values in 2016 (C) and 2017 (D).
Oxygen Debt
Oxygen debt values just below the halocline were calculated for every vertical profile of DO (Figure 7). Halocline, defined using the vertical salinity gradient criterion of 0.07 g⋅kg-1⋅m-1, was detected for all profiles in both years. The mean depth of the point below the halocline, for which the oxygen debt was estimated, was 74.2 m in 2016 and 74.5 m in 2017. If for 2016 the period from May to October was considered (when the data were available in 2017), then the mean depth of this point was 72.4 m. The temporal variability (May to October) could be characterized as the maximum and minimum values of 96.0 and 54.5 m in 2016 and 97.0 and 60.5 m in 2017, respectively, and the 5th and 95th percentiles of 62.0 and 81.5 m for 2016 and 67.0 and 83.6 m for 2017.
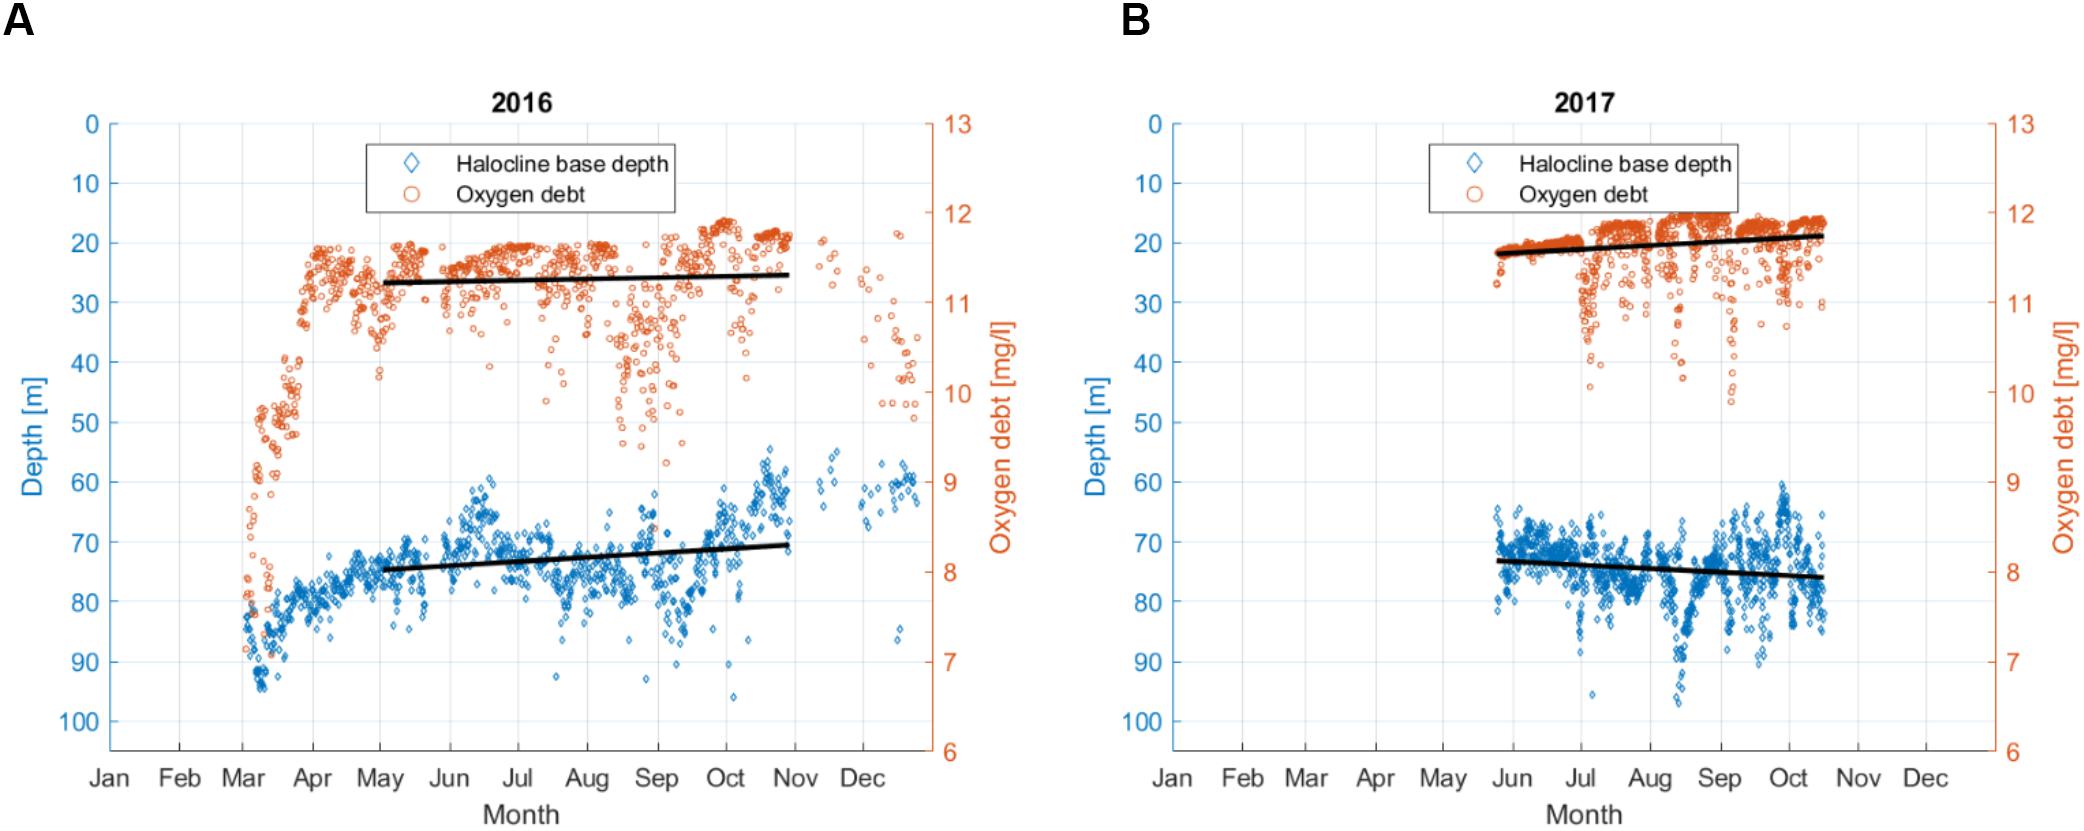
Figure 7. Oxygen debt just below the halocline and the depth of the halocline base at the Keri station in the GoF based on all available data in 2016 (A) and 2017 (B). Linear approximations of both parameters for the period from May to October are shown as the black lines, but the trends were not significant.
For the period from May to October (when data were available for both years), the mean oxygen debt was 11.3 mg⋅l-1 in 2016 and 11.6 mg⋅l-1 in 2017. The minimum, maximum, 5th and 95th percentile values of oxygen debt were 8.5 mg⋅l-1, 11.9 mg⋅l-1, 10.2 mg⋅l-1, and 11.8 mg⋅l-1 in 2016 and 9.9 mg⋅l-1, 12 mg⋅l-1, 11 mg⋅l-1, and 12 mg⋅l-1 in 2017. If also early spring period for 2016 was taken into account, then the minimum oxygen debt was estimated as 7.1 mg⋅l-1.
In both years, we found no linear trend for the halocline base depth from May to October, and the oxygen debt showed no clear seasonal dynamics. However, there was a significant correlation between the halocline base depth and oxygen debt values in 2017 (R2 = 0.23, p < 0.05).
If monthly mean values are considered, the halocline base depth and oxygen debt showed similar dynamics in both years. Considering the period from May to October, the mean halocline base depth ranged from 66.0 to 75.1 m in 2016 and from 72.2 to 77.2 m in 2017. A smaller variation in monthly mean oxygen debt values in 2017 is also evident, with the values ranging from 11.5 to 11.8 mg⋅l-1, compared to 2016 where the monthly oxygen debt values were between 10.9 and 11.5 mg⋅l-1 (Figure 8).
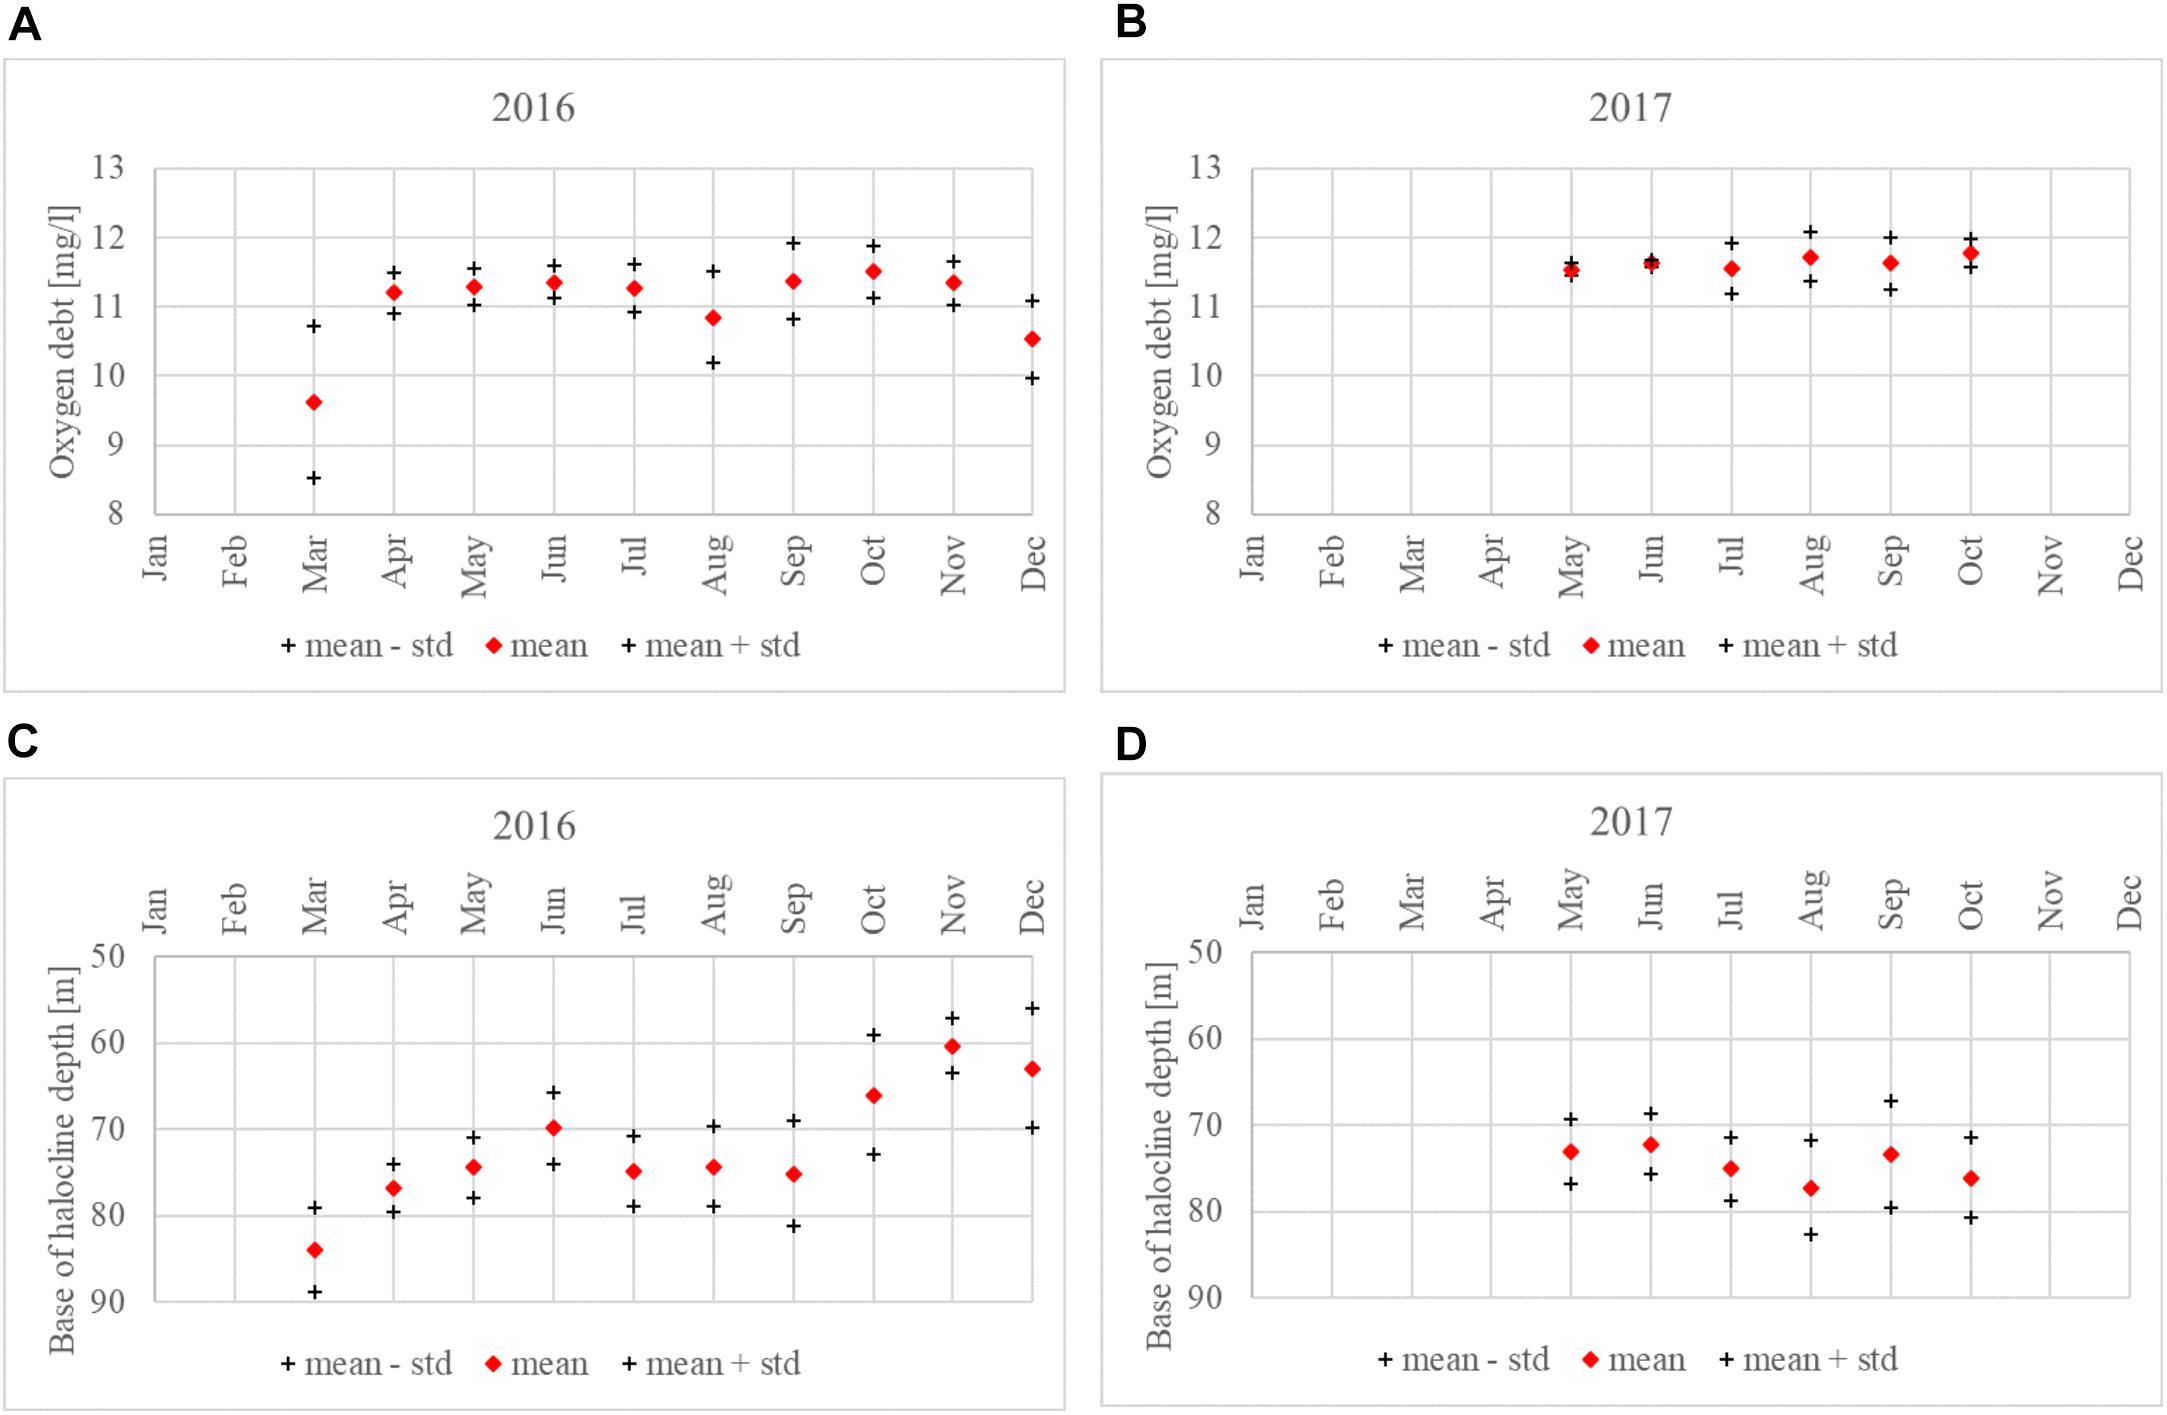
Figure 8. Monthly average oxygen debt just below the halocline (± standard deviation); (A) 2016, (B) 2017. The halocline base depth at Keri station in 2016 (C) and 2017 (D).
Oxygen Consumption
Oxygen consumption was calculated for the period from May to September for the stagnant layer which was defined based on the monthly average profiles of absolute salinity (SA) and conservative temperature (CT) (Figure 9). In both years, it was defined as the layer between 50 and 60 m, and the extended layer for the analysis (needed for the calculation of diffusion) was defined by adding data from additional 3 m to both sides of the stagnant layer; so, a depth range of 47–63 m was used. To estimate the sensitivity of the results to the choice of the stagnant layer, the estimates for diffusion, advection and consumption were also found for the layer 45–55 m.
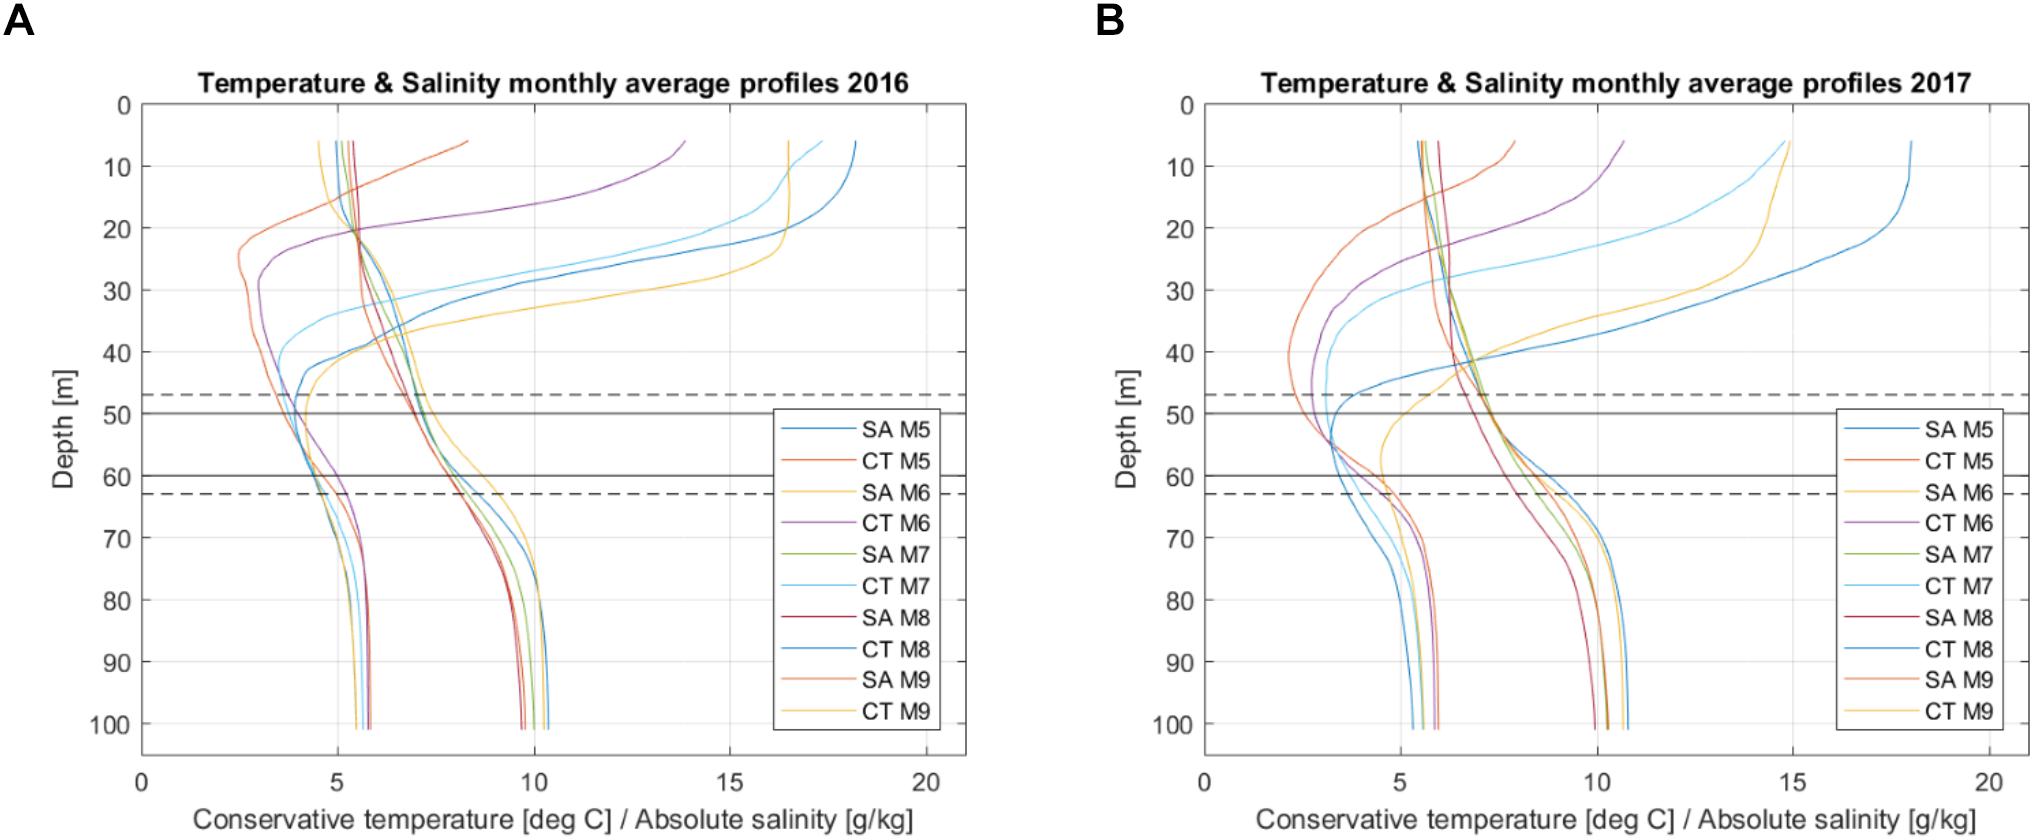
Figure 9. Monthly average profiles of temperature (CT) and salinity (SA) for the period from May to September in 2016 (A) and 2017 (B). Horizontal solid lines mark the depth interval of the stagnant layer. The dashed lines mark the depth interval of the extended layer used for the vertical diffusion estimates at the borders.
Changes in the oxygen concentration due to advection were calculated based on estimated salinity advection and the correlation between salinity and oxygen. In both years, vertical profiles in the depth range of 30–70 m acquired in April at the national monitoring stations distributed along the GoF (see Figure 1) were used for the correlation analysis. The found relationships were statistically significant – in 2016, DO = -3.39∗SA + 34.54, R2 = 0.84, p < 0.05 and, in 2017, DO = -3.57∗SA + 36.43, R2 = 0.73, p < 0.05.
Positive monthly average oxygen depletion values show that during the period in question, oxygen content in the stagnant layer decreased (Figure 10). Negative diffusion values indicate that more oxygen left the layer through the deeper boundary than was brought in through the upper boundary of the layer. Positive advection values show that more oxygenated water was brought into the study area (area of the profiling station).
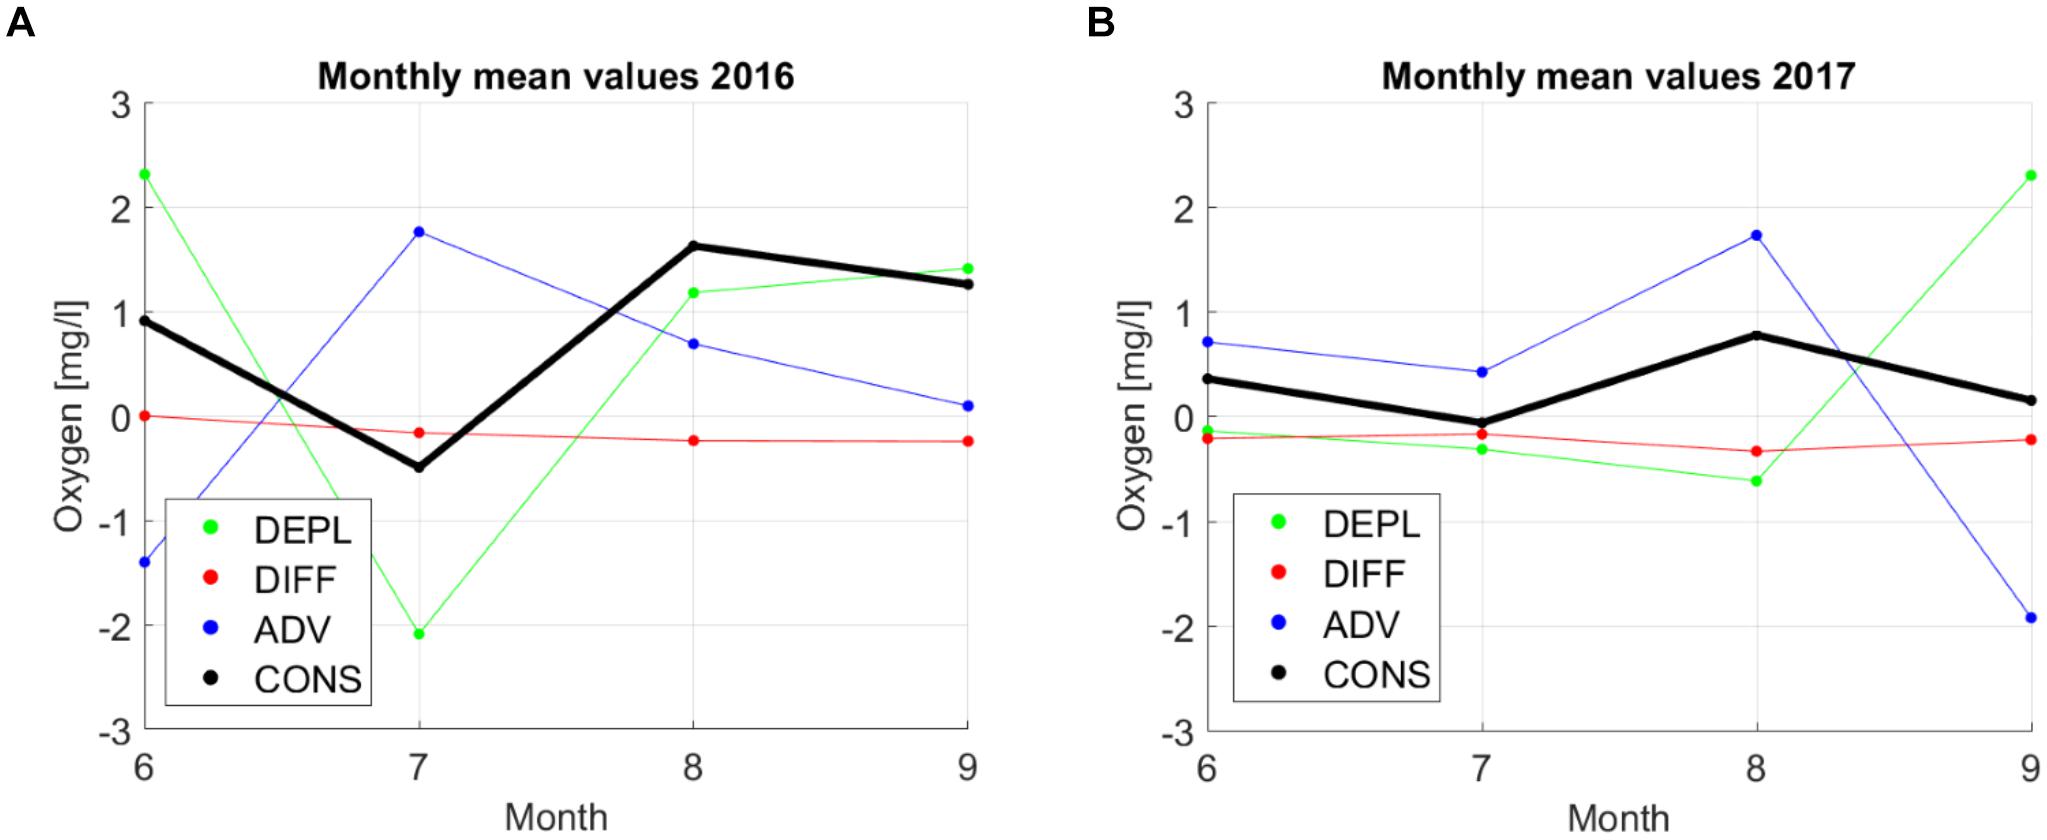
Figure 10. Monthly average values of depletion (DEPL), diffusion (DIFF), advection (ADV), and consumption (CONS) in 2016 (A) and 2017 (B).
The results show that the changes in oxygen on the monthly scale were mostly related to advection since the depletion and advection had the largest values and were moving in opposite directions (Figure 10; remember that a positive value of depletion means that oxygen is decreasing). Monthly depletion values were in the range of ±2.0 mg⋅l-1⋅month-1 while advection values ranged from -1.9 mg⋅l-1⋅month-1 to 1.7 mg⋅l-1⋅month-1. On a monthly scale, the diffusion had the lowest contribution with the values varying in the range from 0 to -0.4 mg⋅l-1⋅month-1. The resulting monthly average consumption estimates were in the range of -0.5 and 1.6 mg⋅l-1⋅month-1 with the lowest values in June–July and the maximum in July–August. This pattern was evident in both years. Note that the consumption values should be positive since no oxygen production should exist in the analyzed stagnant layer. However, the applied method gave small negative values of consumption for June–July in both years.
The total seasonal consumption from May to September as well as monthly average consumption rates were almost three times larger in 2016 than in 2017 – 0.82 and 0.31 mg⋅l-1⋅month-1, respectively (Table 3). It is interesting that the consumption rate estimates did not change much if, instead of the layer 50–60 m, the layer 45–55 m was analyzed although depletion was higher in the layer 45–55 m in both years. According to our estimates, consumption gave the highest contribution to the seasonal oxygen depletion. For the layer 50–60 m in 2017 and 45–55 m in 2016, diffusion and advection almost entirely compensated each other. Diffusion values did not vary between the 2 years much while advection was considerably higher in 2016 than in 2017, especially for the layer 45–55 m. This result is in agreement with the observed concurrent decrease of salinity in these depth ranges (see Figure 3; the decrease was larger in 2016 than in 2017) since the oxygen advection was estimated based on salinity advection and linear correlation between oxygen and salinity. Still, the much larger consumption in 2016 than in 2017 has to be analyzed further.

Table 3. Average values of depletion (DEPL), diffusion (DIFF), advection (ADV), and consumption (CONS).
We also analyzed the sensitivity of the consumption estimates to the following assumptions: neglecting the changes in oxygen content due to changes in solubility; constant empirical intensity factor for turbulent flux estimates; linear regression between oxygen and salinity used to estimate oxygen advection.
We calculated monthly average temperature and salinity in the analyzed layer 50–60 m and found that due to their changes ranging, respectively, from 3.27 to 4.66°C and from 7.25 to 8.01 g⋅kg-1, the oxygen saturation concentration varied between 11.61 and 12.06 mg⋅l-1. Since the monthly average oxygen concentration in this layer ranged between 5.70 and 8.74 mg⋅l-1, the changes in solubility could cause less than about 15% of the observed variability.
For diffusion estimates, we used the value of the empirical intensity factor of α = 1.5 × 10⁻⁷ m2⋅s-2. It is an average value based on earlier studies, where the values ranging from α = 0.5 × 10⁻⁷ m2⋅s-2 to α = 2.5 × 10⁻⁷ m2⋅s-2 have been applied (Gargett, 1984; Stigebrandt, 1987; Axell, 1998; Meier, 2001). Using these minimum and maximum values of the factor we found that for the 2016 data, the consumption estimates varied only from 0.80 to 0.85 mg⋅l-1⋅month-1 while for the 2017 data, the ranges were larger – from 0.25 to 0.36 mg⋅l-1⋅month-1. Although for the latter case, the difference between the minimum and the maximum was about 30% of the estimate, the choice of the factor changed the result only by 0.1 mg⋅l-1⋅month-1.
For the advection estimates we used the linear correlation between salinity and oxygen based on data from the monitoring stations in the GoF from the Osmussaar Island to the eastern GoF (station F1; see Figure 1) This assumption of the linear relationship between salinity and oxygen content is valid only in a limited area (see the correlation estimates above) but not for the entire Baltic Sea; thus, also in the GoF, along-isohaline gradients exist. For instance, based on the data from the monitoring cruises in May/June, July, August and October of both years, the average change in oxygen concentration in the GoF along an isohaline corresponding to the average salinity in the layer 50–60 m was 0.9 mg⋅l-1 per a longitudinal degree. In the case of oscillating up- and down-estuary flow in the studied layer, the oxygen advection estimates are not biased, but a relatively large bias could occur if unidirectional flow prevails for a long period. Taking the estimated horizontal oxygen gradient and assuming a constant flow of 2 cm⋅s-1 for a month could result in a change of oxygen content by 0.83 mg⋅l-1⋅month-1.
Discussion
We analyzed high-resolution time series of vertical profiles of oxygen at a central, deep station in the GoF close to the Keri Island in 2016–2017. The main study question was whether these observations could be applied to assess the status of this stratified estuary in relation to the eutrophication effects using three suggested indicators. The present monitoring programs contain observations of DO content at a few stations a few times a year (in Estonia, 6 times a year, and only the surface and near-bottom layer are sampled). Beside the eutrophication effects, the sub-surface distribution and variability of DO in the GoF are related to multi-scale physical processes. Thus, the differentiation between the natural variability and the effects of eutrophication could require high-resolution monitoring data. Since due to economic reasons it is not possible to arrange measurements with high temporal resolution at many stations, we analyzed the applicability of data from one profiling station to assess the oxygen conditions using the following indicators – the extent of hypoxia, oxygen debt, and oxygen consumption.
Although large-scale surveys of the vertical oxygen distribution revealed an along-gulf inclination of the border of the hypoxic layer of 1.9 m per 100 km, the estimates of the extent of hypoxia based on the hypoxic depth from Keri station with and without inclination were very close to each other. In addition, it was shown by Liblik and Lips (2017) that there exists almost no average cross-gulf inclination of the halocline in the GoF. Thus, we conclude that the Keri station is a representative station to assess the sub-halocline oxygen conditions in the entire GoF on seasonal timescales.
Since wind conditions play a major role defining the areal extent of the near-bottom hypoxia in the GoF, the effect of the prevailing wind has to be taken into account when using the hypoxic area extent as a eutrophication indicator. It is known that with prevailing south-westerly winds the estuarine circulation is reversed which moves the surface layer into the gulf and the deep layer out of the gulf (Elken et al., 2003). North-easterly winds have the opposite effect and the deep water – deoxygenated and phosphate-rich salt wedge moves into the gulf from the Northern Baltic Proper (Liblik and Lips, 2011; Lips et al., 2017).
When comparing the monthly average hypoxic area extent with the local wind conditions using wind data from Kalbådagrund we found that for 2016, when the N-NE winds prevailed, the hypoxic area was enlarged, while with the W-SW winds, the area was smaller (Table 2). This result is in accordance with a recent analysis of long-term monitoring data by Lehtoranta et al. (2017) and a study by Väli et al. (2013) where the authors concluded that the increase in bottom oxygen concentrations in the GoF in 1990–1995 could be explained by stronger ventilation of the bottom layers due to increased westerlies. Also, a comparison of the 3-week average wind stress component from N-NE (20π) with the hypoxic depth at the Keri station (Figure 5) showed significant correlation between these parameters if early spring data from 2016 were excluded. The very deep hypoxic depth in March 2016 could be explained by weaker stratification and mixing of the water column (and a possible collapse of stratification) as it was observed earlier in winter by Liblik et al. (2013) and Lips et al. (2017). In 2017, the winds from the sector from east to north were almost absent, and thus, the intensification of estuarine circulation leading to the penetration of the near-bottom salt wedge into the GoF did not manifest itself in the same extent as in 2016. Secondly, we suggest that the high variability and large extent of hypoxia in late 2016 could be attributed to the influence of the 2014 MBI, which impact reached the GoF in 2016 (Liblik et al., 2018). The MBI influence constituted itself as a deep-water inflow of former deoxygenated water from the NBP to the GoF, which pushed the existing bottom water in the GoF upward resulting in an increase in volume and areal extent of hypoxic waters.
In conclusion, although the extent of hypoxia is an easily understandable indicator of near-bottom oxygen conditions in the GoF, still some issues have to be solved. An analysis of long-term data should be conducted to differentiate between the eutrophication-related and the wind- or inflow-related impacts (a first attempt is made by Lehtoranta et al., 2017). Also, the reference and target values – what percentage corresponds to the good status, have to be defined. For this purpose, the links of the extent of hypoxia with the nutrient load, nutrient concentrations and productivity have to be shown. Also, it is important to consider the feedback that the extent of hypoxia has on nutrient concentrations via the internal nutrient fluxes from the sediments in poor oxygen conditions (Pitkänen et al., 2001).
Oxygen debt indicator is the other easily understandable characteristic of oxygen conditions which could be understood as the apparent oxygen utilization – the difference between the oxygen saturation concentration and measured concentration. As seen in Figure 7, the oxygen debt estimates based on a single profile had very high short-term variability. It could be mostly explained by the observed halocline dynamics in the GoF displayed in Figure 3 and shown by Liblik and Lips (2017). Internal waves cause up- and downward movement of the halocline and influence the depth range with the vertical salinity gradient larger than 0.07 g⋅kg-1⋅m-1 within the halocline layer. Consequently, the estimates of the oxygen debt based on separate profiles could reveal a relatively high variability, but an average of these estimates over a large number of profiles characterizes the sub-halocline oxygen conditions quite well.
Since we did not have the time-series of oxygen profiles covering the winter months, we were not able to calculate the yearly average oxygen debt as required by the HELCOM oxygen debt indicator description (HELCOM, 2018a). However, we suggest that for the GoF, where the halocline could be weak or occasionally absent in winter (Liblik et al., 2013; Lips et al., 2017), the oxygen debt could be estimated on the basis of seasonal data from May to September (or October). It also means that a new threshold for good environmental status should be suggested since the value 8.66 mg⋅l-1, which is applied for most of the deep basins in the Baltic Sea, was defined as a volume specific average and for the yearly average (HELCOM, 2018a). We also suggest that the uniform threshold value for the volume specific average oxygen depth should be reconsidered since the basins have different depths while the DO content decreases with the depth. Instead, the oxygen debt just below the halocline could be used which might have similar threshold values for most of the Baltic Sea deep basins.
An advantage of the oxygen debt indicator compared to the extent of hypoxia is that it seems to be less dependent on the advection of the hypoxic salt wedge into and out from the inner GoF since an increase/decrease in the volume of hypoxic waters due to the horizontal advection results in upward/downward movement of the halocline and not in a decrease in DO content just below the halocline. For instance, from September to October 2016, the extent of hypoxia almost doubled while the oxygen debt increased only from 11.4 mg⋅l-1 in September to 11.5 mg⋅l-1 in October.
Oxygen consumption results found in this study as averages for the whole period from spring to autumn (June–September) are in the range of other published results (Table 4). While in the earlier estimates, the monthly consumption rates varied between 0.25 and 1.29 mg l-1 month-1, in the present study, the estimates in the Gulf of Finland were 0.82 mg l-1 month-1 for 2016 and 0.31 mg l-1 month-1 for 2017. This comparison is not entirely correct since the earlier estimates were mostly for longer (multi-year) periods and our study dealt only with the productive season, as well as we made our analysis for the intermediate layer (50–60 m) while in the earlier studies deeper (sub-halocline) layers were considered. However, this agreement between different results confirms that the method proposed in our study is applicable to rough consumption estimates. The other question is whether it is accurate enough to be used for eutrophication status assessment. For instance, the negative values of monthly consumption estimates in July of both years indicate that the approach may not be appropriate for shorter periods.
We analyzed the sensitivity of the results regarding different choices and assumptions in the suggested method of consumption estimates. We showed that a slight change of the depth limits for the analyzed stagnant layer would almost not alter the results. The changes in solubility, which were not included in the suggested approach, could cause a bias less than about 15% of the observed variability (see section “Oxygen Consumption”). The choice of the empirical intensity factor of turbulence could change the diffusion estimate and consequently the consumption estimate only by 0.1 mg⋅l-1⋅month-1.
For the advection estimates, we used the linear correlation between salinity and oxygen, which is significant based on the data from the GoF. At the same time, we showed that the average change in oxygen concentration in the GoF along an isohaline in the layer under consideration could be as large as 0.9 mg⋅l-1 per a longitudinal degree. Thus, a relatively large bias in the consumption estimates up to 0.83 mg⋅l-1⋅month-1 could occur if unidirectional flow prevails for a long period. Such on average unidirectional flow in the intermediate layer could exist in the GoF for a few months as shown by Lilover et al. (2017) although the characteristic current velocities there are usually smaller than in the surface and near-bottom layer (Suhhova et al., 2018). This bias estimate has the value close to the consumption estimates, and thus, it has to be addressed in the further analysis. For instance, in 2016, the saline and oxygen-deficient sub-halocline waters of the northern Baltic Proper were pushed by the MBI north-eastward to the GoF near-bottom layer (Liblik et al., 2018). It could cause uplift of old near-bottom water in the central and eastern GoF and the westward flow in the intermediate layer which could lead to an oxygen decrease. The observed decrease in oxygen content from July to September 2016 by 2.59 mg⋅l-1 was mostly assigned to consumption since the average salinity increase was only 0.18 g⋅kg-1 and the corresponding oxygen decrease due to advection should not be as large according to the present calculation method based on a linear regression between salinity and oxygen content. This method, which has a bias in advection estimates when the flow is on average unidirectional in the analyzed layer, could also cause the large difference between the seasonal consumption estimates in 2016 and 2017. As a way forward, simultaneous observations of vertical structure of currents near the Keri station has been initiated in 2018.
The assumption of an equal surface area of the upper and lower border of the analyzed layer and no explicit water-sediment oxygen fluxes means that the downward oxygen flux through the lower boundary is entirely estimated as a turbulent flux in the water column. This approach is correct for an open sea area; however, one could expect that the oxygen flux from water to the sediments at the slopes of the basin (Holtermann et al., 2017) and a horizontal mixing toward the basin interior impact the consumption estimate results. As shown by Koop et al. (1990) the oxygen flux from the water to the sediments under oxic conditions could be as large as 777 μmol⋅O⋅m-2 h-1 corresponding to approximately 1.8 mg⋅l-1⋅month-1 if a 10 m thick water layer above the seabed is considered. The maximum oxygen flux through the lower border of the analyzed layer found in the present study could cause a decrease in DO content of 0.7 mg⋅l-1⋅month-1. Thus, an additional export of oxygen from the stagnant layer due to the flux from water to the sediments and horizontal mixing should increase the consumption estimates. When interpreting our results, one has to consider that the consumption values include both the local consumption in the studied open-sea area and a part of consumption in the sediments at the surrounding slopes of the basin. This additional export of oxygen from the stagnant layer should increase the consumption estimates. Thus, it does not explain the negative values found in our study for June–July 2016 and 2017 which most probably are related to the bias in advection estimates.
A comparison of the three indicators reveals that their average seasonal values almost did not vary between the two analyzed years for the hypoxic area extent and oxygen debt while about 2.7 times higher oxygen consumption was found in 2016 than in 2017. The average hypoxic depth in May–October was 64.5 m in 2016 and 64.6 m in 2017, which result in an almost equal hypoxic area extent for both years. The average oxygen debt in May–October was 11.3 mg⋅l-1 in 2016 and 11.6 mg⋅l-1 in 2017. These values differ only by 0.3 mg⋅l-1, which is <3% of the indicator result. We suggest that the found large difference in oxygen consumption estimates between 2016 and 2017, which is inconsistent with the other indicator results, could be related to the applied methodology and/or the fact that the consumption estimates were found for the intermediate layer while hypoxic area and oxygen debt for the sub-halocline layer. What could be the main natural factors causing this large difference, e.g., influence of productivity or riverine water, since in 2016 the upper layer was fresher than in 2017, needs future studies. The largest uncertainty is caused by the too simplified estimate of the oxygen advection. Although oxygen consumption would be the best indicator, which should directly be dependent on the productivity of the sea area, it requires further development. Regarding the observational program, simultaneous measurements of current profiles could be beneficial to decrease the uncertainty of advection estimates.
Conclusion
We have described the oxygen conditions in the GoF in 2016–2017 based on observations mostly at the Keri profiling station where vertical profiles of temperature, salinity and oxygen were acquired up to 8 times a day. The applicability of high-frequency data from this fixed automated station and the three adapted oxygen indicators for the eutrophication status assessments were tested. The main results of the analysis are:
• the GoF bottom area affected by hypoxia varied between 3.3 and 28.2% with a minimum in March 2016, maximum in November 2016 and an average extent of about 15% in May-September 2016–2017;
• since the halocline in the GoF could be destroyed in winter, the “oxygen debt” indicator should be based on data from the stratified season only, and we suggest that only oxygen debt just below the halocline should be used;
• the formulated oxygen budget, where depletion, diffusion, advection and consumption are taken into account, gave an average seasonal oxygen consumption in the 50–60 m water layer of the GoF in 2016 and 2017 as high as 0.82 and 0.31 mg⋅l-1⋅month-1, respectively;
• this large difference in consumption values between 2016 and 2017 could partly be related to the uncertainties of advection estimates.
We concluded that all three tested indicators have methodological challenges to be solved if they are used for the eutrophication effects assessment. The main issue is related to the differentiation between natural changes and eutrophication-related impacts. To increase the confidence of eutrophication assessments both high-frequency profiling should be implemented in the monitoring programs and more accurate estimates of changes due to physical processes are required.
Data Availability Statement
Part of the data (temperature, salinity) can be found on EMODnet Physics http://www.emodnet-physics.eu/Map/DefaultMap.aspx when searching for “KeriCable” station. Oxygen datasets are available on request.
Author Contributions
S-TS was the main responsible person in developing methods, analyzing data, and writing the manuscript. UL contributed to developing methods and writing the manuscript. TL contributed to analyzing data regarding the influence of hydrography.
Funding
The work was financially supported by the Institutional Research Funding IUT (IUT19-6) of the Estonian Ministry of Education and Research and Environmental Investment Center environmental program project KIK17144.
Conflict of Interest Statement
The authors declare that the research was conducted in the absence of any commercial or financial relationships that could be construed as a potential conflict of interest.
Acknowledgments
We would like to thank the Finnish Meteorological Centre, for providing wind data, the crew of r/v Salme and our colleagues.
References
Alenius, P., Myrberg, K., and Nekrasov, A. (1998). The physical oceanography of the Gulf of Finland: a review. Boreal Environ. Res. 3, 97–125.
Andrejev, O., Sokolov, A., Soomere, T., Värv, R., and Viikmäe, B. (2010). The use of high-resolution bathymetry for circulation modelling in the Gulf of Finland. Est. J. Eng. 16, 187–210. doi: 10.3176/eng.2010.3.01
Andrejev, O., Soomere, T., Sokolov, A., and Myrberg, K. (2011). The role of spatial resolution of a three-dimensional hydrodynamic model for marine transport risk assessment. Oceanologia 53, 309–334. doi: 10.5697/oc.53-1-TI.309
Axell, L. B. (1998). On the variability of Baltic Sea deepwater mixing. J. Geophys. Res. 103, 21667–21682. doi: 10.1029/98JC01714
Conley, D. J., Björck, S., Bonsdorff, E., Carstensen, J., Destouni, G., Gustafsson, B. G., et al. (2009). Hypoxia-related processes in the Baltic Sea. Environ. Sci. Technol. 43, 3412–3420. doi: 10.1021/es802762a
Conley, D. J., Humborg, C., Rahm, L., Savchuk, O. P., and Wulff, F. (2002). Hypoxia in the Baltic Sea and basin-scale changes in phosphorus biogeochemistry. Envrion. Sci. Technol. 36, 5315–5320. doi: 10.1021/es025763w
Diaz, R. J., and Rosenberg, R. (2008). Spreading dead zones and consequences for marine ecosystems. Science 321, 926–929. doi: 10.1126/science.1156401
Directive 2008/56/EC of the European Parliament and of the Council (2008). Establishing a Framework for Community Action in the Field of Marine Environmental Policy (Marine Strategy Framework Directive). Available at: http://eur-lex.europa.eu/legal-content/EN/TXT/PDF/?uri=CELEX:32008L0056&from=EN
Elken, J., Raudsepp, U., and Lips, U. (2003). On the estuarine transport reversal in deep layers of the Gulf of Finland. J. Sea Res. 49, 267–274. doi: 10.1016/S1385-1101(03)00018-2
Gargett, A. E. (1984). Vertical eddy diffusivity in the ocean interior. J. Mar. Res. 42, 359–393. doi: 10.1357/002224084788502756
Gerlach, S. A. (1994). Oxygen conditions improve when the salinity in the Baltic Sea decreases. Mar. Pollut. Bull. 28, 413–416. doi: 10.1016/0025-326X(94)90126-0
Gustafsson, B. G., Schenk, F., Blenckner, T., Eilola, K., Meier, H. E. M., Müller-Karulis, B., et al. (2012). Reconstructing the development of Baltic Sea eutrophication 1850–2006. Ambio 41, 534–548. doi: 10.1007/s13280-012-0318-x
Hansson, M., Andersson, L., and Axe, P. (2011). REPORT OCEANOGRAPHY No. 42. Areal Extent and Volume of Anoxia and Hypoxia in the Baltic Sea, 1960-2011. Available at: http://www.smhi.se/polopoly_fs/1.19219!Oxygen_timeseries_1960_2010_20111219.pdf
Hansson, M., Viktorsson, L., and Andersson, L. (2017). REPORT OCEANOGRAPHY No. 63. Oxygen Survey in the Baltic Sea 2016 - Extent of Anoxia and Hypoxia, 1960-2017. Available at: https://www.smhi.se/polopoly_fs/1.132189!/Oxygen_timeseries_1960_2017.pdf
HELCOM (2013). Approaches and Methods for Eutrophication Target Setting in the Baltic Sea Region. Helsinki: HELCOM.
HELCOM (2014). Eutrophication Status of the Baltic Sea 2007-2011. A Concise Thematic Assessment. Helsinki: HELCOM.
HELCOM (2015a). EUTRO-OPER 4-2015. Development of Oxygen Consumption Indicator. Available at: https://portal.helcom.fi/meetings/EUTRO-OPER%204-2015-217/default.aspx
HELCOM (2015b). Final Report of the Project, Making HELCOM Eutrophication Assessments Operational (HELCOM EUTRO-OPER). Available at: http://www.helcom.fi/Documents/EUTRO-OPERprojectreport.pdf
HELCOM (2018a). Oxygen Debt - HELCOM Core Indicator Report. Available at: http://www.helcom.fi/baltic-sea-trends/indicators/oxygen-debt/
HELCOM (2018b). State of the Baltic Sea - Second HELCOM Holistic Assessment 2011-2016. Available at: http://www.helcom.fi/baltic-sea-trends/holistic-assessments/state-of-the-baltic-sea-2018/reports-and-materials/
Holtermann, P. L., Prien, R., Naumann, M., Mohrholz, V., and Umlauf, L. (2017). Deepwater dynamics and mixing processes during a majorinflow event in the central Baltic Sea. J. Geophys. Res. 122, 6648–6667. doi: 10.1002/2017JC013050
Kabel, K., Moros, M., Porsche, C., Neumann, T., Adolphi, F., Andersen, T. J., et al. (2012). Impact of climate change on the Baltic Sea ecosystem over the past 1,000 years. Nat. Clim. Chang. 2, 871–874. doi: 10.1038/nclimate1595
Koop, K., Boynton, W. R., Wulff, F., and Carman, R. (1990). Sediment-water oxygen and nutrient exchanges along a depth gradient in the Baltic Sea. Mar. Ecol. Prog. Ser. 63, 65–77. doi: 10.3354/meps063065
Laine, A. O., Andersin, A.-B., Leiniö, S., and Zuur, A. F. (2007). Stratification-induced hypoxia as a structuring factor of macrozoobenthos in the open Gulf of Finland (Baltic Sea). J. Sea Res. 57, 65–77. doi: 10.1016/j.seares.2006.08.003
Large, W. G., and Pond, S. (1981). Open ocean momentum flux measurements in moderate to strong winds. J. Phys. Oceanogr. 11, 324–336. doi: 10.1175/1520-0485(1981)011<0324:OOMFMI>2.0.CO;2
Launiainen, J., and Laurila, T. (1984). Wind characteristics at finnish automatic marine weather stations in the Northern Baltic Sea. Finn. Mar. Res. 250, 52–86.
Lehtoranta, J., Savchuk, O. P., Elken, J., Kim, D., Kuosa, H., Raateoja, M., et al. (2017). Atmospheric forcing controlling inter-annual nutrient dynamics in the open Gulf of Finland. J. Mar. Syst. 171, 4–20. doi: 10.1016/j.jmarsys.2017.02.001
Liblik, T., Laanemets, J., Raudsepp, U., Elken, J., and Suhhova, I. (2013). Estuarine circulation reversals and related rapid changes in winter near-bottom oxygen conditions in the Gulf of Finland, Baltic Sea. Ocean Sci. 9, 917–930. doi: 10.5194/os-9-917-2013
Liblik, T., and Lips, U. (2011). Characteristics and variability of the vertical thermohaline structure in the Gulf of Finland in summer. Boreal Environ. Res. 16A, 73–83.
Liblik, T., and Lips, U. (2017). Variability of pycnoclines in a three-layer, large estuary: the Gulf of Finland. Boreal Environ. Res. 22, 27–47.
Liblik, T., Naumann, M., Alenius, P., Hansson, M., Lips, U., Nausch, G., et al. (2018). Propagation of impact of the recent Major Baltic Inflows from the Eastern Gotland basin to the Gulf of Finland. Front. Mar. Sci. 5:222. doi: 10.3389/fmars.2018.00222
Lilover, M.-J., Elken, J., Suhhova, I., and Liblik, T. (2017). Observed flow variability along the thalweg, and on the coastal slopesof the Gulf of Finland, Baltic Sea. Estuar. Coast. Shelf Sci. 195, 23–33. doi: 10.1016/j.ecss.2016.11.002
Lips, U., Laanemets, J., Lips, I., Liblik, T., Suhhova, I., and Suursaar, Ü (2017). Wind-driven residual circulation and related oxygen and nutrient dynamics in the Gulf of Finland (Baltic Sea) in winter. Estuar. Coast. Shelf Sci. 195, 4–15. doi: 10.1016/j.ecss.2016.10.006
Matthäus, W., and Franck, H. (1992). Characteristics of major Baltic inflows—a statistical analysis. Cont. Shelf Res. 12, 1375–1400. doi: 10.1016/0278-4343(92)90060-W
Mattsson, J., and Stigebrandt, A. (1993). The vertical flux of organic matter in the Öresund estimated by two different methods using oxygen measurements. Estuar. Coast. Shelf Sci. 37, 329–342. doi: 10.1006/ecss.1993.1060
Meier, H. E. M. (2001). On the parameterization of mixing in three-dimensional Baltic Sea models. J. Geophys. Res. 106, 30997–31016. doi: 10.1029/2000JC000631
Naumann, M., Mohrholz, V., and Waniek, J. J. (2018). Water Exchange and Conditions in the Deep Basins. Available at: http://www.helcom.fi/baltic-sea-trends/environment-fact-sheets/
Pitkänen, H., Lehtoranta, J., and Räike, A. (2001). Internal nutrient fluxes counteract decreases in external load: the case of the estuarial eastern Gulf of Finland, Baltic Sea. Ambio 30, 195–201. doi: 10.1579/0044-7447-30.4.195
Rahm, L. (1987). Oxygen consumption in the Baltic Proper. Limnol. Oceanogr. 32, 978–978. doi: 10.4319/lo.1987.32.4.0973
Rydberg, L. (1978). Deep Water Flow and Oxygen Consumption within the Baltic. Report No. 27. Göteborg: Department of Physical Oceanography, Göteborg University.
Schinke, H., and Matthäus, W. (1998). On the causes of major Baltic inflows —an analysis of long time series. Cont. Shelf Res. 18, 67–97. doi: 10.1016/S0278-4343(97)00071-X
Schlitzer, R. (2018). Ocean Data View. Available at: https://odv.awi.de
Shaffer, G., and Rönner, U. (1984). Denitrification in the Baltic proper deep water. Deep Sea Res A 31, 197–220. doi: 10.1016/0198-0149(84)90102-X
Stigebrandt, A. (1987). A model for the vertical circulation of the Baltic deep water. J. Phys. Oceanogr. 17, 1772–1785. doi: 10.1007/s13280-017-0933-7
Stigebrandt, A., and Kalén, O. (2013). Improving oxygen conditions in the deeper parts of bornholm sea by pumped injection of winter water. Ambio 42, 587–595. doi: 10.1007/s13280-012-0356-4
Suhhova, I., Liblik, T., Lilover, M.-J., and Lips, U. (2018). A descriptive analysis of the linkage between the vertical stratification and current oscillations in the Gulf of Finland. Boreal Environ. Res. 23, 83–103.
Vahtera, E., Conley, D. J., Gustafsson, B. G., Kuosa, H., Pitkänen, H., Savchuk, O. P., et al. (2007). Internal ecosystem feedbacks enhance nitrogen-fixing cyanobacteria blooms and complicate management in the Baltic Sea. Ambio 36, 186–194. doi: 10.1579/0044-7447(2007)36[186:IEFENC]2.0.CO;2
Väli, G., Meier, H. E. M., and Elken, J. (2013). Simulated halocline variability in the baltic sea and its impact on hypoxia during 1961-2007. J. Geophys. Res. 118, 6982–7000. doi: 10.1002/2013JC009192
Vaquer-Sunyer, R., and Duarte, C. M. (2008). Thresholds of hypoxia for marine biodiversity. Proc. Natl. Acad. Sci. U.S.A. 105, 15452–15457. doi: 10.1073/pnas.0803833105
Keywords: eutrophication, assessment, hypoxia, Baltic Sea, Gulf of Finland, bottom waters, oxygen
Citation: Stoicescu S-T, Lips U and Liblik T (2019) Assessment of Eutrophication Status Based on Sub-Surface Oxygen Conditions in the Gulf of Finland (Baltic Sea). Front. Mar. Sci. 6:54. doi: 10.3389/fmars.2019.00054
Received: 01 October 2018; Accepted: 31 January 2019;
Published: 19 February 2019.
Edited by:
Jacob Carstensen, Aarhus University, DenmarkReviewed by:
Qian Zhang, University of Maryland Center for Environmental Science (UMCES), United StatesKari Juhani Eilola, Swedish Meteorological and Hydrological Institute, Sweden
Copyright © 2019 Stoicescu, Lips and Liblik. This is an open-access article distributed under the terms of the Creative Commons Attribution License (CC BY). The use, distribution or reproduction in other forums is permitted, provided the original author(s) and the copyright owner(s) are credited and that the original publication in this journal is cited, in accordance with accepted academic practice. No use, distribution or reproduction is permitted which does not comply with these terms.
*Correspondence: Stella-Theresa Stoicescu, U3RlbGxhLlN0b2ljZXNjdUB0YWx0ZWNoLmVl
 Stella-Theresa Stoicescu
 Urmas Lips
 Taavi Liblik