- 1Department of Integrative Biology, Oregon State University, Corvallis, OR, United States
- 2Department of Microbiology, Oregon State University, Corvallis, OR, United States
- 3Department of Statistics, Oregon State University, Corvallis, OR, United States
Many cnidarians form symbiotic relationships with brown dinoflagellate algae in the genus Symbiodinium. Bacteria are important to this symbiosis, with diverse functions such as providing nutrients to the symbiont and pathogen protection to the cnidarian. Disrupted bacterial communities are associated with thermally stressed cnidarians, which have a higher likelihood of expelling their symbionts, an event called bleaching. To better understand the association between thermal tolerance and bacterial community structure, we studied communities associated with an exceptionally thermal tolerant cnidarian, Anthopleura elegantissima. This intertidal symbiotic sea anemone is distributed from the subtropical waters of Baja California to subarctic Alaska, and experiences daily temperature fluctuations of up to 20°C. It is also flexible in its symbioses, predominantly hosting Symbiodinium, but occasionally hosting the green algae Elliptochloris marina or existing without symbionts in an aposymbiotic state. We used 16S rRNA gene amplicon sequencing to characterize the natural variation of microbial communities associated with Anthopleura elegantissima in these three symbiotic states and across a latitudinal gradient. In this study, we identified a core microbiome, made up predominantly of low-abundance taxa. We found that the communities associated with A. elegantissima were weakly linked to latitude. Diversity analyses revealed significantly higher species richness values for microbial communities associated with anemones hosting E. marina. Lastly the microbiome communities associated with different symbiotic states were compositionally distinct. Taken together, our results suggest that the structure of microbial communities associated with these temperate cnidarians is tightly linked to symbiotic state and weakly linked to other biogeographic phenomena.
Introduction
Many cnidaria in class Anthozoa, including corals and sea anemones, form mutualistic relationships with endosymbiotic brown dinoflagellate algae in the genus Symbiodinium. Bacterial symbionts facilitate this relationship, providing metabolic and protective functions such as supplying nitrogen to the brown dinoflagellate algae and inhibiting growth of pathogens on cnidarians (Rypien et al., 2010; Lema et al., 2012). The community of a cnidarian, its algal endosymbionts, and all associated microbiota is often modeled as an ecological unit called a holobiont (Rohwer et al., 2002). Destabilization or stress on one holobiont component can propagate through the community and cause the system to collapse. Thermal stress, for example, can diminish the protective functions of commensal and symbiotic bacteria of scleractinian corals, allowing opportunistic pathogenic bacteria such as Vibrio shiloi to bloom (Frydenborg et al., 2014). However, destabilized bacterial communities do not always precede bleaching, and bleaching is not always caused by pathogens; in some cases, thermal stress can directly lead to bleaching, with destabilized bacterial communities following the bleaching event (Ainsworth and Hoegh-Guldberg, 2009). Some cnidarians, such as the intertidal sea anemone Anthopleura elegantissima, experience extreme thermal variation in their natural habitat with no adverse effects to their symbiosis with the brown algal Symbiodinium (Bingham et al., 2011). A. elegantissima also occasionally hosts a green algal symbiont, Elliptochloris marina, but this symbiosis is highly susceptible to bleaching (Dimond et al., 2013). Observing the microbiota associated with A. elegantissima in these different symbiotic states may provide clues into the relationship between stability of bacterial communities and stability of cnidarian-algal symbioses.
Anthopleura elegantissima is a symbiotic intertidal sea anemone distributed from subtropical Baja California to subarctic Alaska. It exhibits broad thermal tolerance, experiencing fluctuations of up to 20°C within minutes without obvious signs of stress (Bingham et al., 2011). It is uniquely flexible in its symbioses compared to other cnidarians, and can host the brown algae Symbiodinium, the green algae E. marina, or no symbionts at all in an aposymbiotic state. Irradiance conditions and temperature are the main predictors of symbiotic state: generally, A. elegantissima is found in either the brown symbiotic state (hosting Symbiodinium) when in the light or in the aposymbiotic state in the dark (Bates et al., 2010). Anemones in the green symbiotic state (hosting E. marina), on the other hand, are found in the more restrictive ecological range of low-temperature and low-but-nonzero irradiance conditions, making up < 1% of anemones as far north as Vancouver, British Columbia (Bates et al., 2010). A. elegantissima can also be found hosting both symbionts, particularly in the Salish Sea, where east-facing slopes allow for a gradient of irradiances (Dimond et al., 2011). The paucity of anemones in the green symbiotic state is concordant with experimental evidence that the green algae are less beneficial to A. elegantissima; brown algal symbionts are estimated to contribute about five times as much carbon to their hosts compared to green algal symbionts (Verde and McCloskey, 1996). Furthermore, A. elegantissima, which are facultative sexual reproducing animals, exhibit higher rates of sexual reproduction in the green symbiotic state and higher rates of asexual reproduction in the brown symbiotic state (Bingham et al., 2014). This is in agreement with the common observation that in facultative sexual organisms, sexual reproduction is usually associated with poor conditions (Ram and Hadany, 2016).
The robustness of A. elegantissima’s symbiosis with the brown algal Symbiodinium, as well as its flexibility to exist in different symbiotic states, make it an ideal model to investigate high-level patterns of host-symbiont-microbiome associations. In this study, we used 16S amplicon sequencing to characterize the microbial communities associated with A. elegantissima across a latitudinal gradient and in different symbiotic states. Our goals were to (a) evaluate how host-associated microbial communities vary across a large-scale temperature and irradiance gradient (i.e., latitude) and (b) compare the microbiome of A. elegantissima in three of its symbiotic states (brown, green, and aposymbiotic) to assess the degree to which microbial communities associate with symbiotic states.
Materials and Methods
Sample Collections and Preparation
We collected 119 anemones from eight sites ranging from Cape Mendocino, California, to Point of Arches, Washington, United States during August and September 2014 (Figure 1). We began collections approximately 1 h before low tide. To account for possible effects of factors associated with tide (e.g., temperature, exposure time, substrate), we collected equal numbers of samples from each biological intertidal zone (low, middle, high). The low zone was defined by presence of feather boa kelp, the middle zone by mussel beds, and the high zone by barnacles (Paine, 1974). For questions concerning symbiotic state, we collected fifteen anemones from the middle tidal zone at Boiler Bay, OR, United States, in fall 2014: five brown, five green, and five aposymbiotic. Symbiont typing was performed by careful visual inspection in the laboratory. We collected anemones using forceps and sterile nitrile gloves. A fresh pair of gloves was used for each sample, and forceps were cleaned using 70% ethanol between samples. For storage, we placed samples in Whirl-pak® sampling bags (Nasco), and froze the samples on dry ice in the field.
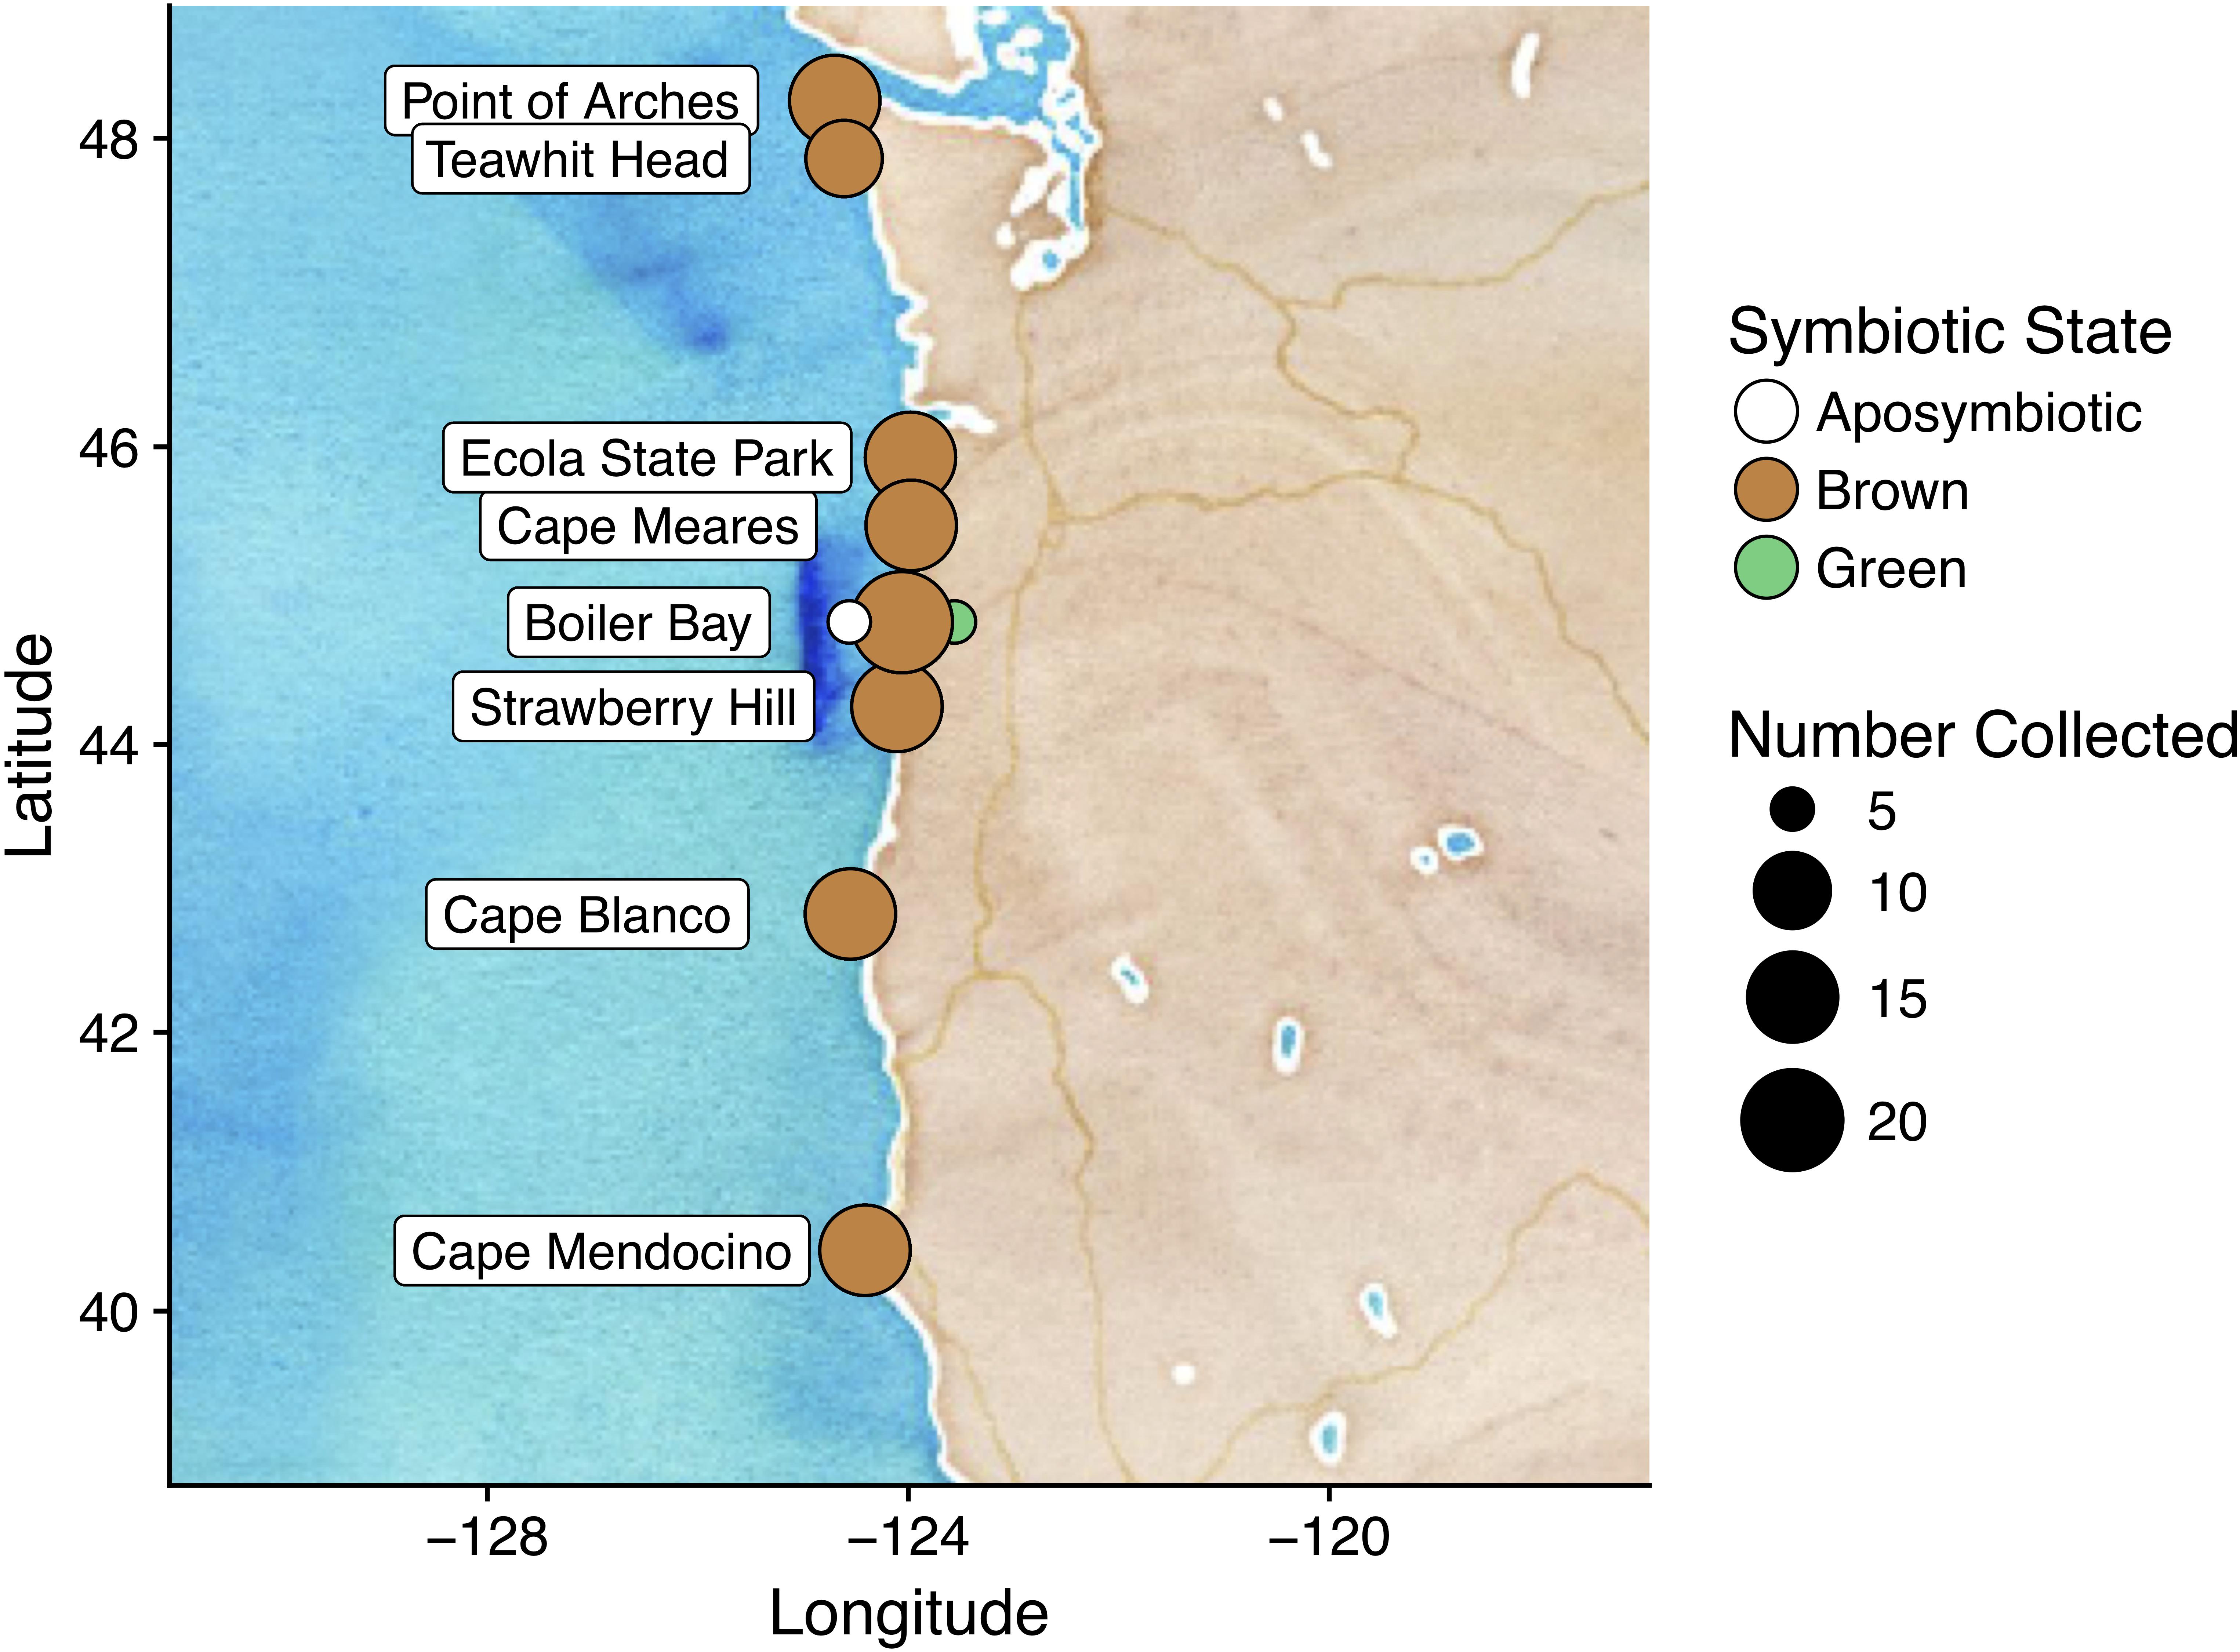
Figure 1. We collected A. elegantissima from eight sites in the Pacific rocky intertidal over a latitudinal range of eight degrees. We returned to Boiler Bay to collect samples for analyses concerning symbiotic state.
DNA Isolation, 16S PCR, and Sequencing
Samples were stored at -80°C prior to DNA extractions for 16S PCR. Whole anemones were homogenized using mortar and pestle. DNA was isolated from the homogenate using PowerSoil DNA Extraction kits (MOBIO, Carlsbad, CA, United States). We sequenced three kit blanks and two PCR negative blanks to assess contamination introduced during this step. The V4 region of the 16S rRNA gene was amplified using 515F-806R primers modified for Illumina indexing (Kozich et al., 2013) and AccuStart II PCR ToughMix (Gaithersburg, MD, United States). PCR was performed in triplicate with the following program: 1 × 2 min at 95°C, 30 × (20 s at 95°C, 15 s at 50°C, 5 min at 72°C), 1 × 10 min at 72°C. We included two PCR negatives to assess contamination introduced during this step. Samples were pooled, quantified using qPCR, and normalized before sequencing the MiSeq platform (Illumina, San Diego, CA, United States) using the single-end 150 bp chemistry.
16S Amplicon Pre-processing
After demultiplexing and initial quality filtering (Q > 20) using the Quantitative Insights in Microbial Ecology (QIIME) (version 1.9) pipeline split_libraries_fastq.py (Caporaso et al., 2010), sequences were clustered into de novo operational taxonomic units (OTUs) using Swarm (Mahé et al., 2014). Singleton OTUs were discarded to minimize false OTUs (Auer et al., 2017). Chimeric sequences removed using uchime (Edgar et al., 2011, v4.2.40) against the Silva gold chimera reference (Quast et al., 2012). Taxonomy was assigned using BLAST (Altschul et al., 1990) with an e-value cutoff of 0.001 against the Greengenes 13.8 reference, the default database for QIIME. OTUs identified as chloroplasts and mitochondria were removed from the OTU table. Additionally, OTUs were identified as contaminants and removed if their relative abundances were above 1% in the kit blanks or PCR negatives. We chose these thresholds to avoid removing OTUs that might appear in the kit blanks or PCR negatives due to Illumina sample bleeding or cross-contamination from samples.
Diversity Analyses
Core Microbiome of A. elegantissima
Commonly used taxonomic classifiers and databases often differ at lower taxonomic ranks (Bokulich et al., 2018), so the Order level was chosen as the unit for core taxa analyses, so our results could be compared to studies using different classifiers and databases. Because the term “core” is not well defined (Shade and Handelsman, 2012), three separate core taxa sets were identified using 95, 75, and 50% prevalence cutoffs. Quantiles of the relative abundances of these orders were also included to relate the abundances of these taxa to their prevalence (Supplementary Data Sheet S2).
Alpha Diversity Metrics
To account for random biases associated with rarefaction, OTU tables were rarefied 10 times and the Chao1 metric, Faith’s Phylogenetic Diversity, and Shannon Index were calculated for each rarefied table. Mean values were used for statistical tests and plots. The 114-sample OTU table for latitude analyses was rarefied to a depth of 5,000. The 15-sample OTU table for symbiosis analyses was rarefied to a minimum depth of 2,632 so that all samples could be included in the analysis. We conducted Kruskal–Wallis tests to assess differences in alpha diversity among groups and Mann-Whitney U tests to assess differences between groups.
Beta Diversity
For beta diversity analyses, we conducted permutational multivariate analyses of variance (PERMANOVA) tests using the R function vegan::adonis (Oksanen et al., 2018) to identify associations between symbiotic state or latitude and Bray-Curtis dissimilarities. Constrained Analysis of Principal Coordinates (CAP) was performed using the R function vegan::capscale to test for linear relationships between explanatory variables and beta diversity metrics. In CAP, a distance matrix is ordinated using Principal Coordinates Analysis (PCoA), and the resulting coordinates are tested for linear associations with variables of interest (e.g., latitude or symbiotic state) using redundancy analysis, an extension of multiple linear regression (Oksanen et al., 2018). The results of redundancy analysis can then be used to constrain the PCoA ordination, resulting in an ordination with axes constrained to only explain variance explained by the variable of interest.
To test for correlations between beta diversity and latitude, we conducted Mantel tests using the R function vegan::mantel. We conducted the test for Bray-Curtis, Jaccard, Weighted UniFrac, and Unweighted UniFrac metrics.
Taxonomic Differences Between Symbiotic States
To identify taxa associated with symbiotic states, we conducted indicator taxon analyses on OTU tables rarefied to minimum depth and agglomerated at the phylum, class, and order ranks using the indicspecies::multipatt function in R (De Cáceres and Legendre, 2009). We used the IndVal.g metric, which considers differential abundance as well as presence/absence information to detect associations between taxa and combinations of sample groups (Dufrêne and Legendre, 1997; De Cáceres et al., 2010). Prior to this analysis, we filtered OTUs with mean relative abundances below 10-3 and present in fewer than two samples to reduce noise from OTUs near the detection limit and increase the power of the analysis. Taxa associated with symbiotic state with an FDR q-value < 0.2 were recorded along with the indicator value, p-value, and FDR q-value (Supplementary Data Sheet S3). We plotted the log10 relative abundances as well as prevalences of the orders identified as indicators of symbiotic state (Figure 4).
Results
Pre-processing
The processed OTU table contained 2,456,818 observations of 18,709 OTUs and had a median sample depth of 11,399. We split this table into two sub-tables for analyses concerning latitude and symbiotic state. The table for analyses concerning latitude contained 114 samples with a median sample depth of 13,240. The table for analyses concerning symbiotic state contained 15 samples with a median sample depth of 6,986. Metadata, including site, latitude, symbiotic state, sequencing depth, and alpha diversity metrics for each sample, can be found in Supplementary Data Sheet S1. We removed 12 OTUs, visualized in Supplementary Figure S1. These OTUs were all taxonomically assigned to genera previously identified as common kit contaminants: Sphingomonas, Janthinobacterium, Burkholderia, Variovorax, Herbaspirillum, Methylobacterium, Aeromicrobium, Pseudomonas, Phyllobacterium, and Bacillus (Salter et al., 2014). Two OTUs we removed were unassigned at the genus level, but belonged to families Comamonadaceae and Enterobacteriaceae.
The Core Microbiome of A. elegantissima in the Brown Symbiotic State Consists Mostly of Orders Typically Associated With Coastal Seawater
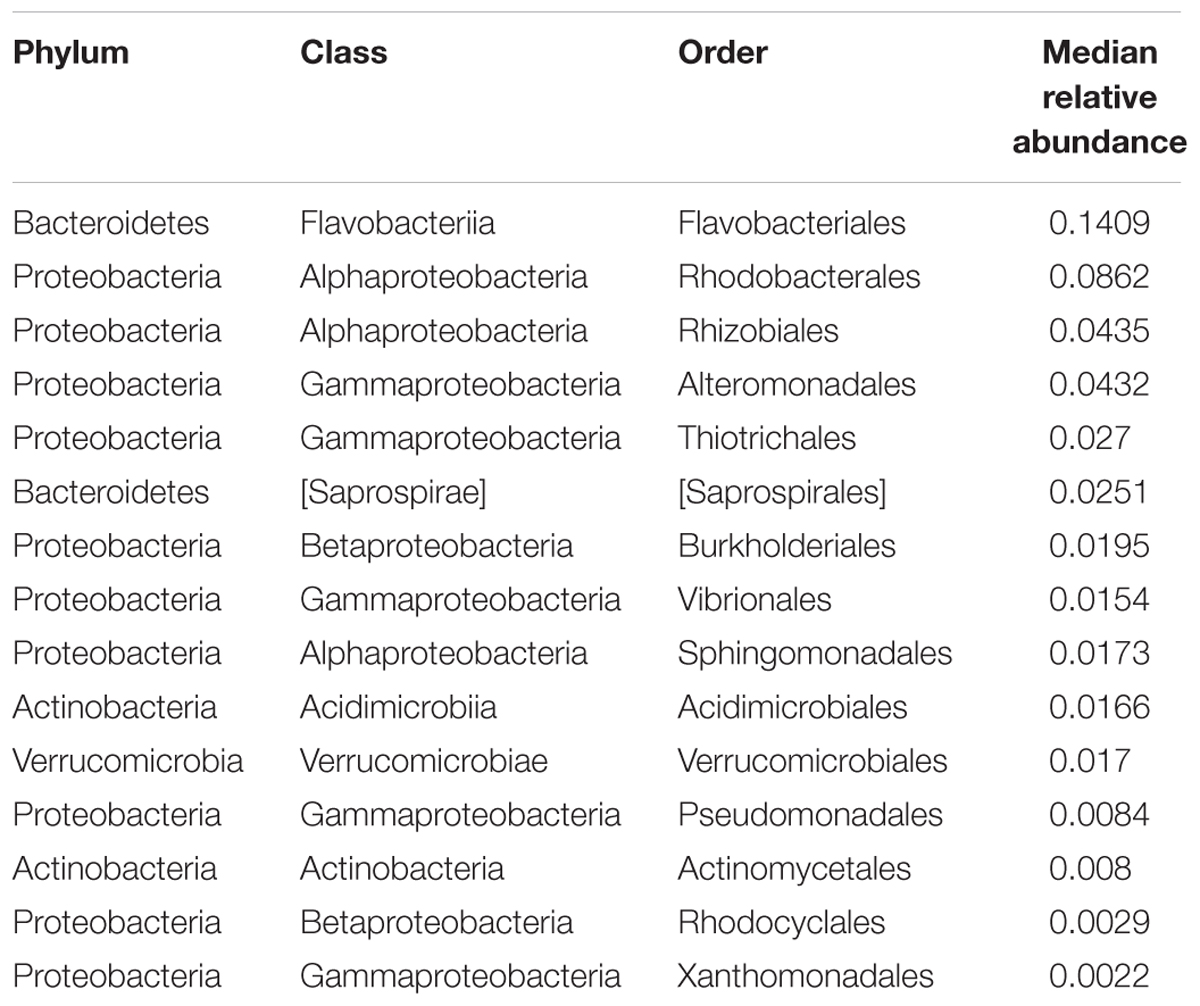
To identify microbiota that stably associate with A. elegantissima across the sampled geographic range, we identified core orders at 50, 75, and 95% prevalence thresholds. Our analysis revealed orders with at least 50% prevalence, orders with at least 75% prevalence, and orders with at least 95% prevalence (Supplementary Data Sheet S2). Burkholderia was the only order with 100% prevalence, and was dominated by an OTU in genus Ralstonia that has previously been identified as an endosymbiont of Symbiodinium in corals (Ainsworth et al., 2015). Flavobacteriales, Rhodobacterales, Rhizobiales, and Alteromonadales, orders commonly associated with coastal seawater, had the highest median relative abundances of the core orders with relative abundances of 14, 9, 4, and 4% respectively. All of the fifteen orders with prevalence > 95% (Table 1) were previously found to associate with symbiotic cnidarians and/or seawater (Glasl et al., 2016; McDevitt-Irwin et al., 2017; Pootakham et al., 2017).
Microbial Communities Associated With Green Anemones Have Higher Richness, but Not Evenness
We analyzed alpha diversity using Chao1, Faith’s PD, and Shannon Index metrics (Figures 2A–C). Chao1, an estimator of the total number of OTUs, had significantly higher median values in communities associated with green anemones compared to the pool of brown and aposymbiotic anemones (Mann–Whitney U, p = 0.003). This result is concordant with patterns seen in Faith’s PD metric (Mann–Whitney U, p = 0.039), which demonstrates that this increase in richness is not simply due to the presence of a few hyper-diverse species or genera. Median Shannon Index values did not differ significantly among the symbiont types (Kruskal–Wallis, p = 0.147), but tended to have higher values in symbiotic anemones compared to aposymbiotic anemones (Mann–Whitney U, p = 0.055).
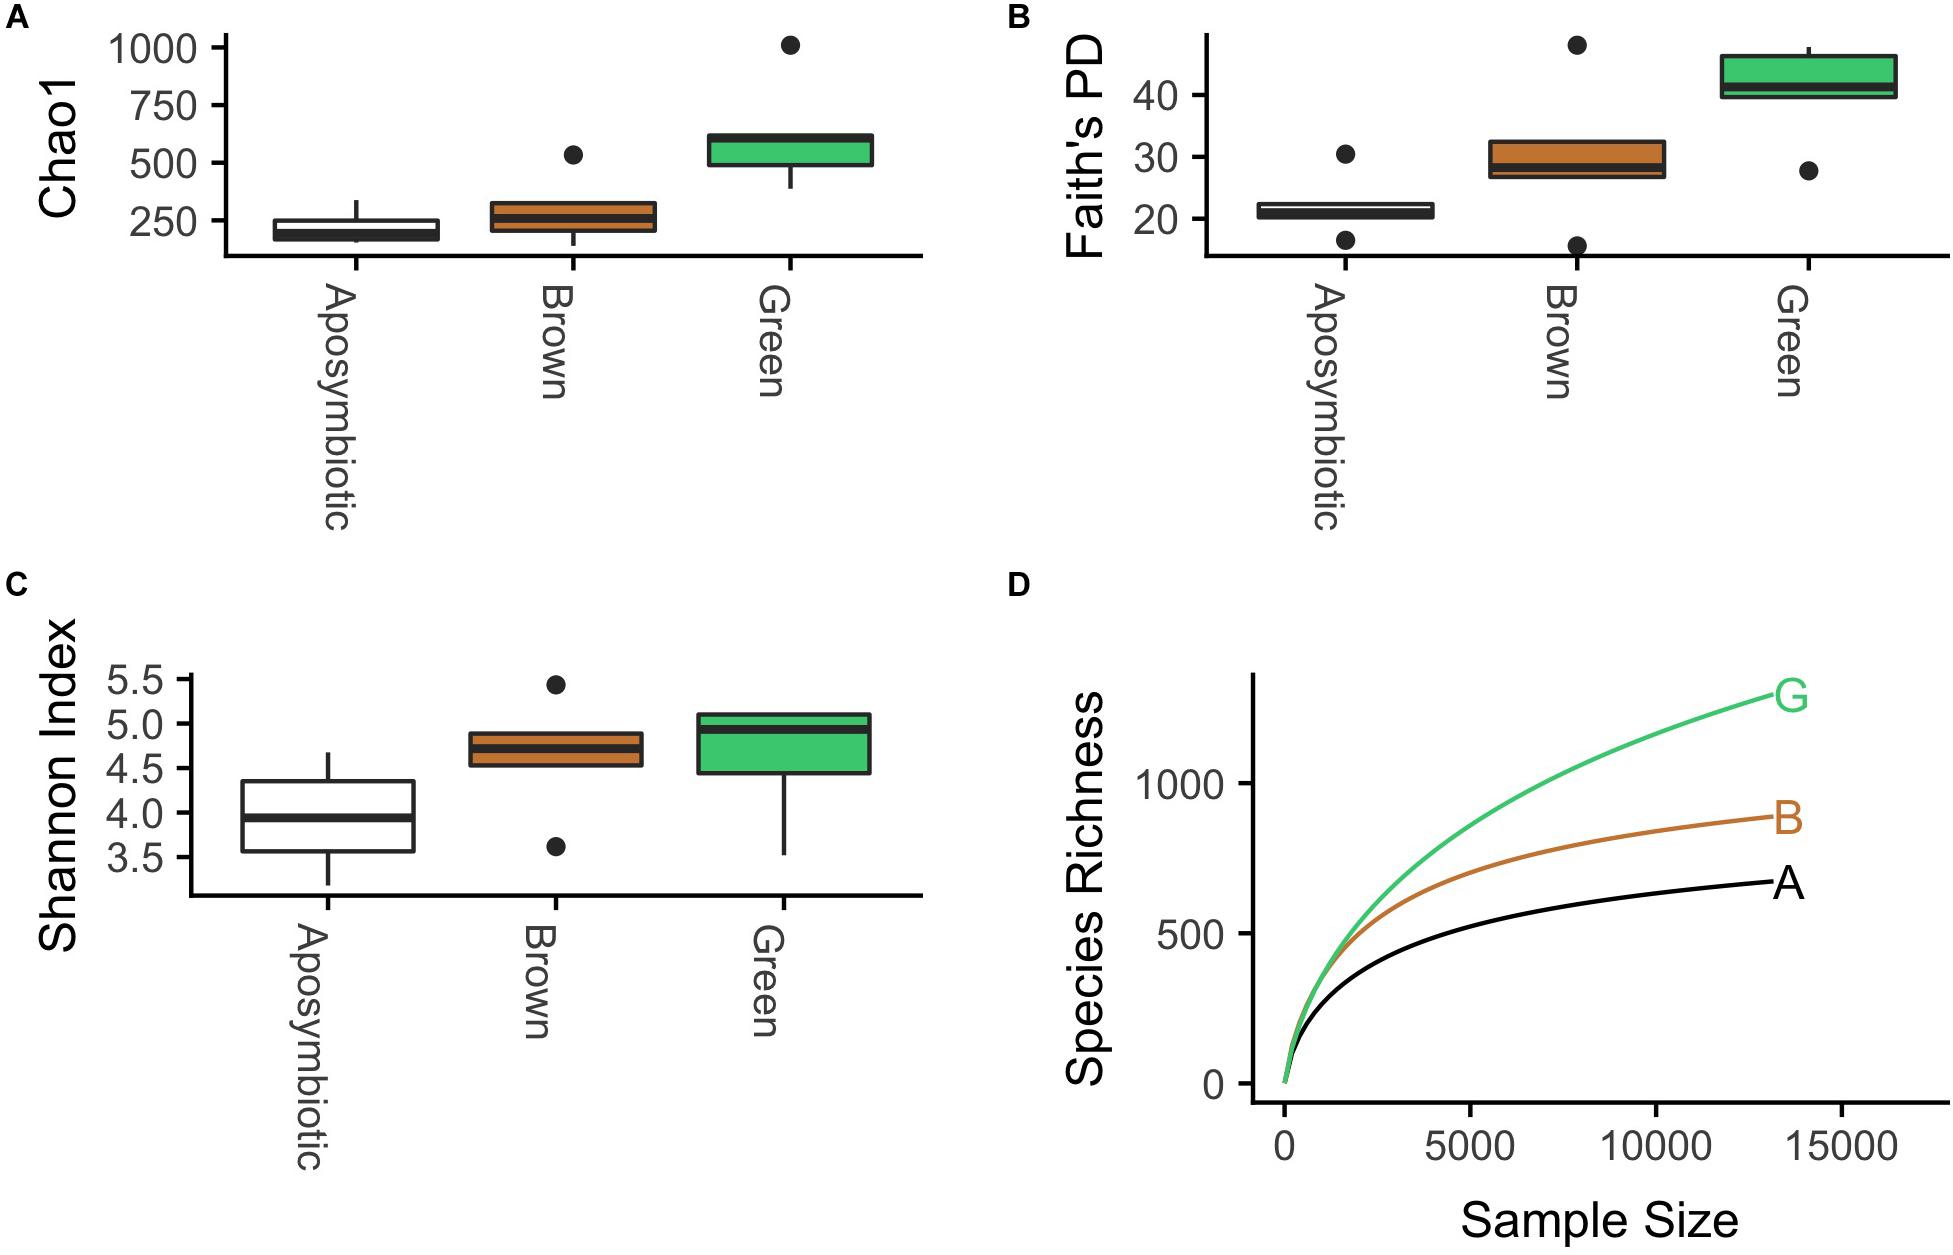
Figure 2. Microbial communities associated with the green symbiotic state have significantly higher median (A) Chao1 (Mann–Whitney U, p = 0.003) and (B) Faith’s PD values (Mann–Whitney U, p = 0.039). There is some evidence that communities associated with symbiotic anemones have higher median (C) Shannon index values than those of aposymbiotic anemones (Mann–Whitney U, p = 0.055). (D) Rarefaction curves of aggregated samples (n = 5 for each symbiotic state) provide estimates of the total number of OTUs observed in communities associated with each symbiotic state.
A rarefaction analysis of the samples aggregated by symbiotic state provides further evidence that communities associated with green anemones have higher richness than brown and aposymbiotic anemones (Figure 2D). At a rarefaction depth of 10,000, the agglomerated green-associated communities contained 1,164 observed OTUs, brown-associated communities contained 840 OTUs, and aposymbiotic-associated communities had 633 OTUs.
Symbiotic State Is Associated With Microbial Community Structure
We used four beta diversity metrics and CAP ordination on rarefied OTU tables to investigate the differences in community structure attributed to symbiotic state (Figures 3A–D). These metrics, which differ in their weighting of abundance and phylogenetic information, were all significantly linked to symbiotic state. Clustering of Bray-Curtis values, which are abundance-weighted, suggest that abundant species differ among the symbiotic states (PERMANOVA, p = 0.025, R2 = 0.196). Clustering of Weighted UniFrac, which also takes into account phylogenetic information, further confirms this observation, while also suggesting that differences in closely related OTUs do not account for the observed differences (PERMANOVA, p = 0.025, R2 = 0.262).
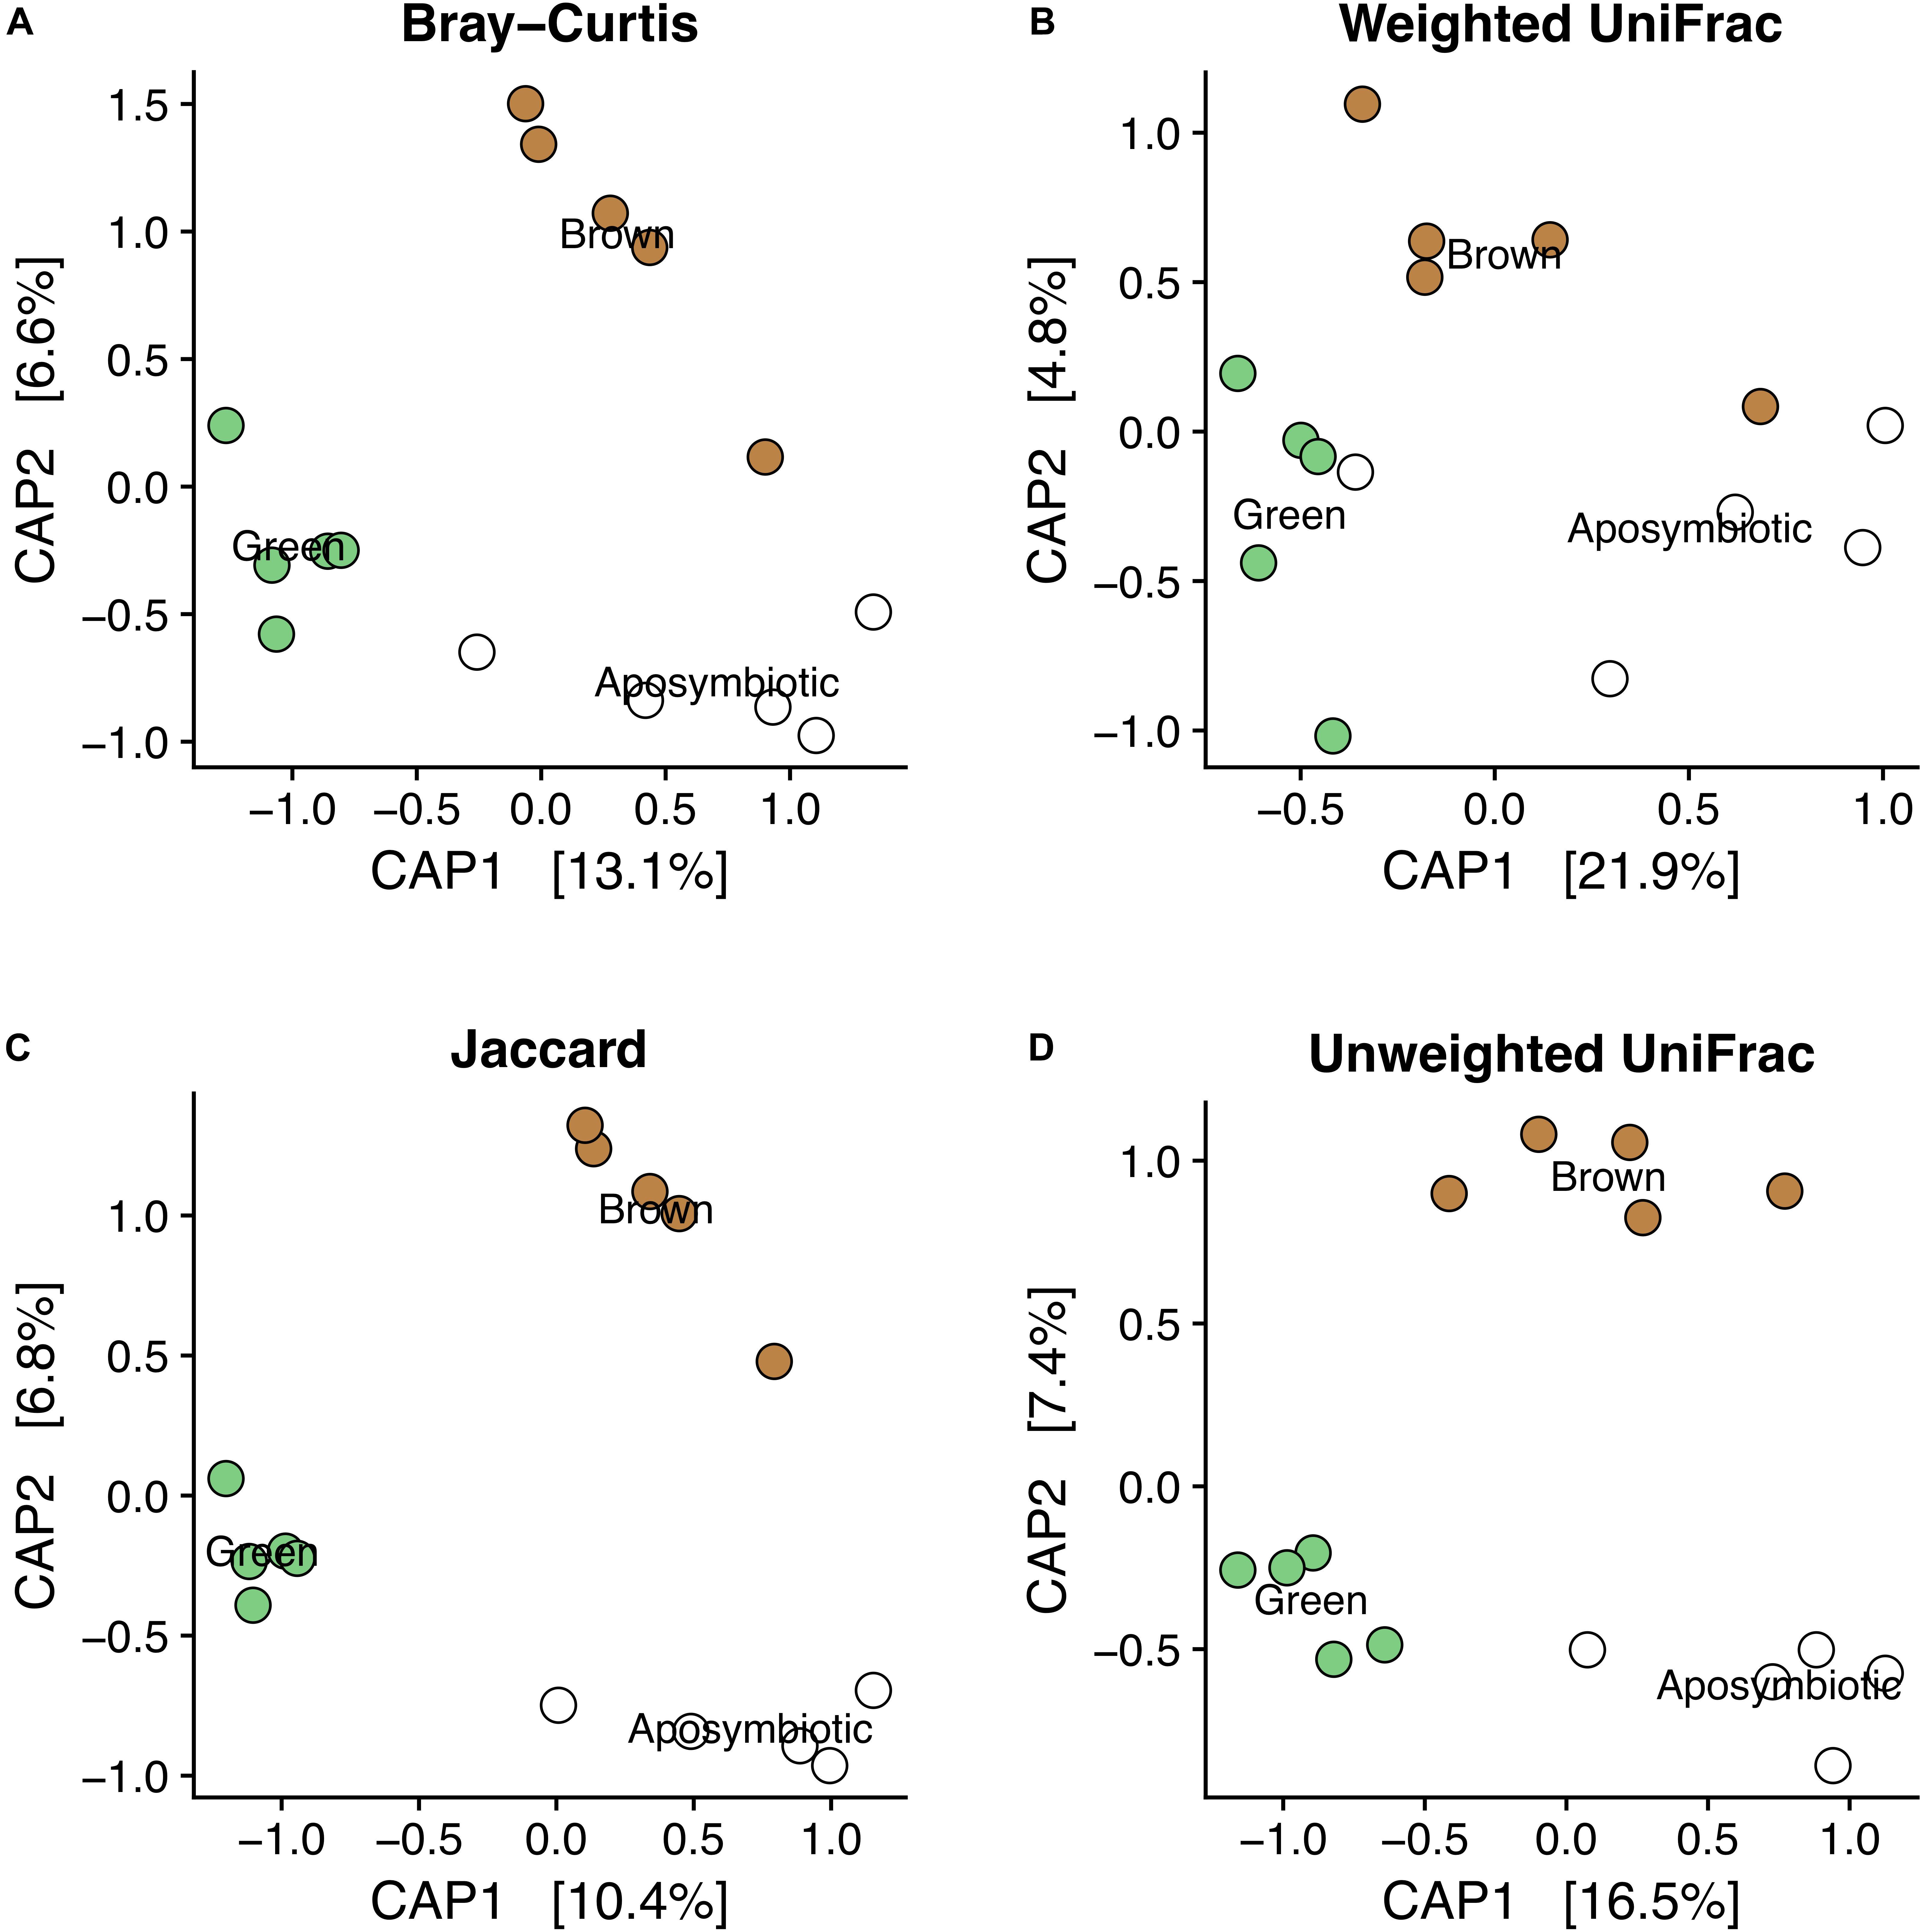
Figure 3. CAP ordination plots of (A) Bray-Curtis, (B) Weighted UniFrac, (C) Jaccard, and (D) Unweighted UniFrac beta diversity metrics reveal structure in microbial communities associated with A. elegantissima in different symbiotic states. Clustering by symbiotic state was robust to the metric used.
We observed differences in Jaccard distances (calculated from presence/absence data), which suggests that OTU incidences, not just abundances, differ among the symbiotic states (PERMANOVA, p = 0.019, R2 = 0.172). Differences in Unweighted UniFrac values (PERMANOVA, p = 0.001, 0.241), a phylogenetically informed metric also calculated from presence/absence data, further supports this observation and suggests that these differences in frequencies are not driven by closely related OTUs.
In summary, similar observations between abundance-weighted and presence/absence metrics suggest that the differences among these communities cannot be explained entirely by high- or low-abundance OTUs. Furthermore, the similarities in results from phylogenetically informed and phylogenetically uninformed metrics suggest that these observations are not skewed by the presence of hyper-diverse species or genera, which tend to inflate incidence-based metrics.
Symbiotic States Are Associated With Indicator Taxa
Indicator taxon analysis identified 23 taxa associated with symbiotic state including eight phyla, ten classes, and five orders (Supplementary Data Sheet S3). We plotted the relative abundances and prevalence of the five orders identified as indicators to visualize patterns in the distributions of these orders (Figures 4A–E).
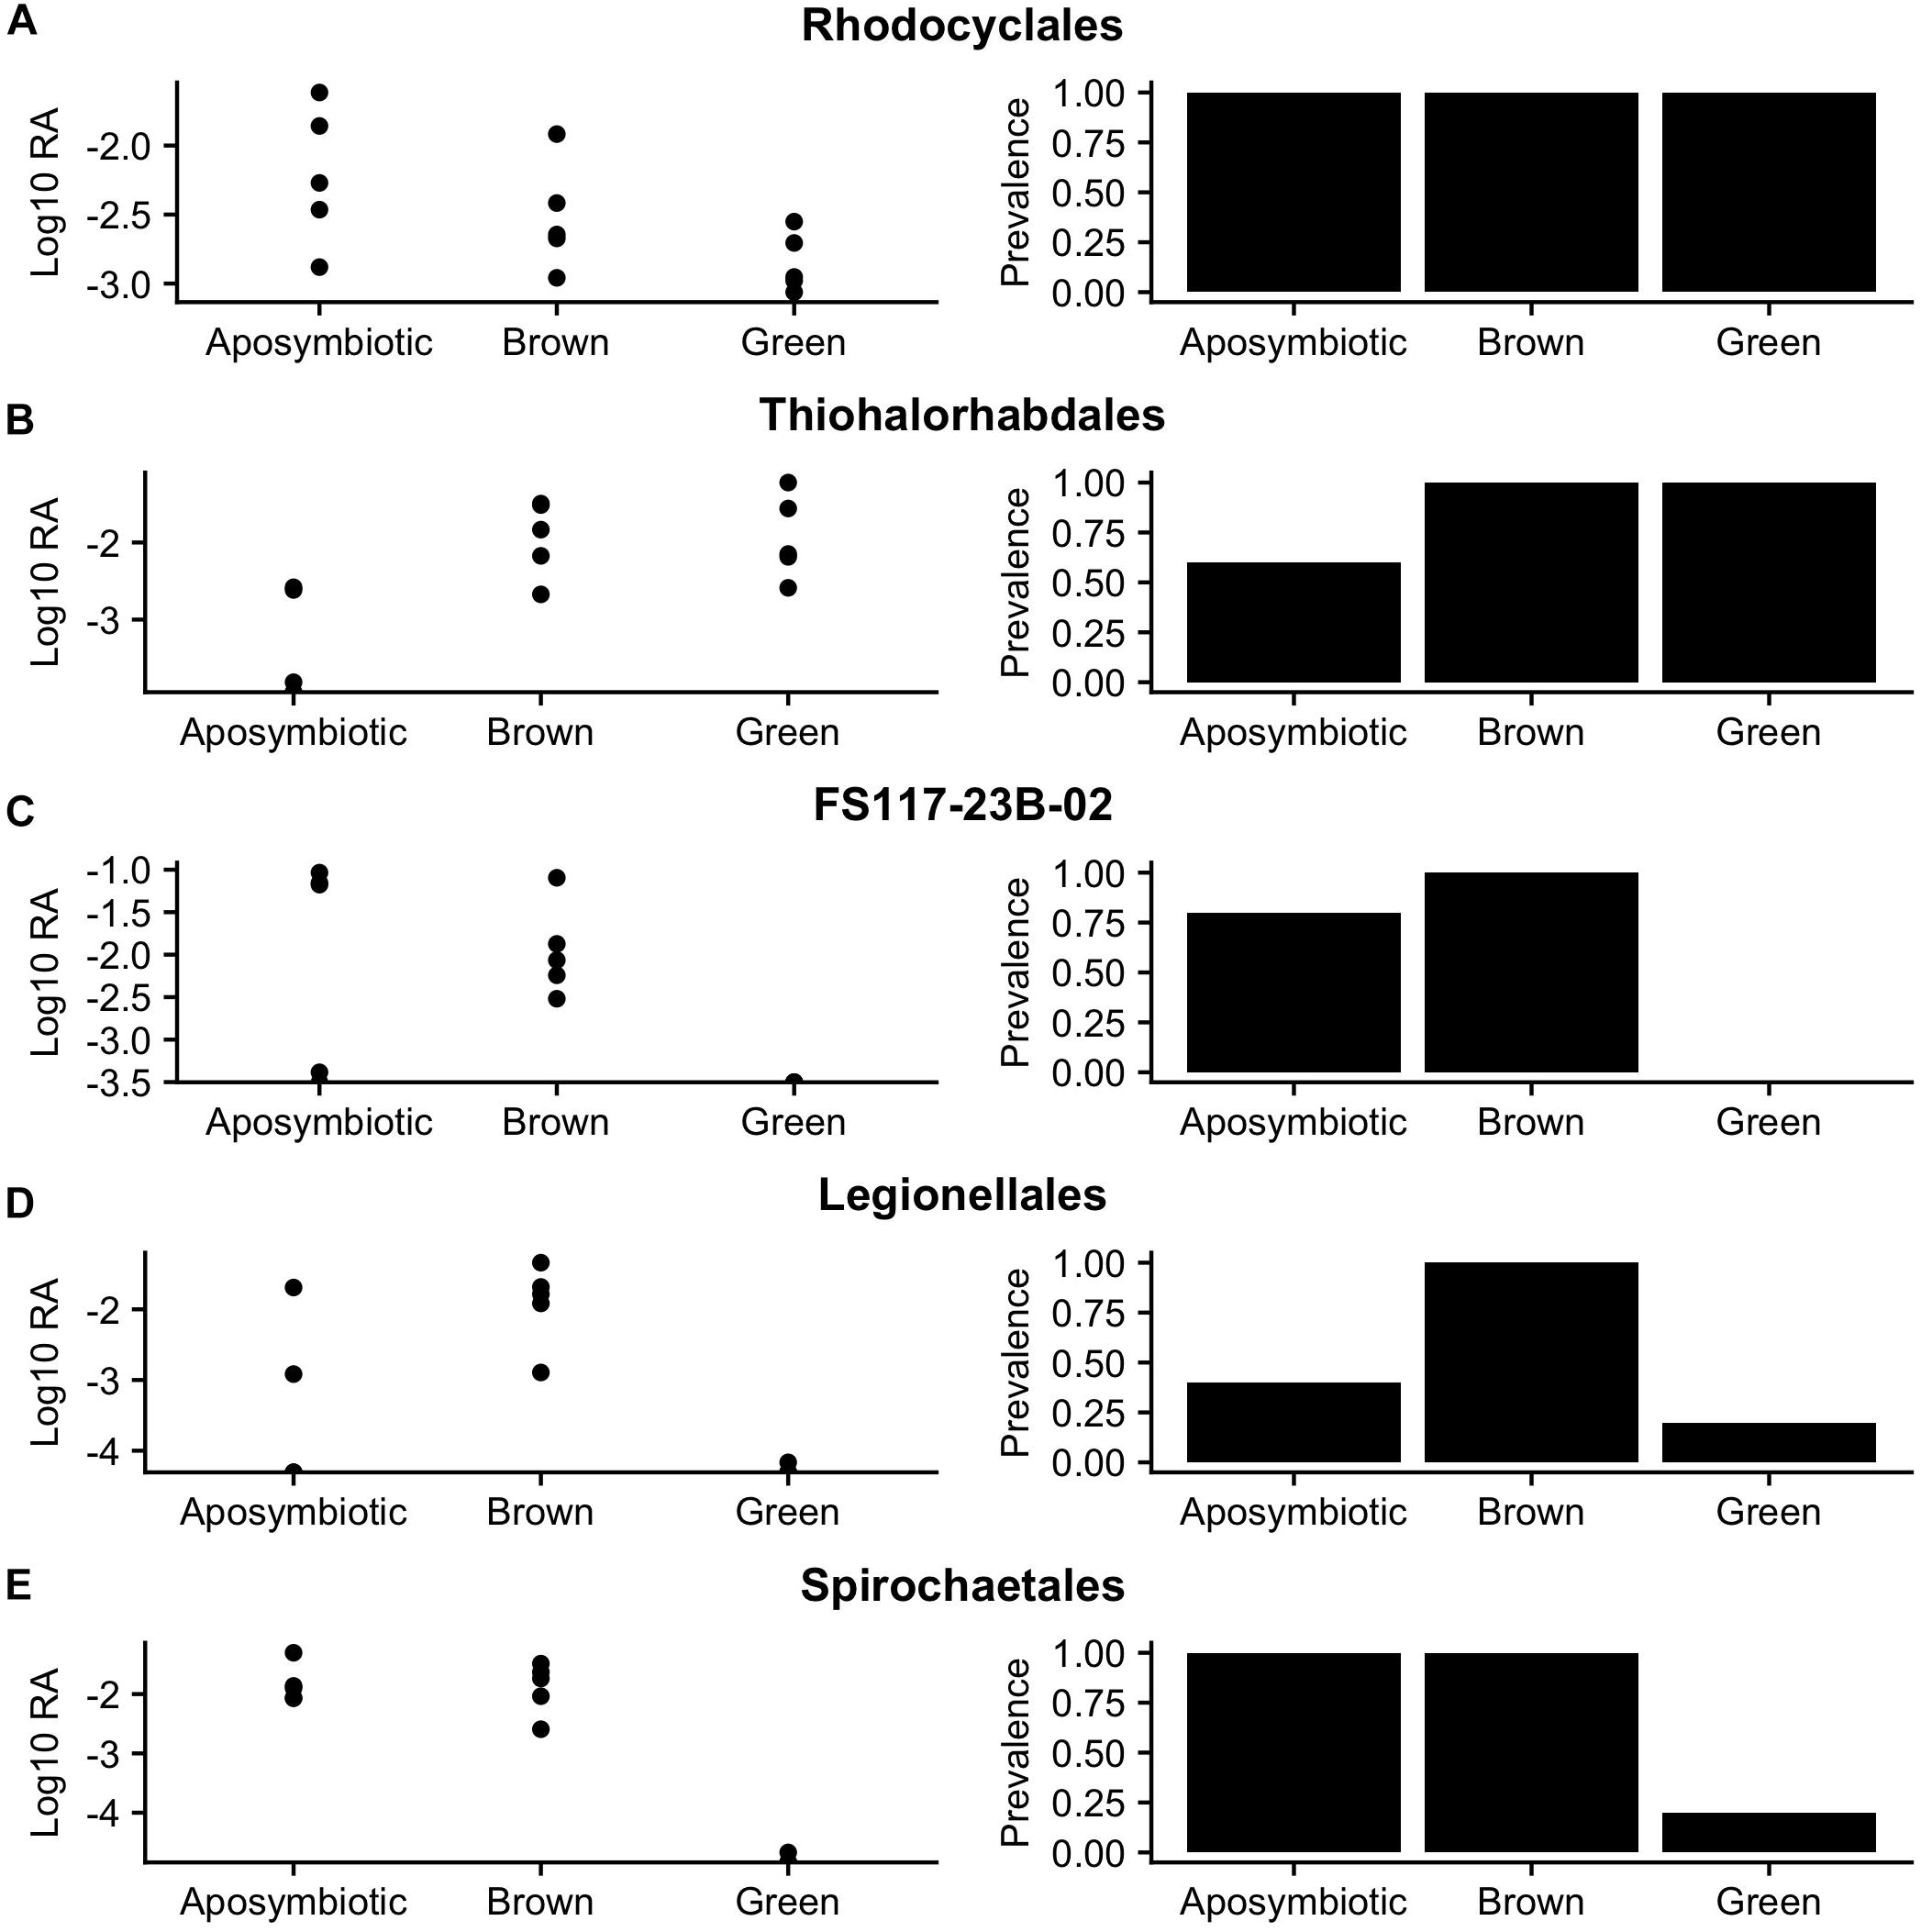
Figure 4. Log10 relative abundances (left) and prevalence (right) reveal abundance and presence/absence patterns of orders identified as indicators of symbiotic state (FDR q-value < 0.2): (A) Rhodocyclales, (B) Thiohalorhabdales, (C) FS117-23B-02, (D) Legionellales, and (E) Spirochaetales.
The order Legionellales was identified as an indicator of the brown symbiotic state (FDR q-value = 0.076). This order was detected in communities associated with all symbiotic states, but had higher prevalence and relative abundances in the brown symbiotic state. This order was dominated by an OTU taxonomically assigned to the Nebulobacter yamunensis.
Orders Rhodocyclales, Spirochaetes, and FS117-23B-02 were identified as indicators of the “Not green” symbiotic state (i.e., associated with brown and aposymbiotic states) (FDR q-values = 0.193, 0.076, and 0.076 respectively). Rhodocyclales was present in every sample included in the analysis, but had lower relative abundances in green-associated communities. Spirochaetales had 100% prevalence in brown- and aposymbiotic- associated communities, but was only present in one green-associated community. The order FS117-23B-02, in the class Dehalococcoides, was present in 90% of aposymbiotic- or brown- associated communities, but not detected in any of the green-associated communities.
The order Thiohalorhabdales was identified as an indicator of symbiosis (i.e., associated with brown- or green-associated communities) (FDR q-value = 0.076). Thiohalorhabdales had both lower prevalence and abundances in aposymbiotic-associated communities than in symbiotic communities.
Alpha Diversity of A. elegantissima-Associated Communities Is Not Linked to Latitude
We did not detect an association between latitude and Shannon index, Chao1, or Faith’s Phylogenetic Diversity values using a Kruskal–Wallis test or Spearman correlation (Figures 5A–C). A rarefaction analysis of the samples aggregated by site similarly did not reveal any trends between latitude and number of observed OTUs (Figure 5D). A median of 3148 OTUs were observed per site.
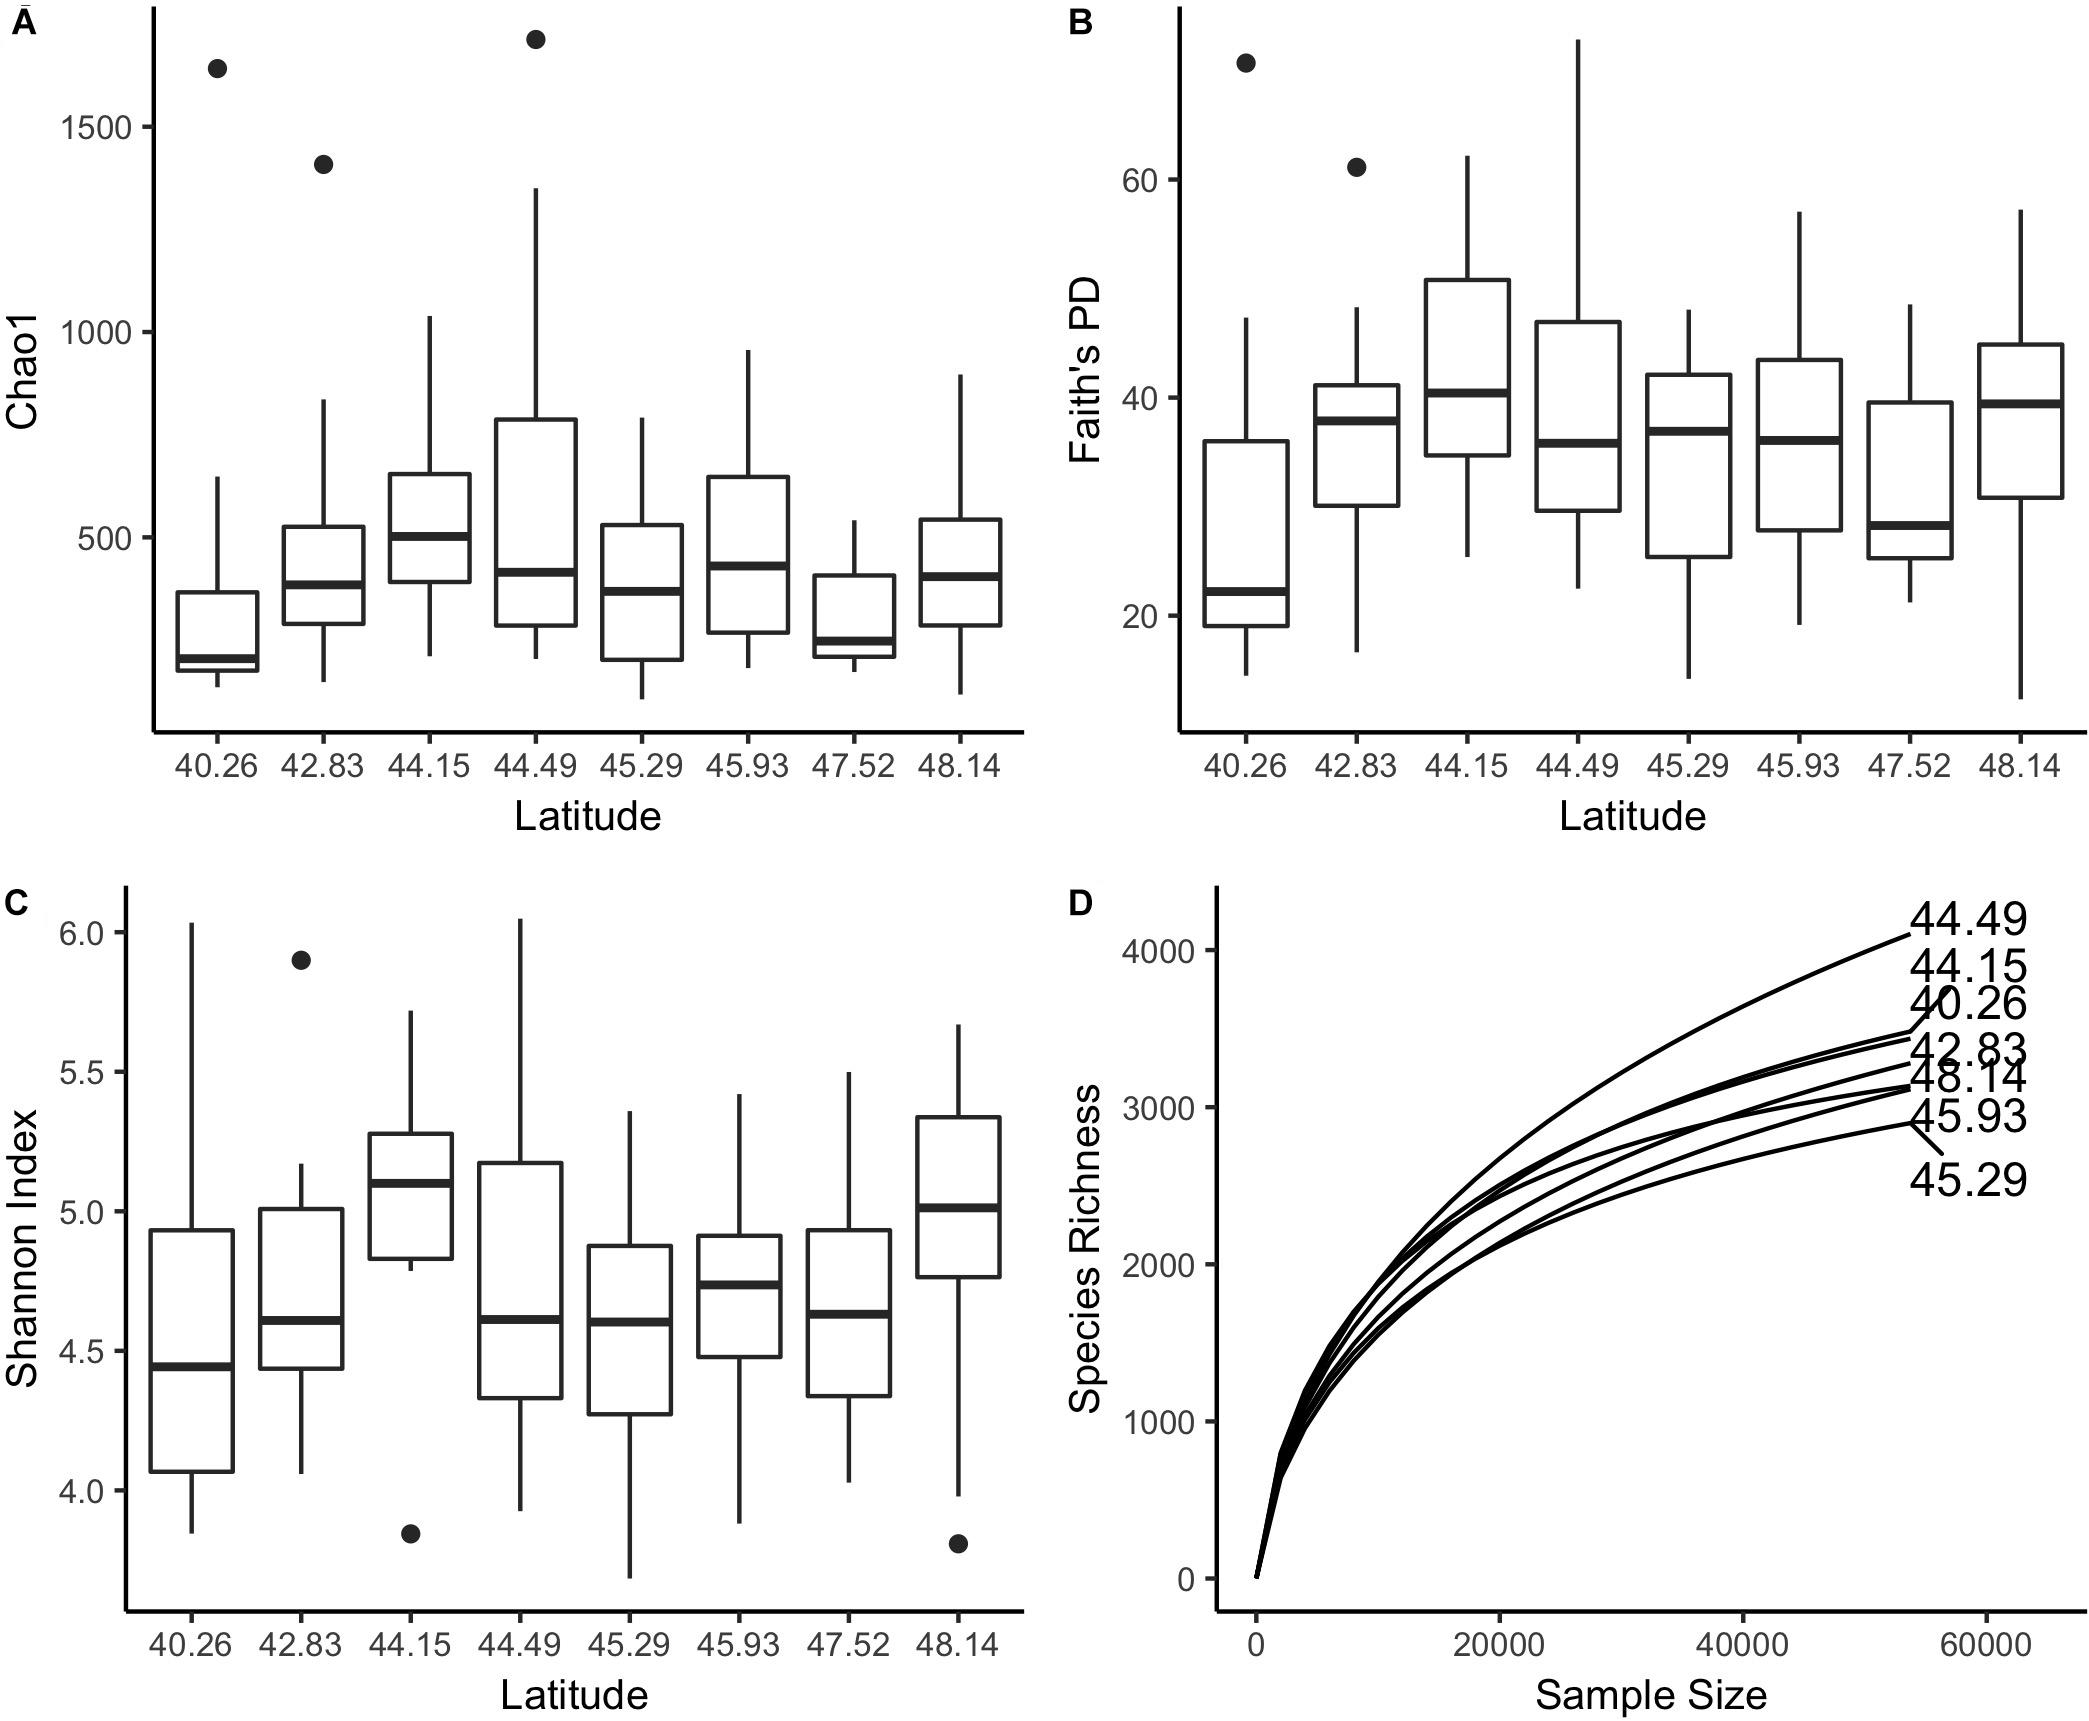
Figure 5. We did not find an association between latitude and (A) Chao1, (B) Faith’s PD, or (C) Shannon Index values using a Spearman correlation or Kruskal–Wallis test. (D) A rarefaction curve of samples aggregated by site (n = 14 or 15) provides estimates of the total number of OTUs observed at each site. At a depth of 50,000 observations, a median of 3,204 OTUs were observed.
Latitude Is Weakly Linked to Beta Diversity
We used four beta diversity metrics for CAP ordinations and Mantel tests (see Materials and Methods) to evaluate trends in beta diversity over a latitudinal gradient. As with analyses concerning symbiotic state, results were robust to metric choice, so only Bray-Curtis results are reported in our CAP analyses (Figure 6). This ordination was only constrained by site, so both CAP axes describe variation explained by site. Tidal zone was found to have a small but significant association with Bray-Curtis dissimilarities (PERMANOVA, p = 0.026, R2 = 0.025). We analyzed latitude both as a quantitative and categorical variable to evaluate linear relationships between latitude and Bray-Curtis dissimilarities as well as potential non-linear differences among sites. When treated as a quantitative variable, latitude was found to be very weakly linked to Bray-Curtis dissimilarities (PERMANOVA, p = 0.001, R2 = 0.022). As a qualitative factor, latitude explained more variance in Bray-Curtis dissimilarities, suggesting that the relationship between site location and beta diversity is not linear (PERMANOVA, p = 0.001, R2 = 0.126).
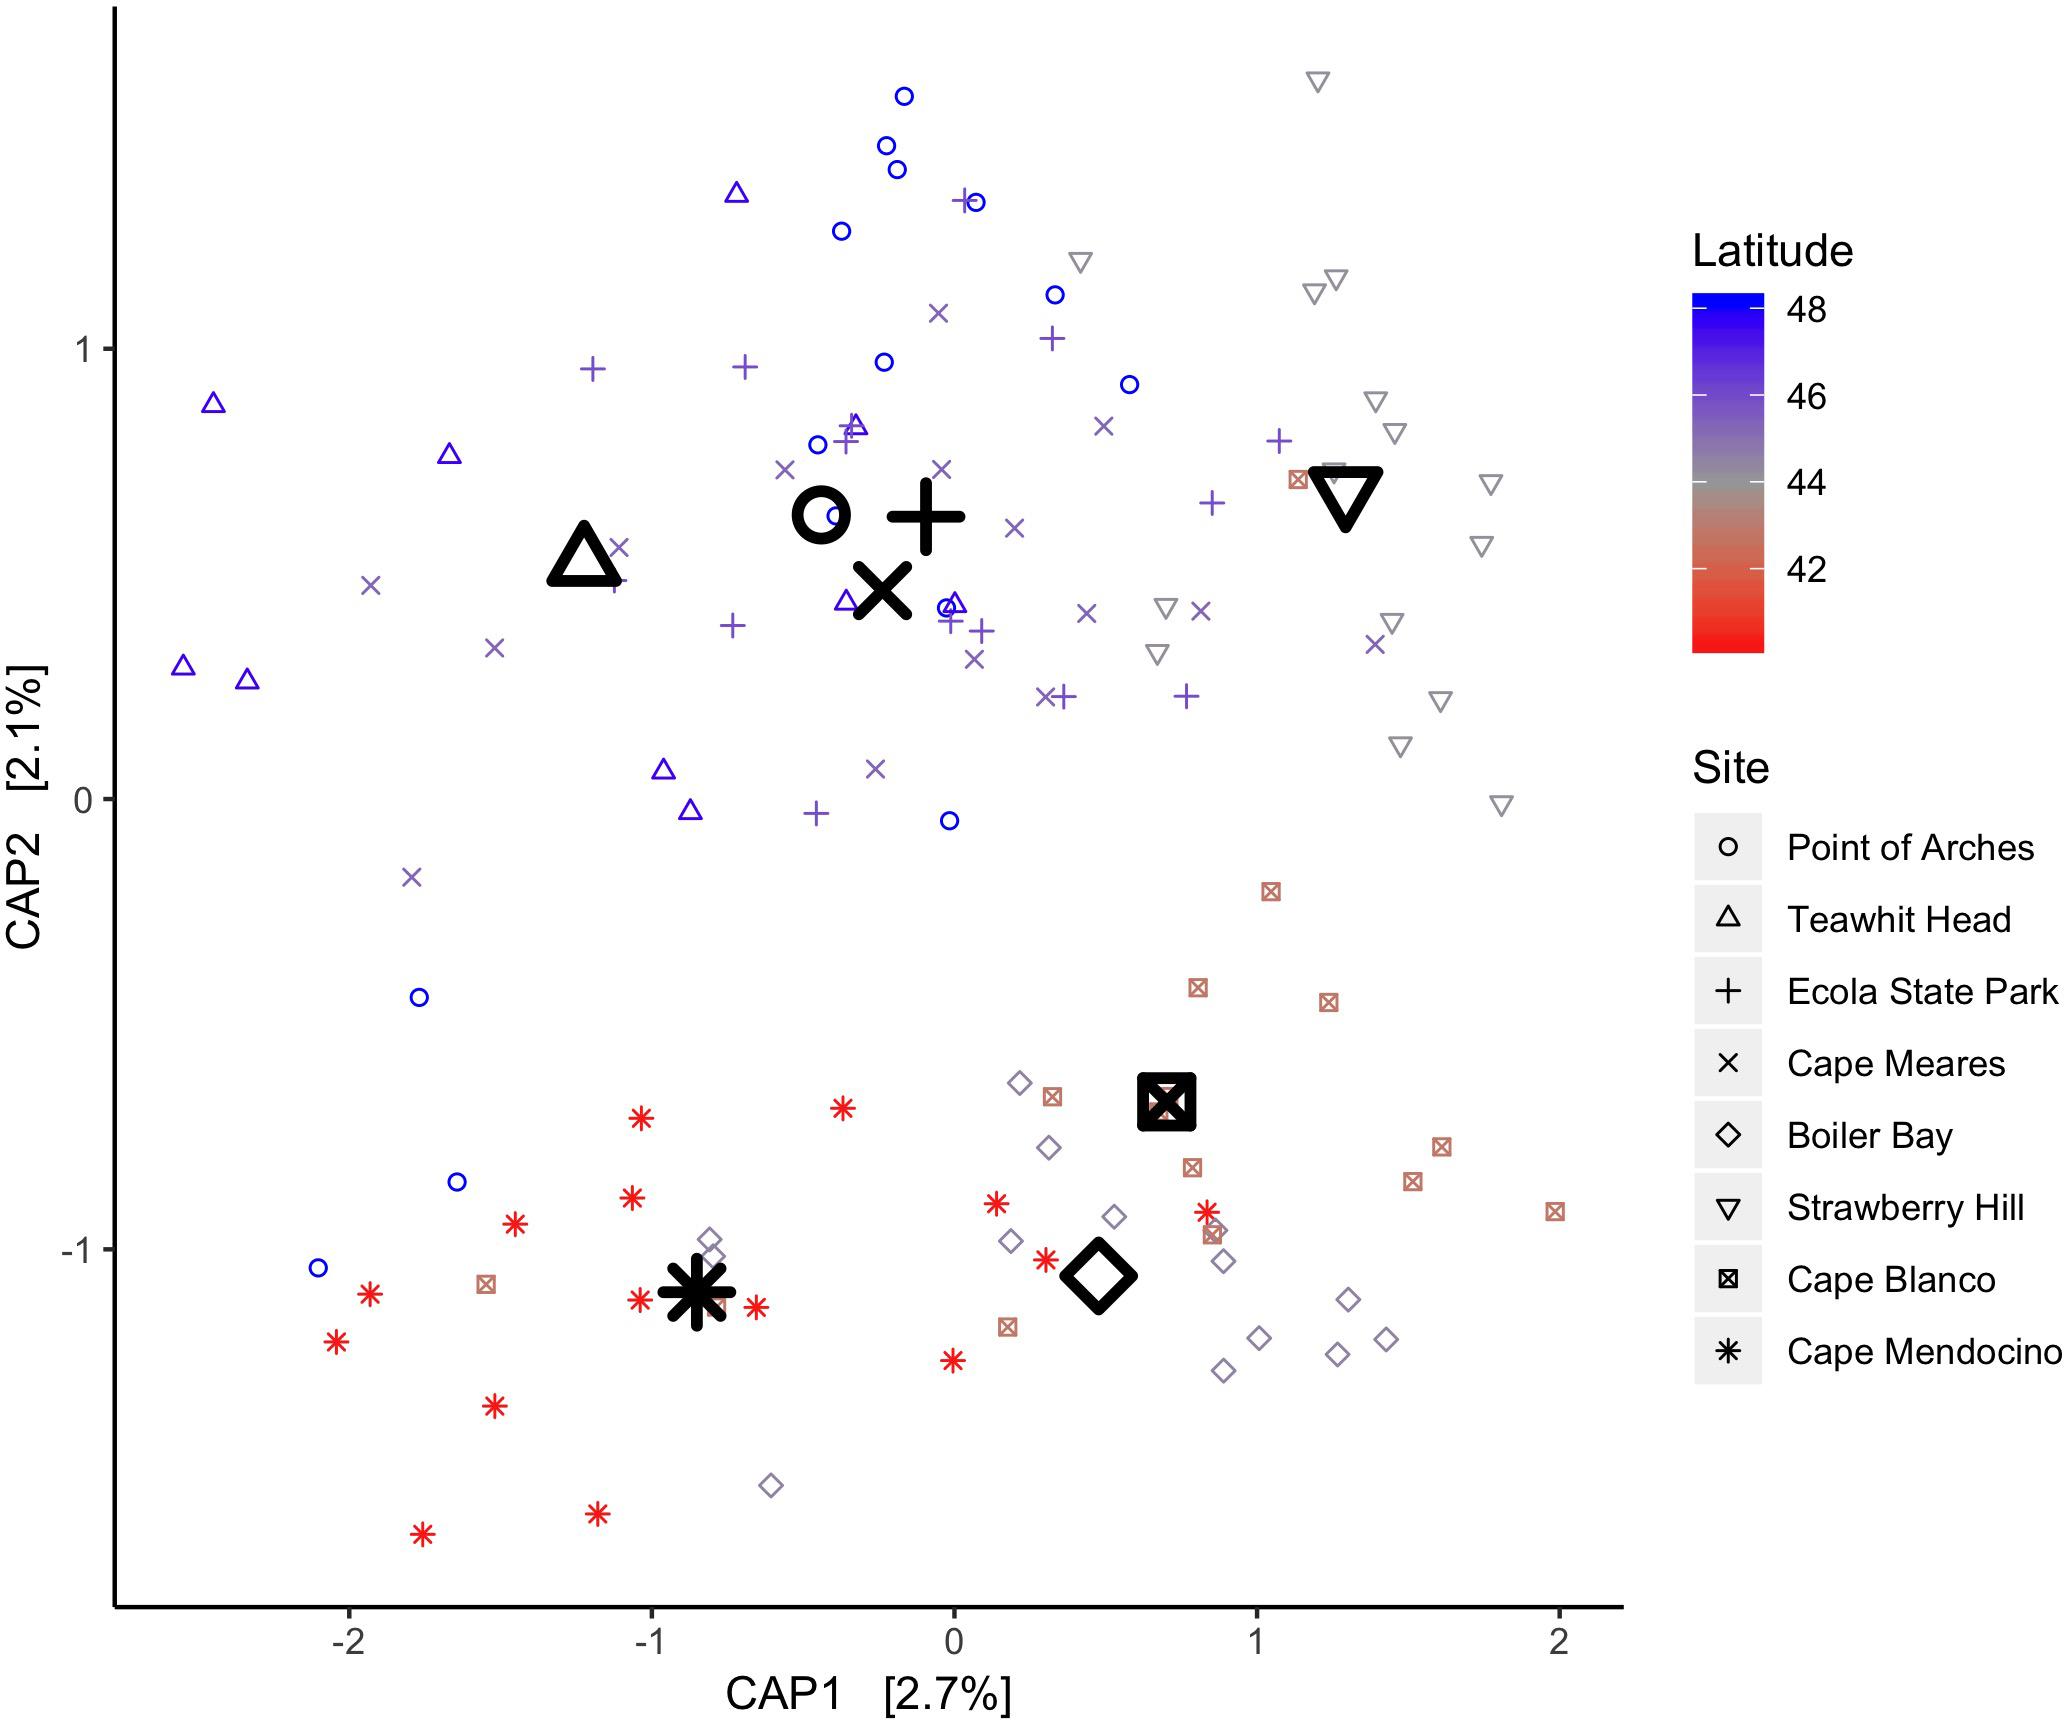
Figure 6. A CAP ordination on Bray-Curtis dissimilarities between A. elegantissima communities across latitudes reveals some structure. Latitude explains a small part of the variance across the range when treated as a quantitative variable (p = 0.002, R2 = 0.022). Site labels were placed at the centroids of samples from each location.
Finally, we conducted Mantel tests to test for correlations between geographic distances and beta diversity distances. We found significant positive correlations for Bray-Curtis (r = 0.10, p = 0.01), Jaccard (r = 0.10, p = 0.01), and Unweighted UniFrac (r = 0.16, p = 0.001) distances. Weighted UniFrac distances did not correlate with geographic distances (r = 0.03, p = 0.23).
Taxonomic Composition Is Relatively Stable Across Latitudes
We also examined the relationship between abundant phyla (defined as > 1% abundance) and latitude (Figure 7). Proteobacteria and Bacteroidetes were the dominant phyla, making up 56 and 25% of anemone-associated microbiomes respectively. We did not detect any relationship between abundances of these phyla and latitude (Spearman, FDR q-value > 0.2). Of the less abundant phyla, 3 correlated with latitude: Tenericutes (Spearman ρ = 0.39, FDR q-value = 0.002), Acidobacteria (Spearman ρ = 0.31, FDR q-value = 0.005), and Firmicutes (Spearman ρ = 0.22, FDR q-value = 0.086).
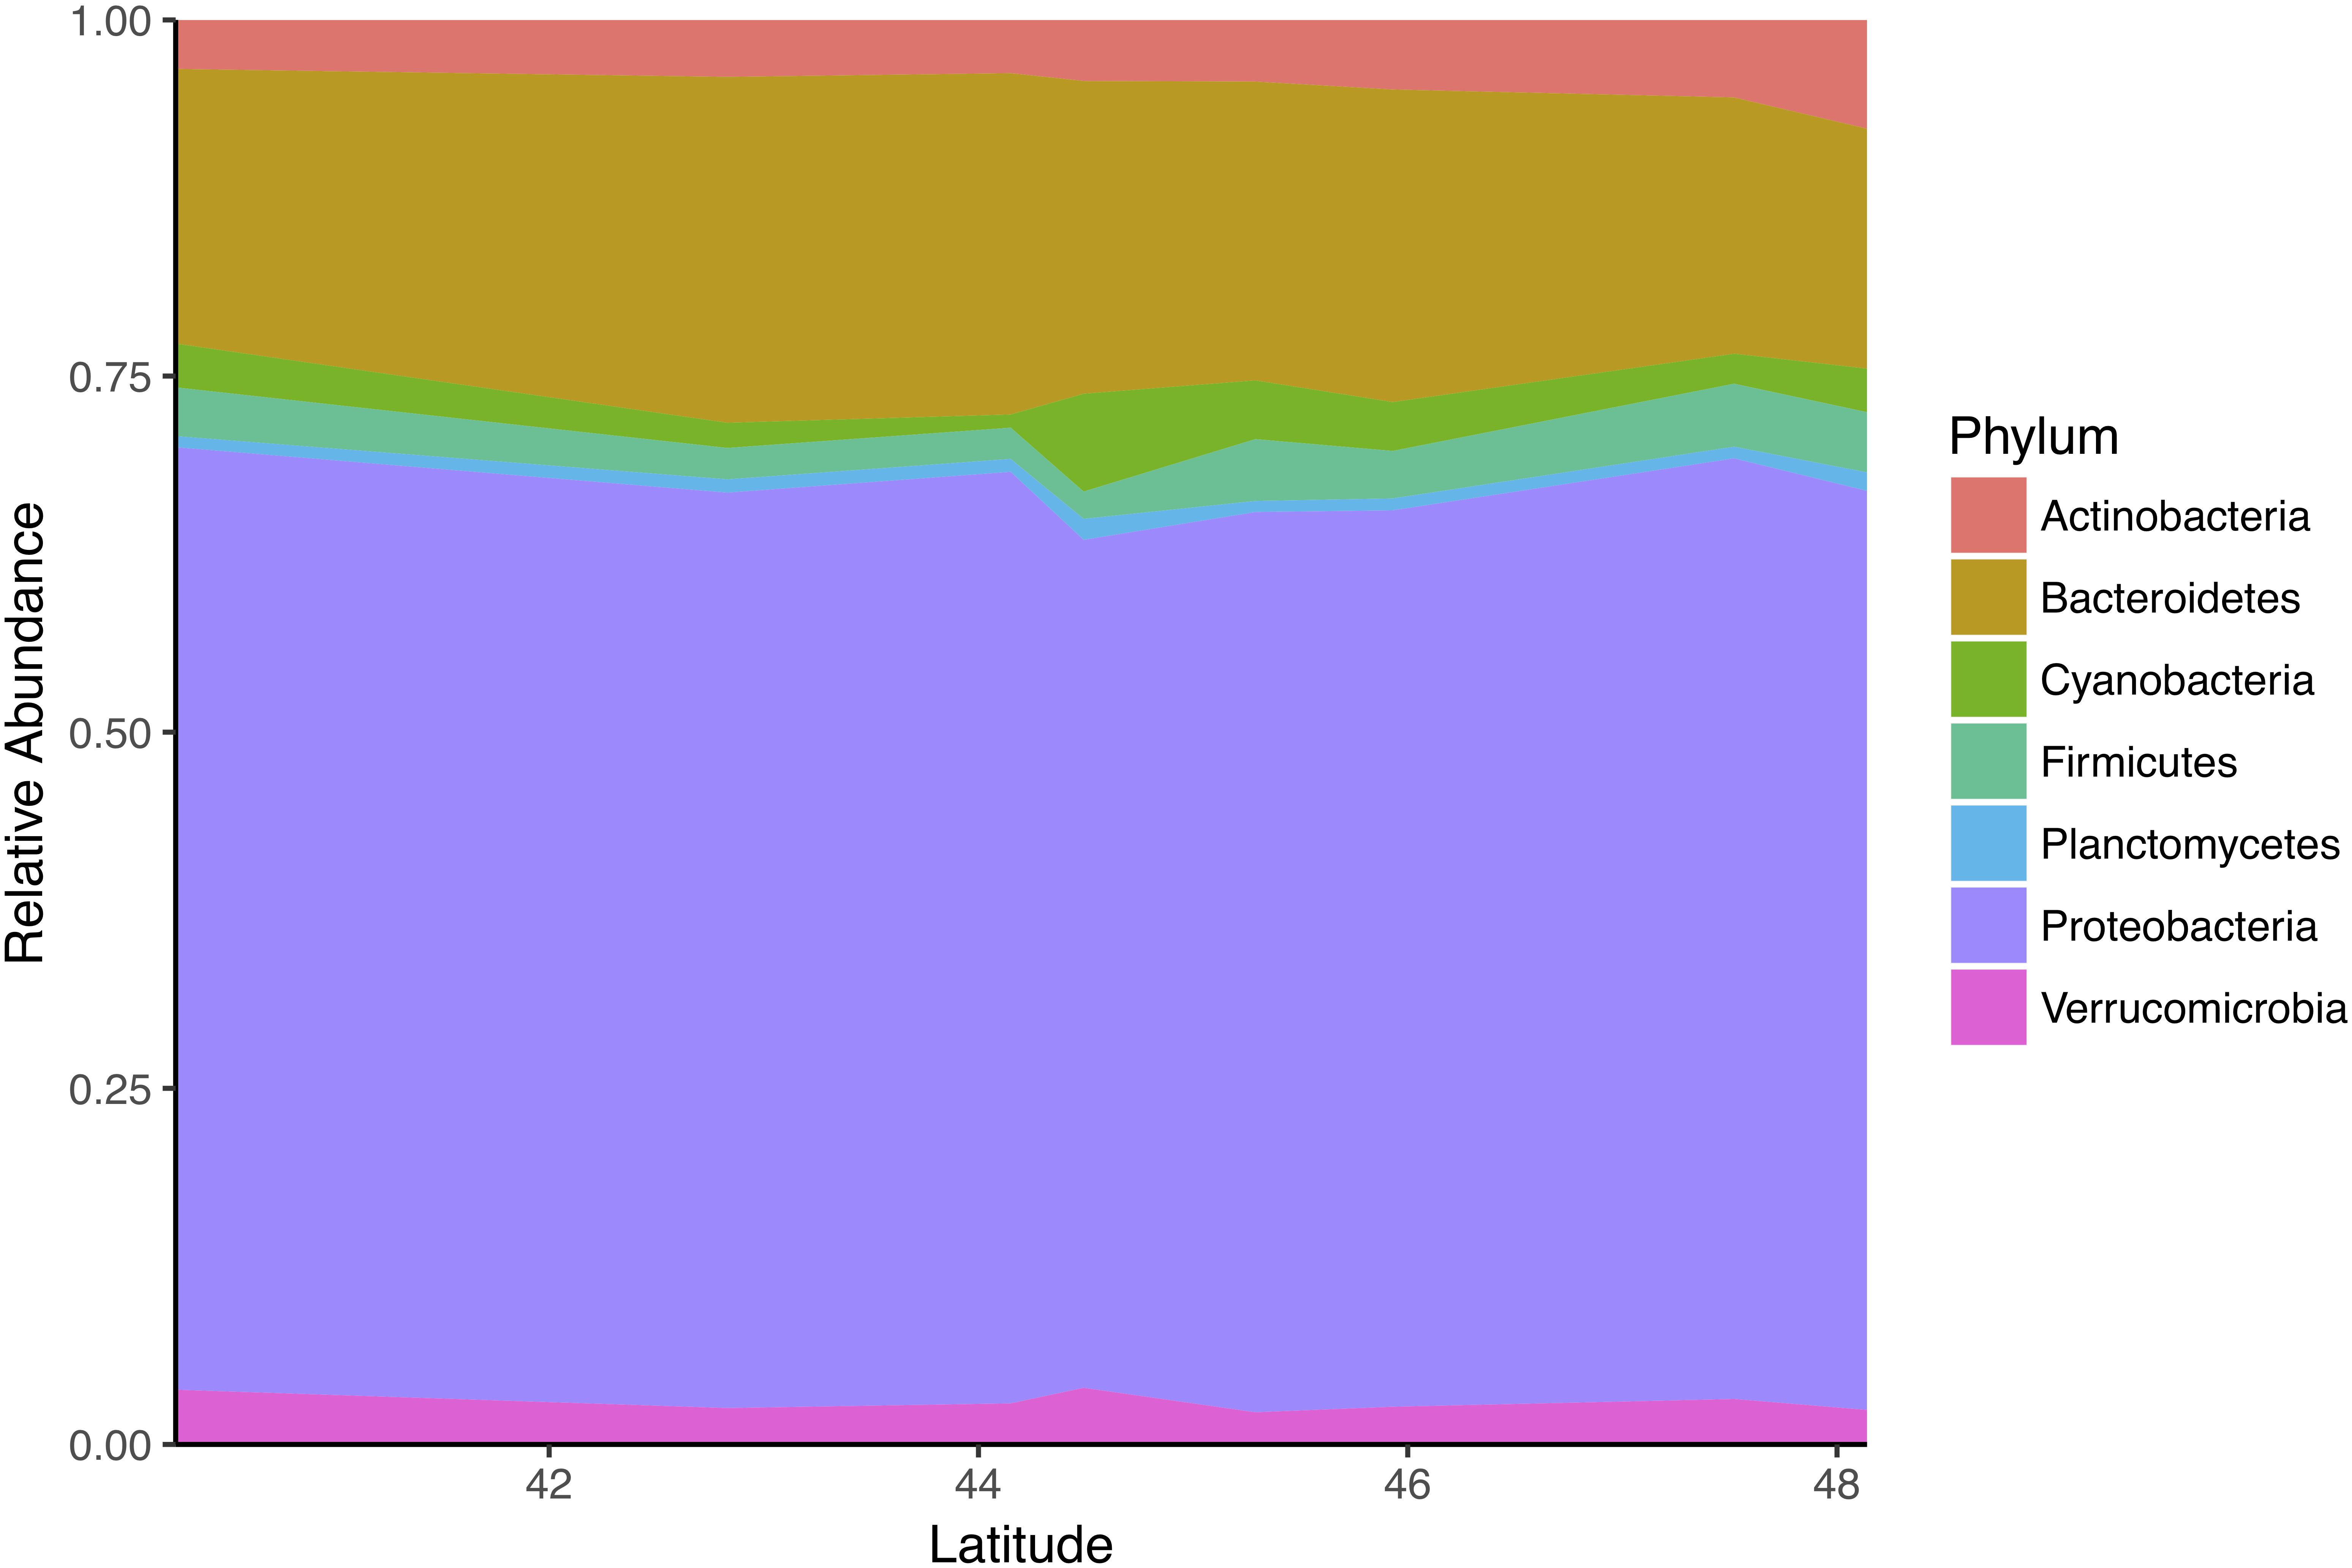
Figure 7. Taxonomic composition of communities associated with A. elegantissima is dominated by Proteobacteria and Bacteroidetes across latitudes.
Spearman correlation analyses were then used to test for monotonically increasing or decreasing abundances of orders present in at least 50% of samples across the sampled range. We identified eleven orders with a significant monotonic relationship with latitude (FDR q-value < 0.2) (Supplementary Data Sheet S4). We plotted the relative abundances and prevalences of the four orders with the highest relative abundances because correlations from low abundance and sparse features are more likely to be spurious (Aitchison, 1981) (Figure 8). Mycoplasmatales (FDR q-value = 2.7 × 10⁻⁴, ρ = 0.39) exhibited a positive trend in both prevalence and relative abundance. Legionellales (FDR q-value = 9.6 × 10⁻⁴, ρ = 0.31) displayed a unimodal distribution in both prevalence and relative abundances, peaking at the 45th–47th parallels. Abundances of Alteromonadales (FDR q-value = 4.9 × 10⁻⁸, ρ = -0.48) did not display a clear visual trend despite having the strongest relationship with latitude of the orders included in this analysis. Order Bacillales (FDR q-value = 1.2 × 10⁻¹, ρ = 0.22) had lower prevalence in lower latitudes, but differences in abundances were not visually apparent.
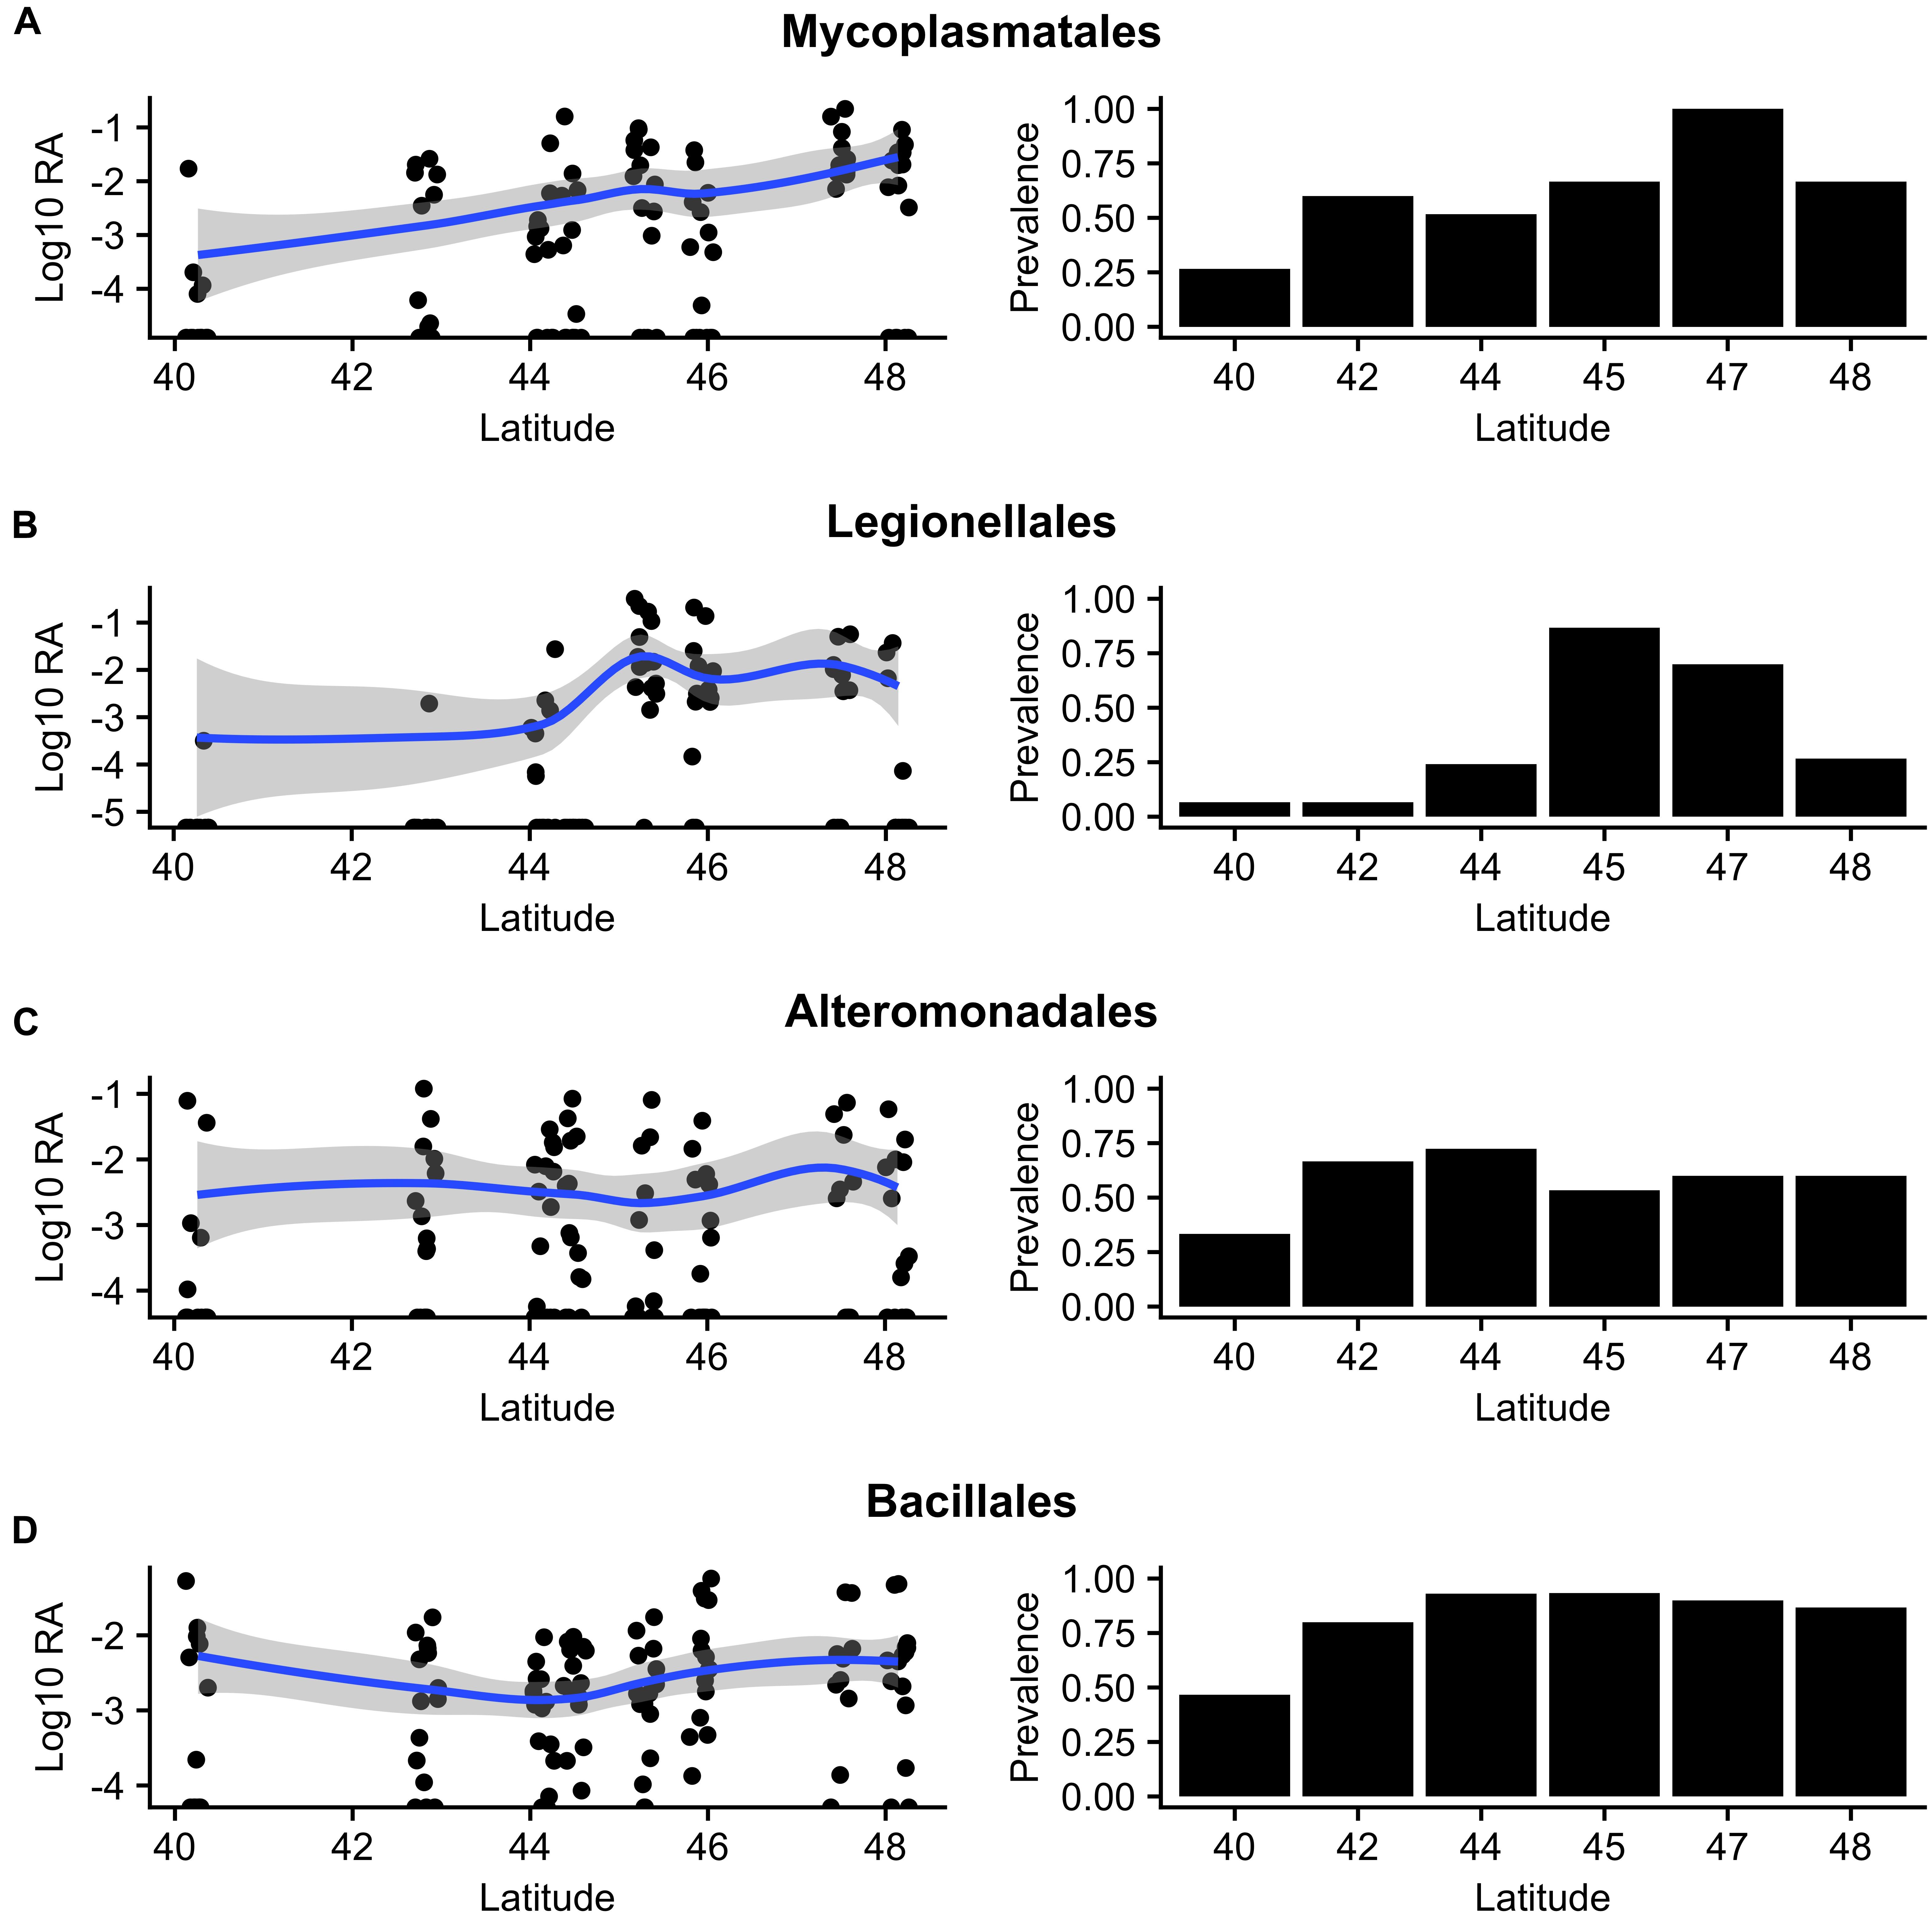
Figure 8. Log10 relative abundances (left) and prevalence (right) of the four most abundant core orders (prevalence > 50%) reveal trends in abundance and presence/absence across eight degrees of latitude: (A) Mycoplasmatales, (B) Legionellales, (C) Alteromonadales, and (D) Bacillales.
Discussion
Indicator Taxon Analyses Reveal Relationships Between Specific Taxa and Symbiotic State
We identified taxa associated with different symbiotic states. The order Legionellales, dominated by an OTU assigned to the genus Nebulobacter, was found to be associated with the brown symbiotic state. Bacteria in the genus Nebulobacter are typically symbionts of ciliates (Boscaro et al., 2012). This OTU also significantly correlated with latitude, appearing to exhibit a unimodal distribution across latitudes, with abundances and prevalence peaking between the 45th and 47th parallels.
Spirochaetales, Rhodocyclales, and an order in class Dehalococcoides (FS117-23b-02) were negatively associated with the green symbiotic state. Communities associated with the green symbiotic state displayed higher richness and comparable evenness to the other states, so on average, taxa are expected have lower relative abundances due to the compositional nature of rarefied data (Jackson, 1997). With this caveat, the complete absence of the order in Dehalococcoides in green-associated communities is striking, given that this order is present in abundances of almost 10% in some brown- and aposymbiotic- associated communities. The absence of this order in green-associated communities may well be symbiont-related, but without an observation in a controlled setting, this possibility is difficult to evaluate.
The order Thiohalorhabdales was found to be an indicator of symbiosis (i.e., associated with the brown or green symbiotic state). This order is made up of obligate sulfur-oxidizing bacteria, and has been found in high abundances on temperate corals (Sharp et al., 2017). Additionally, sulfur cycling has been previously identified as a discriminator between bacterial communities associated with symbiotic and aposymbiotic sea anemones (Röthig et al., 2016; Hadaidi et al., 2017).
The Microbiome of A. elegantissima Is Stable Across a Latitudinal Gradient of > 1000 km
The most abundant orders in the core microbiome of A. elegantissima—Flavobacterales, Rhodobacterales, Rhizobiales and Alteromonadales– are commonly found in coastal seawater (López-Pérez et al., 2016; Bryson et al., 2017), so we hypothesize that seawater surrounding the sea anemones influences the composition of their microbiomes.
We did not find any strong relationships between latitude and alpha diversity of communities associated with A. elegantissima. While richness is linked to latitude at a global scale (Ladau et al., 2013), no trend was found between richness and latitude in microbial communities of intertidal sand in California (Boehm et al., 2014). Our beta diversity analyses reveal an association between beta diversity and latitude. However, we observe that this association is very weak, suggesting that intra-site factors, such as wave action, may play an important role in shaping the microbial communities associated with these anemones. We did not find a significant relationship between Weighted UniFrac distances and geographic distances; this suggests a microbiome whose most abundant members do not vary with latitude. A significant correlation between Unweighted UniFrac distances and geographic distances suggests a low-abundance component of these microbiomes that does vary with latitude. Among the orders with abundances that significantly correlate with latitude, we did not observe clear monotonic trends, so we suspect that differences between sites are better explained by local ecological conditions. Indeed, habitat and substrate have previously been found to correlate with bacterial community structure in symbiotic corals (Roder et al., 2015). While we found a weak relationship between latitude and community structure, it may be fruitful to examine effects of habitat, land use and wave conditions on anemone-associated communities in future efforts; latitude, land use classification, wave conditions have previously been found to influence intertidal sand communities in California (Boehm et al., 2014). Finally, developmental stage has recently been found to be tightly coupled to microbial community structure in a symbiotic sea anemone (Mortzfeld et al., 2016), so this factor should be considered in future studies.
Elliptochloris-Associated Communities Exhibit Higher Richness Values
We found a significant association between symbiotic state and richness measures of anemone-associated microbial communities. Communities associated with anemones in the green symbiotic state had higher richness values than anemones in the brown or aposymbiotic states. We hypothesize that this is corresponding to a stressed state, because higher richness often associates with stress in coral-associated communities; this is thought to be due to a diminishing of microbiome regulation when hosts are stressed (McDevitt-Irwin et al., 2017). This is further supported when previous observations that anemones in the green symbiotic state favor sexual reproduction over asexual reproduction typical of the brown symbiotic state (Bingham et al., 2014), are considered alongside the strong correlation between stress and sexual reproduction in facultative sexual organisms (Ram and Hadany, 2016). Finally, Anthopleura elegantissima only stably associate with Elliptochloris in a narrow range of temperatures and irradiances, suggesting that the symbiosis with Elliptochloris is less favorable (Bates et al., 2010).
We found a robust association between symbiotic state and beta diversity with anemones in the green, brown, and aposymbiotic states having distinct community compositions. We propose that symbiont presence and type has a minor role in the selection of A. elegantissima- associated microbial communities or that microbial communities have a role in selection of algal symbionts. However, because we collected the samples from natural populations, we must consider the possibility that unexplored environmental factors are responsible for the differences in community composition that we observed. Furthermore, due to a relatively few number of samples collected in each symbiotic state (n = 5), these results must be interpreted with caution.
Conclusion
We identified a core microbiome of A. elegantissima across a >1000-km range. Beta diversity analyses reveal differences in the structure of bacterial communities across this range, but these differences may be better explained by between-site factors other than latitude. We detected associations between symbiotic state and the structure of microbial communities associated with A. elegantissima. Despite the significance of these associations, it is difficult to rule out confounding effects of habitat differences among the anemones in these symbiotic states. We suggest that a common garden experiment whereby anemones in different symbiotic states acclimate to identical conditions, then are bleached, would provide more certainty that the observed differences can be attributed to symbiotic state, and could be more readily compared to existing literature on cnidarian bleaching.
Data
Sequences and metadata were deposited at the National Center for Biotechnology Information Sequence Read Archive under BioProject accession number PRJNA508524.
Author Contributions
DD, IM, TS, and RVT conceived and designed the study. CG, TS, and RVT contributed to data analysis. IM conducted field and bench work, organized the data, performed data analysis, and drafted the manuscript. DD, CG, TS, and RVT provided critical revisions and approved the final manuscript.
Funding
Funding for this project was provided by Oregon Sea Grant NA14OAR4170064 (CFDA No. 11.417).
Conflict of Interest Statement
The authors declare that the research was conducted in the absence of any commercial or financial relationships that could be construed as a potential conflict of interest.
Acknowledgments
Shawn Gerrity led collections at Cape Mendocino, Cape Blanco, Boiler Bay, and Strawberry Hill. Trevor Tivey assisted with collections at Point of Arches, Teawhit Head, Cape Meares, and Haystack Rock. Virginia Weis and Mark Novak led the second Boiler Bay collection. Rory Welsh provided guidance regarding 16S PCR and analysis.
Supplementary Material
The Supplementary Material for this article can be found online at: https://www.frontiersin.org/articles/10.3389/fmars.2019.00007/full#supplementary-material
FIGURE S1 | Taxonomic composition of OTUs identified as contaminants.
DATA SHEET S1 | Metadata, including site, latitude, symbiotic state, sequencing depth, and alpha diversity metrics for each sample.
DATA SHEET S2 | Orders core to the microbiome of A. elegantissima.
DATA SHEET S3 | Taxa found to be indicators of symbiotic state.
DATA SHEET S4 | Orders with abundances correlating with latitude.
References
Ainsworth, T., and Hoegh-Guldberg, O. (2009). Bacterial communities closely associated with coral tissues vary under experimental and natural reef conditions and thermal stress. Aquat. Biol. 4, 289–296. doi: 10.3354/ab00102
Ainsworth, T., Krause, L., Bridge, T., Torda, G., Raina, J.-B., Zakrzewski, M., et al. (2015). The coral core microbiome identifies rare bacterial taxa as ubiquitous endosymbionts. ISME J. 9, 2261–2274. doi: 10.1038/ismej.2015.39
Aitchison, J. (1981). A new approach to null correlations of proportions. J. Int. Assoc. Math. Geol. 13, 175–189. doi: 10.1007/BF01031393
Altschul, S. F., Gish, W., Miller, W., Myers, E. W., and Lipman, D. J. (1990). Basic local alignment search tool. J. Mol. Biol. 215, 403–410. doi: 10.1016/S0022-2836(05)80360-2
Auer, L., Mariadassou, M., O’Donohue, M., Klopp, C., and Hernandez-Raquet, G. (2017). Analysis of large 16S rRNA Illumina data sets: impact of singleton read filtering on microbial community description. Mol. Ecol. Resour. 17, e122–e132. doi: 10.1111/1755-0998.12700
Bates, A. E., Mclean, L., Laing, P., Raeburn, L. A., and Hare, C. (2010). Distribution patterns of zoochlorellae and zooxanthellae hosted by two pacific northeast anemones, Anthopleura elegantissima and A. xanthogrammica. Biol. Bull. 218, 237–247. doi: 10.1086/BBLv218n3p237
Bingham, B. L., Dimond, J. L., and Muller-Parker, G. (2014). Symbiotic state influences life-history strategy of a clonal cnidarian. Proc. R. Soc. B Biol. Sci. 281:20140548. doi: 10.1098/rspb.2014.0548
Bingham, B. L., Freytes, I., Emery, M., Dimond, J., and Muller-Parker, G. (2011). Aerial exposure and body temperature of the intertidal sea anemone Anthopleura elegantissima. Invertebr. Biol. 130, 291–301. doi: 10.1111/j.1744-7410.2011.00241.x
Boehm, A. B., Yamahara, K. M., and Sassoubre, L. M. (2014). Diversity and transport of microorganisms in intertidal sands of the California coast. Appl. Environ. Microbiol. 80, 3943–3951. doi: 10.1128/AEM.00513-14
Bokulich, N. A., Kaehler, B. D., Rideout, J. R., Dillon, M., Bolyen, E., Knight, R., et al. (2018). Optimizing taxonomic classification of marker gene amplicon sequences. PeerJ Prepr. 6:e3208v2.
Boscaro, V., Vannini, C., Fokin, S. I., Verni, F., and Petroni, G. (2012). Characterization of “Candidatus Nebulobacter yamunensis” from the cytoplasm of Euplotes aediculatus (Ciliophora, Spirotrichea) and emended description of the family Francisellaceae. Syst. Appl. Microbiol. 35, 432–440. doi: 10.1016/j.syapm.2012.07.003
Bryson, S., Li, Z., Chavez, F., Weber, P. K., Pett-Ridge, J., Hettich, R. L., et al. (2017). Phylogenetically conserved resource partitioning in the coastal microbial loop. ISME J. 11, 2781–2792. doi: 10.1038/ismej.2017.128
Caporaso, J. G., Kuczynski, J., Stombaugh, J., Bittinger, K., Bushman, F. D., Costello, E. K., et al. (2010). QIIME allows analysis of high-throughput community sequencing data. Nat. Methods 7, 335–336. doi: 10.1038/nmeth.f.303
De Cáceres, M., and Legendre, P. (2009). Associations between species and groups of sites: indices and statistical inference. Ecology 90, 3566–3574. doi: 10.1890/08-1823.1
De Cáceres, M., Legendre, P., and Moretti, M. (2010). Improving indicator species analysis by combining groups of sites. Oikos 119, 1674–1684. doi: 10.1111/j.1600-0706.2010.18334.x
Dimond, J. L., Bingham, B. L., le Muller-Parker, G., and Oakley, C. A. (2013). Symbiont physiology and population dynamics before and during symbiont shifts in a flexible algal-cnidarian symbiosis. J. Phycol. 49, 1074–1083. doi: 10.1111/jpy.12112
Dimond, J. L., Bingham, B. L., Muller-Parker, G., Wuesthoff, K., and Francis, L. (2011). Seasonal stability of a flexible algal-cnidarian symbiosis in a highly variable temperate environment. Limnol. Oceanogr. 56, 2233–2242. doi: 10.4319/lo.2011.56.6.2233
Dufrêne, M., and Legendre, P. (1997). Species assemblages and indicator species: the need for a flexible asymmetrical approach. Ecol. Monogr. 67, 345–366. doi: 10.2307/2963459
Edgar, R. C., Haas, B. J., Clemente, J. C., Quince, C., and Knight, R. (2011). UCHIME improves sensitivity and speed of chimera detection. Bioinformatics 27, 2194–2200. doi: 10.1093/bioinformatics/btr381
Frydenborg, B. R., Krediet, C. J., Teplitski, M., and Ritchie, K. B. (2014). Temperature-dependent inhibition of opportunistic Vibrio pathogens by native coral commensal bacteria. Microb. Ecol. 67, 392–401. doi: 10.1007/s00248-013-0334-9
Glasl, B., Herndl, G. J., and Frade, P. R. (2016). The microbiome of coral surface mucus has a key role in mediating holobiont health and survival upon disturbance. ISME J. 10, 2280–2292. doi: 10.1038/ismej.2016.9
Hadaidi, G., Röthig, T., Yum, L. K., Ziegler, M., Arif, C., Roder, C., et al. (2017). Stable mucus-associated bacterial communities in bleached and healthy corals of Porites lobata from the Arabian Seas. Sci. Rep. 7:45362. doi: 10.1038/srep45362
Jackson, D. A. (1997). Compositional data in community ecology: the paradigm or peril of proportions? Ecology 78, 929–940.
Kozich, J. J., Westcott, S. L., Baxter, N. T., Highlander, S. K., and Schloss, P. D. (2013). Development of a dual-index sequencing strategy and curation pipeline for analyzing amplicon sequence data on the MiSeq Illumina sequencing platform. Appl. Environ. Microbiol. 79, 5112–5120. doi: 10.1128/AEM.01043-13
Ladau, J., Sharpton, T. J., Finucane, M. M., Jospin, G., Kembel, S. W., O’Dwyer, J., et al. (2013). Global marine bacterial diversity peaks at high latitudes in winter. ISME J. 7, 1669–1677. doi: 10.1038/ismej.2013.37
Lema, K. A., Willis, B. L., and Bourne, D. G. (2012). Corals form characteristic associations with symbiotic nitrogen-fixing bacteria. Appl. Environ. Microbiol. 78, 3136–3144. doi: 10.1128/AEM.07800-11
López-Pérez, M., Kimes, N. E., Haro-Moreno, J. M., and Rodriguez-Valera, F. (2016). Not all particles are equal: the selective enrichment of particle-associated bacteria from the Mediterranean sea. Front. Microbiol. 7:996. doi: 10.3389/fmicb.2016.00996
Mahé, F., Rognes, T., Quince, C., de Vargas, C., and Dunthorn, M. (2014). Swarm: robust and fast clustering method for amplicon-based studies. PeerJ 2:e593. doi: 10.7717/peerj.593
McDevitt-Irwin, J. M., Baum, J. K., Garren, M., and Vega Thurber, R. L. (2017). Responses of coral-associated bacterial communities to local and global stressors. Front. Mar. Sci. 4:262. doi: 10.3389/fmars.2017.00262
Mortzfeld, B. M., Urbanski, S., Reitzel, A. M., Künzel, S., Technau, U., and Fraune, S. (2016). Response of bacterial colonization in Nematostella vectensis to development, environment and biogeography: bacterial colonization in Nematostella vectensis. Environ. Microbiol. 18, 1764–1781. doi: 10.1111/1462-2920.12926
Oksanen, J., Blanchet, G., Friendly, M., Kindt, R., Legendre, P., McGlinn, D., et al. (2018). vegan: Community Ecology Package. Available at: https://CRAN.R-project.org/package=vegan
Paine, R. T. (1974). Intertidal community structure: experimental studies on the relationship between a dominant competitor and its principal predator. Oecologia 15, 93–120. doi: 10.1007/BF00345739
Pootakham, W., Mhuantong, W., Yoocha, T., Putchim, L., Sonthirod, C., Naktang, C., et al. (2017). High resolution profiling of coral-associated bacterial communities using full-length 16S rRNA sequence data from PacBio SMRT sequencing system. Sci. Rep. 7:2774. doi: 10.1038/s41598-017-03139-4
Quast, C., Pruesse, E., Yilmaz, P., Gerken, J., Schweer, T., Yarza, P., et al. (2012). The SILVA ribosomal RNA gene database project: improved data processing and web-based tools. Nucleic Acids Res. 41, D590–D596. doi: 10.1093/nar/gks1219
Ram, Y., and Hadany, L. (2016). Condition-dependent sex: who does it, when and why? Philos. Trans. R. Soc. B Biol. Sci. 371:20150539. doi: 10.1098/rstb.2015.0539
Roder, C., Bayer, T., Aranda, M., Kruse, M., and Voolstra, C. R. (2015). Microbiome structure of the fungid coral Ctenactis echinata aligns with environmental differences. Mol. Ecol. 24, 3501–3511. doi: 10.1111/mec.13251
Rohwer, F., Seguritan, V., Azam, F., and Knowlton, N. (2002). Diversity and distribution of coral-associated bacteria. Mar. Ecol. Prog. Ser. 243, 1–10. doi: 10.3354/meps243001
Röthig, T., Costa, R. M., Simona, F., Baumgarten, S., Torres, A. F., Radhakrishnan, A., et al. (2016). Distinct bacterial communities associated with the coral model Aiptasia in aposymbiotic and symbiotic states with Symbiodinium. Front. Mar. Sci. 3:234. doi: 10.3389/fmars.2016.00234
Rypien, K. L., Ward, J. R., and Azam, F. (2010). Antagonistic interactions among coral-associated bacteria. Environ. Microbiol. 12, 28–39. doi: 10.1111/j.1462-2920.2009.02027.x
Salter, S. J., Cox, M. J., Turek, E. M., Calus, S. T., Cookson, W. O., Moffatt, M. F., et al. (2014). Reagent and laboratory contamination can critically impact sequence-based microbiome analyses. BMC Biol. 12:87. doi: 10.1186/s12915-014-0087-z
Shade, A., and Handelsman, J. (2012). Beyond the Venn diagram: the hunt for a core microbiome: the hunt for a core microbiome. Environ. Microbiol. 14, 4–12. doi: 10.1111/j.1462-2920.2011.02585.x
Sharp, K. H., Pratte, Z. A., Kerwin, A. H., Rotjan, R. D., and Stewart, F. J. (2017). Season, but not symbiont state, drives microbiome structure in the temperate coral Astrangia poculata. Microbiome 5:120. doi: 10.1186/s40168-017-0329-8
Keywords: cnidaria, microbiome analysis, Symbiodinium, symbiosis, rocky interdial zone, 16S
Citation: Morelan IA, Gaulke CA, Sharpton TJ, Vega Thurber R and Denver DR (2019) Microbiome Variation in an Intertidal Sea Anemone Across Latitudes and Symbiotic States. Front. Mar. Sci. 6:7. doi: 10.3389/fmars.2019.00007
Received: 16 July 2018; Accepted: 11 January 2019;
Published: 30 January 2019.
Edited by:
David William Waite, The University of Auckland, New ZealandReviewed by:
Robert W. Thacker, Stony Brook University, United StatesSebastian Fraune, Christian-Albrechts-Universität zu Kiel, Germany
Carolina Bastidas, Massachusetts Institute of Technology, United States
Copyright © 2019 Morelan, Gaulke, Sharpton, Vega Thurber and Denver. This is an open-access article distributed under the terms of the Creative Commons Attribution License (CC BY). The use, distribution or reproduction in other forums is permitted, provided the original author(s) and the copyright owner(s) are credited and that the original publication in this journal is cited, in accordance with accepted academic practice. No use, distribution or reproduction is permitted which does not comply with these terms.
*Correspondence: Ian A. Morelan, bW9yZWxhbmlAb3JlZ29uc3RhdGUuZWR1
 Ian A. Morelan
 Christopher A. Gaulke2
 Thomas J. Sharpton