 Karin E. Limburg
 Michele Casini
94% of researchers rate our articles as excellent or good
Learn more about the work of our research integrity team to safeguard the quality of each article we publish.
Find out more
ORIGINAL RESEARCH article
Front. Mar. Sci. , 18 December 2018
Sec. Global Change and the Future Ocean
Volume 5 - 2018 | https://doi.org/10.3389/fmars.2018.00482
This article is part of the Research Topic Facing Marine Deoxygenation View all 15 articles
The Baltic Sea contains the world’s largest anthropogenic deoxygenated zone, with increasing episodes and areal extent of hypoxia/anoxia. Atlantic cod in the Baltic has suffered a loss in condition which has been attributed mainly to hypoxia. Otoliths, the aragonitic structures that form part of the hearing/balance system in fishes, accumulate Mn in the presence of hypoxia and other reducing environments. Otoliths grow over the lifetime of fishes, and thus life-long records of hypoxia exposure exist for each individual fish. However, otolith Mn/Ca ratios are also sensitive to growth effects. We tested a new proxy to at least partially account for growth: Mn/Mg, since Mg levels reflect metabolic activity but not hypoxia. This and other elemental proxies were parsed annually from the otoliths to reconstruct lifetime histories of mean, maximum, and cumulative values of this proxy as well as others (Sr/Ca) that inform us about salinity conditions. We analyzed cod from five different time periods: Neolithic (4500 YBP, a normoxic baseline), 1980s, 1990s, 2000s, and 2010s – under different hypoxia intensities, assessing fish growth and condition in relation to hypoxia experience recorded by otolith proxies. Fish growth decreased with increasing hypoxia exposure; condition at capture (measured by Fulton’s K index) showed a strongly positive relation to growth indexed by magnesium (Mg/Ca). We conclude that cod otolith chemistry proxies not only inform about the hypoxia, growth, and metabolic status of cod, retrospectively throughout life, but also reflect the worsening situation for cod in the Baltic.
Hypoxia, or the occurrence of low oxygen levels in water, is spreading rapidly worldwide (Breitburg et al., 2018). Long recognized as a result of biochemical oxygen demand from organic pollution, hypoxia and the larger phenomenon of deoxygenation (loss of oxygen) are strongly affected by warming waters due to climate change. Although responses to hypoxia by fish and fisheries in many systems have been complex and thus difficult to interpret (Breitburg et al., 2009), there is increasing evidence that fishes exposed to hypoxia experience loss of habitat (a.k.a. habitat compression, Eby and Crowder, 2002; Diaz and Rosenberg, 2008; Stramma et al., 2012; Casini et al., 2016b) at times with concomitant declines in physical condition (e.g., Casini et al., 2016b).
The Baltic Sea ranks among the largest marine areas to have increased in hypoxic intensity and extent, from 5,000 to >60,000 km2 in its major basins over the past century (Carstensen et al., 2014). Freshwater inflows from the drainage basin contain nutrients that stimulate production (Hong et al., 2017), eventually resulting in microbial respiration that depletes oxygen (Conley et al., 2009). Major inflows of oxygenated seawater through the Danish Straits provide temporary relief, but reoxygenated episodes have in the past two decades been rare or of shorter duration than anticipated, due to complex mixing and stagnation (Conley et al., 2009; Schmale et al., 2016). Consequently, as warming continues, Baltic hypoxia is likely to continue and intensify, with increased areas of hypoxic, anoxic, and sulfidic waters.
Of the fish species present in the Baltic Sea, the Eastern Baltic cod (Gadus morhua) (hereafter referred to as Baltic cod) is arguably the most affected by this situation. A demersal (near-bottom dwelling) apex fish predator, Baltic cod require salinities ≥11 for successful spawning (Nissling and Westin, 1997), typically at depths >80 m in the brackish Baltic proper. Increasingly, these depths are subject to seasonal hypoxia, and the volume available to successful reproduction has diminished (cf. Köster et al., 2005; Plikshs et al., 2015). Additionally, suitable nursery and adult habitats have declined by 30% (Casini et al., 2016b; Hinrichsen et al., 2017). Beyond hypoxia per se, cod have undergone other ecological changes over the past ca. 40 years, such that diet shifted from one dominated by benthos in the 1970s and 1980s to one dominated by pelagic species, most recently sprat (Sprattus sprattus; cf. Pachur and Horbowy, 2013). Today it appears that a combination of reduced prey availability, increased parasite burdens, and hypoxia have contributed to a worsening Baltic cod population status (Eero et al., 2015; Casini et al., 2016b). Indeed, Baltic cod may represent one of the most severely impacted fish populations documented to date (cf. Breitburg et al., 2009; Altenritter et al., 2018).
Exploited fish populations (stocks) are subject to regular status assessments, so that appropriate fishing exploitation levels can be set. Stock assessments are usually based on age-based demographic characteristics. Fish age is normally determined by counting pairs of opaque and translucent rings in otoliths, which are aragonitic (CaCO3), incrementing structures inside fish heads. Part of the hearing and balance system in modern fishes, otoliths grow as the fish grows, providing a unique history for each individual (Campana and Neilson, 1985); and over 8 × 10⁵ otoliths are aged annually for stock assessments by major fisheries labs around the world (Campana and Thorrold, 2001). Baltic cod otoliths, always somewhat difficult to age (Hüssy, 2010), became increasingly unreadable through the 2000s (Hüssy et al., 2016). In 2014, the stock assessment failed, due in great part to large uncertainties and inconsistencies in age determination (International Council for the Exploration of the Seas [ICES], 2014; Eero et al., 2015; Hüssy et al., 2016).
Besides tracking age and thus growth rates, otoliths also take up minor and trace elements as well as isotopes that can be interpreted in the context of experienced environment, fish physiology, or a combination thereof (Campana, 1999; Campana and Thorrold, 2001). Within the field of otolith research, questions of the relative influence of internal vs. external controls on otolith chemistry are topics of current interest (e.g., Sturrock et al., 2015; Grammer et al., 2017; Izzo et al., 2018). Increasingly, investigations of lifetime variations in otolith chemistry, either through taking transects of points along an otolith growth axis, or 2-D mapping of elemental concentrations (Limburg and Elfman, 2017), open up new and powerful insights into the complexities of fish life history (e.g., Campana and Thorrold, 2001; Elsdon et al., 2008; Pracheil et al., 2014).
Limburg et al. (2011, 2015) identified the trace element manganese, in ratio to calcium (Mn/Ca), as a potentially reliable proxy for hypoxia, regardless of salinity. Trace elements typically enter otoliths in dissolved form after uptake via the gills (Campana, 1999); and the dissolved forms of manganese are reduced (Trouwborst et al., 2006; Reddy and DeLaune, 2008). Nevertheless, incorporation of Mn into otoliths is also sensitive to growth (Limburg et al., 2011, 2015). In the present paper, we develop a new proxy that partially corrects for growth, based on evidence that another trace element, magnesium, reflects metabolic activity (Limburg et al., 2018). Here, we test the efficacy of different proxies (annual Mn/Ca, annual Mn/Mg, and lifetime-cumulative versions of same), as well as Mg/Ca, to document (1) exposure to hypoxia, (2) correlations to fish condition, a measure that is made only once – at the time of fish capture, and (3) possible effects of hypoxia on growth. We also develop a heuristic model as a dynamic hypothesis, that manganese uptake (and hence, the proxies) is a function of both exogenous (biogeochemical) and endogenous (physiological) controls.
Baltic Sea cod otoliths were collated from several sources (Table 1). A majority came from the archives of the Department of Aquatic Resources, Swedish University of Agricultural Sciences (SLU, previously the research division of the Swedish Board of Fisheries until 2011). Of this collection, most (N = 214) were chosen originally to follow particular year-classes (1985, 1988, 1991, and 2005) as they aged; another 108 were selected to contrast condition factor (high or low); 11 collected in the Åland Sea in the northern Baltic proper in 2013; and four were collected in 2017, thus extending the time span of observation. Otoliths were aged using a combination of visual and chemical markers of seasonality (Heimbrand et al., unpublished), identifying contrasting “peaks” and “valleys” demarcating seasons; for an example, see Mg/Ca seasonal variations in Limburg et al. (2018). Finally, 10 well-preserved otoliths from a previous study of Neolithic cod (Limburg et al., 2008) were also analyzed, to examine otolith chemistry during a previous, hypoxia-free baseline period (Limburg et al., 2011). Although most of the modern material came from the southern Baltic proper (subdivision 25; Figure 1), some samples also came from the central and northern parts of the Baltic proper (subdivisions 26–29). The Neolithic otoliths came from subdivision 27 (Figure 1).
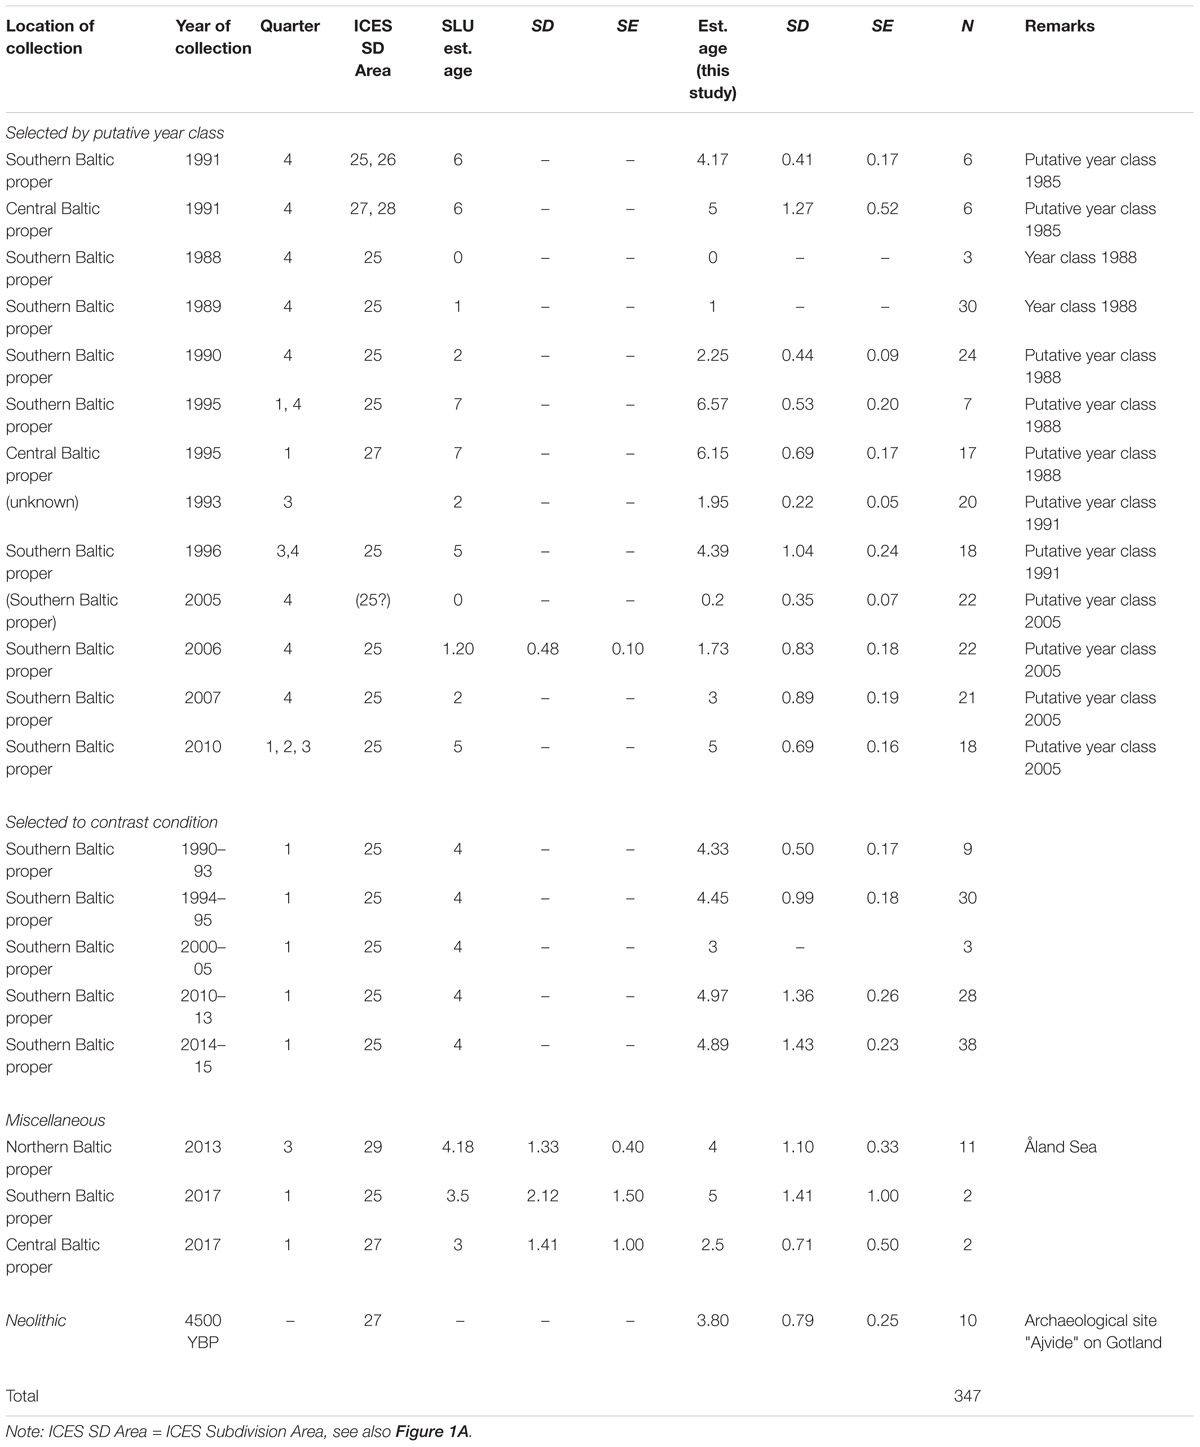
Table 1. Otolith samples used in this study.
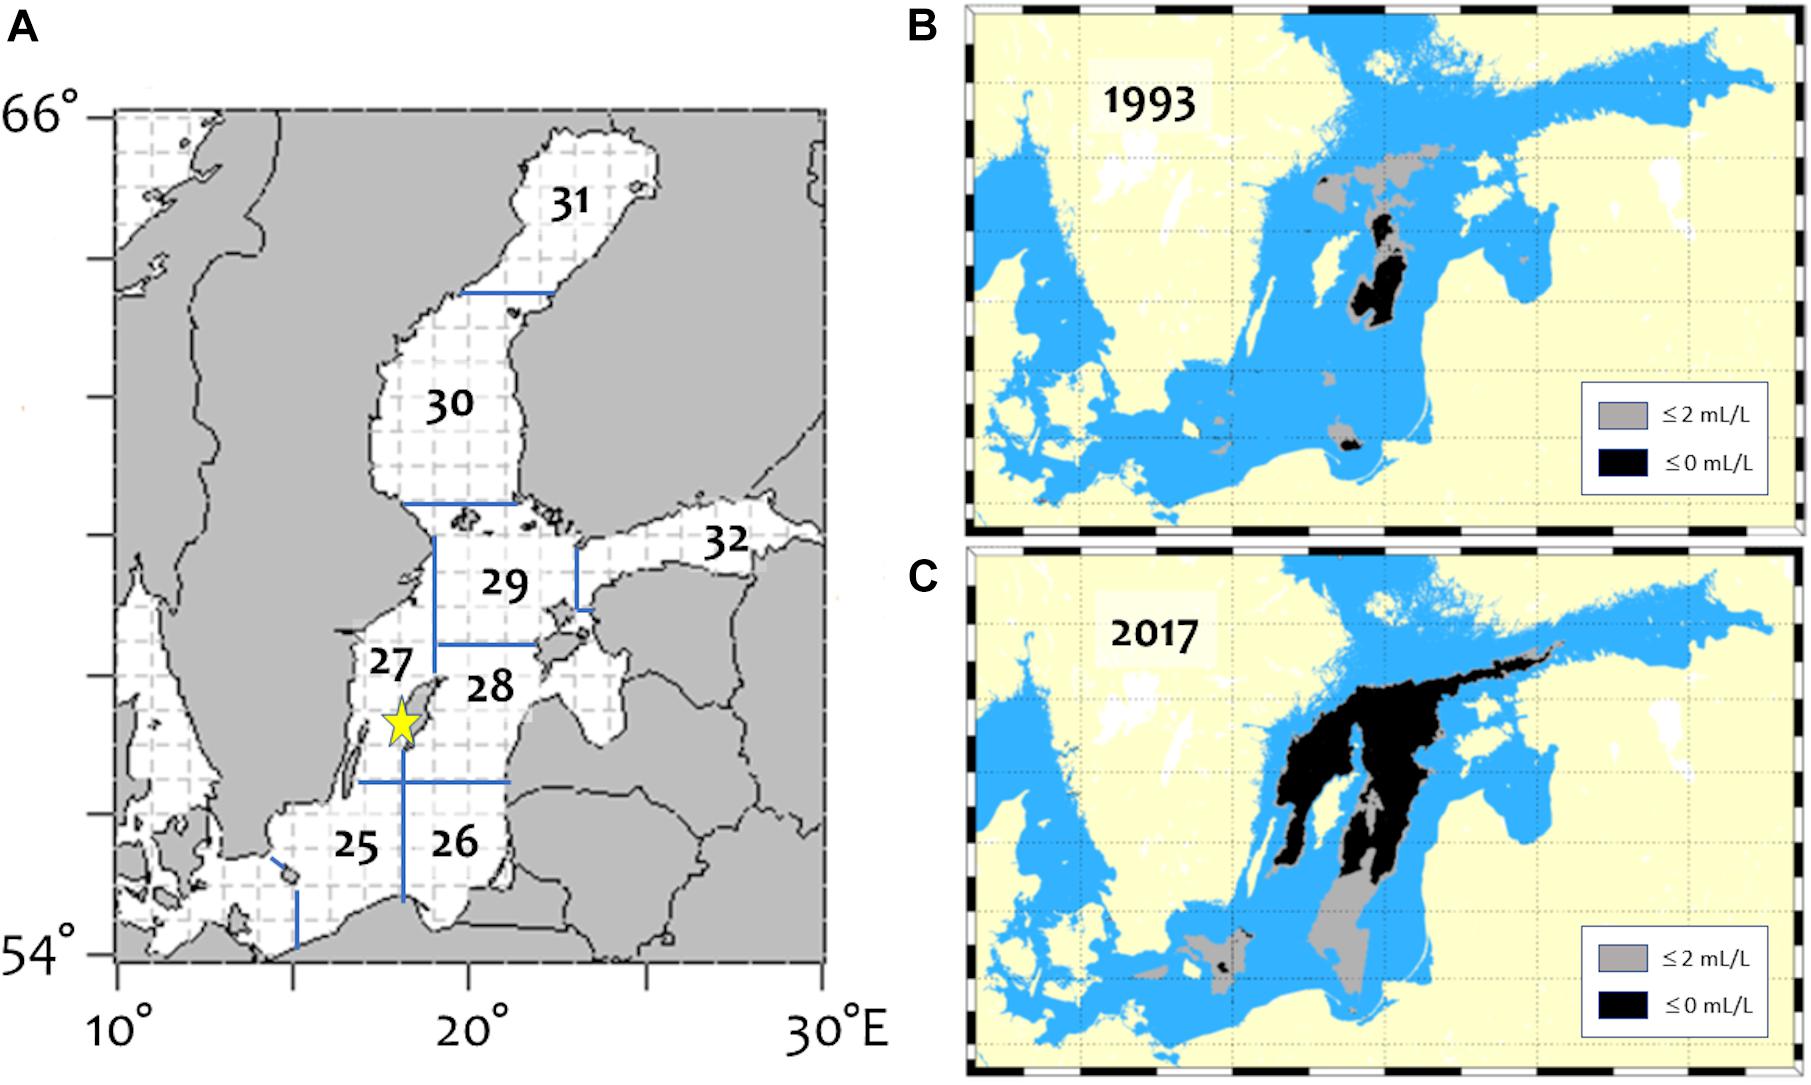
Figure 1. Maps of the Baltic Sea, showing (A) ICES subdivisions; (B) lowest areal extent of hypoxia/anoxia on record since 1960, in 1993; and (C) areal extent of hypoxia/anoxia in 2017, typical of the worsening conditions. Star on (A) shows the location of Neolithic cod otolith remains.
Fish total length (L, mm) and fresh total weight (W, g) data accompanied the modern otoliths, so a measure of condition (Fulton’s K) could be calculated as:
K = W/(L3) × 106.
In some cases, fish samples were obtained from commercial fisheries that gutted fish prior to landing. For those, correction factors (Casini et al., 2016a) were applied. For purposes of this analysis, K was grouped into two categories: low (K < 9) and high (K ≥ 9).
Otoliths were cleaned prior to archiving. The experimental otoliths were first marked to identify the core region (seen on the otolith surface as a “V” notch), then embedded in a clean epoxy resin (EpoFix,®Struers) (Supplementary Figure S-1). Transverse sections were prepared by cutting the shortest axis approximately 0.5–1 mm on each side of the core (Supplementary Figure S-1), which was subsequently thinned and polished down with a series of grinding papers (60, 30, 15, 12, 9, 3, and 1 micron), creating a section 0.2–0.5 mm thick and exposing the core region. The core (primordium) in cod is very small, <100 microns, so care must be taken to locate it. Once prepared, otolith sections were cleaned with 95% ethanol and rinsed in deionized water, then mounted on petrographic slides with double-stick tape.
Otolith chemistry was analyzed by laser ablation inductively coupled plasma mass spectrometry (LA-ICPMS), mainly at the Analytical and Technical Services laboratory at SUNY-ESF, United States; five otoliths were analyzed at Lund University, Sweden (described in Limburg et al., 2018). A 198-nm laser system (ESI) ablated material from the exposed otolith surface along a prescribed transect along the ventro-dorsal axis. That material was transported via a carrier gas (ultra high purity He, 800 mL/min) into a PerkinElmer Elan DRc quadrupole mass spectrometer. Continuous transects were taken, mostly from ca. 300 microns from the core on the ventral side, through the core, and out along the dorsal axis (Supplementary Figure S-1), or else complete “palindromic transects” running from the ventral edge, over the core, and out the dorsal axis. The track width (spot size) was 100 μm, and travel speed was 5 μm/s (10 Hz, 90% power). This spot size and ablation speed did some averaging across growth zones, but was deemed acceptable as it captured the dynamics of the hypoxia proxies and other elements.
Isotopes monitored included 24Mg, 26Mg, 31P, 43Ca and 44Ca (44 was a check on 43), 55Mn, 63Cu, 64Zn, 88Sr, 127I, and 138Ba. Briefly, Sr and Ba provide information on salinity and onshore–offshore habitat use, albeit with some confounding with temperature (Sr) and upwelling (Ba) influences; Mn and I are proxies for hypoxia (Lu et al., 2010; Limburg et al., 2015), Mg and P are under physiological control and help to identify seasonality of otolith growth; and Cu and Zn, typically elevated in the cores of cod and flounder otoliths (KL, unpublished observation), help to check accurate identification of the core. Pelletized carbonate standards [MACS-3, Wilson et al., 2008; MAPS-4 (USGS Geochemical Reference Materials), and an in-house standard made of crushed otoliths (Limburg et al., 2011)] were used for calibration and instrument drift corrections. Precision typically ranged from 5 to 15% on the standards, but re-running ablation tracks on otoliths produced nearly identical results.
Elemental concentrations (ppm) were expressed as ratios to Ca to correct for variations in the matrix. Mg/Ca ratios were calculated with 24Mg; 26/24Mg ratios were calculated with background-subtracted, drift-corrected data for both isotopes, calibrated to reported average percentages of each isotope (Catanzaro et al., 1966).
We used the otolith chemistry to aid in identifying the locations of annuli (seasonal growth checks due to winters; Heimbrand et al., unpublished) on the otoliths. We then used Campana’s “biological intercept” method (Campana, 1990) to back-calculate lengths-at-age for each fish, setting hatching length L0 = 2.5 mm and otolith diameter at hatch O0 = 50 microns. Otolith chemical data were parsed both annually (i.e., concentrations and ratios were calculated within annual growth zones) and averaged over the entire “life history transect” of the individual, using data collected on the dorsal axis, which provides the most detail. In addition, data from the otolith core region (inner 50 μm) and outer edge (200 μm) were collected.
A variety of potential hypoxia proxies were tested on the annual data. Mean Mn/Ca within annual growth zones, and means × growth zone widths, served as point and cumulative measures of hypoxia exposure within any given year. Cumulative Mn/Ca, summed over years of life, quantified the lifetime exposure up to any given age. To assess duration of exposure to hypoxia, all the annual means were subjected to statistical analysis (Supplementary Table S-1); we defined hypoxia exposure as exceeding the median value (across all fish) within a given age-class. Within any given year of otolith growth, the distance along the analysis transect corresponding to exceedance of the threshold, divided by that year’s otolith growth increment, was used as a measure of the duration of exposure.
However, Mn/Ca is also sensitive to growth rate (Limburg et al., 2011, 2015). To explore this, we developed a simple, conceptual model (Figure 2A) using the platform STELLA®(model details are in the Supplementary Information). A bioenergetics module keeps track of the consumption and assimilation of food, respiration, and net growth, all of which are temperature-dependent. A biogeochemistry module simulates organic matter decomposition and the sequential reduction of oxygen, nitrate, and manganese; manganese oxidation produces dissolved Mn2+, which can be taken up in otoliths. Otolith growth was modeled as a function of net metabolic activity, and Mn uptake/incorporation as the product of otolith growth and environmentally available Mn. The model uses realistic values, but is not calibrated with actual data on Baltic cod or on Baltic Sea biogeochemistry. The point of the model is simply to illustrate that both internal and external factors are involved.
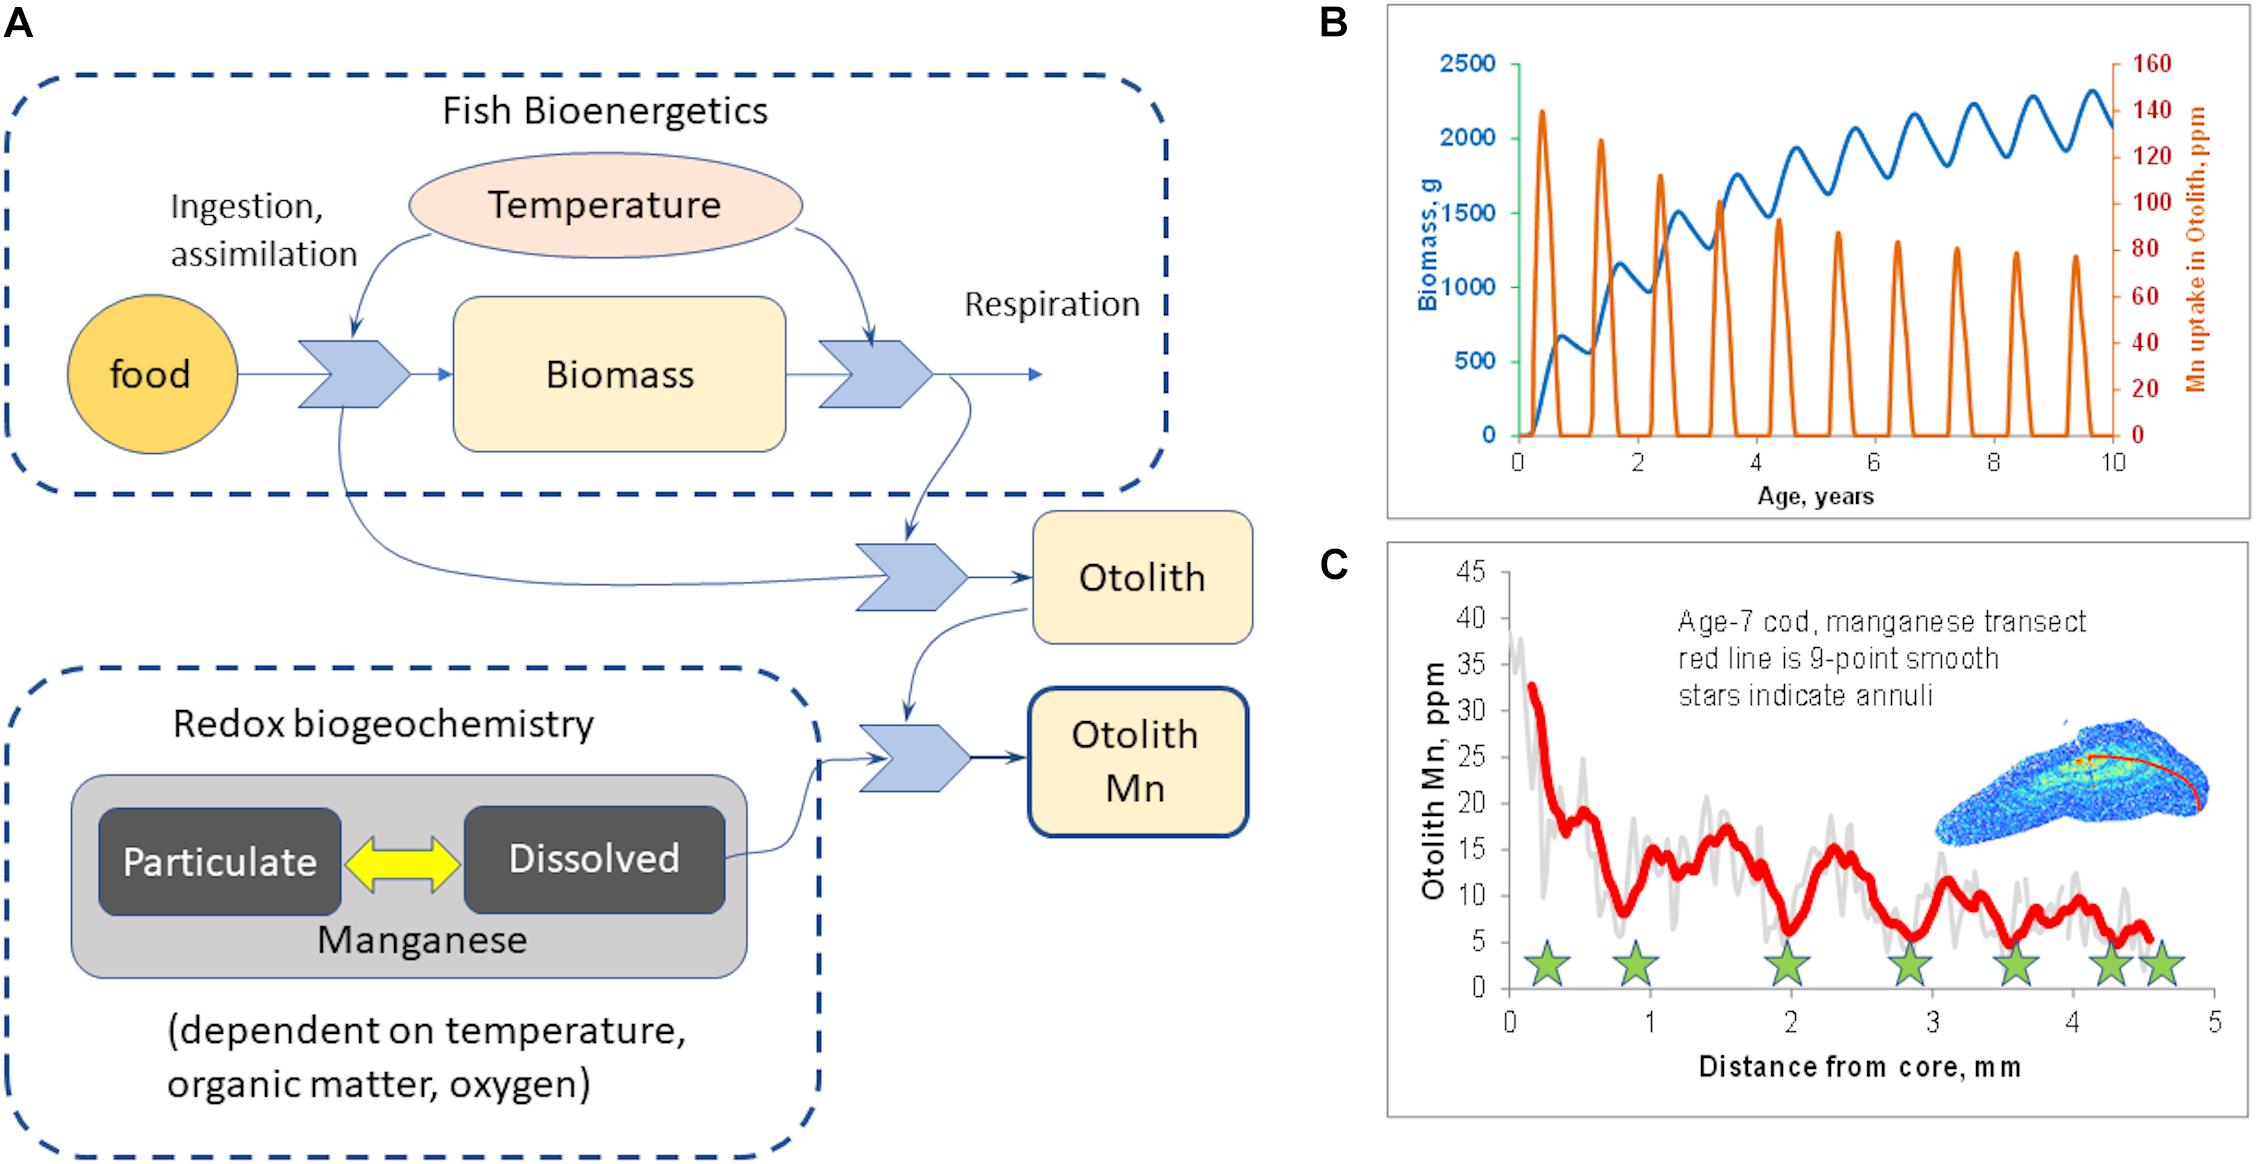
Figure 2. Hypothesized mechanism of otolith manganese incorporation. (A) Schematic of conceptual model postulating mechanism of manganese incorporation into otoliths (see Supplementary Information for model details). Otolith Mn is a function both of fish growth and of availability of dissolved Mn (i.e., reduced Mn2+). (B) Model output, simulating 10 years of growth where seasonal biogeochemistry is identical every year, but otolith Mn declines due to decrease in fish growth. (C) Otolith Mn in a 7-year-old Baltic cod, showing similar seasonal increases in summer, but overall decline due to natural decrease in growth with age.
We further note that magnesium uptake is growth-rate sensitive (Grammer et al., 2017; Limburg et al., 2018) but is independent of hypoxia. Therefore, we use Mn in ratio to Mg (Mn/Mg) as a new proxy to correct, at least in part, for growth effects on Mn uptake. We compiled similar statistics on annual and cumulative Mn/Mg to test for duration of exposure both annually and for lifetime, accumulative effects of hypoxia exposure.
Data were inspected for normality and analyzed, as appropriate, with continuous methods (regression, multiple regression), repeated measures ANOVA to account for possible within-subject autocorrelation, and two-way ANOVA to test for effects of age and other categorical variables (decade, categorized hypoxia exposure) on various proxies.
We use the otolith chemical data to address the following questions:
- Do hypoxia proxies track independent indices of hypoxia (e.g., areal or volumetric extent) over the past four decades?
- Does otolith Mg/Ca, our proxy for metabolic activity, correlate with condition factor?
- Do cod exposed to greater hypoxia show evidence of reduced growth?
The conceptual model (Figure 2A) was run to simulate 10 years of growth, but with the same pattern of seasonal hypoxia in every year. The model output (Figure 2B) shows that even with constant annual patterns of hypoxia, seasonal Mn incorporation declines as fish grow larger and their growth rate slows down asymptotically. This provides a conceptual null model if the environmental dynamics were identical year by year, and is qualitatively similar to what we have often observed in otolith Mn/Ca transects (for example, Figure 2C).
Continuous “life history transects” along the major growth axes (ventro-dorsal) revealed great individual variability (cf. Supplementary Figure S-2). Nevertheless, some patterns in Mn/Ca were recognizable as associated with particular conditions. For example, we often observed a sudden drop in otolith Mn/Ca in the early 1990s (Figure 3), when major inflows of oxygenated North Sea water produced several years of low hypoxia. When hypoxia was moderately low, cod otolith Mg/Ca would often track Mn/Ca (Figure 4, top panel), but during episodes of apparently intense, summertime hypoxia as “recorded” in Mn/Ca ratios, the Mg/Ca de-coupled from the ordinary seasonal tracking with Mn/Ca, and instead declined (Figure 4, bottom panel). High episodes of hypoxia exposure as recorded in otoliths were more frequent after 2010 (Figure 4).
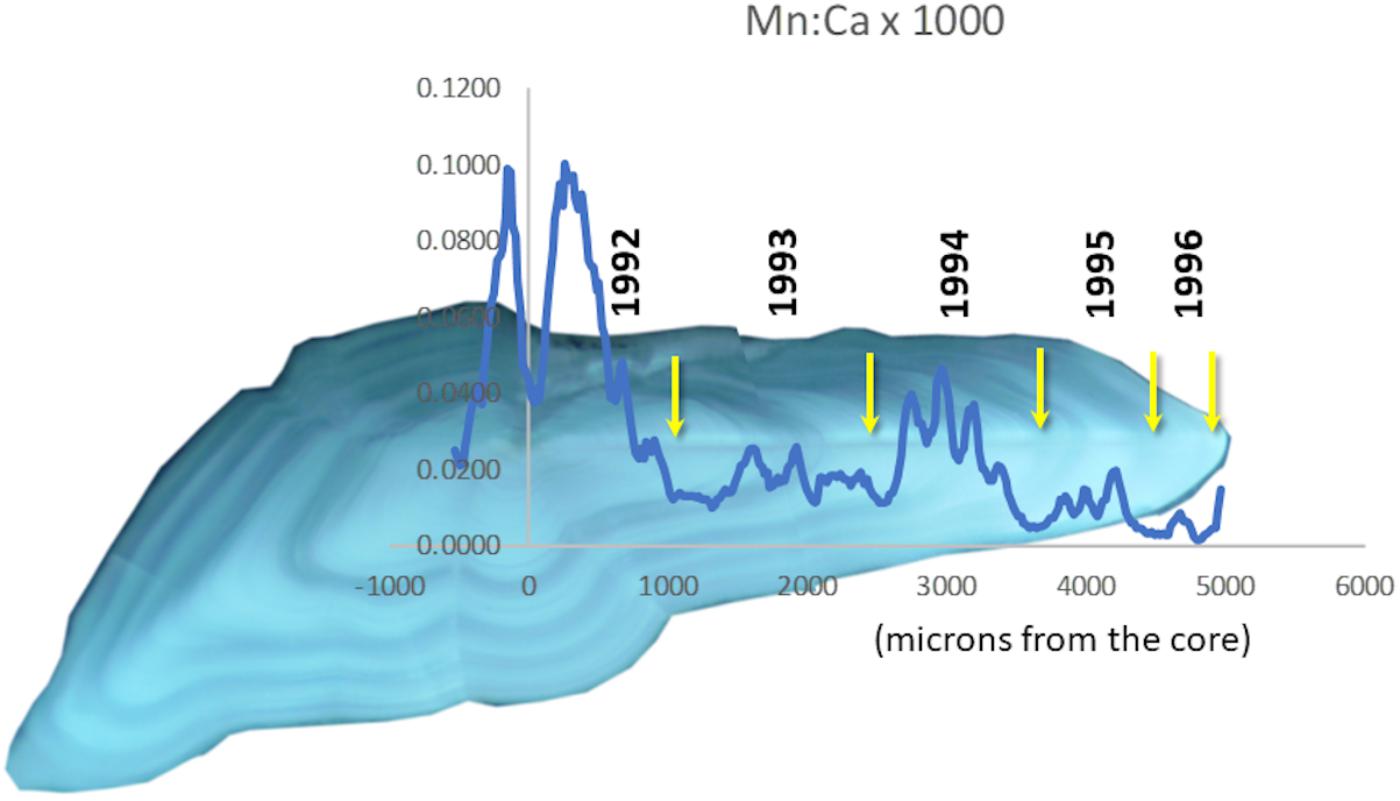
Figure 3. Transect of Mn/Ca overlaid on an otolith from a cod that lived through a period of very low hypoxia in the Baltic. Annuli are marked with yellow arrows. Hypoxia reached a minimum in 1993 (Figure 1B).
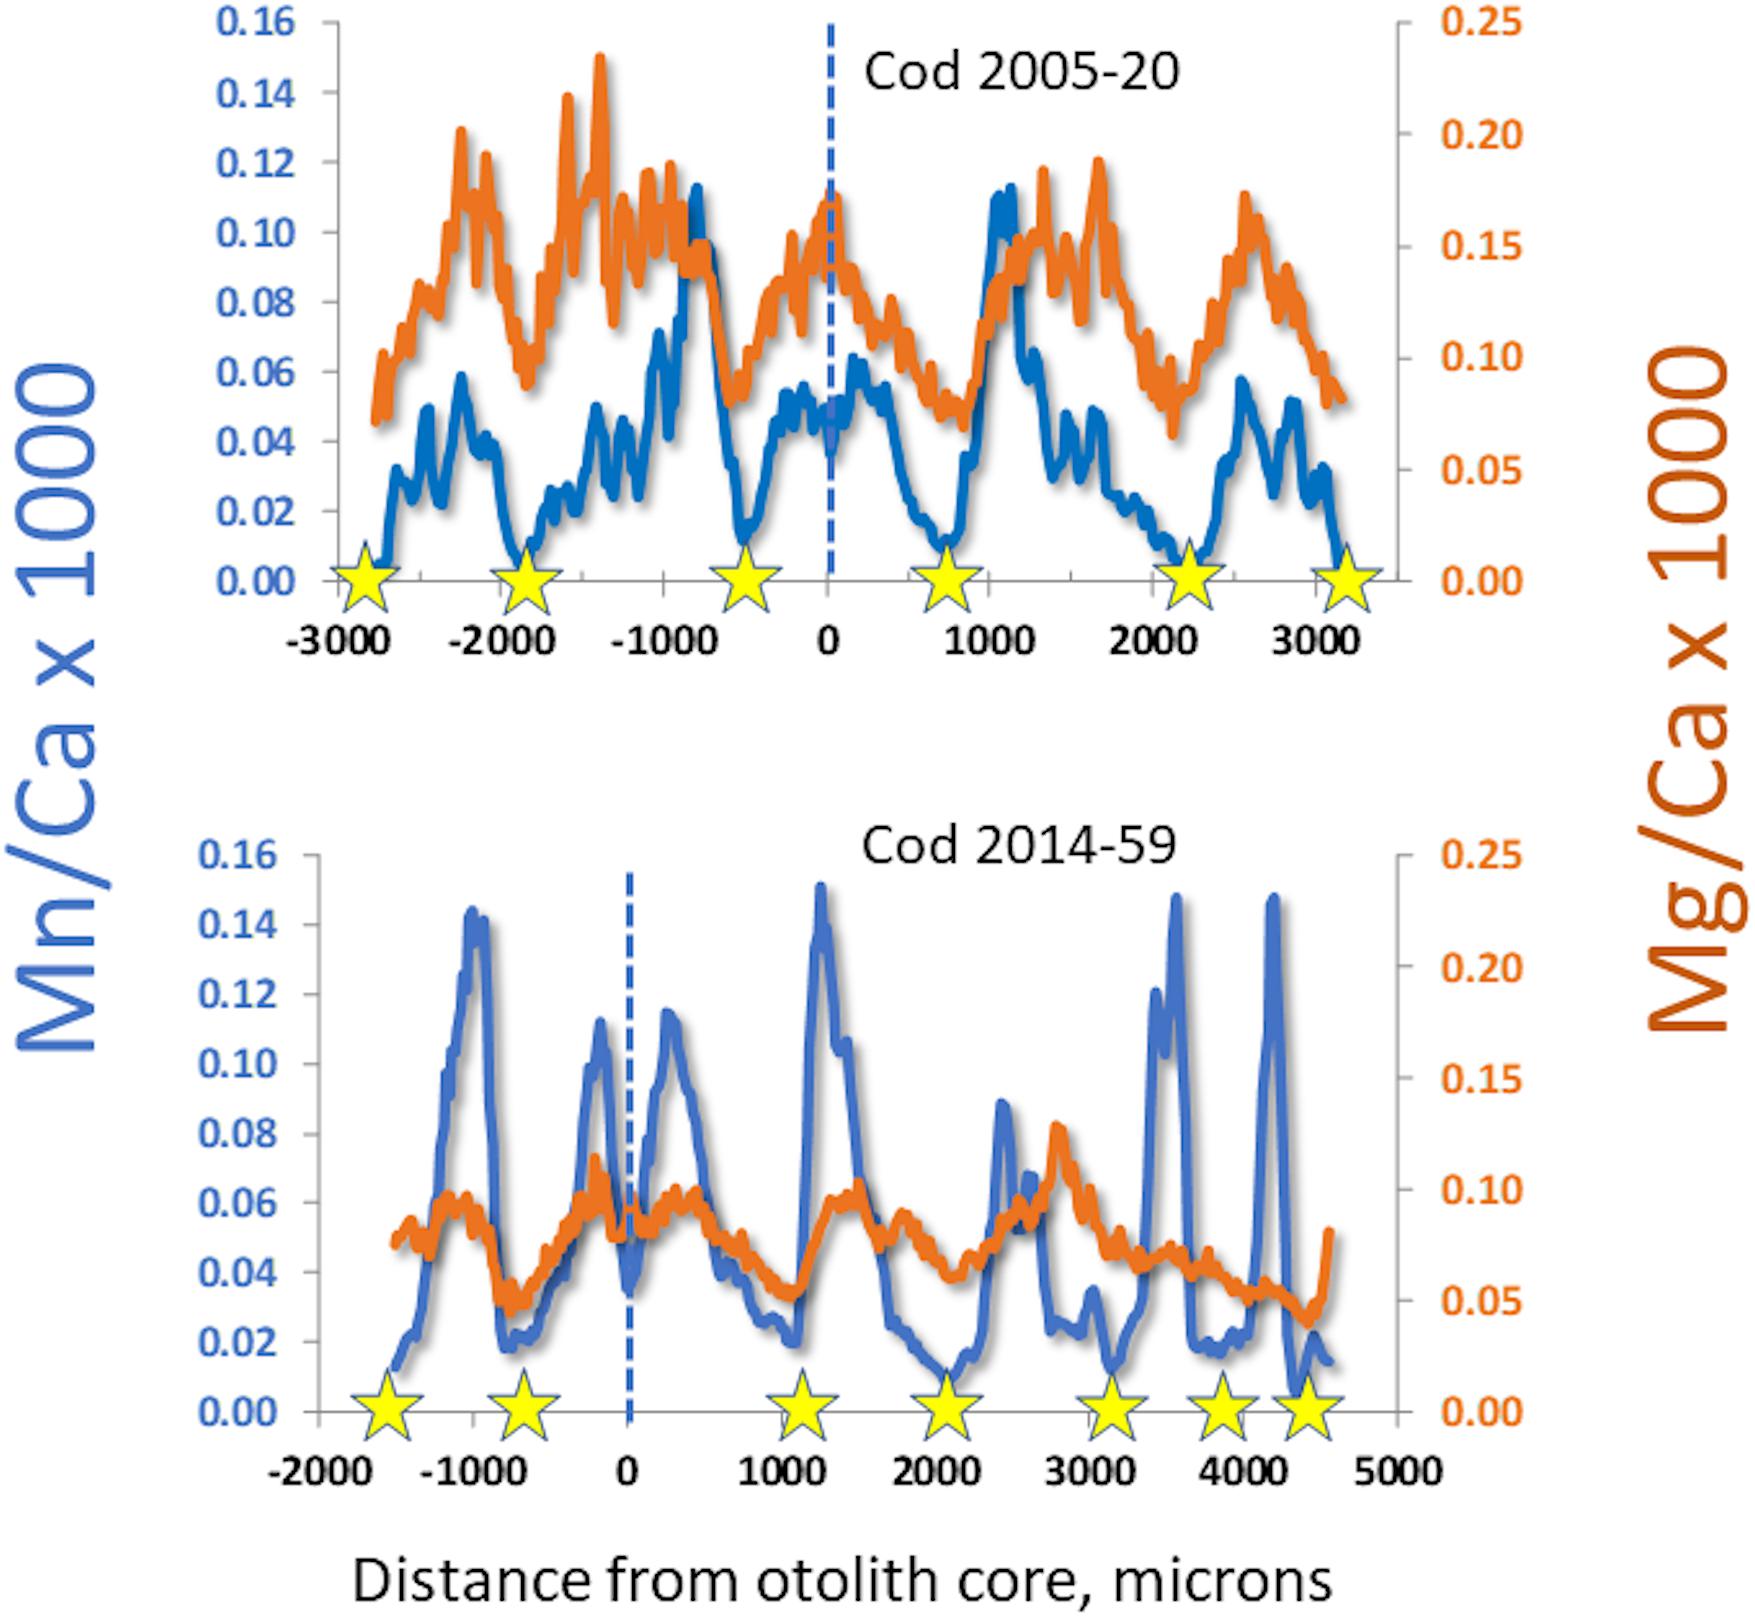
Figure 4. Comparison of manganese and magnesium dynamics in otoliths from cod having experienced different lifetime hypoxia levels. Stars mark winters, dashed lines mark the otolith cores. Top: edge-to-edge otolith transect in a period with good oxygen conditions, with seasonal variations of Mn/Ca and Mg/Ca in synchrony. Bottom: partial otolith transect in a cod having experienced chronic seasonal hypoxia; note that Mn/Ca is higher and Mg/Ca lower than in top panel, and that magnesium begins to de-couple from seasonal patterns in third year.
Our collection of modern cod data spans 30 years, from 1986 to 2016. Comparing hypoxia proxies in otoliths to indices of hypoxia intensity (i.e., hypoxic volume or bottom area in the Baltic), the proxy that best matches hypoxic intensity is the within-year Mn/Mg duration above the thresholds (Figure 5). The proxy drops in the early 1990s, and rises from 2003, worsening steadily into the 2010s (Figure 5A), and captures much of the dynamic of the volume of hypoxic water (Figure 5B), particularly when the otolith proxy data are lagged 1 year back as shown here. When this lagged proxy is plotted as a function of hypoxia volume, it may be visualized in two periods (Figure 5C): a period encompassing 1986–1995 when hypoxia was moderate to declining, and the 2000s–2010s, when hypoxia increased continuously. Our otolith data from 2003 to 2016 show a rise in hypoxia proxy that appears to be steeper than the corresponding increasing hypoxia volume. Our data appear to capture responses to major inflows (2003 and 2014) that brought in oxygenated water. Finally, we note that our hypoxia proxy does not track hypoxic bottom areal extent as well as it does hypoxic volume (areal extent-otolith proxy R2 = 0.81 for period 1985–1994 and R2 = 0.003 for period 2003–2016; volume-otolith proxy R2 = 0.86 for period 1985–1994 and R2 = 0.45 for period 2003–2016; Figure 5C).
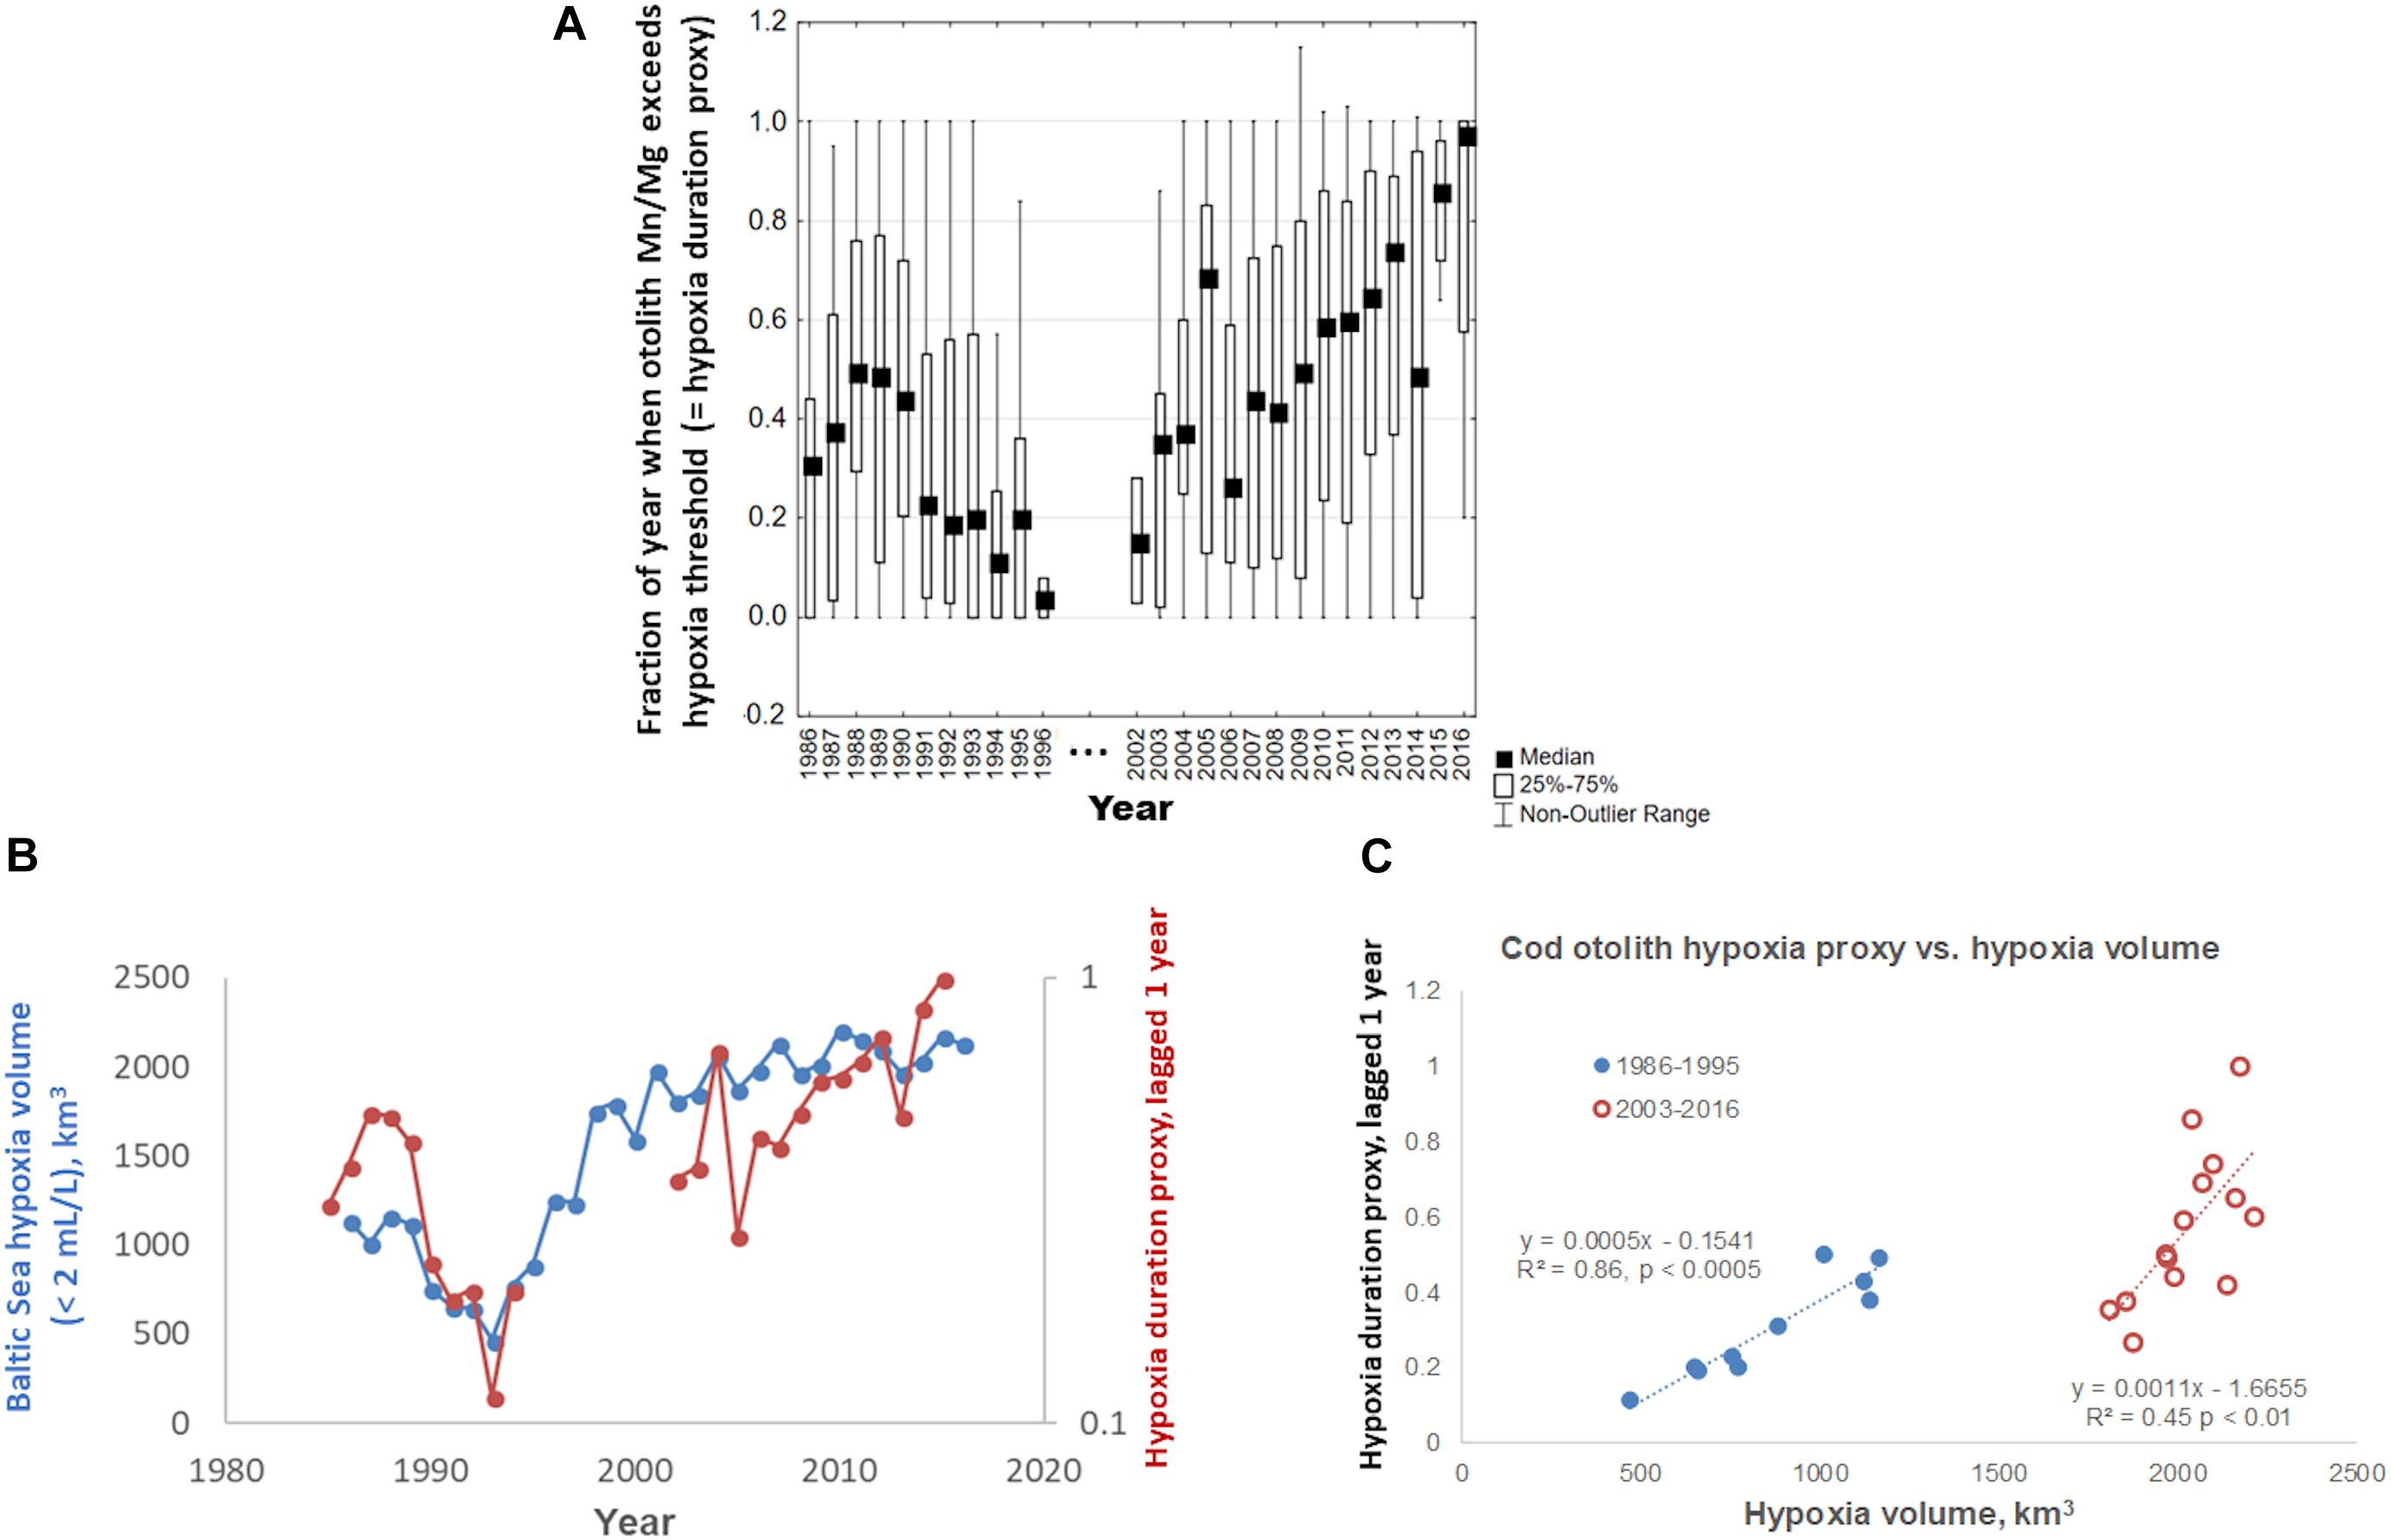
Figure 5. (A) Within-year otolith Mn/Mg exceeding median threshold, a proxy for within-year duration of hypoxia exposure in Baltic cod otoliths, 1986–2016. (B) Concordance of Baltic Sea hypoxic water volume over the same time period, defined as water holding <2 mL/L dissolved oxygen (data courtesy O. Savchuk, Baltic Sea Centre, Stockholm University), and median otolith proxy values (from A) lagged 1 year back; note different axis scales; observations of N ≤ 2 were deleted. (C) Median lagged otolith proxy values (from B), plotted vs. Baltic Sea hypoxia volume.
Factorial analysis of variance (ANOVA) of Mg/Ca by age and Fulton condition group (low < 9, vs. high ≥ 9) produced striking results (Figure 6). Low condition fish had less otolith Mg/Ca than high condition fish, and the gap between low and high tended to increase with fish age (Figure 6A). Repeated measures ANOVA yielded similar results (p = 0.011). As a result, the difference in lifetime cumulative Mg/Ca was also significant between Fulton groups and increased with age (Figure 6B). By contrast, a similar ANOVA performed with Mn/Ca as the dependent variable showed a significant decline with age, but not significant difference between Fulton groups.
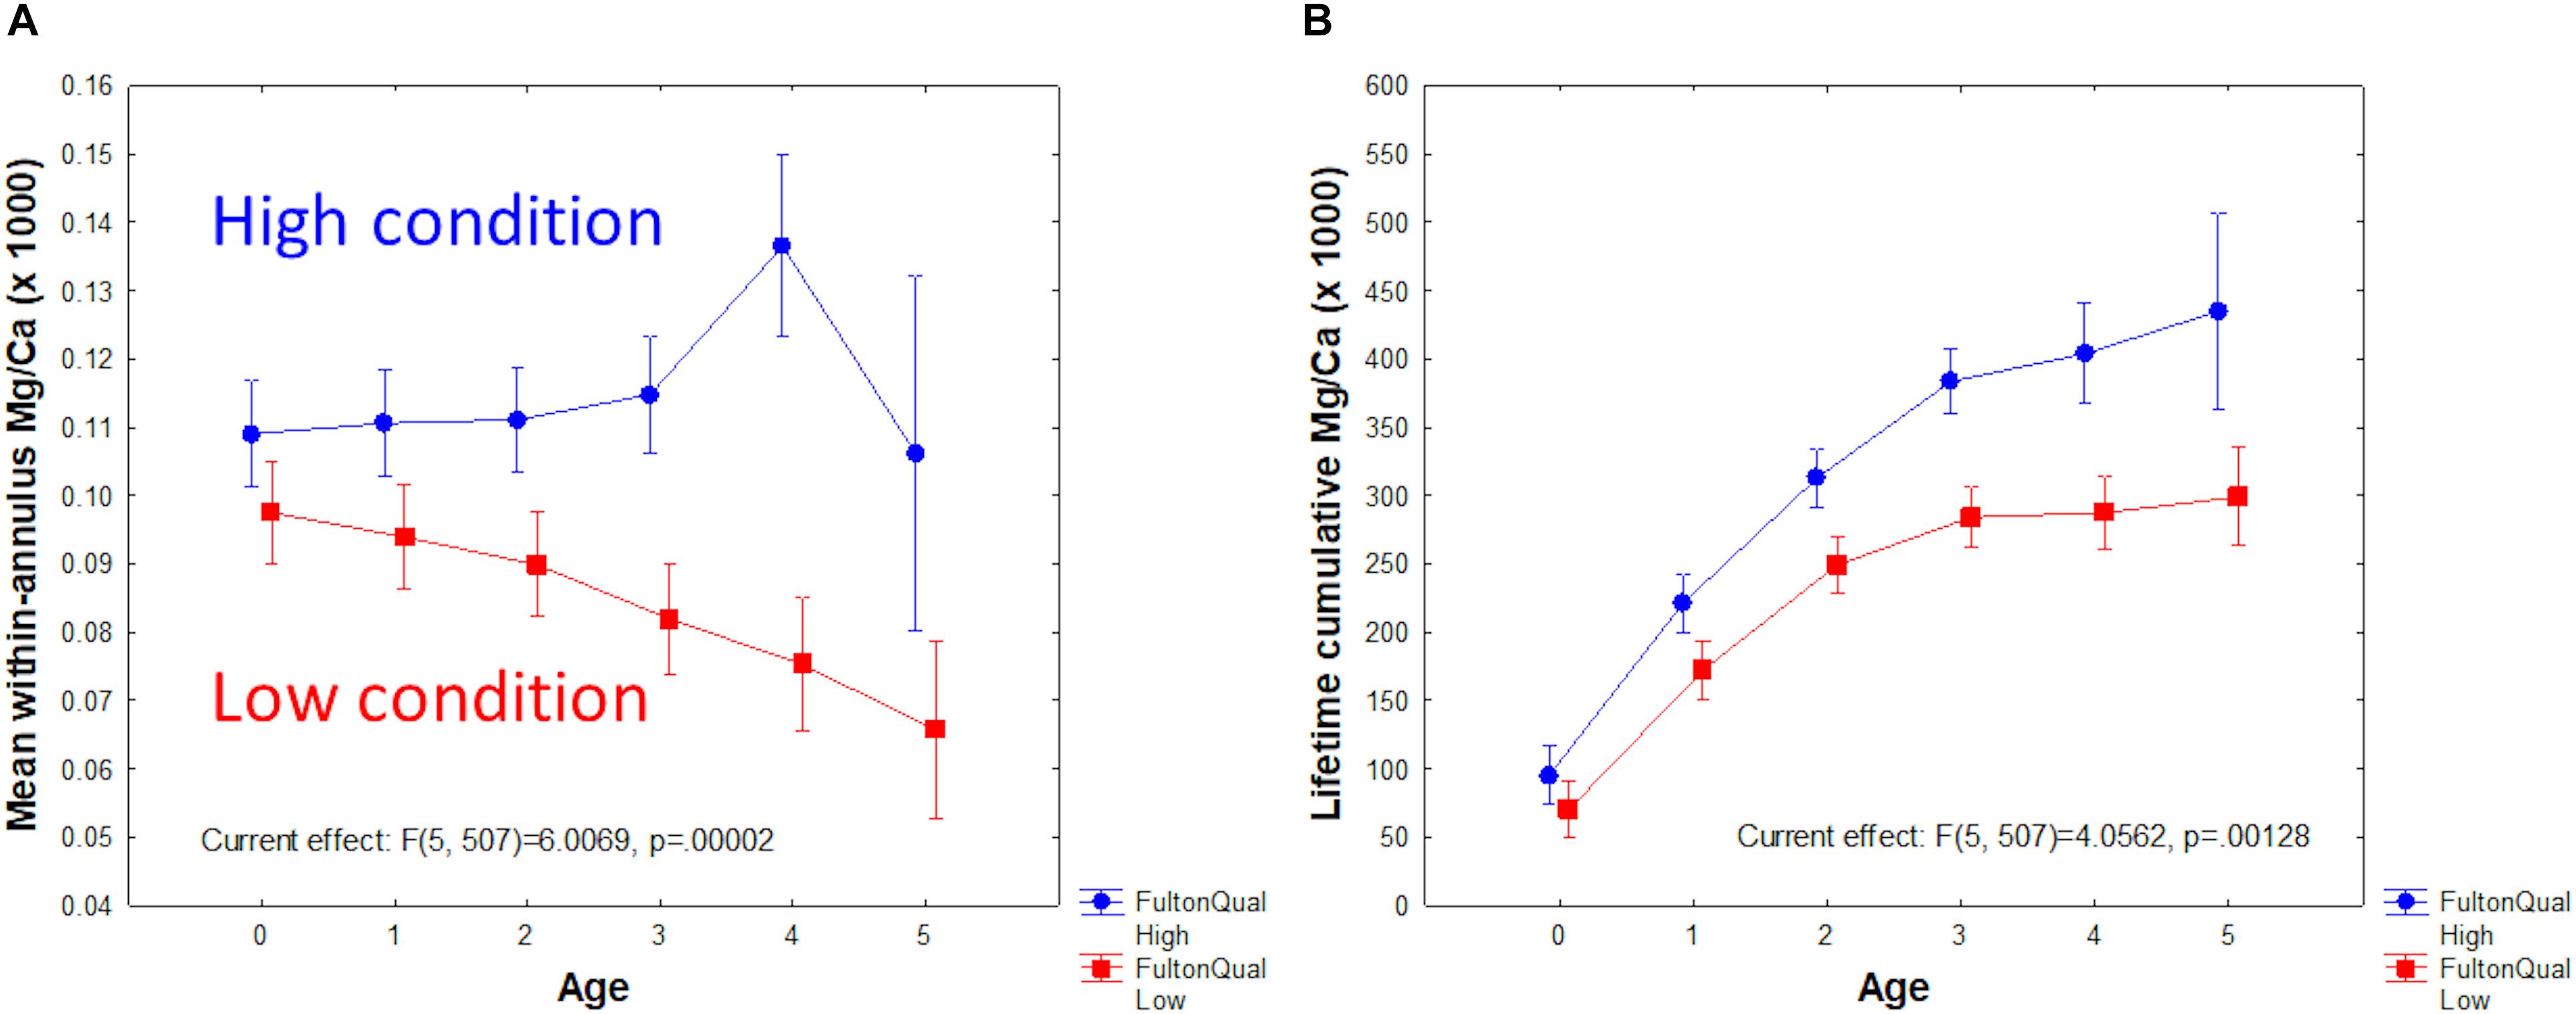
Figure 6. Mg/Ca as a function of Fulton condition group (low < 9; high ≥ 9) and age. (A) Mean within-year Mg/Ca. (B) Lifetime accumulative Mg/Ca.
Back-calculated lengths at age (Figure 7) confirmed that growth was highest during the early 1990s, when hypoxia extent was lowest. Conversely, growth was poorest during the current decade of the 2010s, when hypoxia extent has been large and, in particular, anoxia has been increasing (Hansson et al., 2017).
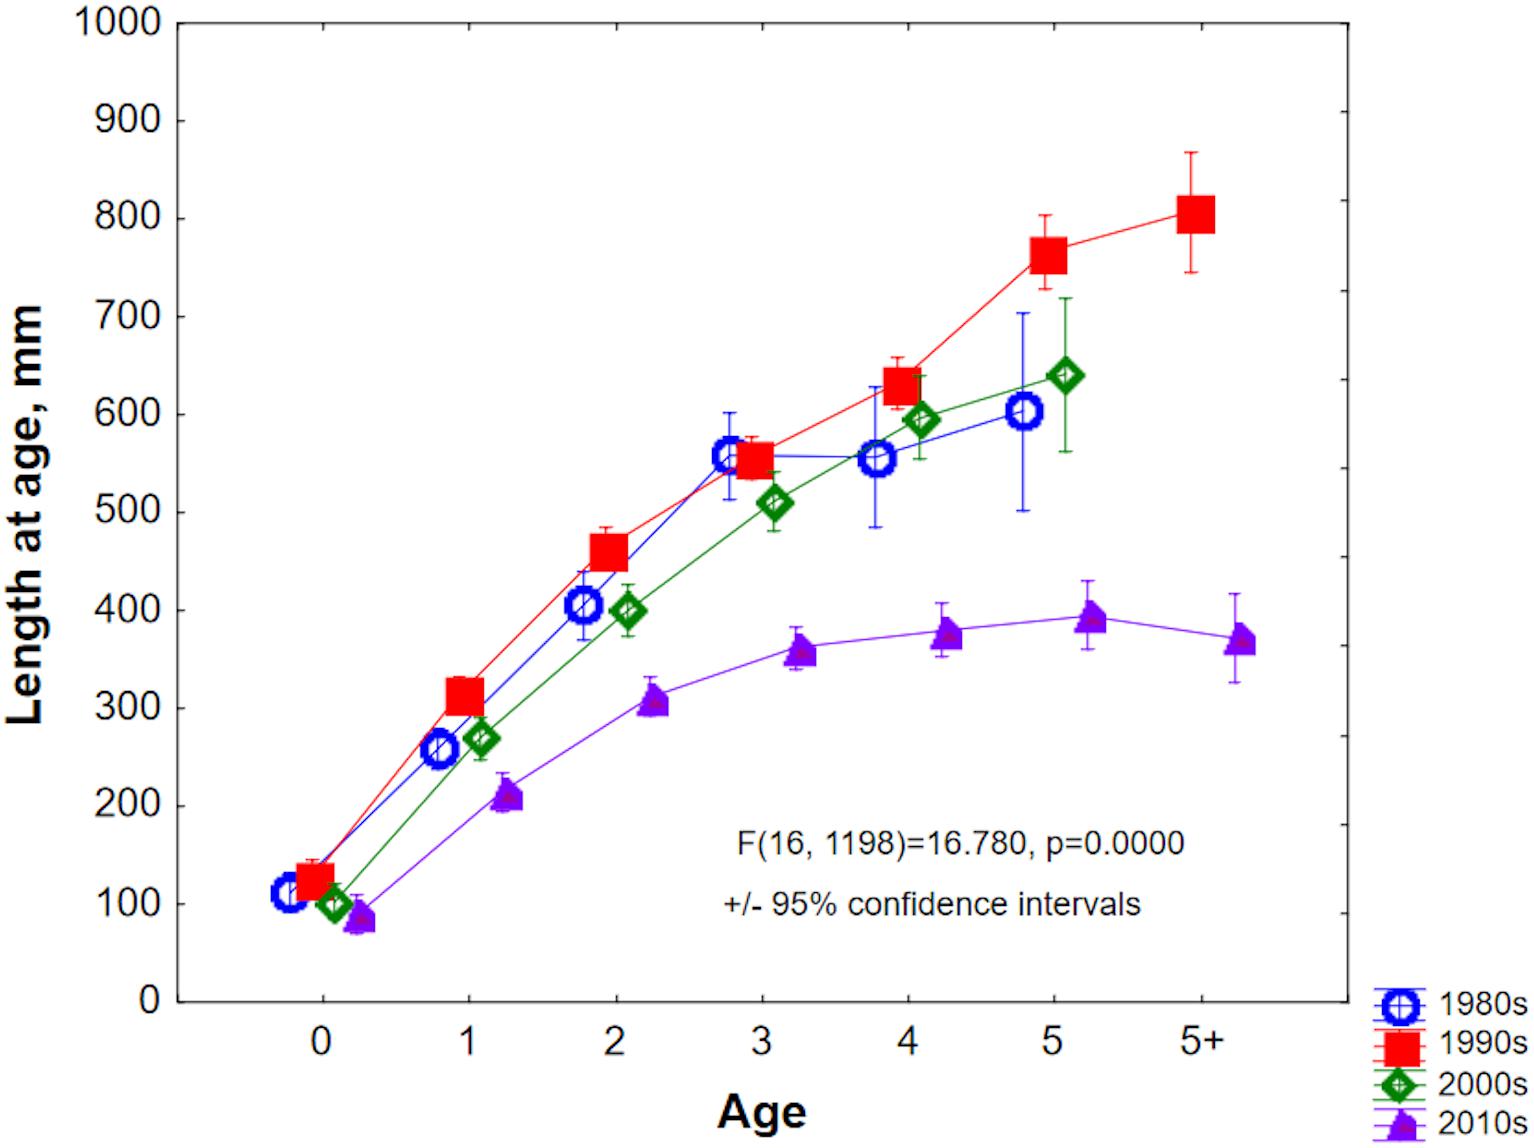
Figure 7. Back-calculated lengths-at-age of Baltic cod, grouped by decade of capture.
We also tested directly whether growth (length at age) correlated to hypoxia exposure within a year. We grouped the hypoxia duration (fraction of an annual growth zone above the Mn/Mg thresholds) into four categories: ≤25%, ≤50%, ≤75%, and ≤100%. With the exception of the Age-0 (young-of-year) group, length at age declined with increasing annual hypoxia exposure (Figure 8). In Age-0 fish, length was highest (117.7 mm) in the ≤50% group, and second highest (112.2 mm) in the ≤25% group. By Age-3, the size disparity between the least and most hypoxia-exposed fish was 38.6% (547.9 vs. 395.3 mm, respectively; Figure 8). The implication here is that, across all samples, growth was reduced as hypoxia exposure increased.
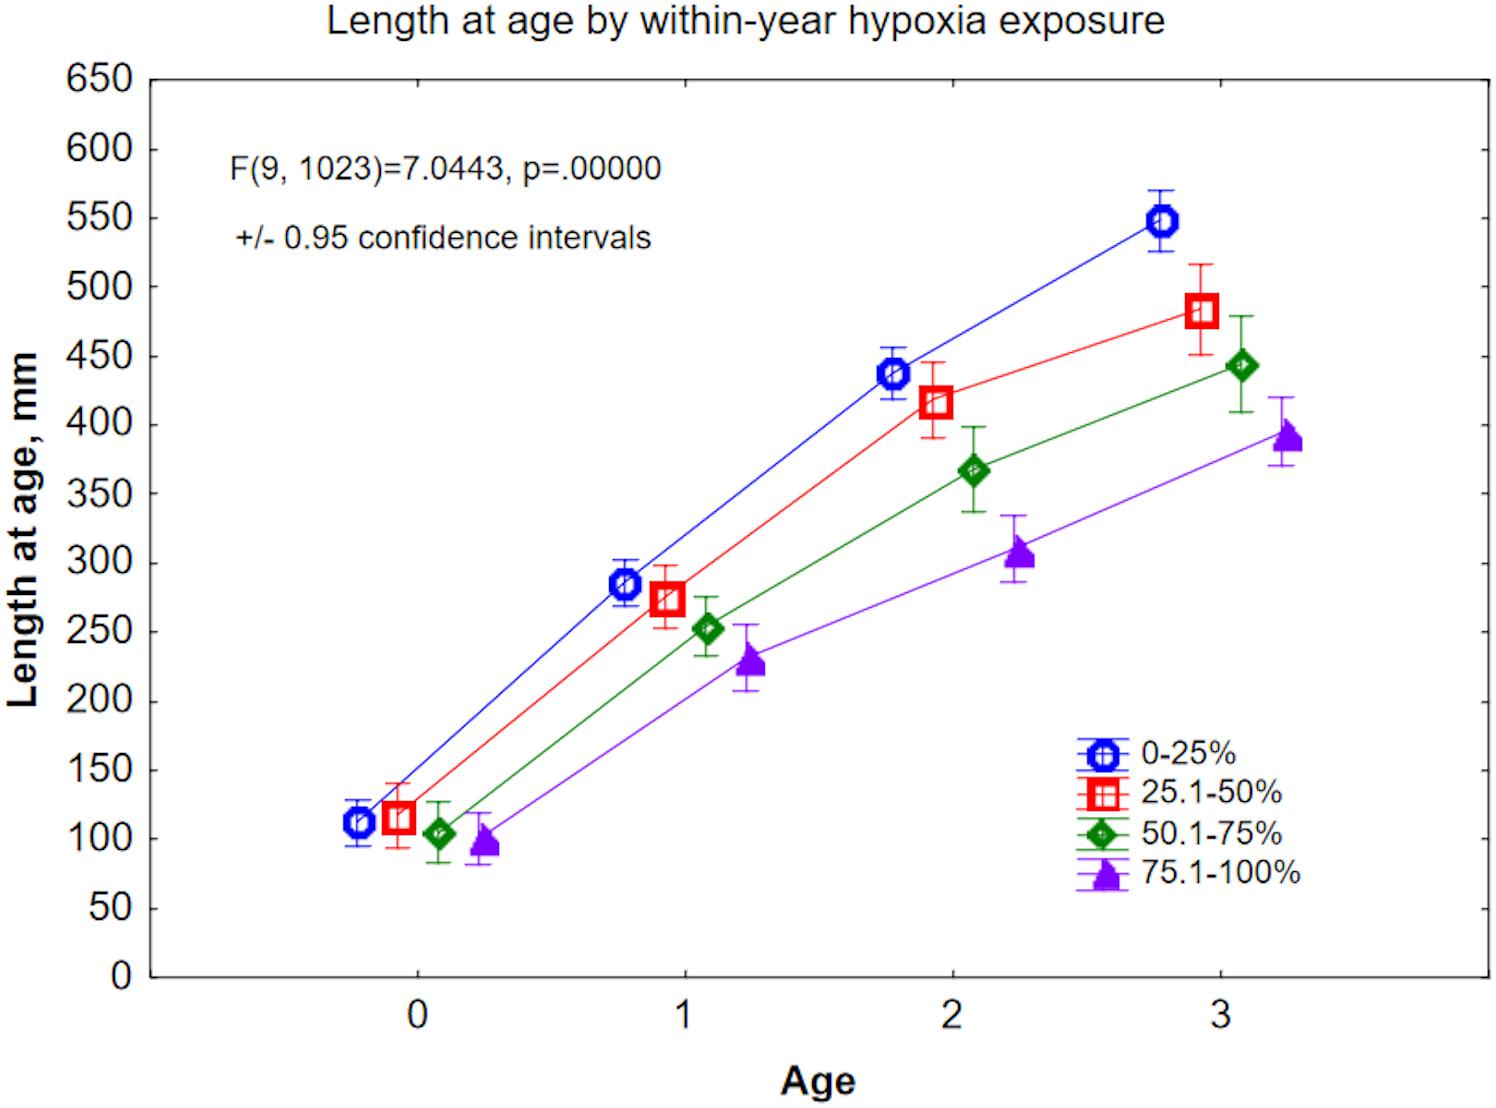
Figure 8. Back-calculated length at age for Ages 0–3, plotted by within-year hypoxia exposure level. Hypoxia exposure is proxied here by Mn/Mg above the age-specific thresholds, expressed as fraction of the otolith annulus.
We examined Sr/Ca values as a proxy for salinity (but see caveats in the section “Discussion”). First-year Sr/Ca (×1000) values are lowest and are likely indicative of nearshore nursery habitats (Limburg et al., 2011), and increase as the fish begin to move into deeper, saltier water. ANOVA of Sr/Ca as a function of age and within-year hypoxia exposure revealed a complex response, but from Age-3 onward, Sr/Ca was highest in the 75–100% duration of hypoxia exposure category. Comparing just the lowest and highest exposure quantiles, Sr/Ca first increased, then decreased, for the 0–25% group, but increased linearly for the 75–100% group (Figure 9).
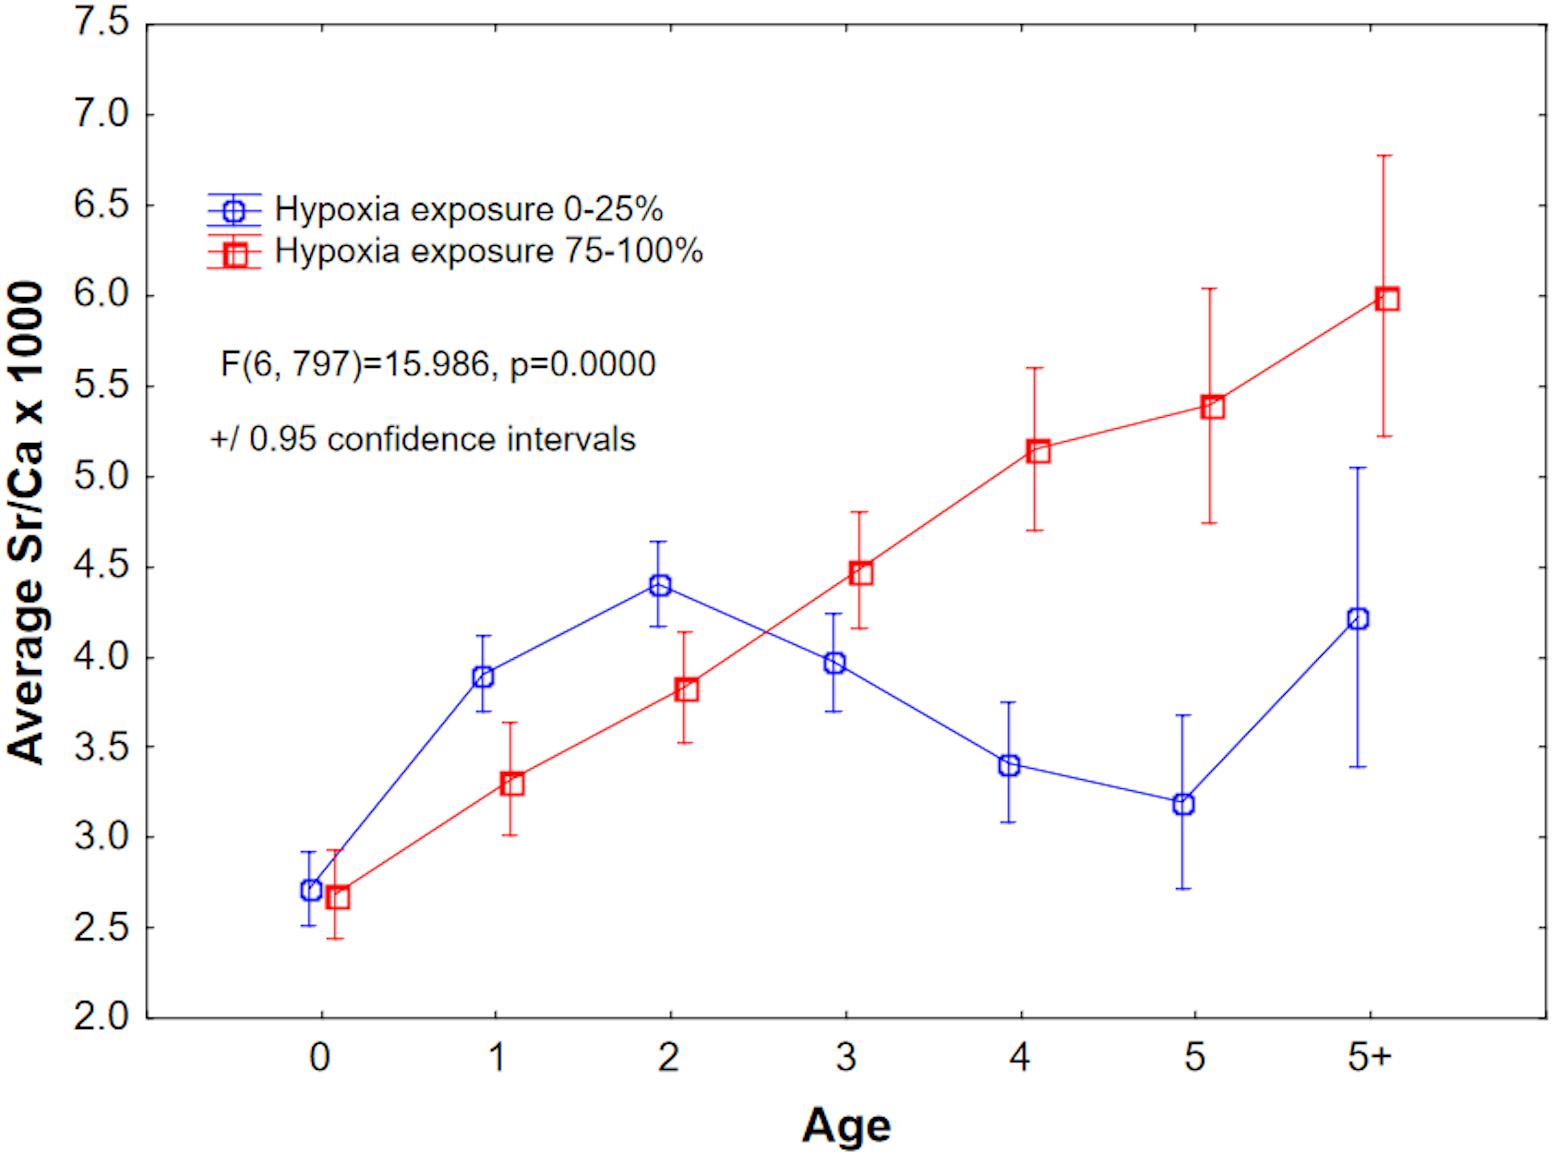
Figure 9. Mean Sr/Ca × 1000, a proxy for salinity, plotted by age for the least and most hypoxia-exposed groups. See Figure 8 for explanation of hypoxia exposure proxy.
Lifetime data, averaged over the entire otolith transects, did not reveal as many insights, and generally produced noisy relationships. For example, we tested whether an inverse relationship existed between lifetime mean Mn/Ca (our original hypoxia proxy) or the newer proxy (Mn/Mg) and I/Ca; neither of them produced significant results. Nevertheless, some variations are apparent when grouping element/Ca ratios by time period: Neolithic times vs. the decades of 1980s, 1990s, 2000s, and 2010s (Supplementary Figure S-2). We note that the Neolithic otolith chemistry shows much lower Mn/Ca and Mn/Mg, so much lower than today’s cod otoliths that we could not use them as a hypoxia baseline – if we had, then all of the modern cod would exceed the threshold most of the time. Additionally, Mg/Ca was on par with modern fish, Sr/Ca was elevated as expected due to the saltier conditions of the past, and I/Ca was elevated (Supplementary Figure S-2).
Analyses of hypoxia proxies on the outermost 200 microns did not correlate with either growth rate or Fulton condition factor. Regression analysis of core chemistry produced a significant (p < 10−4), if highly noisy (R2 = 0.014), inverse relationship between I/Ca and Mn/Ca (I/Ca = 0.0023 – 0.0099 × Mn/Ca). Additionally, a positive relationship existed between core Cu/Ca and Zn/Ca (Zn/Ca = 0.0046 + 0.74 × Cu/Ca, R2 = 0.19, p < 10−6).
Analysis of annual data, parsed on laser transects along the dorsal axis of Baltic cod otoliths, demonstrated complex, individualistic patterns of life histories. Despite the fact that the Baltic Sea is a very large system, and our collections constituted but a small sampling, some striking patterns emerged that reflect the changing circumstances of cod confronting hypoxia.
A variety of proxies for hypoxia, including Mn/Ca, Mn/Mg, and variants of these, were tested. We conclude that Mn/Mg, in which the growth- and hypoxia-sensitive element manganese is normalized to the (only) growth-sensitive trace element magnesium (Limburg et al., 2018), is a more robust metric for hypoxia than Mn/Ca, at least for cod. We tested the use of age-specific thresholds on these metrics, setting our thresholds for “exposure” at the median values across all modern fish that were analyzed. These thresholds appeared to work well, but they could be the subject of future refinement. Duration of Mn/Mg above age-specific thresholds generally agrees with the temporal patterns of hypoxia (Figure 5). Lagging the otolith proxy data by 1 year back significantly improved the correlations with hypoxic volume (Figures 5B,C). We do not know the reason for this, but speculate that it could be a slight temporal mis-match in when most of the samples were collected (winter–spring) vs. when hypoxia volume as used here is estimated (late summer–early autumn). Lagged correlations are not uncommon in the sclerochronology literature (e.g., Carré et al., 2005; Velarde et al., 2015; Judd et al., 2018). Hypoxia volume correlated better with our proxy than did hypoxia seafloor areal extent, perhaps because of the way that cod use the three-dimensional space. Finally, calculating the cumulative values of Mn/Mg across the otolith (as a substitute for time) provides a metric of the cumulative effect of exposure.
We found strong, inverse relationships of hypoxia exposure to back-calculated growth (Figures 7, 8), in agreement with laboratory experiments on Atlantic cod (Chabot and Dutil, 1999). Analyzed by decade, size at age was highest in the early 1990s when oxygen levels were highest, lowest in the most recent decade, and intermediate in the 1980s and 2000s, when hypoxia was present but not as severe as in recent years. We note that the 39% difference in length at Age-3 between least and most hypoxia-exposed fish (Figure 8) implies an even greater difference in weight, since the latter increases as roughly the cube of length1. Such differences have consequences for stock spawning biomass, reproductive potential (Mion et al., 2018) and the fisheries industry including economic losses (Svedäng and Hornborg, 2014). To illustrate the potential consequences in terms of economic value, assuming that prices were indifferent to quality of the fish, the weight differences alone imply a 64% loss in value (if value = price × quantity). A more complete assessment of the impact of hypoxia on this provisioning ecosystem service would require information on age-specific biomasses and quality, to which the hypoxia exposure categories could be parsed.
In addition, our results suggest a differentiation in habitat use and hypoxia exposure (Figure 9); fish that manifested the greatest exposure to hypoxia showed elevated Sr/Ca (a salinity proxy, but see discussion below) from Age-3 onward. Assuming that these fish remained in the Baltic and did not migrate out into the North Sea, our results suggest that fish that migrated into deeper, saltier Baltic water had a higher probability of encountering hypoxia, while those that remained in less saline (lower Sr/Ca) habitats were less exposed. This is consistent with tagging studies (e.g., Neuenfeldt et al., 2009).
We also explored otolith microchemistry relationships to fish condition as indexed by Fulton’s K. The strongest relationship – a separation of high from low condition groups by Mg/Ca – was an unanticipated result. However, in light of the growing evidence for Mg incorporation as a function of metabolic activity (Limburg et al., 2018), the extent to which condition reflects metabolism could explain this finding. The impact of hypoxia on metabolic activity is well documented for fishes in general (Fry, 1971; Claireaux and Chabot, 2016), and for cod in particular (Chabot and Claireaux, 2008). We find it remarkable that the separation of groups across all age classes is so strong (Figure 6), suggesting that condition factor, measured only at capture, may reflect long-term metabolic status of Baltic cod. In fish classified as high condition, Mg/Ca was nearly constant or increased moderately with age (up to Age-5, a group with only five observations and thus high variance); whereas fish classified as low condition showed a monotonic decline in Mg/Ca with age.
Current methodologies for collecting microchemical data allow for sampling trace elements and isotopes at varying levels of resolution and accuracy. With quadrupole LA-ICPMS methods, despite being the lowest resolution in the family of high-Z optimized mass spectrometers, low ppm levels of certain isotopes (e.g., 26Mg, 63Cu) are possible to quantify, and sensitivity to some isotopes (e.g., 55Mn, 138Ba) permits accuracy at high spatial resolution. The data collected for this study provide detail at sub-annual levels that we are currently unable to analyze statistically (e.g., the temporal dynamics seen in Figures 2–4) except on an annual or seasonal level. Techniques such as dynamic factor analysis (Zuur et al., 2003), which test for similarities across complex time series, are currently inadequate to handle the large data streams generated by otolith transect analysis – in our case, typically 200–400 replicates per chemical analyte × 10 analytes per fish, but some LA-ICPMS setups generate 10X the number of replicates. At this point, the recourse is to collect data at annual, or at best, coarsely monthly (e.g., Grammer et al., 2017) resolved data. There is a clear need to develop statistical methods to capture the rich detail of short-term dynamics, for example seen when summertime episodes of hypoxia are encountered.
Iodine, which is redox sensitive in carbonates (Lu et al., 2010), could be measured in Baltic cod otoliths, despite high background levels. Iodine appears to be bound in the organic matrix in otoliths (Z. Lu, Syracuse University, personal communication). I/Ca ratios were regularly elevated in the otolith cores, which are protein-dense. We also noted that Mn/Ca was almost always lower in the same otolith region, rising outside of the cores. It is possible that, as survivors, the individuals we measured were born in oxygenated water. However, the relationship of I/Ca to Mn/Ca in cod otoliths is complex, and incorporation of iodine appears to differ from manganese. Further research is needed to elucidate the uptake mechanism.
Strontium concentrations in the Baltic Sea vary with salinity due to large inputs of low-Sr fresh water (Andersson et al., 1992). Otolith uptake of Sr is also affected to some degree by temperature (Izzo et al., 2018), and Townsend et al. (1995) observed an inverse exponential relationship between Sr/Ca and water temperature in larval cod otoliths. In Baltic cod, it is likely that otolith Sr/Ca reflects a combination of temperature and salinity, thus higher levels of Sr/Ca reflect increased salinity and decreased temperature.
Compared to paleo conditions in the Baltic Sea as reflected in Neolithic cod otoliths, the Baltic today is less saline and more hypoxic (Supplementary Figure S-2). Even though manganese is partly affected (positively) by growth rate, the roughly 2.9-fold lower Mn/Ca in Neolithic cod is not explained by slower growth rates, because Neolithic cod grew faster and larger than modern Baltic cod (Limburg et al., 2008). It is impracticable to use the Neolithic otoliths to define thresholds for hypoxia exposure (cf. Altenritter et al., 2018), since so much of the data fall above the mean value [Mn/CaNeolithic (×103) = 0.015]. The same holds true for the new proxy Mn/Mg (Mn/MgNeolithic = 0.148, Mn/MgModern = 0.412). Thus, we chose to use a population-level set of thresholds that defined hypoxia exposure as above the age-specific median values of Mn/Ca and Mn/Mg in modern cod.
Finally, we note that neither lifetime mean values, nor data collected on the outermost edges of otoliths, provided much insight into hypoxia exposure and growth. Lifetime mean values masked the details of year-specific conditions and averaged out differences. Edge analyses proved to be too variable to tease out signals, and suggest that edge chemistry does not necessarily shed insight on hypoxia impacts on growth.
We recommend parsing otolith transect data annually (or even seasonally, if possible) to capture the detail needed to examine hypoxia exposure and its consequences. This requires an understanding of how to determine what constitutes an annual growth zone on the otolith. For Baltic cod, this is a non-trivial problem and methods involving the use of otolith chemistry are in development (Heimbrand et al., unpublished) and used here. Although tedious and time-consuming to produce, the data sets generated provide invaluable information and insights. Going forward, these methods can be applied to study the further fluctuations in the status of Baltic cod as climate change and other drivers shape their environment.
This study has further advanced our understanding of the utility of otolith chemical proxies to study hypoxia exposure and impact on individual fish within populations. Perhaps for the first time, proxies were used to quantify both lifetime exposure (through Mn proxies) and metabolic and growth responses – key information needed to understand population dynamics and thus to help manage the stocks.
The Baltic Sea is unusual in that it is so well studied, so hypoxic, and possesses the biogeochemistry amenable to use manganese as a hypoxia proxy. While this last is the case in some other hypoxic basins [e.g., the Black Sea (Lewis and Landing, 1991), the Gulf of Mexico (Mohan and Walther, 2016; Altenritter et al., 2018), and Chesapeake Bay, United States (Limburg, unpublished data)], many open marine systems with oxygen minimum zones (e.g., the California Current) may lack high enough concentrations of manganese to serve as such a proxy. The search for alternative proxies should continue for those systems, and may require further study of redox biogeochemistry likely to produce divalent cations that can substitute for otolith calcium (Campana and Thorrold, 2001), or other metals that can be incorporated into otolith proteins (Thomas et al., 2017). These may include iron (indicative of anoxia, and detected on rare occasion by KL), zinc, and potentially bromine (Leri et al., 2010). Careful study and testing will be required, but benefits as demonstrated here, in terms of understanding hypoxia exposure, will be substantial.
KL conducted the research and analysis. Both authors conceived of and designed the study, and wrote the manuscript.
The authors declare that the research was conducted in the absence of any commercial or financial relationships that could be construed as a potential conflict of interest.
We thank Y. Walther for providing otoliths from archival collections, and C. Olson for providing Neolithic samples. M. Leiditz and Y. Heimbrand prepared some of the otoliths used in this study. We also thank D. Driscoll, Y. Heimbrand, and T. Næraa for help conducting lab analyses; D. Swaney, B. Walther, and the reviewers provided helpful comments on earlier drafts. We also thank Associate Editor A. Capet. Financial support is acknowledged from the U.S. National Science Foundation (project award #1433759), the Swedish Research Council Formas (project dnr. 2015-865) and the Swedish Agency for Marine and Water Management.
The Supplementary Material for this article can be found online at: https://www.frontiersin.org/articles/10.3389/fmars.2018.00482/full#supplementary-material
Altenritter, M. E., Cohuo, A., and Walther, B. D. (2018). Proportions of demersal fish exposed to sublethal hypoxia revealed by otolith chemistry. Mar. Ecol. Prog. Ser. 589, 193–208. doi: 10.3354/meps12469
Andersson, P. S., Wasserburg, G. J., and Ingri, J. (1992). The sources and transport of Sr and Nd isotopes in the Baltic Sea. Earth Planet. Sci. Lett. 113, 459–472. doi: 10.1016/0012-821X(92)90124-E
Breitburg, D., Levin, L. A., Oschlies, A., Grégoire, M., Chavez, F. P., Conley, D. J., et al. (2018). Declining oxygen in the global ocean and coastal waters. Science 359:eaam7240. doi: 10.1126/science.aam7240
Breitburg, D. L., Hondorp, D. W., Davias, L. A., and Diaz, R. J. (2009). Hypoxia, nitrogen, and fisheries: integrating effects across local and global landscapes. Annu. Rev. Mar. Sci. 1, 329–349. doi: 10.1146/annurev.marine.010908.163754
Campana, S., and Neilson, J. (1985). Microstructure of fish otoliths. Can. J. Fish. Aquat. Sci. 42, 1014–1032. doi: 10.1139/f85-127
Campana, S. E. (1990). How reliable are growth back-calculations based on otoliths? Can. J. Fish. Aquat. Sci. 47, 2219–2227. doi: 10.1139/f90-246
Campana, S. E. (1999). Chemistry and composition of fish otoliths: pathways, mechanisms and applications. Mar. Ecol. Prog. Ser. 188, 263–297. doi: 10.3354/meps188263
Campana, S. E., and Thorrold, S. R. (2001). Otoliths, increments, and elements: keys to a comprehensive understanding of fish populations? Can. J. Fish. Aquat. Sci. 58, 30–38. doi: 10.1139/f00-177
Carré, M., Bentaleb, I., Blamart, D., Ogle, N., Cardenas, F., Zevallos, S., et al. (2005). Stable isotopes and sclerochronology of the bivalve mesodesma donacium: potential application to peruvian paleoceanographic reconstructions. Palaeogeo. Palaeoclim. Palaeoecol. 228, 4–25. doi: 10.1016/j.palaeo.2005.03.045
Carstensen, J., Andersen, J. H., Gustafsson, B. G., and Conley, D. J. (2014). Deoxygenation of the baltic sea during the last century. Proc. Nat. Acad. Sci. U.S.A. 111, 5628–5633. doi: 10.1073/pnas.1323156111
Casini, M., Eero, M., Carlshamre, S., and Lövgren, J. (2016a). Using alternative biological information in stock assessment: condition-corrected natural mortality of Eastern Baltic cod. ICES J. Mar. Sci. 73, 2625–2631. doi: 10.1093/icesjms/fsw117
Casini, M., Käll, F., Hansson, M., Plikshs, M., Baranova, T., Karlsson, O., et al. (2016b). Hypoxic areas, density-dependence and food limitation drive the body condition of a heavily exploited marine fish predator. R. Soc. Open Sci. 3:160416.
Catanzaro, E. J., Murphy, T. J., Garner, E. L., and Shields, W. R. (1966). Absolute isotopic abundance ratios and atomic weight of magnesium. J. Res. Nat. Bur. Stand. A 70, 453–458. doi: 10.6028/jres.070A.037
Chabot, D., and Claireaux, G. (2008). Environmental hypoxia as a metabolic constraint on fish: the case of Atlantic cod, Gadus morhua. Mar. Pollut. Bull. 57, 287–294. doi: 10.1016/j.marpolbul.2008.04.001
Chabot, D., and Dutil, J.-D. (1999). Reduced growth of atlantic cod in nonlethal hypoxic conditions. J. Fish Biol. 55, 472–491. doi: 10.1111/j.1095-8649.1999.tb00693.x
Claireaux, G., and Chabot, D. (2016). Responses by fishes to environmental hypoxia: integration through Fry’s concept of aerobic metabolic scope. J. Fish Biol. 88, 232–251. doi: 10.1111/jfb.12833
Conley, D. J., Björck, S., Bonsdorff, E., Carstensen, J., Destouni, G., Gustafsson, B. G., et al. (2009). Hypoxia-related processes in the Baltic Sea. Environ. Sci. Technol. 43, 3412–3420. doi: 10.1021/es802762a
Diaz, R. J., and Rosenberg, R. (2008). Spreading dead zones and consequences for marine ecosystems. Science 321, 926–929. doi: 10.1126/science.1156401
Eby, L. A., and Crowder, L. B. (2002). Hypoxia-based habitat compression in the neuse river estuary: context-dependent shifts in behavioral avoidance thresholds. Can. J. Fish. Aquat. Sci. 59, 952–965. doi: 10.1139/f02-067
Eero, M., Hjelm, J., Behrens, J., Buchmann, K., Cardinale, M., Casini, M., et al. (2015). Eastern baltic cod in distress: biological changes and challenges for stock assessment. ICES J. Mar. Sci. 72, 2180–2186. doi: 10.1093/icesjms/fsv109
Elsdon, T. S., Wells, B. K., Campana, S. E., Gillanders, B. M., Jones, C. M., Limburg, K. E., et al. (2008). Otolith chemistry to describe movements and life-history parameters of fishes: hypotheses, assumptions, limitations, and inferences. OMBAR 46, 297–330. doi: 10.1201/9781420065756.ch7
Fry, F. E. J. (1971). “The effect of environmental factors on the physiology of fish,” in Fish Physiology 6, eds W. S. Hoar and D. J. Randall (Cambridge: Academic Press), 1–98.
Grammer, G. L., Morrongiello, J. R., Izzo, C., Hawthorne, P. J., Middleton, J. F., and Gillanders, B. M. (2017). Coupling biogeochemical tracers with fish growth reveals physiological and environmental controls on otolith chemistry. Ecol. Monogr. 87, 487–507. doi: 10.1002/ecm.1264
Hansson, M., Viktorsson, L., and Andersson, L. (2017). Oxygen Survey in the Baltic Sea 2017 - Extent of Anoxia and Hypoxia, 1960-2017. Report Oceanography No 63. Göteborg: Swedish Meteorological and Hydrological Institute.
Hinrichsen, H. H., von Dewitz, B., Lehmann, A., Bergström, U., and Hüssy, K. (2017). Spatio-temporal dynamics of cod nursery areas in the Baltic Sea. Prog. Oceanogr. 155, 28–40. doi: 10.1016/j.pocean.2017.05.007
Hong, B., Swaney, D. P., McCrackin, M., Svanback, A., Humborg, C., Gustafsson, B., et al. (2017). Advances in NANI and NAPI accounting for the baltic drainage basin: spatial and temporal trends and relationships to watershed TN and TP fluxes. Biogeochemistry 133, 245–261. doi: 10.1007/s10533-017-0330-0
Hüssy, K. (2010). Why is age determination of baltic cod (Gadus morhua) so difficult? ICES J. Mar. Sci. 67, 1198–1205.
Hüssy, K., Radtke, K., Plikshs, M., Oeberst, R., Baranova, T., Krumme, U., et al. (2016). Challenging ICES age estimation protocols: lessons learned from the eastern baltic cod stock. ICES J. Mar. Sci. 73, 2138–2149. doi: 10.1093/icesjms/fsw107
International Council for the Exploration of the Seas [ICES]. (2014). Report of the Baltic Fisheries Assessment Working Group (WGBFAS), 3–10 April 2014 ICES HQ. ICES Document CM2014/ACOM: 10. Denmark: ICES.
Izzo, C., Reis-Santos, P., and Gillanders, B. M. (2018). Otolith chemistry does not just reflect environmental conditions: a meta-analytic evaluation. Fish Fish. 19, 441–454. doi: 10.1111/faf.12264
Judd, E. J., Wilkinson, B. H., and Ivany, L. C. (2018). The life and time of clams: derivation of intra-annual growth rates from high-resolution oxygen isotope profiles. Palaeogeo. Palaeoclim. Palaeoecol. 490, 70–83. doi: 10.1016/j.palaeo.2017.09.034
Köster, F. W., Möllmann, C., Hinrichsen, H.-H., Tomkiewicz, J., Wieland, K., Kraus, G., et al. (2005). Baltic cod recruitment – the impact of climate and species interaction. ICES J. Mar. Sci. 62, 1408–1425. doi: 10.1016/j.icesjms.2005.05.004
Leri, A. C., Hakala, A., Marcus, M. A., Lanzirotti, A., Reddy, C. M., and Myneni, S. C. B. (2010). Natural organobromine in marine sediments: new evidence of biogeochemical Br cycling. Glob. Biogeochem Cyc 24:GB4017, doi: 10.1029/2010GB003794
Lewis, B. L., and Landing, W. (1991). The biogeochemistry of manganese and iron in the Black Sea. Deep Sea Res. Part A Oceanogr. Res. Pap. 38, S773–S803. doi: 10.1016/S0198-0149(10)80009-3
Limburg, K. E., and Elfman, M. (2017). Insights from two-dimensional mapping of otolith chemistry. J. Fish Biol. 90, 480–491. doi: 10.1111/jfb.13048
Limburg, K. E., Olson, C., Walther, Y., Dale, D., Slomp, C. P., and Høie, H. (2011). Tracking baltic hypoxia and cod migration over millennia with natural tags. Proc. Nat. Acad. Sci. U.S.A. 108, E177–E182. doi: 10.1073/pnas.1100684108
Limburg, K. E., Walther, B. D., Lu, Z., Jackman, G., Mohan, J., Walther, Y., et al. (2015). In search of the dead zone: use of otoliths for tracking fish exposure to hypoxia. J. Mar. Sys. 141, 167–178. doi: 10.1016/j.jmarsys.2014.02.014
Limburg, K. E., Walther, Y., Hong, B., Olson, C., and Storå, J. (2008). Prehistoric vs. modern baltic sea cod fisheries: selectivity across the millennia. Proc. R. Soc. B 275, 2659–2665. doi: 10.1098/rspb.2008.0711
Limburg, K. E., Wuenschel, M. J., Hüssy, K., Heimbrand, Y., and Samson, M. (2018). Making the otolith magnesium chemical calendar-clock tick: plausible mechanism and supporting evidence. Rev. Fish. Sci. Aquacult. 26, 479–493. doi: 10.1080/23308249.2018.1458817
Lu, Z., Jenkyns, H. C., and Rickaby, R. E. M. (2010). Iodine to calcium ratios inmarine carbonate as a paleo-redox proxy during oceanic anoxic events. Geology 38, 1107–1110. doi: 10.1130/G31145.1
Mion, M., Thorsen, A., Dierking, J., Herrmann, J.-P., Huwer, B., Vitale, F., et al. (2018). Effect of fish length and nutritional condition on the fecundity of distressed atlantic cod Gadus morhua from the Baltic Sea. J. Fish Biol. 92, 1016–1034. doi: 10.1111/jfb.13563
Mohan, J., and Walther, B. (2016). Out of breath and hungry: natural tags reveal trophic resilience of Atlantic croaker to hypoxia exposure. Mar. Ecol. Prog. Ser. 560, 207–221. doi: 10.3354/meps11934
Neuenfeldt, S., Andersen, K. H., and Hinrichsen, H.-H. (2009). Some atlantic cod Gadus morhua in the baltic sea visit hypoxic water briefly but often. J. Fish Biol. 75, 290–294. doi: 10.1111/j.1095-8649.2009.02281.x
Nissling, A., and Westin, L. (1997). Salinity requirements for successful spawning of baltic and belt sea cod and the potential for cod stock interactions in the Baltic Sea. Mar. Ecol. Prog. Ser. 152, 261–271. doi: 10.3354/meps152261
Pachur, M. E., and Horbowy, J. (2013). Food composition and prey selection of cod, Gadus morhua (Actinopterygii: Gadiformes: Gadidae), in the southern Baltic Sea. Acta Ichthyol. Piscat. 43, 109–118. doi: 10.3750/AIP2013.43.2.03
Plikshs, M., Hinrichsen, H.-H., Elferts, D., Sics, I., Kornilovs, G., and Köster, F. W. (2015). Reproduction of baltic cod, Gadus morhua (Actinopterygii: Gadiformes: Gadidae), in the Gotland Basin: causes of annual variability. Acta Ichthyol. Piscat. 45, 247–258. doi: 10.3750/AIP2015.45.3.04
Pracheil, B. M., Hogan, J. D., Lyons, J., and McIntyre, P. B. (2014). Using hard-part microchemistry to advance conservation and management of North American freshwater fishes. Fisheries 39, 451–465. doi: 10.1080/03632415.2014.937858
Reddy, K. R., and DeLaune, R. D. (2008). Biogeochemistry of Wetlands: Science and Applications. Boca Raton, FL: CRC Press, 800. doi: 10.1201/9780203491454
Schmale, O., Krause, S., Holtermann, P., Power Guerra, N. C., and Umlauf, L. (2016). Dense bottom gravity currents and their impact on pelagic methanotrophy at oxic/anoxic transition zones. Geophys. Res. Lett. 43, 5225–5232. doi: 10.1002/2016GL069032
Stramma, L., Prince, E. D., Schmidtko, S., Luo, J., Hoolihan, J. P., Visbeck, M., et al. (2012). Expansion of oxygen minimum zones may reduce available habitat for tropical pelagic fishes. Nat. Clim. Change 2:33. doi: 10.1038/nclimate1304
Sturrock, A. M., Hunter, E., Milton, J. A., Johnson, R. C., Waring, C. P., and Trueman, C. N. (2015). Quantifying physiological influences on otolith microchemistry. Meth. Ecol. Evol. 6, 806–816. doi: 10.1111/2041-210X.12381
Svedäng, H., and Hornborg, S. (2014). Selective fishing induces density-dependent growth. Nat. Commun. 5:4152. doi: 10.1038/ncomms5152
Thomas, O. R., Ganio, K., Roberts, B. R., and Swearer, S. E. (2017). Trace element–protein interactions in endolymph from the inner ear of fish: implications for environmental reconstructions using fish otolith chemistry. Metallomics 9, 239–249. doi: 10.1039/c6mt00189k
Townsend, D. W., Radtke, R. L., Malone, D. P., and Wallinga, J. P. (1995). Use of otolith strontium:calcium ratios for hindcastng larval cod Gadus morhua distributions relative to water masses on georges bank. Mar. Ecol. Prog. Ser. 119, 37–44. doi: 10.3354/meps119037
Trouwborst, R. E., Clement, B. G., Tebo, B. M., Glazer, B. T., and Luther, G. W. III (2006). Soluble Mn(III) in suboxic zones. Science 313, 1955–1957. doi: 10.1126/science.1132876
Velarde, A. A., Flye-Sainte-Marie, J., Mendo, J., and Jean, F. (2015). Sclerochronological records and daily microgrowth of the peruvian scallop (Argopecten purpuratus, Lamarck, 1819) related to environmental conditions in Paracas Bay, Pisco, Peru. J. Sea Res. 99, 1–8. doi: 10.1016/j.seares.2015.01.002
Wilson, S., Koenig, A., and Orklid, R. (2008). Development of microanalytical reference material (MACS-3) for LA-ICP-MS analysis of carbonate samples. Geochim. Cosmochim. Acta Suppl. 72:A1025.
Keywords: Baltic cod, hypoxia, otolith microchemistry, manganese, magnesium, growth effects
Citation: Limburg KE and Casini M (2018) Effect of Marine Hypoxia on Baltic Sea Cod Gadus morhua: Evidence From Otolith Chemical Proxies. Front. Mar. Sci. 5:482. doi: 10.3389/fmars.2018.00482
Received: 26 July 2018; Accepted: 29 November 2018;
Published: 18 December 2018.
Edited by:
Arthur Capet, MAST - University of Liège, BelgiumReviewed by:
William Gerald Ambrose Jr., Coastal Carolina University, United StatesCopyright © 2018 Limburg and Casini. This is an open-access article distributed under the terms of the Creative Commons Attribution License (CC BY). The use, distribution or reproduction in other forums is permitted, provided the original author(s) and the copyright owner(s) are credited and that the original publication in this journal is cited, in accordance with accepted academic practice. No use, distribution or reproduction is permitted which does not comply with these terms.
*Correspondence: Karin E. Limburg, a2xpbWJ1cmdAZXNmLmVkdQ==
Disclaimer: All claims expressed in this article are solely those of the authors and do not necessarily represent those of their affiliated organizations, or those of the publisher, the editors and the reviewers. Any product that may be evaluated in this article or claim that may be made by its manufacturer is not guaranteed or endorsed by the publisher.
Research integrity at Frontiers
Learn more about the work of our research integrity team to safeguard the quality of each article we publish.