 Mariana B. Bif
 Dennis A. Hansell
- Department of Ocean Sciences, Rosenstiel School of Marine and Atmospheric Sciences, University of Miami, Miami, FL, United States
To understand controls on the production and remineralization of recalcitrant dissolved organic carbon (DOC) produced in association with positive net community production (NCP), we simulated upwelling systems of different intensities by combining and incubating whole seawater collected from different depths in the Florida Strait (27∘N, ∼79∘W). The natural microbial communities in the treatments grew under controlled light and temperature for 15 days (i.e., the autotrophic phase); they were subsequently incubated for 35 days in the dark heterotrophic phase. We analyzed the phytoplankton composition and pigment fluorescence intensity during the light phase, and dissolved organic and inorganic variables during both phases. Initial high or low availability of inorganic nutrients controlled phytoplankton growth and the magnitude of NCP. In the strong upwelling treatment with higher initial inorganic nutrients, 25% of NCP accumulated as DOC after 15 days, however, this material was in turn fully remineralized during the dark phase. In contrast, low nutrients in the weak upwelling treatment limited the magnitude of NCP and accumulated DOC, which represented 11% of NCP. Surprisingly, most of this fraction resisted microbial remineralization in the dark phase, suggesting that upwellings of different intensities affect the quality of dissolved organic matter produced, thereby affecting the timing and location of its remineralization and, hence, its prospects for export to the deep ocean.
Introduction
Imbalance between primary production (PP) and respiration in the ocean’s euphotic zone results in net community production (NCP) when integrated through time. When PP is stimulated by external inputs of inorganic nutrients, such as NO3-, new production (Dugdale and Goering, 1967) exceeds community respiration and NCP is positive, with a fraction accumulating as dissolved organic carbon (DOC) (Hansell and Carlson, 1998; Raimbault and Garcia, 2008; Guidi et al., 2016). The freshly-produced DOC that resists immediate degradation may survive long enough to be exported through vertical mixing and overturning circulation, thus contributing to the biological carbon pump (Copin-Montégut and Avril, 1993; Carlson et al., 1994; Ducklow et al., 2001; Hansell et al., 2009). The amount of DOC that escapes rapid remineralization varies across environments and seasons (Carlson et al., 1998; Hansell and Carlson, 1998; Hansell and Peltzer, 1998; Romera-Castillo et al., 2016), however, controls on the production of a resistant fraction that not only accumulates in the system, but also retains a residence time allowing subsequent export, is unresolved.
The net production of DOC depends on the local microbial community composition and growth (Conan et al., 2007; Passow et al., 2007). For example, initial concentrations of inorganic nutrients impact the magnitude and quality of organic matter produced. Diatom cultures under nitrogen and phosphorus limitation release less dissolved organic matter (DOM) and of different composition, with a considerable fraction that is inaccessible to heterotrophic bacteria (Wear et al., 2015; Saad et al., 2016). Indeed, variations in NCP and DOC are often observed in environments experiencing periodic change in nutrient inputs, such as temperate systems during different seasons (Lønborg et al., 2009).
Upwelling systems, especially, are controlled by variations in wind that regulate uplift of nutrient-enriched subsurface waters, thereby stimulating NCP. Nutrient supply to the euphotic zone depends on the upwelling intensity, which impacts the autotroph growth and succession, and thereby reshapes the community structure (Abbott and Zion, 1985; Hanson et al., 2005; Loureiro et al., 2011). As a consequence, local accumulation of DOC should vary under different upwelling conditions, with an estimated ∼40% of the ocean’s net production of DOC occurring in upwelling systems (Hansell and Carlson, 1998). A study from Wetz and Wheeler (2004) during an upwelling event off the Oregon coast identified a small portion of plankton-derived DOC that accumulated after nitrate depletion, and with potential to be transported offshore, however, the efficiency in the subsequent export of this material was not assessed.
Here we seek to understand controls on net DOC production under upwelling conditions of varying intensities and the potential for subsequent export to the deep ocean. We conducted laboratory experiments to recreate upwelling systems of different intensities by mixing waters collected from various depths in the Florida Strait; such a design simulates upwelling in this western boundary current system (Czeschel et al., 2012; Zhang et al., 2017). Laboratory experiments cannot mimic the complexity of nature, but they are useful to understand how controlled variables modify trends and processes on a small scale.
Materials and Methods
Seawater for incubations was collected during a cruise across the Florida Strait aboard RV Walton Smith on July 17, 2016 (27∘N, 79.5∘W), using a rosette coupled with a CTD (conductivity + temperature + depth), from the surface layer (5 m depth), 300 and 600 m. The water was transferred to acid-cleaned 8 L polycarbonate carboys using a silicon tube, then brought to a shore-based laboratory for further processing on the same day as collection. Samples from the various depths were combined at various proportions to a final volume of 8 L each replicate, and prepared in triplicates to simulate three upwelling systems with varying deep source waters: 100% surface water to simulate a non-upwelling system (control); 80% surface + 20% 300 m water to simulate a weak upwelling; and 80% surface + 10% 300 m + 10% 600 m water to simulate a strong upwelling system.
Light Incubations
The carboys were maintained under controlled temperature (∼22°C) and light/dark cycles (16/8 h) for 15 days, with daily manual stirring in order to keep O2 concentrations near supersaturation (∼6.5 mg l-1). During this period, the biological community grew without interference, and samples were taken at fixed time points for the following parameters:
Fluorescence Intensity
Approximately 20 mL of the sample water was collected using test tubes, assessed for phytoplankton fluorescence intensity at 488 nm of excitation and 680 nm emission (10-AU Fluorometer, Turner Designs), and reported as relative fluorescence units (RFU).
Microscopy
Biological samples were fixed with Lugol’s solution to 1% of preservative concentration and refrigerated in 10 mL amber glass vials prior to analysis. The samples where fluorescence intensity increased were stored in 5 mL vials and scanned by fluorescence microscopy (Olympus BX51) in order to identify the main groups of phytoplankton growing in the treatments.
Dissolved Organic Carbon (DOC) and Total Dissolved Nitrogen (TDN)
DOC + TDN were analyzed using a Shimadzu TOC-L system equipped with TNM-L for N detection, located at the University of Miami, following the method described by Dickson et al. (2007). The reference material used for equipment calibration and water comparison was provided by the Hansell CRM program (Hansell, 2005). Briefly, using acid-washed polycarbonate filter holders (Pall Corp.) and silicon tubing, 20 mL of sample passed through pre-combusted (450°F overnight) GF/F filters 0.7 μm nominal poresize and were collected into pre-combusted glass vials. The samples were acidified with 40 μL of 4 N hydrochloric acid (HCl) and stored at 4°C until all samples had been taken through the course of the incubation experiment. DOC concentrations are expressed as μmol kg-1 C, with an analytical precision of 1.4 μmol kg-1. TDN results (μmol kg-1 N) were used to calculate dissolved organic nitrogen (DON) concentrations (μmol kg-1 N) by subtracting the inorganic components of TDN: [DON] = [TDN] – ([NO3 + NO2] + [NH4]), with a detection limit of 0.01 μmol kg-1 for TDN.
Nitrate + Nitrite (NO3- + NO2-) Concentrations
Samples from the incubation were filtered by gravity through Whatman GF/F filters (nominal pore size of 0.7 μmol kg-1) into 50 mL FalconTM tubes and stored frozen until analysis. Nitrate (NO3 + NO2) was reduced to NO using an acidic solution of V3+ (Braman and Hendrix, 1989) and measured by chemoluminescence (Teledyne T200U). Each sample was injected in triplicate and alternated with KNO3 standards in order to minimize analytical error. The detection limit for the method was 0.05 μmol kg-1.
Ammonium (NH4+) Concentrations
Samples (4 mL) were filtered using GF/F into 10 mL FalconTM tubes and immediately analyzed. Samples and NH4+ standard replicates were reacted with 1 mL of orthophthaldialdehyde (OPA) solution for 2 h in the dark and quantified using a fluorometer (Turner Designs) at 350 nm/410–600 nm of excitation and emission wavelength, respectively, with a detection limit of 0.01 μmol kg-1. The method was modified from Holmes et al. (1999) and Letscher et al. (2013).
Phosphate (PO43-) Concentrations
Samples were filtered using GF/F into 50 mL FalconTM tubes and frozen until analysis. Concentrations were determined colorimetrically following Strickland and Parsons (1968) using a Shimadzu UV-1800 spectrophotometer. Samples and KH2PO4 standards were reacted with 1 mL of ascorbic acid + 1 mL of mixed reagent for 30 min and read at 880 nm abs, at a detection limit of 0.05 μmol kg-1.
Silicic Acid (SiO42-) Concentrations
Samples from the light incubations were collected into 50 mL FalconTM tubes, frozen upright and analyzed at the end of light experiment (15 days). Samples and standards (25 mL) were mixed with 10 mL of molybdate solution in pre-cleaned FalconTM tubes. After 10 min, 15 mL of reducing reagent was added to the solution and results were quantified by spectrophotometry after 1 h at 810 nm wavelength, with a detection limit of 0.1 μM (Strickland and Parsons, 1968).
Dark Incubations
After 15 days under light conditions, the waters were prepared for dark incubations in order to measure heterotroph production/consumption processes. For each replicate in each treatment, 80% of the whole water was passed through pre-combusted GF/F filters; the filtrate was then recombined with the remaining 20% of unfiltered water. This filtration aimed to remove the majority of autotrophs and particulate organic matter (POM), relieved grazing pressure and allowed bacteria to grow primarily on DOM. The strong upwelling simulation was subdivided into subsequent treatments (Figure 1), i.e., dark incubations with and without inorganic nutrient additions. All chemical parameters were measured immediately before and after filtration for each replicate, and are shown as averaged values since the differences were not significant.
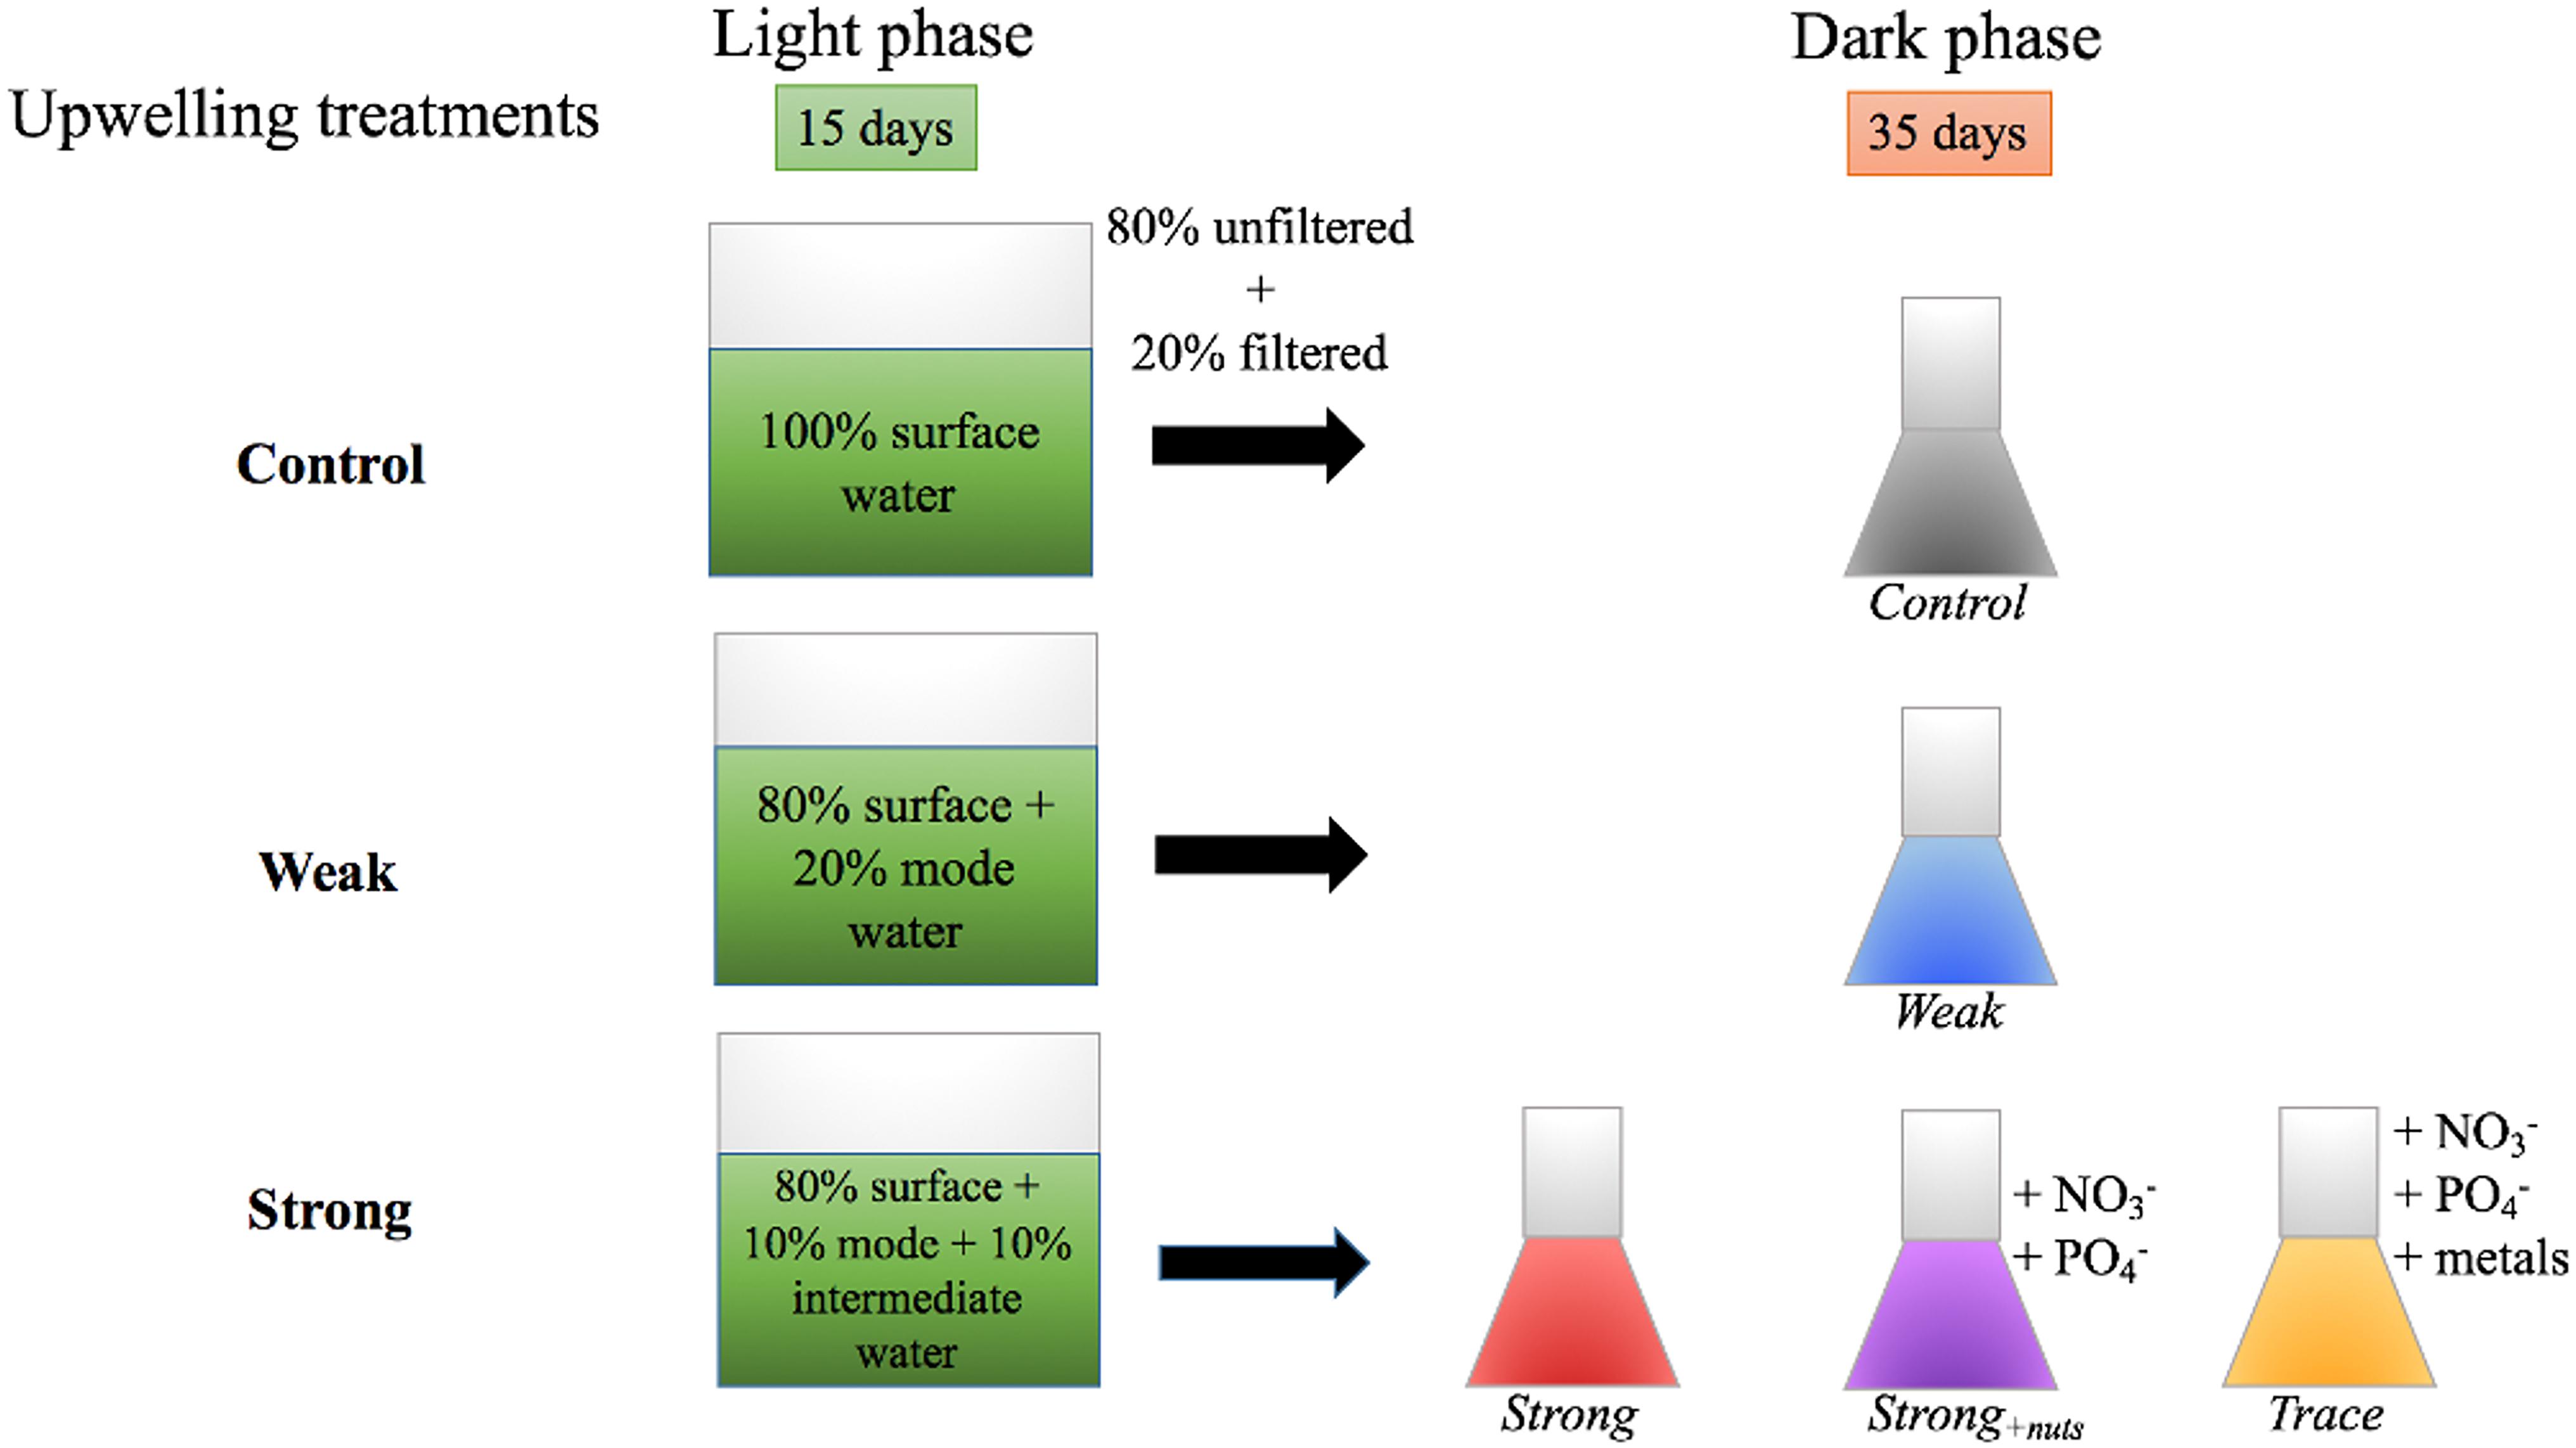
FIGURE 1. Incubation scheme for the upwelling simulations. The experiments involved a 15 days light treatment followed by 35 days dark incubations, the latter with and without inorganic nutrient additions (red and purple vials), and trace metals (yellow vial).
Dark Incubations Without Nutrient Additions
The simulations were grown in polycarbonate carboys in the dark under controlled temperature (∼22°C) for a 35 days period. The parameters collected at different time points were the same as for light treatments absent phytoplankton fluorescence intensity and silicic acid, and are detailed in section Light Incubations.
Dark Incubations With Nutrient and Metal Additions
In order to determine if inorganic nutrients and trace metals influence dissolved organic production/consumption, a fraction of the strong upwelling incubation received inorganic nutrient additions of 5 μmol kg-1 NO3 + 1 μmol kg-1 PO4 at the beginning of the dark incubation. Another fraction received the same concentration of inorganic nutrients and a cocktail of trace metals (Fe.EDTA, Zn, Mn, Co, and Cu) to final concentrations of 0.1 μmol kg-1 for each metal. These last incubations were named Strong+nuts and TRACE, respectively, and were carried out in duplicate for 35 days, following the same procedures as dark incubations from section Dark Incubations Without Nutrient Additions.
Statistical Analyses
We conducted several statistical tests in order to examine the significance of differences between specific treatments depending on the data’s normal distribution through Shapiro–Wilk test (Shapiro and Wilk, 1965). For normally-distributed data, analysis of variance (ANOVA) coupled with Tukey’s post hoc test was performed for each parameter. For non-parametric data, Kruskal–Wallis test coupled with Dunn’s post hoc with uncorrected significance was the most suitable analysis based on our data distribution. The statistical tests were performed using the freeware Past3 (v. 3.14) (Hammer et al., 2001) with an alpha level α = 0.05; the results are shown throughout the text.
Results
Characterization of the Waters for Incubations
Data from a section across Florida Strait at 27°N and between 79° and 80∘W are shown in Figure 2. The Florida Current, which passes northward through the strait, receives contributions from the North and South Atlantic Oceans via the Gulf of Mexico (Schmitz and McCartney, 1993; Schmitz, 1996; Talley et al., 2011). This region is directly influenced by both wind-driven and bathymetric-driven upwellings during the summer months that last 1–3 weeks. The events increase nutrient concentrations at surface up to 19 μM for NO3-, as previously documented, and are an important local source of nutrients (Pitts and Smith, 1997; Zhang et al., 2017). The waters collected for the experiments were from three depths (5, 300, and 600 m), each with distinctive nutrient properties. The surface water (control) had initial DOC and NO3- concentrations of ∼90 and ∼2 μmol kg-1, respectively. At 300 m, Subtropical Mode Water (MW) (26.5 < σ𝜃 < 26.6 kg m-3; ∼18oC) originating in the western North Atlantic was present with low DOC (∼47 μmol kg-1) and NO3- concentrations of ∼15 μmol kg-1. The 600 m water was classified as upper Antarctic Intermediate Water (AAIW) (27.0 < σ𝜃 < 27.3 kg m-3; 7° < T < 12°), characterized by high silicic acid concentrations ∼16 μmol kg-1, low DOC ∼44 μmol kg-1 and high nitrate and phosphate ∼30 and 2 μmol kg-1, respectively (Figure 2).
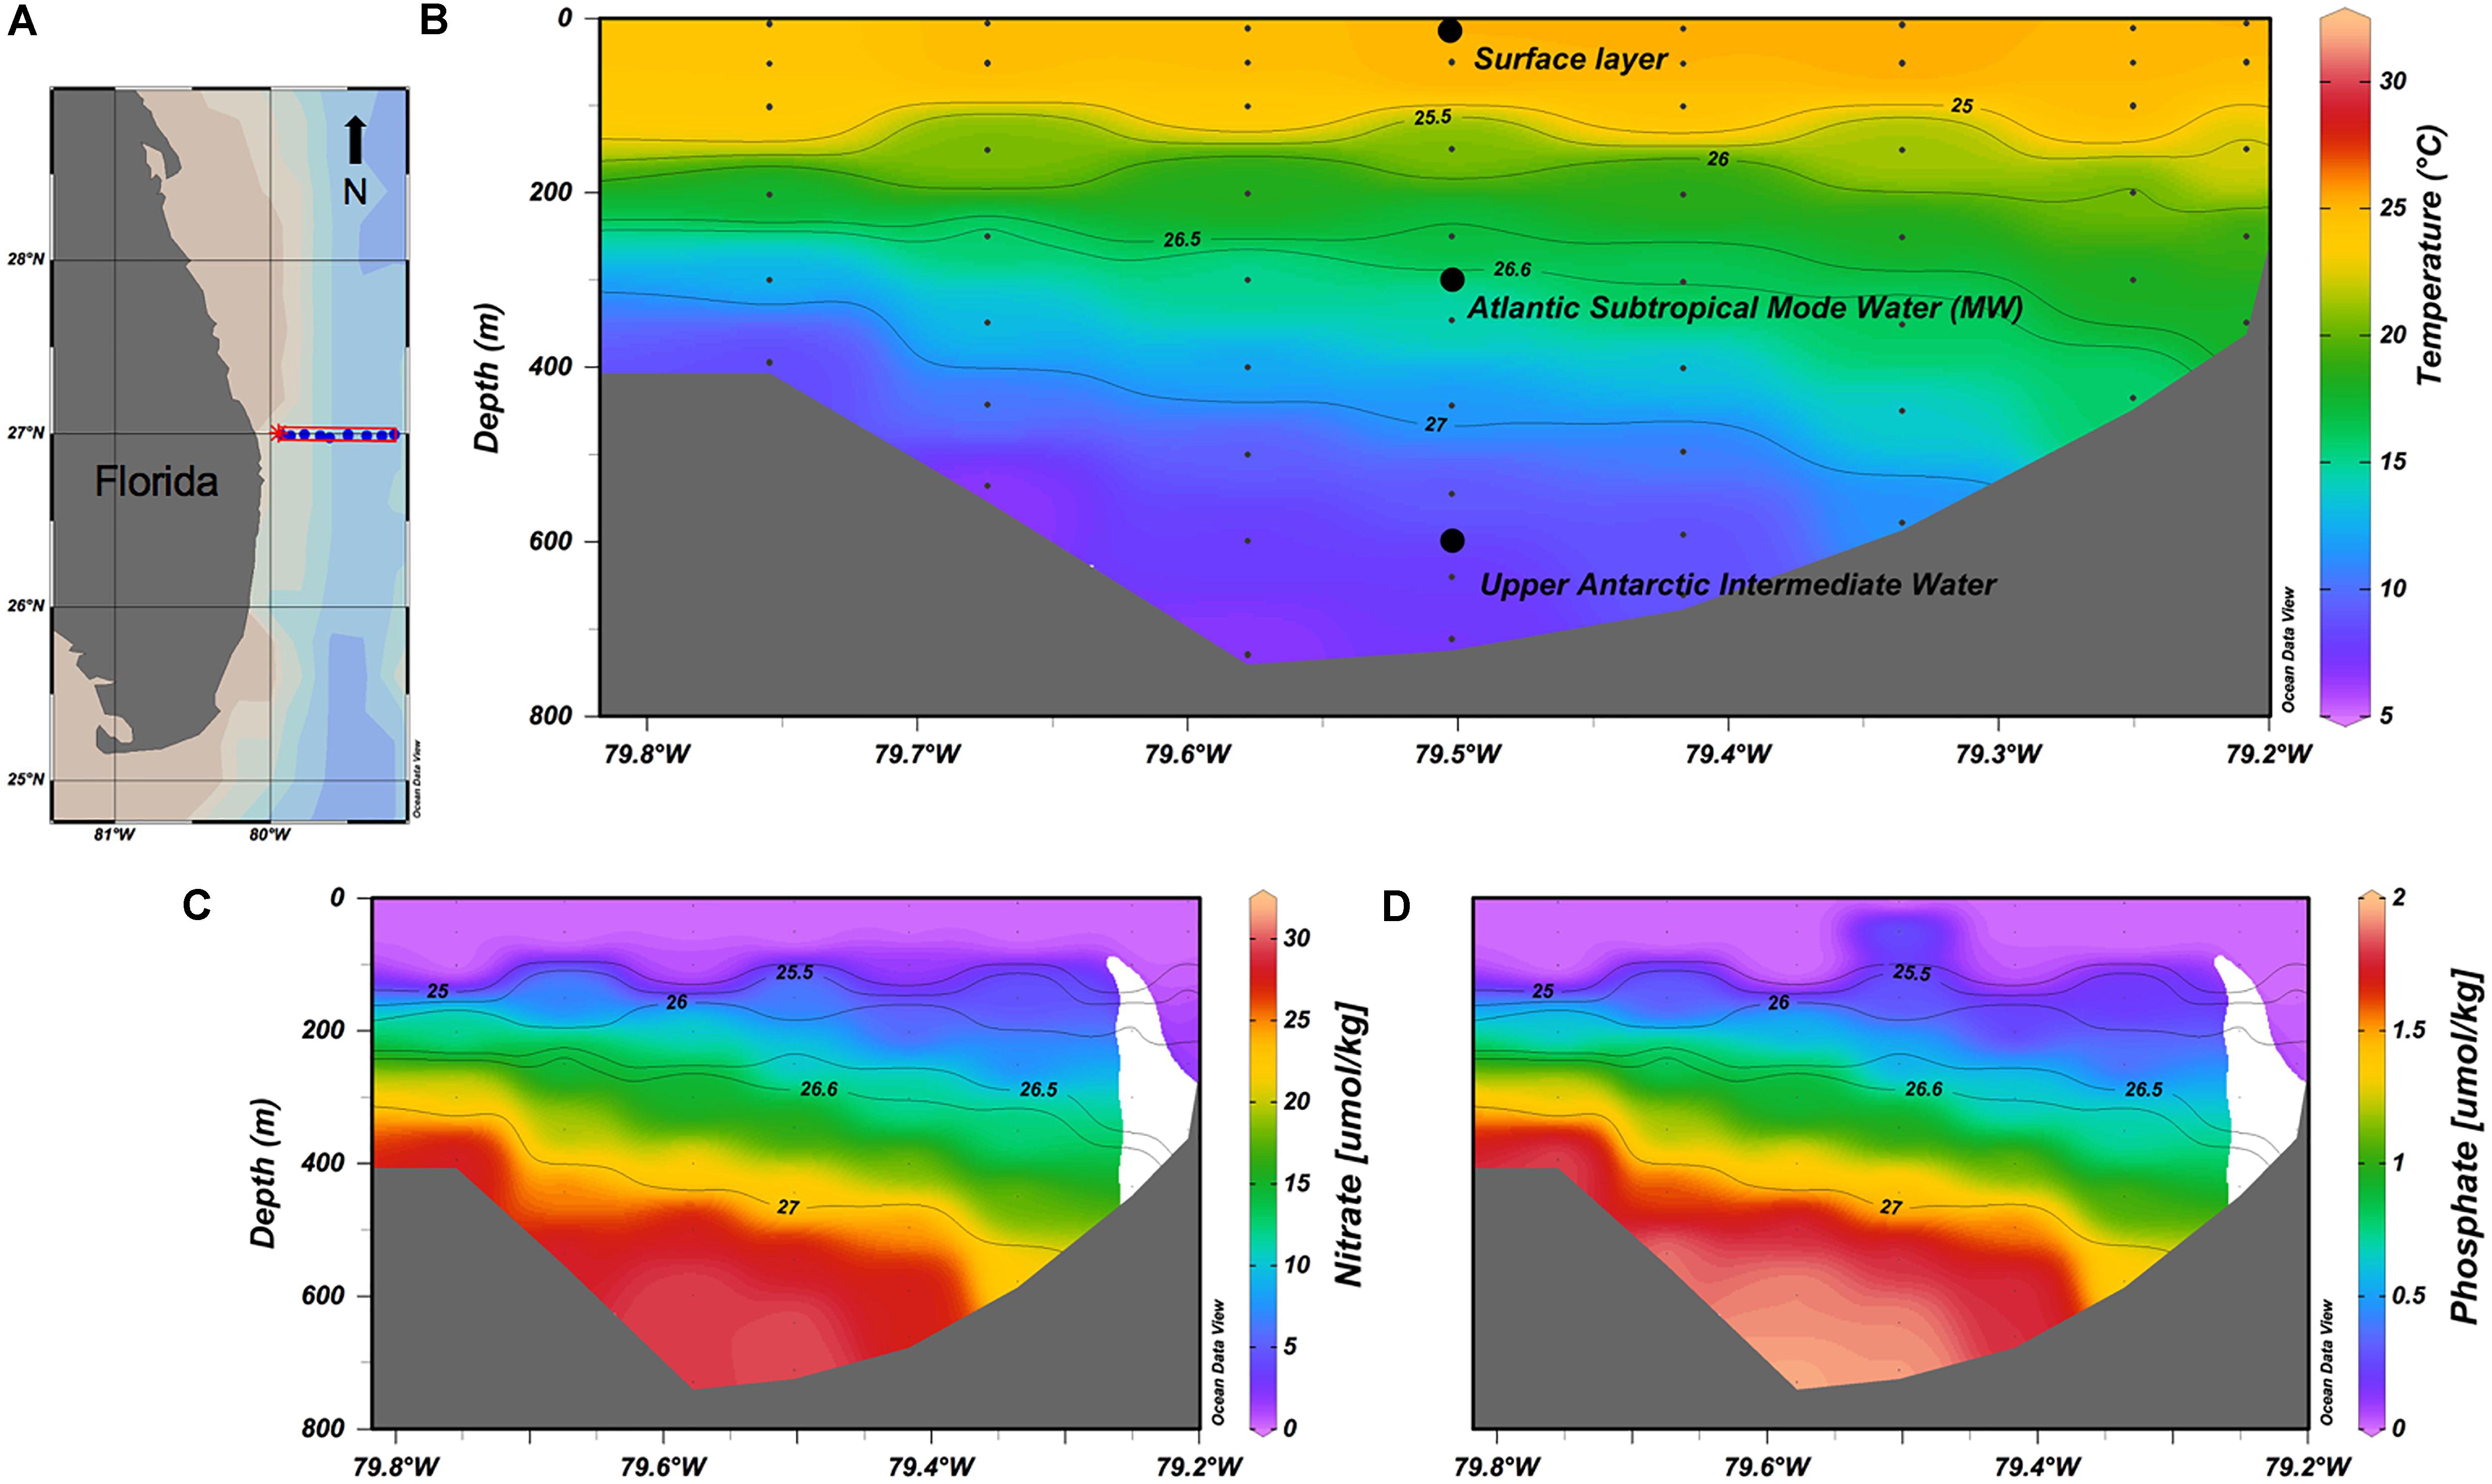
FIGURE 2. In color, temperature (B), nitrate concentrations (C), and phosphate concentrations (D) in the Florida Strait (A) at the time of the cruise. All section plots are overlain with distributions of potential density (σ𝜃). The sampling location and depths are shown in relation to water masses sampled (B). Plotted using Ocean Data View software (Schlitzer, 2018).
Given the variable DOC and nutrient concentrations across the water masses, mixing generated a range of initial conditions for the incubations. In comparison to the control, prepared with unmodified surface whole water, the weak upwelling treatment, enriched with 20% MW, had higher initial inorganic nutrient and lower DOC and DON concentrations. For the strong upwelling treatment, enriched with 10% AAIW and 10% MW, inorganic nutrients were the highest while initial DOC and DON were the lowest across the treatments (Figure 3).
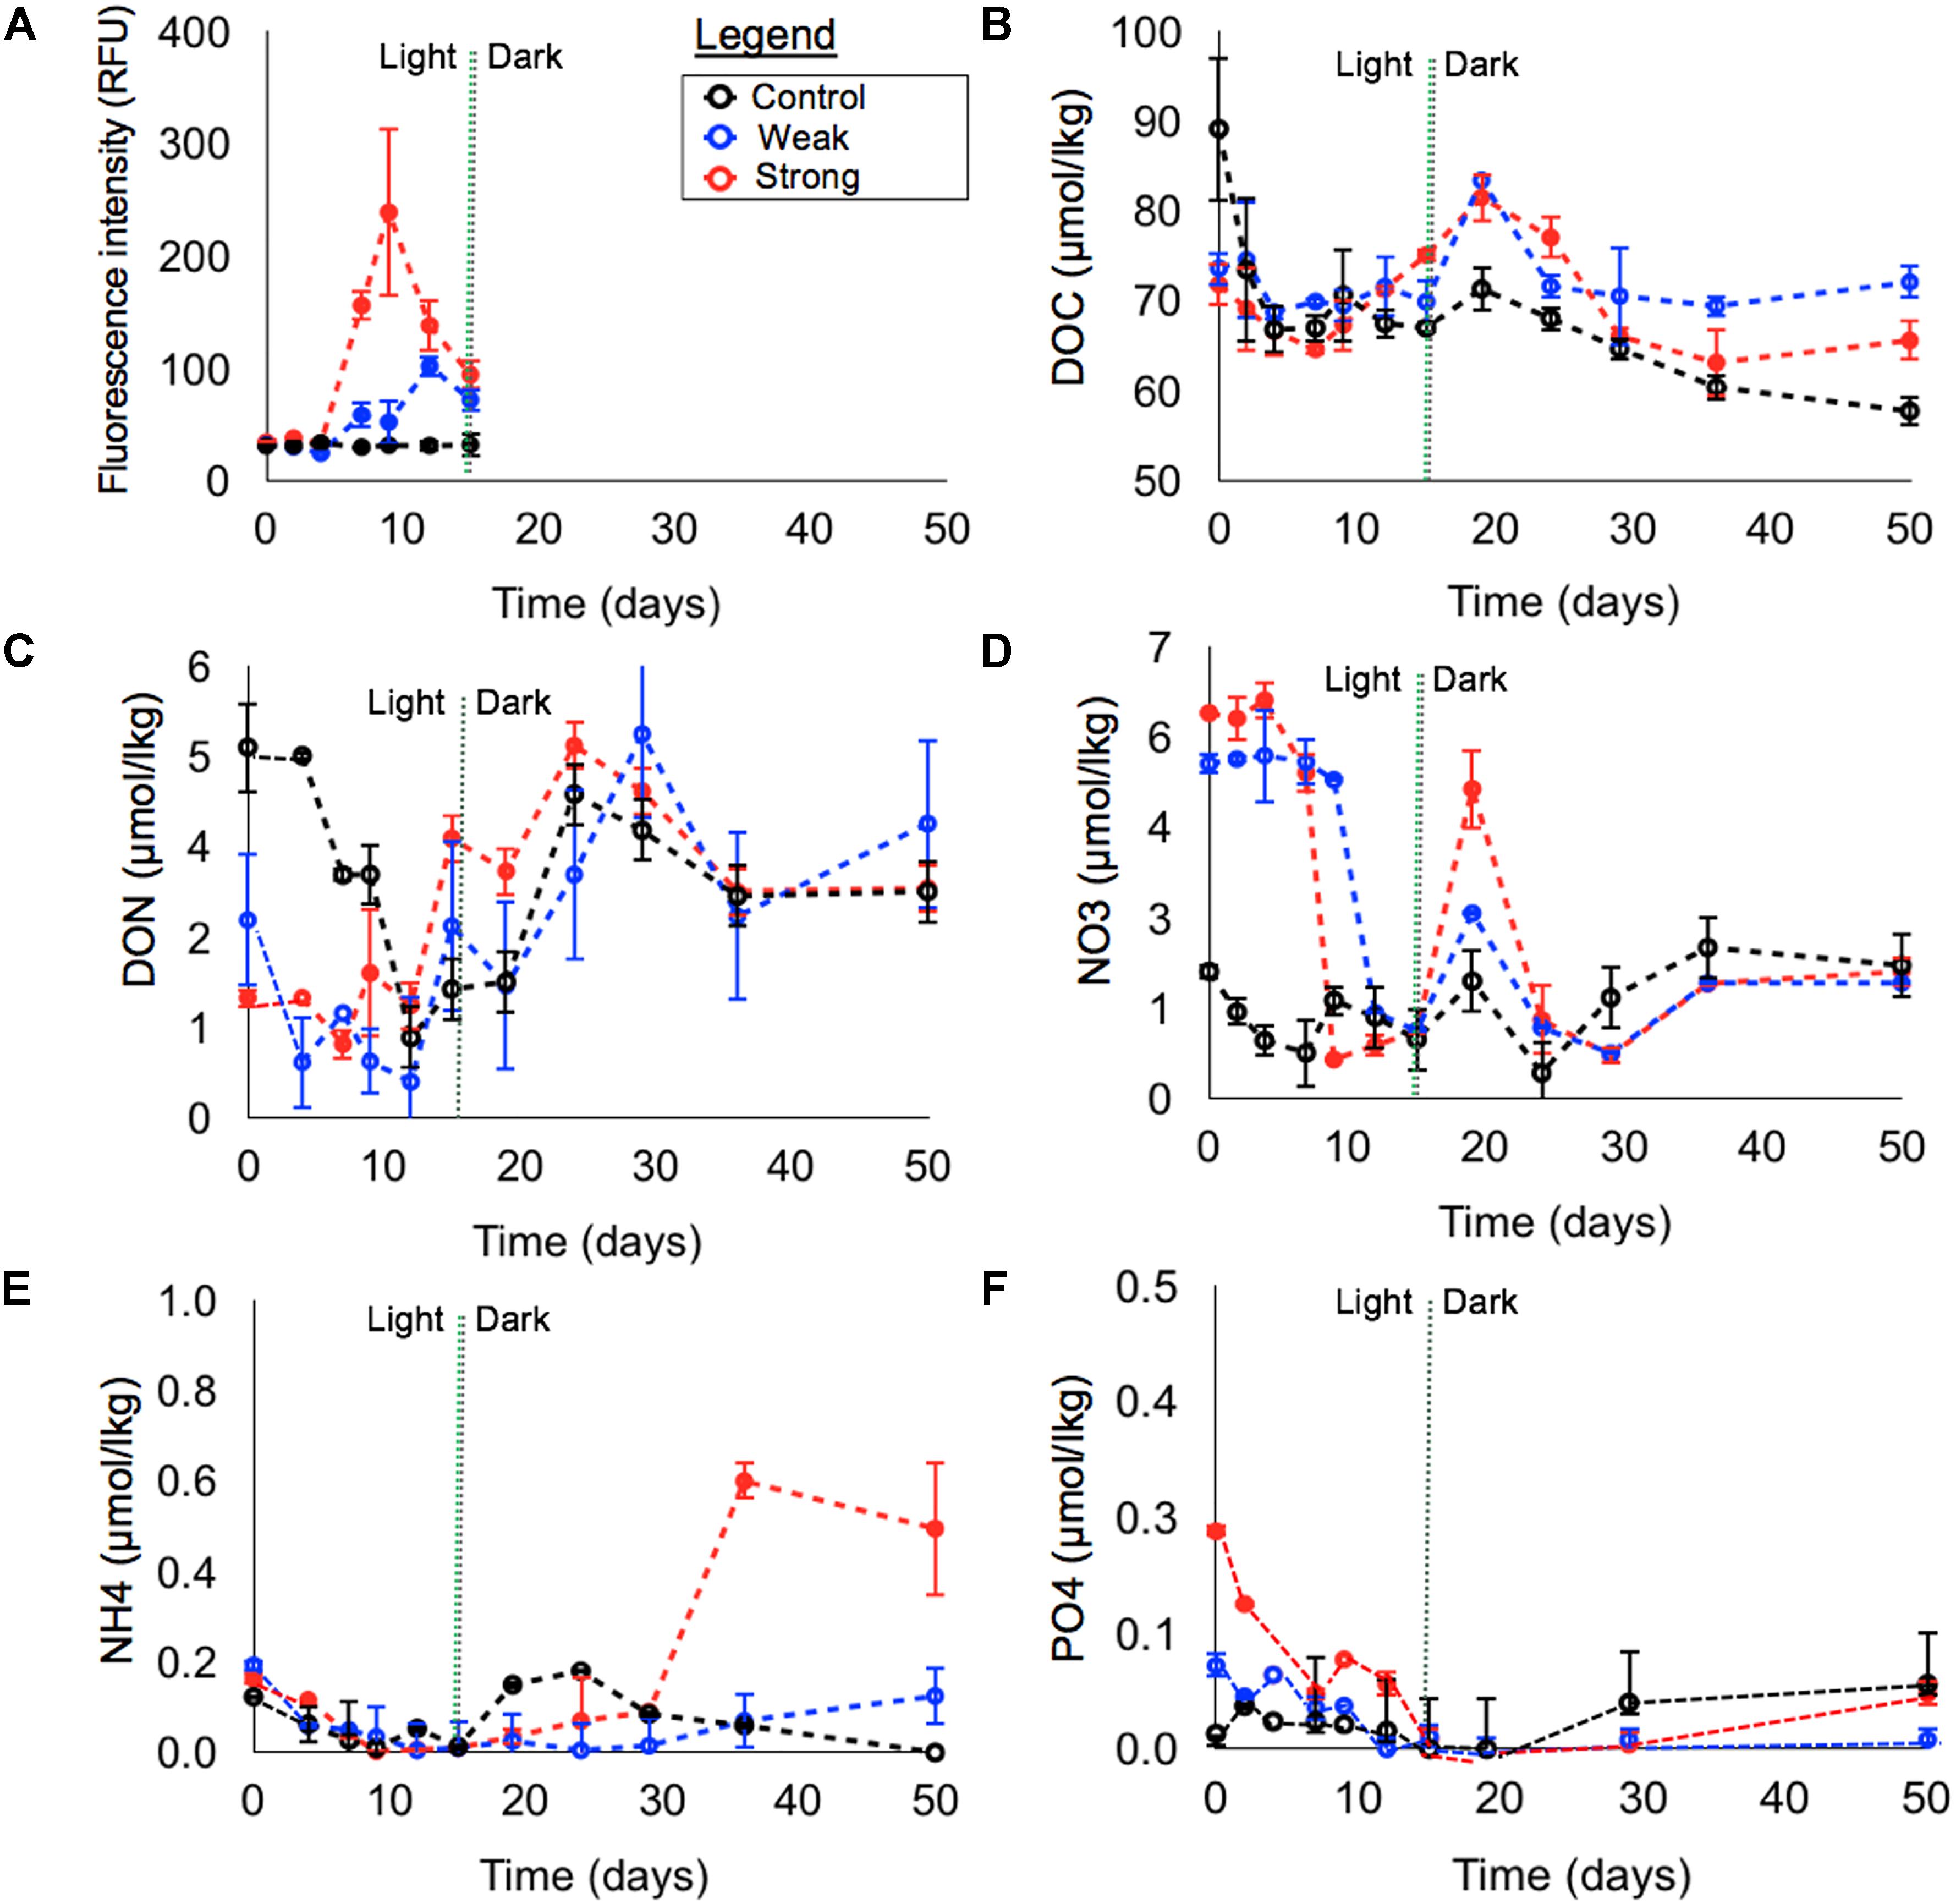
FIGURE 3. Variation in concentrations versus time in light and subsequent dark incubations, separated by vertical dashed lines. Fluorescence intensity (RFU) (A), DOC (B), DON (C), NO3-(D), NH4+ (E), and PO4-3 (F). Error bars are ± 1 S.D. from triplicates.
Phytoplankton Response in the Light Experiments
Figure 3A shows changes in phytoplankton fluorescence intensity for each upwelling simulation during the light treatment. Intensity remained very low in the control through the 15 days, while a smaller peak was observed in the weak upwelling at day 12 (∼100 RFU) and a larger peak in the strong upwelling at day 9 (∼250 RFU). Samples from these time points were analyzed qualitatively by microscopy to identify groups of phytoplankton that were growing; biomass concentrations (i.e., cell density) were not determined due to the limited volume of samples. The control showed an absence of phytoplankton cells, likely due to their low abundance. Both weak and strong upwelling conditions contained groups, during the RFU maximum, that are typical from the open ocean, such as diatoms from the Coscinodiscaceae family; dinoflagellates such as Protoperidinium sp. and Neoceratium sp. were present as well.
The concentrations of silicic acid (data not shown) in the light treatments at day 0 were undetectable in the control and weak upwelling treatments (SiO42-< 0.1 μmol kg-1), and was 4.1 μmol kg-1 in the strong upwelling; the nutrient was depleted by day 7 (SiO42-< 0.1 μmol kg-1). Full SiO42- consumption in the strong upwelling resulted in accumulation of Dactyliosolen sp. chains at day 9, which corresponded to the maximum fluorescence intensity (Figure 3A).
Biogeochemical Variability Through Light and Dark Conditions
In the first 4 days, all treatments experienced net heterotrophy, as evidenced by net DOC loss (Table 1), and the absence of autotroph growth, as shown by unchanged fluorescence intensity (Figure 3A). Thus, we considered these initial days as the lag phase for photoautotroph acclimation in the incubations.
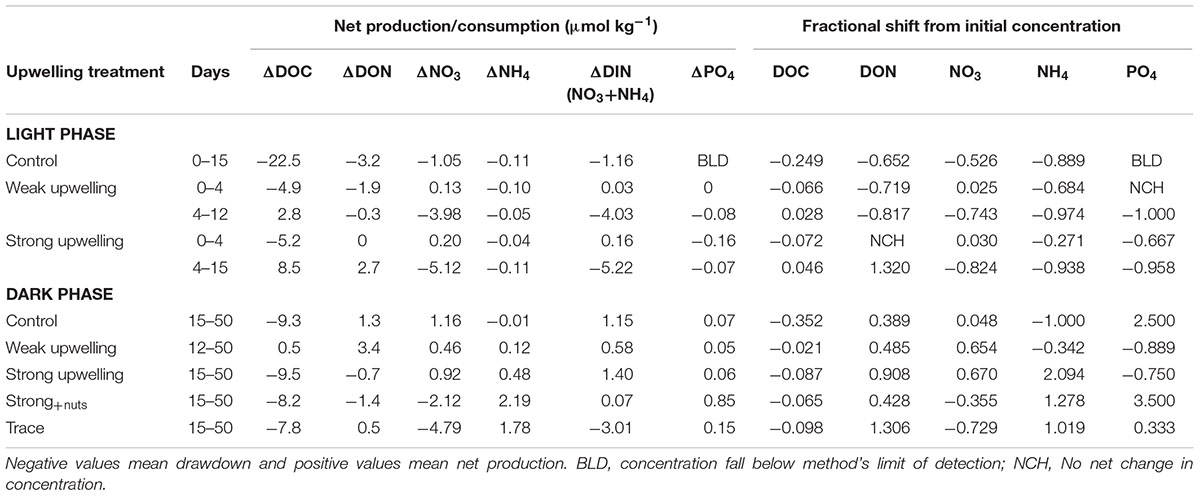
TABLE 1. Net change of variables for the given periods and fractional shift in relation to initial concentrations.
At the beginning of the light experiments, DOC concentrations were ∼89, 74, and 72 μmol kg-1 in control, weak and strong simulations, respectively. After 4 days, DOC changed by -22.3 μmol kg-1 in the control, -4.9 μmol kg-1 in the weak upwelling and -5.2 μmol kg-1 in the strong (Figure 3B and Table 1), to relatively uniform values of ∼67, 69, and 67 μmol kg-1, respectively. During the lag phase, there was little to no change in DON in both control and strong treatments, and a change of -1.9 μmol kg-1 in the weak upwelling (Figure 3C and Table 1). For DIN (sum of NO3- and NH4+), 1.24 μmol kg-1 was consumed in the control; NH4+ was nitrified in the weak treatment according to mass balance (0.13 μmol kg-1 loss of NH4+ versus 0.1 μmol kg-1 gain of NO3-), while there was low net production of 0.16 μmol kg-1 in the strong upwelling treatment (Figures 3D,E and Table 1). During the same period, PO43- had minor changes in all treatments (Figure 3F and Table 1).
Control Treatment
By the end of 15 days, the control experienced a decrease of 22.5 μmol kg-1 DOC, 3.2 μmol kg-1 DON and 1.2 μmol kg-1 DIN, with NH4+ falling to below detection limits (Figure 3 and Table 1); PO4-3 remained < 0.1 μmol kg-1 (Figure 3F). During the dark phase (from days 15 to 50), ΔDOC was -9.3 μmol kg-1, indicating further net consumption, while there was an accumulation of DON (+1.3 μmol kg-1) and DIN (+1.2 μmol kg-1), with consistently < 0.1 μmol kg-1 PO4-3 (Figure 3F). Overall, the control experienced a total DOC decrease of ∼31 μmol kg-1 after 50 days (Figure 3B), with statistically significant changes between light and dark phases (p < 0.05).
Weak Upwelling Treatment
Between days 4 and 12, there was a significant increase in autotroph fluorescence and DOC net production of ∼3 μmol kg-1, with essentially unchanged DON (-0.3 μmol kg-1). During this period, PO43- and NH4+ were brought below detection limits, while ∼4 μmol kg-1 of NO3- was consumed (Figure 3 and Table 1). After 12 days of light incubation, both DOC and DON had dropped ∼2 μmol kg-1. From days 12 to 15 the system appears net heterotrophic, with chlorophyll decreasing along with the consumption of DOC = ∼2 μmol kg-1 (Figures 3B,C); as such, this 3 day period will be discussed together with the subsequent dark phase. DOC concentration was ∼74 μmol kg-1 at the beginning of the light incubation, and ∼71 and 70 μmol kg-1 at days 12 and 15, respectively. After 50 days of experiment, DOC experienced a net decrease of ∼2 μmol kg-1 C down to ∼72 μmol kg-1 (Figure 3B), a net change that was not statistically significant between light and dark phases (p > 0.05).
Strong Upwelling Treatment
The treatment experienced net autotroph growth between days 4 and 15 as evidenced by net DOC and DON production (+8.5 and +2.7 μmol kg-1, respectively); significant removal of NO3- (-5.12 μmol kg-1) and PO4-3 (-0.07 μmol kg-1) occurred, while NH4+ was drawn down to below detection limit (Figure 3 and Table 1). The subsequent dark phase showed net consumption of DOC and DON (-9.5and -0.7 μmol kg-1, respectively) (Figures 3B,C), similar to DOC remineralization in the control during the dark phase (-9.3 μmol kg-1) and contrasting with unchanged DOC in the weak upwelling. DIN was produced at +1.4 μmol kg-1 while PO4-3 experienced production, although remained < 0.1 μmol kg-1 (Table 1 and Figure 3F). DOC was ∼72 μmol kg-1 at the beginning of the strong upwelling simulation and increased to ∼75 μmol kg-1 after 15 days, at the beginning of dark experiment. After 50 days, DOC was drawn down to ∼66 μmol kg-1 (Figure 3B), a net consumption of ∼6 μmol kg-1 C (p < 0.05 between light and dark phases). Changes in net DOC and DON concentrations through the incubations were statistically significant between control, weak and strong upwelling treatments (p < 0.01) for both light and dark phases, and when evaluated as a single continuous incubation.
After the addition of inorganic nutrients and trace metals (Figure 4), DOC did not show a significant difference between treatments by the end of the incubation (p > > 0.05 among strong upwelling, Strong+nuts and TRACE), with averaged DOC consumption of 8.5 ± 0.7 μmol kg-1 C by day 50. For nitrogen pools, strong and Strong+nuts upwelling treatments showed similar DON consumption of ∼1 μmol kg-1 (p > > 0.05), while TRACE showed slight production of 0.5 μmol kg-1 (Figure 4B). NO3- was consumed in Strong+nuts (2.1 μmol kg-1) and at higher levels in TRACE (4.8 μmol kg-1) (Figure 4D), as opposed to the strong upwelling treatment with no additions, that showed net production of 0.92 μmol kg-1 NO3-. NH4+ production was higher in treatments with additions: 2.19 μmol kg-1 in Strong+nuts and 1.78 μmol kg-1 in TRACE versus 0.48 μmol kg-1 in strong (Figure 4C). For the same period, PO4-3 was produced in Strong+nuts (0.85 μmol kg-1) and TRACE (0.15 μmol kg-1), as opposed to the strong upwelling treatment, that did not show significant changes after 50 days (Figure 4E and Table 1).
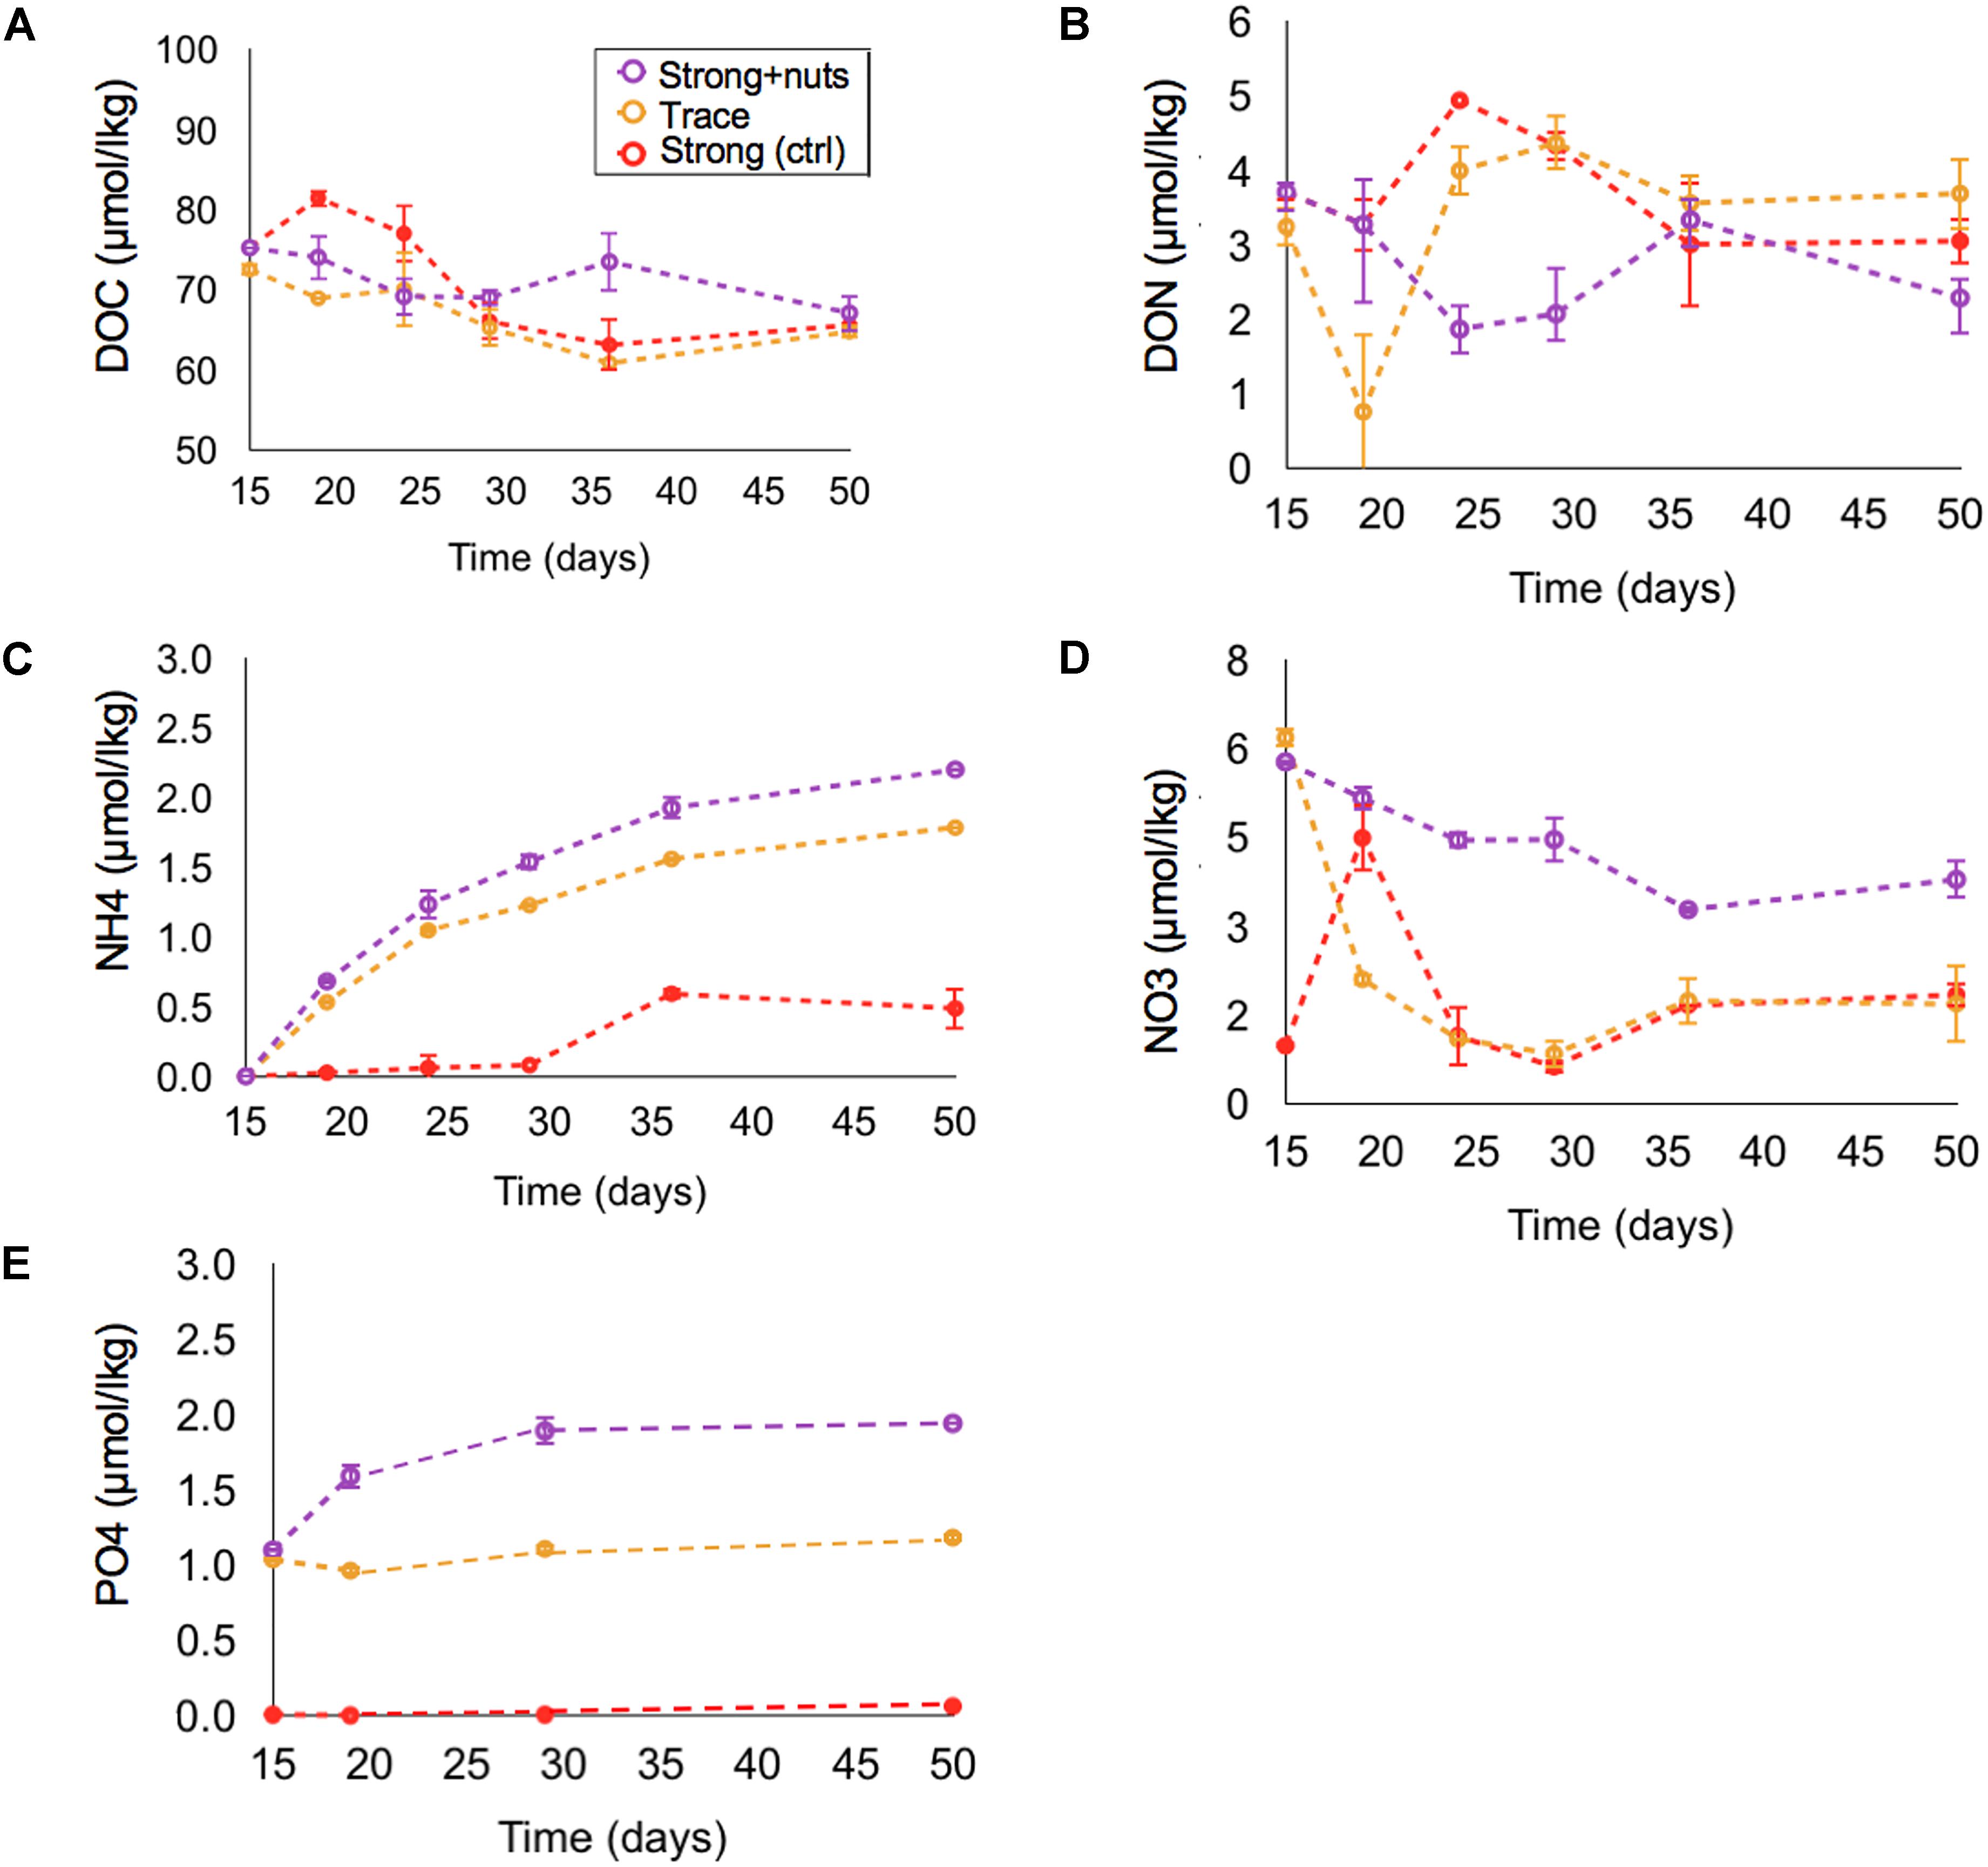
FIGURE 4. Variation in concentrations versus time in the strong upwelling treatments following inorganic nutrient additions and/or trace metals: DOC (A), DON (B), NH4+ (C), NO3-(D), PO4-(E). Error bars are ± 1 S.D. from triplicates.
DIN:DIP
Initial DIN:DIP ratios in all treatments suggest they were P-depleted at the time of collection, with values of 126:1 for control, 60:1 for the weak upwelling and 26:1 for the strong upwelling (Table 2). During the light phase with phytoplankton growth from day 4 to 12 in the weak treatment, and from day 4 to 15 in the strong treatment, DIN and PO4-3 were consumed at different proportions until PO4-3 fell below detection limits (Figures 3D–F). During this period of positive NCP, DIN:DIP increased in the weak upwelling, reaching 107:1 by day 9. In contrast, the ratio for the strong upwelling was reduced to 12:1 by day 12. Subsequent PO43- concentrations were below detection limits in both treatments so ratios were not calculated.
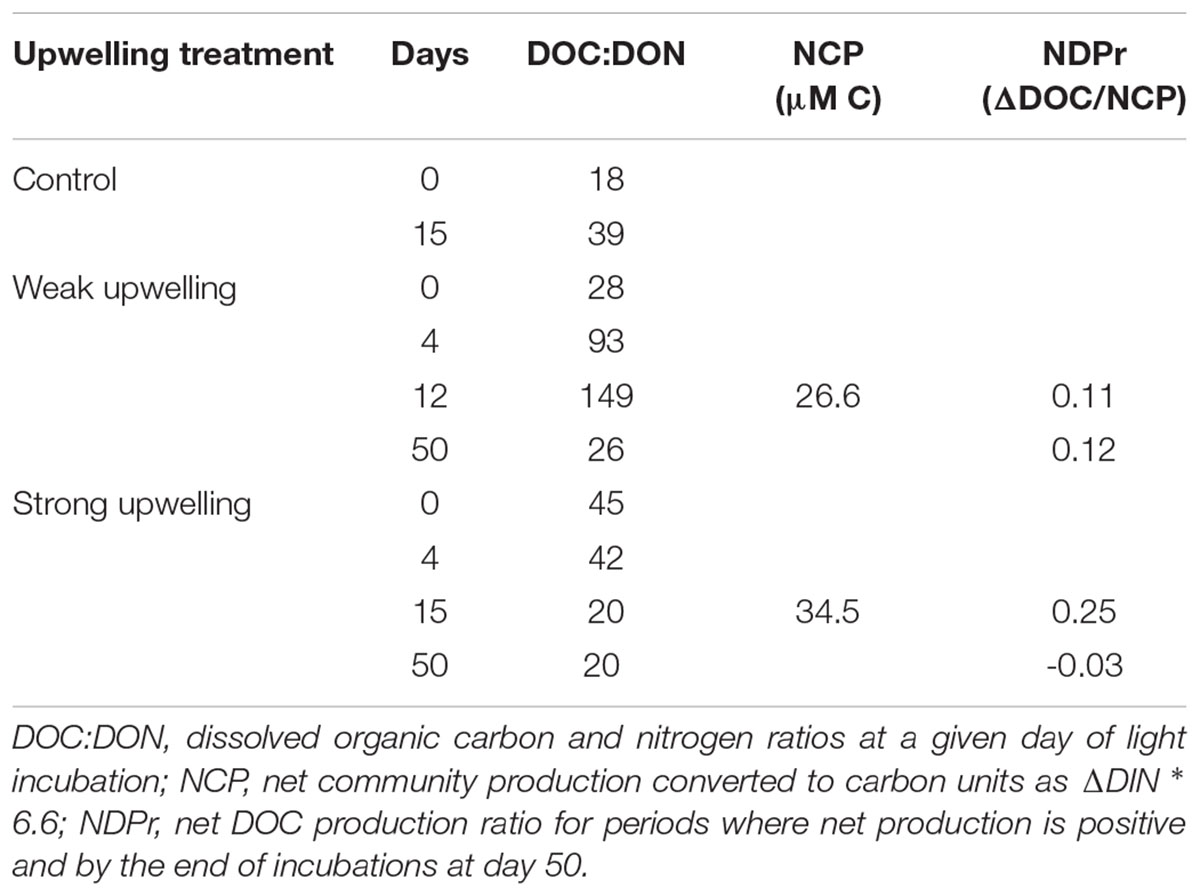
TABLE 2. Derived variables for light and dark incubations in the given periods.
Net Community Production (NCP), Net Dissolved Production Ratio (NDPr), and DOM Quality
In order to compare DOC produced during the weak versus strong upwelling simulations, we estimated net community production (NCP), net dissolved production ratios (NDPr; Romera-Castillo et al., 2016) and DOC:DON ratios, with the last parameter used as a proxy for DOM quality.
We estimated NCP in units of carbon during the light phase from DIN drawdown (ΔDIN ∗6.6) to the point where PO43- was below the limit of detection in both weak and strong upwellings (Table 1). Days 0–4 were net heterotrophic for both experiments as confirmed by low fluorescence intensity, net DOC consumption and NO3- remineralization (Figures 3A,B,D), thus, were not considered in the calculations. In the weak upwelling, NCP was estimated as 26.6 μmol kg-1 C for the period between days 4 and 12, while in the strong it was estimated as 34.5 μmol kg-1 C between days 4 to 15, as summarized in Table 2 (p < 0.01). We then calculated the Net DOC Production ratio (NDPr), or the fraction of NCP that accumulated as DOC in the incubations, from ΔDOC/NCP for the same period. The ratio was 0.11 for the weak upwelling and 0.25 for the strong (Table 2). The values indicate that a smaller fraction of NCP accumulates as DOC in the weak upwelling, while in the strong upwelling twice as much of the NCP accumulated as DOC. The outcome suggests that under light (autotrophic) conditions, higher initial nutrient conditions resulted in a higher fraction of the NCP present as DOC.
The variation in the DOC:DON ratio during the light incubations was used as a proxy for the quality of DOM accumulated, as well as for the quality of DOM remaining during the dark phase. Table 2 shows calculated ratios for initial conditions, as well as the average for periods of net autotrophy and heterotrophy. DOM produced in the weak upwelling was DON-poor relative to the strong upwelling. In the beginning of the experiment, DOC:DON for the weak upwelling was 28:1, and increased to 149:1 by day 12. In contrast, the ratio for the strong upwelling was 45:1 initially, decreasing to 20:1 by day 15. On average, DOC:DON during positive NCP phases remained unchanged in the strong upwelling, but increased significantly along the weak upwelling treatment (p < < 0.01).
Discussion
Net Production of DOC
Coastal upwelling events typically last from a few days to 1–2 weeks (Pitts and Smith, 1997; Wetz and Wheeler, 2004), resulting in phytoplankton blooms until the depletion of one or more essential nutrients such as N, P, and Fe (Arrigo, 2005; Hutchins and Fu, 2008; Burson et al., 2016). In this study, lower initial concentrations of inorganic nutrients in the weak upwelling treatment, especially PO4- (Figure 3), resulted in NCP = ∼27 μmol kg-1 C, with a smaller fraction accumulating as DOC (NDPr = 11%; Table 2). The accumulated DOM was carbon-enriched, with a C:N molar ratio of 149:1. In contrast, the strong upwelling treatment resulted in higher NCP (∼35 μmol kg-1 C), with a higher fraction accumulating as DOC (NDPr = 25%) and with a lower C:N molar ratio of 20:1 (Figure 5A). Phytoplankton composition was also different between the two treatments, as we observed chains of the diatom Dactyliosolen sp. during the high relative fluorescence peak in the strong upwelling treatment. These results suggest that different nutrient availability promotes the growth of distinct microbial communities that release DOM of different composition and reactivity, in agreement with previous studies (Conan et al., 2007; Wear et al., 2015; Saad et al., 2016).
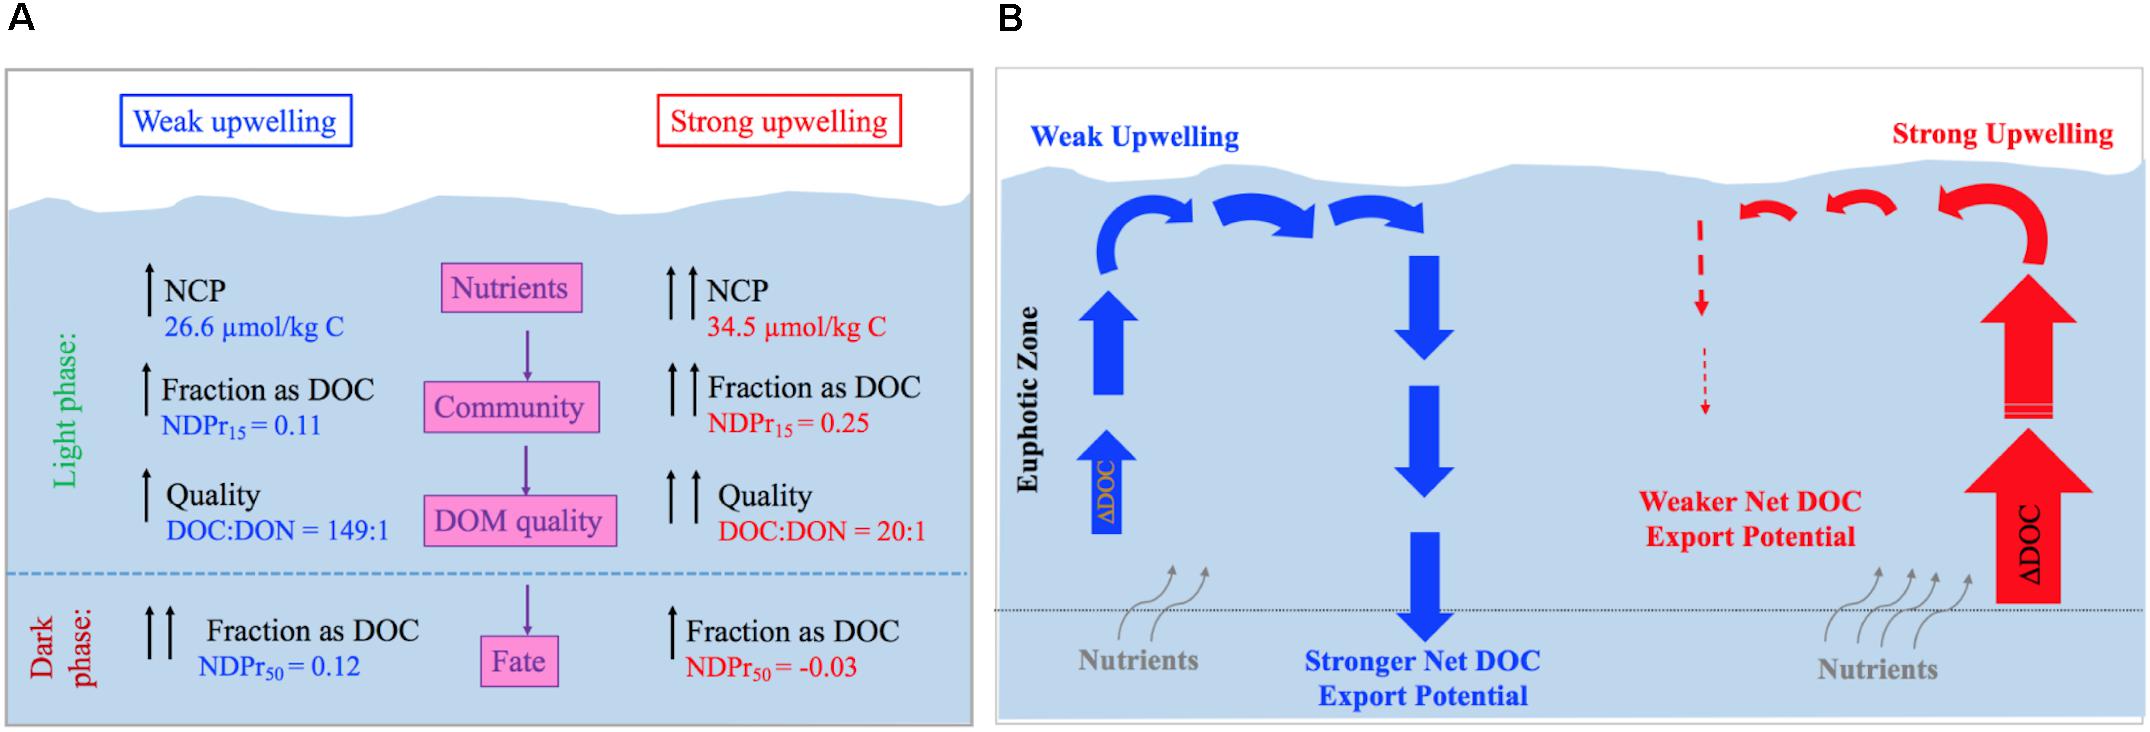
FIGURE 5. (A) Chart comparing net community production (NCP) and organic matter dynamics in the weak (left side) and strong (right side) upwelling simulations during light and dark phases. Weak upwelling resulted in the production of a DOC fraction that was resistant to heterotrophic consumption, while higher nutrients in the strong upwelling favored net community production of a more labile DOC that was fully consumed over the course of the incubation. Fraction accumulated as DOC = NDPr15 for light incubation and NDPr50 for dark incubation; DOM Quality is as indicated by the DOC:DON ratios at day 15 (i.e., last day of light incubation). (B) From ∼27 μmol kg-1 C produced during positive NCP in the weak upwelling simulation, 3 μmol kg-1 (11%) accumulated as DOC. This fraction fully resisted microbial remineralization along >1 month of dark incubation and, thus, has potential to be exported out of the euphotic zone. In contrast, the stronger upwelling simulation produced 35 μmol kg-1 C, by which 9 μmol kg-1 (25%) accumulated as DOC. This fraction was subsequently and fully consumed, demonstrating this initial upwelling condition unlikely contributes for DOC export to the deep ocean.
Wetz and Wheeler (2004), who similarly simulated upwelling systems, showed that NO3--depletion ceased phytoplankton growth and this was followed by DOC accumulation. For comparison with the work done here, we estimate NCP and NDPr ratios using their results. Their NCP ranged between 198 and 290 μmol kg-1 C and NDPr from 0.25 to 0.39, with a diatom (Leptocylindrus minimus) dominating the community exhibiting lower NDPr values and Chaetoceros sp. dominating the higher. Variations in NCP and NDPr did not correlate with bacterial physiological state (high versus low nucleic acid content in bacteria) or grazers, suggesting that the autotroph composition exerted a more direct control on NDPr. NDPr from both Wetz and Wheeler (2004) and our results fall within ratios of 0.10–0.40, as observed across a variety of ecosystems experiencing different ecological states and NCP magnitudes (Hansell and Carlson, 1998; Conan et al., 2007; Mathis et al., 2007; Romera-Castillo et al., 2016). These results reinforce the importance of microbial community composition in controlling the net production of DOC.
The Fate of the Accumulated DOC
Although several previous works have addressed the impact of microbial communities on NCP and net DOC production, what happens after this DOC is released to the environment is unclear. The dark phase of our incubations indicate that DOC produced in the different upwelling treatments had different fates. In the weak upwelling, the fraction of DOC resulting from positive NCP (0.11) was not further remineralized in the dark, giving a relatively unchanged NDPr = 0.12 at 50 days (Table 2). In contrast, the strong upwelling treatment showed net DOC consumption in the dark phase, indicating further removal in the dark and a final NDPr = -0.03 (i.e., total consumption of accumulated DOC at 50 days). The strong upwelling incubation received microbes from deep waters that could have stimulated DOM consumption. Indeed, dark incubations using surface waters from the South Pacific showed higher DOC consumption when exposed to microbes from the mesopelagic zone than from the mixing layer (Letscher et al., 2015). When comparing DOC consumption between mesopelagic microbes exposed to oligotrophic versus mesotrophic waters, those from the mesotrophic region consumed more DOC. The two mesotrophic microbial communities, however, were only exposed to their locally accumulated DOM, that was dependent on the magnitude NCP and had different composition. The link between accumulated DOM and its potential to be exported, thus, still seems to be the production side. Hence, results from our dark incubations suggest that DOC accumulated from upwellings of different intensities experience different fates, where reactivity is dependent on the quality of accumulated DOM (as evidenced by DOC:DON ratios), itself dependent on the autotroph composition (Figure 5A).
A study comparing the Ross and Sargasso Seas, similarly, suggested a link between net DOM production and the ultimate fate of the accumulated fraction (Carlson et al., 1998). The authors assessed differences in DOC-POC partitioning, as well as production and consumption between the two systems, which are very distinctive in terms of PP, community composition and availability of nutrients. Although PP in the Ross Sea was much higher than in the nutrient-depleted Sargasso Sea, DOC represented a smaller fraction (11%) of the total accumulated organic carbon pool (DOC plus POC) in the Ross Sea compared to the Sargasso Sea (∼15–20%). As found in the study reported here, accumulated DOC in the productive Ross Sea was consumed more completely late in the season than that produced in the less productive Sargasso Sea, with the latter DOM typically surviving until export with convective overturn (Hansell and Carlson, 2001).
Sensitivity of DOC Consumption to Inorganic Nutrients and Trace Metals Additions
Our results for the inorganic nutrient and trace metals amendments indicate no change in DOC concentrations relative to non-amended conditions (Figure 4A, p > > 0.05). The amended treatments did experience higher NO3- consumption and PO43- production in comparison to the strong upwelling without additions (the control treatment for this addendum experiment), and enhanced NH4+ production (Figure 4 and Table 1), but none of these had consequence for DOC or DON concentrations.
Limitation by inorganic nutrients and trace metals has been well documented for autotrophs (Arrigo, 2005; Schoffman et al., 2016), but its role in heterotroph metabolism requires attention. Heterotrophic bacteria are able to assimilate NO3-, as observed in the North Pacific and Atlantic Oceans (Kirchman, 1994; Kirchman and Wheeler, 1998), thus competing with phytoplankton for the nutrient. The availability of NO3- promotes changes in bacterial community structure and may favor the assimilation of less labile DOM fractions (Carlson et al., 2004), however, the role of PO43- in bacterial catabolism of DOM is uncertain. Some experiments with PO43- amendments show that its addition enhances bacterial growth in oligotrophic waters (Rivkin and Anderson, 1997; Obernosterer et al., 2003) and that P limitation results in less DOM consumption (Kragh and Søndergaard, 2009). In contrast, other studies showed no relationship between bacterial production and PO43- (Thingstad et al., 2005; Tanaka et al., 2011) or heterotrophic growth and DOM consumption (Carlson and Ducklow, 1996; Zweifel, 1999). Interestingly, amendment by 1 μmol kg-1 PO43- here resulted in a further production of ∼0.85 μmol kg-1 PO43- (Figure 4E), suggesting that the amendment may overcome phosphorus limitation of dissolved organic phosphorus (DOP) mineralization by microbes; unfortunately, DOP was not measured directly in this work.
Heterotrophic bacteria also compete with phytoplankton for trace elements, especially Fe, as their requirement for the element is high (Tortell et al., 1996). Lower concentrations of Fe decrease bacterial growth efficiency and increase their carbon demand due to its critical role in respiratory activity (Tortell et al., 1999). More recently, in situ experiments involving iron fertilization in the Southern Ocean observed the indirect effect of the element to bacterial communities. Although bacterial diversity increased with increasing Fe (West et al., 2008), other environmental conditions control their growth since a less dramatic shift is observed in comparison to phytoplankton (Hutchins et al., 2001; Arrieta et al., 2004). A study conducted by Kirchman et al. (2003) suggested low growth rate and efficiency in Vibrio harveyi due to Fe and NO3- co-limitation, and perhaps explaining low activities in bacterial communities from high-nutrient low-chlorophyll (HNLC) regions. Although our experiments did not assess bacterial growth efficiency or rates, they support Kirchman’s findings that trace metal additions stimulated NO3- uptake by more than 2× in comparison to the strong and Strong+nut treatments (Figure 4 and Table 1).
Overview
The initial availability of inorganic nutrients not only dictates the magnitude of NCP, but also the quantity and quality of freshly-accumulated DOM (Figure 5A). In the weak upwelling simulation, early depletion of PO43- resulted in a relatively low NCP, with a small fraction accumulating as DOC. However, net DOC remained unchanged by the end of experiment, suggesting that a transition from nutrient-replete to -deplete conditions produces a fraction of DOC that resists remineralization (rather than DOC consumption being controlled by nutrients, as that scenario was assessed with amendments), allowing its survival for export to greater depths through mixing processes (Figure 5B). In contrast, availability of nutrients in the strong upwelling treatment stimulated NCP, with ∼25% of net fixed carbon accumulating as DOC. This fraction was subsequently and fully remineralized within ∼1 month in the dark. This contrasting outcome suggests that, even though more DOC accumulates as a result of high NCP, it may not survive for export when quality, as indicated by low C:N, is higher; thus, it is less likely to contribute to long-term DOC storage and export in the ocean (Figure 5B).
Author Contributions
MB conducted the experiments, analyzed the data, wrote the manuscript. DH contributed to the experiment design, quality of figures, provided valuable insights in the discussion, as well as edited the manuscript. KP contributed to the interpretation of results and edited the manuscript.
Funding
MB has a Ph.D. Fellowship supported by Cnpq (Conselho Nacional de Desenvolvimento Científico e Tecnológico), Process No. 205233/2014-7. DH was supported by NSF award OCE-1436748.
Conflict of Interest Statement
The authors declare that the research was conducted in the absence of any commercial or financial relationships that could be construed as a potential conflict of interest.
Acknowledgments
We thank 27oN NOAA cruise Chief Scientist Ryan Smith for the opportunity to join the cruise and collect water samples for the experiments, Research Associate Lillian Custals for support in DOC and DON analyses, and Dr. Larry Brand for use of his incubation facilities at RSMAS.
References
Abbott, M. R., and Zion, P. M. (1985). Satellite observations of phytoplankton variability during an upwelling event. Cont. Shelf Res. 4, 661–680. doi: 10.1016/0278-4343(85)90035-4
Arrieta, J. M., Weinbauer, M. G., Lute, C., and Herndl, G. J. (2004). Response of bacterioplankton to iron fertilization in the Southern Ocean. Limnol. Oceanogr. 49, 799–808. doi: 10.3389/fmicb.2015.00863
Arrigo, K. R. (2005). Marine microorganisms and global nutrient cycles. Nature 437, 349–355. doi: 10.1038/nature04159
Braman, R. S., and Hendrix, S. A. (1989). Nanogram nitrite and nitrate determination in environmental and biological materials by vanadium (III) reduction with chemoluminescence detection. Anal. Chem. 61, 2715–2718. doi: 10.1021/ac00199a007
Burson, A., Stomp, M., Akil, L., Brussaard, C. P., and Huisman, J. (2016). Unbalanced reduction of nutrient loads has created an offshore gradient from phosphorus to nitrogen limitation in the North Sea. Limnol. Oceanogr. 61, 869–888. doi: 10.1002/lno.10257
Carlson, C. A., and Ducklow, H. W. (1996). Growth of bacterioplankton and consumption of dissolved organic carbon in the Sargasso Sea. Aquat. Microb. Ecol. 10, 69–85. doi: 10.3354/ame010069
Carlson, C. A., Ducklow, H. W., Hansell, D. A., and Smith, W. O. Jr. (1998). Organic carbon partitioning during spring phytoplankton blooms in the Ross Sea polynya and the Sargasso Sea. Limnol. Oceanogr. 43, 375–386. doi: 10.4319/lo.1998.43.3.0375
Carlson, C. A., Ducklow, H. W., and Michaels, A. F. (1994). Annual flux of dissolved organic carbon from the euphotic zone in the northwestern Sargasso Sea. Nature 371, 405–408. doi: 10.1038/371405a0
Carlson, C. A., Giovannoni, S. J., Hansell, D. A., Goldberg, S. J., Parsons, R., and Vergin, K. (2004). Interactions among dissolved organic carbon, microbial processes, and community structure in the mesopelagic zone of the northwestern Sargasso Sea. Limnol. Oceanogr. 49, 1073–1083. doi: 10.4319/lo.2004.49.4.1073
Conan, P., Søndergaard, M., Kragh, T., Thingstad, F., Pujo-Pay, M., Williams, P. J. L. B., et al. (2007). Partitioning of organic production in marine plankton communities: the effects of inorganic nutrient ratios and community composition on new dissolved organic matter. Limnol. Oceanogr. 52, 753–765. doi: 10.4319/lo.2007.52.2.0753
Copin-Montégut, G., and Avril, B. (1993). Vertical distribution and temporal variation of dissolved organic carbon in the North-Western Mediterranean Sea. Deep Sea Res. Part 1 Oceanogr. Res. Pap. 40, 1963–1972. doi: 10.1016/0967-0637(93)90041-Z
Czeschel, L., Eden, C., and Greatbatch, R. J. (2012). On the driving mechanism of the annual cycle of the florida current transport. J. Phys. Oceanogr. 42, 824–839. doi: 10.1175/JPO-D-11-0109.1
Dickson, A. G., Sabine, C. L., and Christian, J. R. (2007). Guide to Best Practices for Ocean CO2 Measurements. Sidney, BC: North Pacific Marine Science Organization, 191.
Ducklow, H. W., Steinberg, D. K., and Buesseler, K. O. (2001). Upper ocean carbon export and the biological pump. Oceanography 14, 50–58. doi: 10.5670/oceanog.2001.06
Dugdale, R. C., and Goering, J. J. (1967). Uptake of new and regenerated forms of nitrogen in primary productivity. Limnol. Oceanogr. 12, 196–206. doi: 10.4319/lo.1967.12.2.0196
Guidi, L., Chaffron, S., Bittner, L., Eveillard, D., Larhlimi, A., Roux, S., et al. (2016). Plankton networks driving carbon export in the oligotrophic ocean. Nature 532, 465–470. doi: 10.1038/nature16942
Hammer,Ø, Harper, D. A. T., and Ryan, P. D. (2001). PAST: paleontological statistics software package for education and data analysis. Palaeontol. Electron. 4:9.
Hansell, D. A. (2005). Dissolved organic carbon reference material program. EOS Trans. Am. Geophys. Union 86, 318–318. doi: 10.1029/2005EO350003
Hansell, D. A., and Carlson, C. A. (2001). Biogeochemistry of total organic carbon and nitrogen in the Sargasso Sea: control by convective overturn. Deep Sea Res. Part 2 Top. Stud. Oceanogr. 48, 1649–1667. doi: 10.1016/S0967-0645(00)00153-3
Hansell, D. A., and Carlson, C. A. (1998). Net community production of dissolved organic carbon. Global Biogeochem. Cycles 12, 443–453. doi: 10.1029/98GB01928
Hansell, D. A., Carlson, C. A., Repeta, D. J., and Schlitzer, R. (2009). Dissolved organic matter in the ocean: new insights stimulated by a controversy. Oceanography 22, 202–211. doi: 10.5670/oceanog.2009.109
Hansell, D. A., and Peltzer, E. T. (1998). Spatial and temporal variations of total organic carbon in the Arabian Sea. Deep Sea Res. II 45, 2171–2193. doi: 10.1016/S0967-0645(98)00067-8
Hanson, C. E., Pattiaratchi, C. B., and Waite, A. M. (2005). Sporadic upwelling on a downwelling coast: phytoplankton responses to spatially variable nutrient dynamics off the Gascoyne region of Western Australia. Cont. Shelf Res. 25, 1561–1582. doi: 10.1016/j.csr.2005.04.003
Holmes, R. M., Aminot, A., Kérouel, R., Hooker, B. A., and Peterson, B. J. (1999). A simple and precise method for measuring ammonium in marine and freshwater ecosystems. Can. J. Fish. Aquat. Sci. 56, 1801–1808. doi: 10.1139/f99-128
Hutchins, D. A., Campbell, B. J., Cottrell, M. T., and Takeda, S. (2001). Response of marine bacterial community composition to iron additions in three iron-limited regimes. Limnol. Oceanogr. 46, 1535–1545. doi: 10.4319/lo.2001.46.6.1535
Hutchins, D. A., and Fu, F. X. (2008). “Linking the oceanic biogeochemistry of iron and phosphorus with the marine nitrogen cycle,” in Nitrogen in the Marine Environment, 2nd Edn, eds D. G. Capone, D. A. Bronk, M. R. Mulholland, and E. J. Carpenter (Boston, MA: Academic Press), 1627–1666.
Kirchman, D. L. (1994). The uptake of inorganic nutrients by heterotrophic bacteria. Microb. Ecol. 28, 255–271. doi: 10.1007/BF00166816
Kirchman, D. L., Hoffman, K. A., Weaver, R., and Hutchins, D. A. (2003). Regulation of growth and energetics of a marine bacterium by nitrogen source and iron availability. Mar. Ecol. Progr. Ser. 250, 291–296. doi: 10.3354/meps250291
Kirchman, D. L., and Wheeler, P. A. (1998). Uptake of ammonium and nitrate by heterotrophic bacteria and phytoplankton in the sub-Arctic Pacific. Deep Sea Res. Part I Oceanogr. Res. Pap. 45, 347–365. doi: 10.1016/S0967-0637(97)00075-7
Kragh, T., and Søndergaard, M. (2009). Production and decomposition of new DOC by marine plankton communities: carbohydrates, refractory components and nutrient limitation. Biogeochemistry 96, 177–187. doi: 10.1007/s10533-009-9357-1
Letscher, R. T., Hansell, D. A., Kadko, D., and Bates, N. R. (2013). Dissolved organic nitrogen dynamics in the Arctic Ocean. Mar. Chem. 148, 1–9. doi: 10.1016/j.marchem.2012.10.002
Letscher, R. T., Knapp, A. N., James, A. K., Carlson, C. A., Santoro, A. E., and Hansell, D. A. (2015). Microbial community composition and nitrogen availability influence DOC remineralization in the South Pacific Gyre. Mar. Chem. 177, 325–334. doi: 10.1016/j.marchem.2015.06.024
Lønborg, C., Davidson, K., Álvarez–Salgado, X. A., and Miller, A. E. (2009). Bioavailability and bacterial degradation rates of dissolved organic matter in a temperate coastal area during an annual cycle. Mar. Chem. 113, 219–226. doi: 10.1016/j.marchem.2009.02.003
Loureiro, S., Reñé, A., Garcés, E., Camp, J., and Vaqué, D. (2011). Harmful algal blooms (HABs), dissolved organic matter (DOM), and planktonic microbial community dynamics at a near-shore and a harbour station influenced by upwelling (SW Iberian Peninsula). J. Sea Res. 65, 401–413. doi: 10.1016/j.seares.2011.03.004
Mathis, J. T., Hansell, D. A., Kadko, D., Bates, N. R., and Cooper, L. W. (2007). Determining net dissolved organic carbon production in the hydrographically complex western Arctic Ocean. Limnol. Oceanogr. 52, 1789–1799. doi: 10.4319/lo.2007.52.5.1789
Obernosterer, I., Kawasaki, N., and Benner, R. (2003). P-limitation of respiration in the Sargasso Sea and uncoupling of bacteria from P-regeneration in size-fractionation experiments. Aquat. Microb. Ecol. 32, 229–237. doi: 10.3354/ame032229
Passow, U., Christina, L., Arnosti, C., Grossart, H. P., Murray, A. E., and Engel, A. (2007). Microbial dynamics in autotrophic and heterotrophic seawater mesocosms. I. Effect of phytoplankton on the microbial loop. Aquat. Microb. Ecol. 49, 109–121. doi: 10.3354/ame01138
Pitts, P., and Smith, N. (1997). An investigation of summer upwelling across central florida’s atlantic coast: the case for wind stress forcing. J. Coast. Res. 13, 105–110.
Raimbault, P., and Garcia, N. (2008). Evidence for efficient regenerated production and dinitrogen fixation in nitrogen-deficient waters of the South Pacific Ocean: impact on new and export production estimates. Biogeosciences 5, 323–338. doi: 10.5194/bg-5-323-2008
Rivkin, R. B., and Anderson, M. R. (1997). Inorganic nutrient limitation of oceanic bacterioplankton. Limnol. Oceanogr. 42, 730–740. doi: 10.1038/nature07236
Romera-Castillo, C., Letscher, R. T., and Hansell, D. A. (2016). New nutrients exert fundamental control on dissolved organic carbon accumulation in the surface Atlantic Ocean. Proc. Natl. Acad. Sci. U.S.A. 113, 10497–10502. doi: 10.1073/pnas.1605344113
Saad, E. M., Longo, A. F., Chambers, L. R., Huang, R., Benitez-Nelson, C., Dyhrman, S. T., et al. (2016). Understanding marine dissolved organic matter production: compositional insights from axenic cultures of Thalassiosira pseudonana. Limnol. Oceanogr. 61, 2222–2233. doi: 10.1002/lno.10367
Schlitzer, R. (2018). Ocean Data View. Available at: https://odv.awi.de.
Schmitz, W. J. (1996). On the World Ocean Circulation. The Pacific and Indian Oceans/a Global Update, Vol. 2, Woods Hole, MA: Woods Hole Oceanographic Institution. doi: 10.21236/ADA323804
Schmitz, W. J., and McCartney, M. S. (1993). On the north Atlantic circulation. Rev. Geophys. 31, 29–49. doi: 10.1029/92RG02583
Schoffman, H., Lis, H., Shaked, Y., and Keren, N. (2016). Iron–nutrient interactions within phytoplankton. Front. Plant Sci. 7:1223. doi: 10.3389/fpls.2016.01223
Shapiro, S. S., and Wilk, M. B. (1965). An analysis of variance test for normality (complete samples). Biometrika 52, 591–611. doi: 10.1093/biomet/52.3-4.591
Strickland, J. D. H., and Parsons, T. R. (1968). A practical handbook of seawater analysis. Fish. Res. Board Can. Bull. 167, 49–56.
Talley, L. D., Pickard, G. L., Emery, W. J., and Swift, J. H. (2011). Descriptive Physical Oceanography: An Introduction, 6th Edn. Boston, MA: Academic press, 560.
Tanaka, T., Thingstad, T. F., Christaki, U., Colombet, J., Cornet-Barthaux, V., Courties, C., et al. (2011). Lack of P-limitation of phytoplankton and heterotrophic prokaryotes in surface waters of three anticyclonic eddies in the stratified Mediterranean Sea. Biogeosciences 8, 525–538. doi: 10.5194/bg-8-525-2011
Thingstad, T. F., Krom, M. D., Mantoura, R. F. C., Flaten, G. F., Groom, S., Herut, B., et al. (2005). Nature of phosphorus limitation in the ultraoligotrophic eastern Mediterranean. Science 309, 1068–1071. doi: 10.1126/science.1112632
Tortell, P. D., Maldonado, M. T., Granger, J., and Price, N. M. (1999). Marine bacteria and biogeochemical cycling of iron in the oceans. FEMS Microbiol. Ecol. 29, 1–11. doi: 10.1111/j.1574-6941.1999.tb00593.x
Tortell, P. D., Maldonado, M. T., and Price, N. M. (1996). The role of heterotrophic bacteria in iron-limited ocean ecosystems. Nature 383, 330–332.
Wear, E. K., Carlson, C. A., Windecker, L. A., and Brzezinski, M. A. (2015). Roles of diatom nutrient stress and species identity in determining the short-and long-term bioavailability of diatom exudates to bacterioplankton. Mar. Chem. 177, 335–348. doi: 10.1016/j.marchem.2015.09.001
West, N. J., Obernosterer, I., Zemb, O., and Lebaron, P. (2008). Major differences of bacterial diversity and activity inside and outside of a natural iron-fertilized phytoplankton bloom in the Southern Ocean. Environ. Microbiol. 10, 738–756. doi: 10.1111/j.1462-2920.2007.01497.x
Wetz, M. S., and Wheeler, P. A. (2004). Production and partitioning of organic matter during simulated phytoplankton blooms. Limnol. Oceanogr. 48, 1808–1817. doi: 10.4319/lo.2003.48.5.1808
Zhang, J. Z., Baringer, M. O., and Fischer, C. J. (2017). An estimate of diapycnal nutrient fluxes to the euphotic zone in the Florida Straits. Sci. Rep. 7:16098. doi: 10.1038/s41598-017-15853-0
Keywords: carbon cycle, dissolved organic carbon, dissolved organic matter, net community production, remineralization, upwelling
Citation: Bif MB, Hansell DA and Popendorf KJ (2018) Controls on the Fate of Dissolved Organic Carbon Under Contrasting Upwelling Conditions. Front. Mar. Sci. 5:463. doi: 10.3389/fmars.2018.00463
Received: 17 May 2018; Accepted: 19 November 2018;
Published: 05 December 2018.
Edited by:
Veronica Molina, Universidad de Playa Ancha, ChileReviewed by:
Elvira Pulido-Villena, UMR7294 Institut Méditerranéen d’océanographie (MIO), FranceMarcelo H. Gutiérrez, Universidad de Concepción, Chile
Copyright © 2018 Bif, Hansell and Popendorf. This is an open-access article distributed under the terms of the Creative Commons Attribution License (CC BY). The use, distribution or reproduction in other forums is permitted, provided the original author(s) and the copyright owner(s) are credited and that the original publication in this journal is cited, in accordance with accepted academic practice. No use, distribution or reproduction is permitted which does not comply with these terms.
*Correspondence: Mariana B. Bif, bWFyaWFuYWJpZkBnbWFpbC5jb20=; bWJiNzhAbWlhbWkuZWR1