- 1Shirshov Institute of Oceanology, Russian Academy of Sciences, Moscow, Russia
- 2Federal State Budget Scientific Institution “Marine Hydrophysical Institute of RAS, ” Sevastopol, Russia
- 3Department of Geography of the Ocean, Immanuel Kant Baltic Federal University, Kaliningrad, Russia
Marine beaches worldwide are nowadays exposed to significant contamination by plastics. On the Baltic beaches, polyethylene, polypropylene, and polystyrene are most abundant. We investigate the generation of microplastics particles (MPs, characteristic size from 0.5 to 5 mm) from larger plastic items in the sea swash zone using a laboratory rotating mixer filled with water and natural coarse beach sediment (marine pebbles). Inclination of the axis of rotation and the volume of the material were adjusted in such a way that mixing resembled a breaking wave in the swash zone. Plastic samples used were of the types most commonly found on the sea beaches. Experimental 2 × 2 cm-large plastic items made of low-density polyethylene (LDPE) were manufactured from common new garbage bags (thickness 5 μm); those made of polypropylene (PP) and polystyrene (PS) were produced from single-use tableware; samples of foamed plastics were presented by cubes (with 2-cm sides) cut out of standard building insulator sheets (foamed PS). Four sets of 24-h-long experiments were conducted (for each type of plastic separately), with step-wise (every 3 h) examination of the generated MPs mass, number of particles, and their qualitative characteristics such as shape, quality of the surface, general behavior while mixing, etc. Statistically significant dependencies are obtained for the increase in mass and in number of MPs with time for all four used kinds of plastics. Brittle solid PS is shown to be the most productive in terms of both mass and number of MPs generated. Anisotropic springing PP is the most resistant. Tensile tearing of LDPE and fragmentation of foamed PS to compounding bubbles/spherules show the variety of mechanisms involved in fragmentation of plastics in the swash zone. Increase in MPs mass and the number of MPs particles with time, as well the link between them, are important for field monitoring and numerical modeling. Potentially shape-selective operation of sieves during sampling and sorting of MPs particles of various shapes is discussed.
Introduction
Contamination of marine environments by microplastic particles (MPs) is an unfortunate sign of the development of the Anthropocene epoch on the Earth (Waters et al., 2016): mankind significantly influences its habitat. Unprecedented amounts of plastic objects, their wreckage and smaller plastic particles are nowadays found everywhere in the World Ocean, from Pole to Pole (Nerland et al., 2014) and from shorelines to the deep sea (Barnes et al., 2009; Browne et al., 2011). Fast expansion of this kind of contamination has its roots in the plastics durability and movability. MPs are small (1–5 mm Arthur et al., 2009) and relatively light [in comparison with natural sediments (Chubarenko et al., 2016)]. Transport properties and fate of MP particles depend on their shape, size, and density, all of which vary with time spent in the environment (Chubarenko et al., 2016; Khatmullina and Isachenko, 2016). This makes it difficult to analyse their impact on ecosystems and to model their behavior.
Two types of MPs are usually distinguished by their origin: primary and secondary MPs. The so-called primary MPs is produced as such and appears in marine environment either by chance (like pre-production pellets, abundant in the environment in 1970–1990s Ryan et al., 2009; Karapanagioti, 2012) or with waste waters (like residuals of used scrubbers, cosmetics, etc.). These particles typically have rounded or amorphous 3d shapes, a quite definite size range (e.g., in the US−74–420 μm Beach, 1972), are made of PE, PP, or PS (Zitko and Hanlon, 1991; Gregory, 1996; Hintersteiner et al., 2015; Lassen et al., 2015; Napper et al., 2015; Duis and Coors, 2016), and location of their sources is usually quite predictable. Thus, contamination by primary MPs is relatively easier to tackle, and effective preventive measures against it are already undertaken. The so-called secondary MPs come from destruction of larger objects which have ended up in the marine environment for some reason or another. Given the large amount of macroplastics entering the environment, it is generally assumed that most MPs in the environment are secondary MPs (Andrady, 2011; Hidalgo-Ruz et al., 2012; Duis and Coors, 2016).
Disintegration of common polymers in the terrestrial environment is mainly driven by UV radiation (Andrady, 2011; Duis and Coors, 2016): as a result of photo-oxidative degradation, plastic becomes brittle and eventually fragments. High temperature, thaw-freeze cycles, weathering–all these facilitate plastic degradation, which leads to relatively effective plastic fragmentation on land, and also on the beach surface. In water, the majority of destructive for plastic environmental conditions are absent or at least not as effective (Shah et al., 2008; Barnes et al., 2009; Andrady, 2011), making degradation much slower. As for today's knowledge, plastics are not biodegraded to considerable extent under environmental (especially marine) conditions (Andrady, 2011; Duis and Coors, 2016), and mineralisation of plastics appears to be extremely slow as well (Shah et al., 2008; Andrady, 2011). In the sea, however, new mechanisms appear (Shah et al., 2008; Chubarenko et al., 2016), most effective being mechanical abrasion by sediments and fragmentation in the sea swash and wave breaking zone, especially during stormy events (Chubarenko and Stepanova, 2017; Chubarenko et al., 2018; Efimova and Chubarenko, 2018). Here, properties and qualities of the generated MP particles are very difficult to predict, which does not make this question less important. In this work, in order to single out the effect of interaction with sediments in the swash zone, we consider only mechanical degradation of newly made materials, not discussing their degradation on the beach due to weathering, UV-exposure, oxidation, or any other destructive conditions. As abrasive material, potentially most effective in mechanical degradation under marine environmental conditions, we have selected natural pebbles, collected on the Baltic Sea beaches. This selection is based on the results of our fragmentation experiments carried out with different marine sediments–sand, granules, small, and large pebbles (to be submitted to “Environmental Pollution”). Natural beaches, consisting of gravel, pebbles, and cobbles (known as coarse clastic beaches) can be found along many mid- and high-latitude (formerly glaciated) coasts of England, Iceland, Canada, etc. (e.g., Carter and Orford, 1993), while segments with coarser beach sediments can be commonly found around capes and near cliffs all over the world.
Modern production trends accounted for the selection of plastics used in the reported laboratory experiments. Most common polymers produced worldwide in, e.g., 2012 were polyethylene (PE, 30%) and polypropylene (PP, 19%), followed by polyvinyl chloride (11%) and polystyrene (PS, 7%) (Plastics Europe, 2013). From 288 million tons of plastics produced in 2012, 57 million tons (20%) were produced in Europe (Plastics Europe, 2016). Following worldwide trends, plastic demand in Europe similarly contains about 30% of PE, about 19% of PP, and about 7% of PS (Plastics Europe, 2014).
Monitoring of coastal zones worldwide shows that the types of plastics typically found on the beaches and in sea/ocean coastal zones tend to reflect the most commonly used plastics (Andrady, 2011; Li et al., 2016). For example, a study from Italy (Vianello et al., 2013) found the most predominant microplastics to be PE (48%) and PP (34%). Frias et al. (2014) found PE, PP, and polyacrylates (PA) dominating along the Portuguese coast. On the beaches of Hawaii, PE (85%) and PP (14%) are dominating (Carson et al., 2011). In Claessens et al. (2011), the analyzed granules in coastal and offshore sediments consisted of PP, PS, and PP. Esiukova (2017) found that foamed PS is the most common type of MPs over the beaches of the south-eastern Baltic Sea. Consequently, ingestion by living creatures follows the same plastic-type distribution; (e.g., Goldstein and Goodwin, 2013) revealed that MPs ingested by gooseneck barnacles (Lepas anatifera, Lepas pacifica, Lepas sp.) were PE (58%), PP (5%), and PS (1%). Thus, in aquatic environments PE, PP, and PS are the most frequently found polymers, while fragments, films and styrofoam spherules are among the most commonly found particle types.
About a half of the produced plastic is used in low-value products designed for disposable single-use (Plastics Europe, 2013). The majority of the beach litter consists of single-use PP cups, PS plates, and PE bags (Figure 1). Foamed PS spherules are also mentioned in many studies dedicated to beach MPs (e.g., Claessens et al., 2011; Duis and Coors, 2016; Esiukova, 2017). Below we analyse the process and the results of the degradation of larger plastic items (LPIs, with the characteristic length scale of 2 cm) made of new, bought on the market PP cups, PS plates, low-density PE (LDPE) garbage bags, and building insulation sheets (foamed PS), which were placed for 24 h into the laboratory rotating mixer together with natural 4–6.4 cm large marine pebbles and water, simulating wave breaking on the water's edge of the beach. Purely qualitative description is provided first on how fast and what kind of particles are produced from particular plastic samples. It is followed by a quantitative analysis of stepwise (every 3 h) weighing and calculation of the number of MPs particles generated. Comparison of degradation processes of different plastics and application of the results to the marine environment are provided.
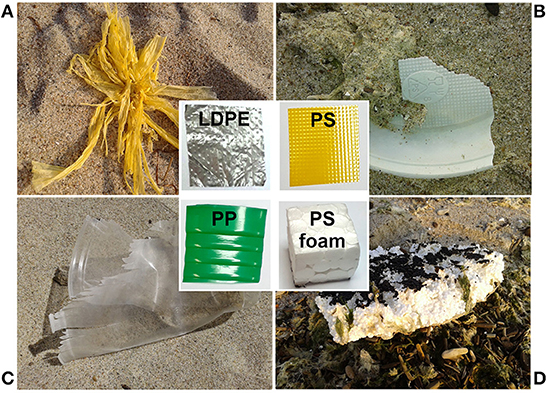
Figure 1. Common types of plastic litter on the beaches of the Baltic Sea: (A) polyethylene (LDPE) garbage bags, (B) polystyrene (PS) single-use plates, (C) polypropylene (PP) single-use beverage glasses, and (D) building insulations sheets (foamed PS) (D). Photos by I. Chubarenko. In the center–respective laboratory samples prepared for the experiment.
Materials and Methods
Selection of the Plastics and the Objects
The following types of plastics were selected for the degradation experiments: LDPE, PP, and PS in its solid and foamed form. There are three reasons for this selection: (i) these are the most popular plastics produced worldwide (Andrady and Neal, 2009), (ii) they are most abundant on marine beaches (Andrady, 2011; Engler, 2012), and (iii) the preference was given to those kinds of objects which might have the most different ways of mechanical destruction (flexible LDPE film; springing PP; brittle solid PS; foamed PS composed of individual spherules). They are mechanically degraded in different ways: PE tears in flakes and fibers, PS breaks up into pieces and needles (strips/strings), PP cracks into oblong plates, and foamed PS scatters into beads (see Figure 2). So we used LDPE garbage bags (thickness−5 μm; material density−0.92 g cm−3), PS single-use plates (10 μm; 1.05 g cm−3), PP single-use beverage glasses (6 μm; 0.86 g cm−3), and building heat insulation plates made of foamed PS (20 mm; 0.011 g cm−3), see Figure 1 in the center. Square 2 × 2 cm LPIs were cut from bags and tableware, while foamed PS plates were cut into 2 × 2 × 2 cm cubes (Figure 2).
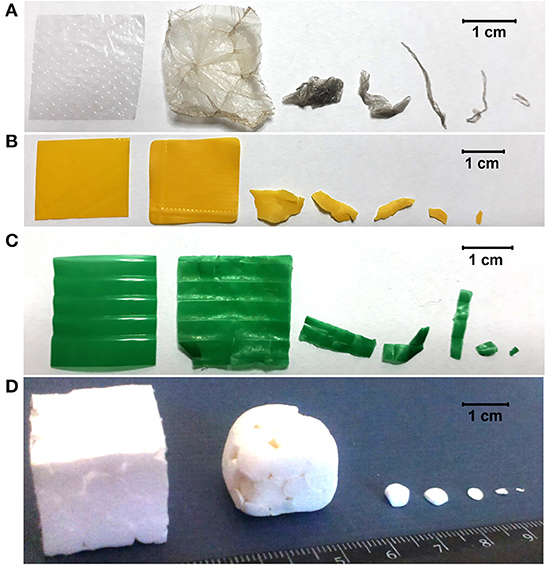
Figure 2. Large plastic items (LPIs, 2 cm each side) of LDPE (A), PP (C), and PS in its solid (B) and foamed (D) form, and examples of macro- and microplastic items present after 24 h of mixing with pebbles and water.
Laboratory Set-Up and Procedure
Problems related to wear of polymers are of great importance in a wide range of applications, including industry, practical use of machines and mechanisms, longevity of commercial products, and many others (e.g., Lancaster, 1969; Viswanath and Bellow, 1995; Pejaković et al., 2015, to name a few). Quite often, their solutions rely on case-specific laboratory wear tests, like comparative examination of polymers on abrasive papers, metal gauze, rough metal surfaces, a rubber, steel, or dry-sand wheels, etc. Some of the tests aim at evaluation of the weight or volume loss of the plastic material (e.g., ASTM D4060 test, www.intertek.com/polymers/testlopedia/taber-abrasion). The same very approach can be used in our case, since the loss of material from large plastic items means the generation of smaller plastic particles. The difference is in the case-specific testing conditions, which in our case will reproduce the considered “natural” external load as close as possible.
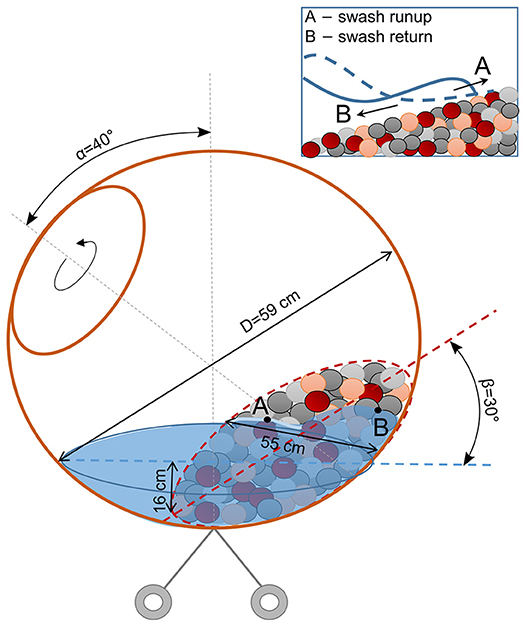
The swash zone is the most dynamic part of the nearshore zone, where pebbles are moved by wave action (asymmetric wave motion e.g., Elfrink and Baldock, 2002), thus providing an effective “mill” for plastics. On natural beaches, a swash zone is a zone which is intermittently wet and dry showing relatively large velocities (up to 3 m/s for long waves on steep beaches Van Rijn, 2013) during the uprush and backwash phases of the saw-tooth swash wave cycle due to bore propagation and bore collapse (Van Rijn, 2013). The pebbles are moved up the beach to the run-up limit by strong bores (uprush) and moved down the beach close to the line of the steepest beach slope by the backwash (less strong due to percolation) plus gravity, resulting in a saw-tooth movement (Van Rijn, 2013). In order to reproduce the main features of this process in a laboratory, we modified the standard concrete mixer, removing the metallic blades and adjusting the angle of inclination of the axis as described below.
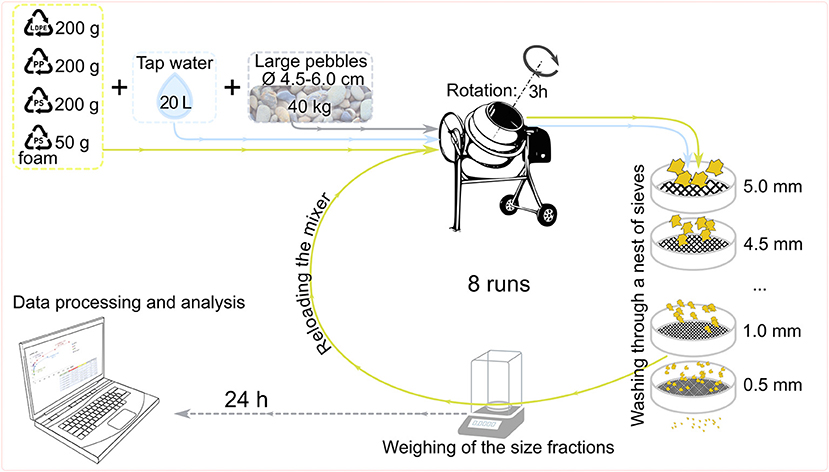
Natural marine pebbles (40 kg, fraction 4–6.4 cm) collected on the Baltic Sea beach, tap water (20 l), and prepared LPIs of one of the selected plastics (200 g of either LDPE, or PS, or PP, or 50 g of foamed PS) were placed into the prepared laboratory mixer with an inclined axis of rotation (Figure 3). There were no metallic blades inside the mixer, to ensure fragmentation of plastics by pebbles only. Every 3 h of mixing, the plastics were filtered out of the mixture and washed through a nest of 10 sieves with the mesh sizes from 5 to 0.5 mm (with the 0.5-mm step). We didn't put a pan underneath the nest to collect the smallest particles, letting them flow out with the water. After that, the remaining plastic particles were dried, weighted, examined, and placed back into the mixer for the next 3 h. Based on this methodology, we consider as MPs here those particles that passed through the 5-mm sieve, but remained within the nest of sieves. In the used set (TransAnalit, standard set C30/50), the sieves with 5.0, 4.5, 4.0, 3.0, 1.5 mm meshes had round openings, while those with 3.5, 2.5, 2.0, 1.0, 0.5 mm meshes were wire woven (i.e., with square openings). This is taken into account during the analysis of the results and pointed out directly in all the graphs and calculations where both kinds of sieves are used together. The use of the set of sieves instead of the two sieves selecting just the size range of MPs (0.5 and 5 mm) is motivated by minimisation of possible errors during weighting and, especially, the particle number calculations. When weight and number of MPs were small, they were picked up from the sieves by tweezers, calculated directly during the collection, and weighted using analytical laboratory scales (Sartogosm MB-210A, working range 1 mg−210 g, precision 0.0001 g). If the weight and number of particles were large enough (e.g., for macro-plastic fraction), the laboratory scales (ACOM JW-1-2000, working range 5–2,000 g, precision 0.1 g) were applied, and the number of MPs were obtained via calculation of the particles of given size fraction in the sub-sample weighted on the analytical scales. Maximum estimated error of weighting of MPs is eventually defined by the precision of laboratory scales and makes up about 1 g; due to gradual increase of mass of MPs the calculated errors for initial runs made up 15–20%, while for final runs it was <1%. For calculation of the number of MPs, maximum bias was contributed by the precision of laboratory scales in the cases when calculation of particles in sub-samples was required (for PS and last runs for LDPE); final accuracy of estimation of the number of particles in such cases was about 103 particles, or <3% of the total number of MPs particles.
The distribution of mass and number of fragments by size fraction and their evolution with time during 24 h were analyzed for every kind of plastics, as well as photos were taken for further analysis of the particles' shapes. Qualitative changes and the behavior of plastic materials were described in protocols.
Frequency of rotation (0.5 Hz) of the mixer, inclination of its axis (α~40° from vertical), and the amount of the working material inside the mixer were adjusted in a way to provide a sort of a surging wave, with swash runup at the side A (Figure 4) and swash return at the side B (see also Video S1). The resulting angle of inclination of the surface of pebbles (β~30°) adjusted itself quite soon after the start of rotation to be in equilibrium with the given “wave energy,” and some pebbles rolling downslope at the rising site B. Measured porosity of the “beach material” amounted to about 0.32. The experiments were carried out at room temperature.
Results and Discussion
Qualitative Behavior of Plastics
Wear and friction are complex subjects where the results depend highly on many factors, including of course the properties of the material under examination (e.g., Lancaster, 1969; Viswanath and Bellow, 1995). This way, variations in the mechanical properties of polymers affect the wear process for a given counterface characteristics. Cutting is the most important for rigid polymers, while fatigue (or sometimes tensile tearing)-for the more elastic polymers (Lancaster, 1969). Given a wide range of polymers found on marine coasts, as well as the variability of the given polymer properties due to additives used, current environmental conditions, and/or time spent in marine environment, we find it important to report the qualitative features of the behavior of the plastics/products selected for this study. This may (i) assist the application of the obtained results to other polymers/objects, which exhibit similar (e.g., brittle, plastic, elastic) properties, (ii) shed some light onto relative roles of ductile, plastic, or elastic deformations in the swash-zone fragmentation process of the considered materials, and (iii) help in understanding of the key physical mechanisms at work under highly complex swash-zone mixing. For practical use in field observations, such qualitative descriptions link the type of plastics on the beach with the shape of the generated MPs and illuminate how (and how fast) the properties of different plastics change with time of fragmentation.
LDPE Film
Polyethylene was chosen as a representative of flexible, elastic polymer material, prone to surface fatigue and tensile tearing. It is also known to have quite low resistance against abrasion (Pejaković et al., 2015).
Garbage bags (thickness−5 μm) from the local supermarket were taken to produce LPIs of LDPE film. Considering the initial weight of samples to be 200 ± 0.1 g, measured material density of 0.92 g cm−3, and a number of pieces in a subsample, the initial total amount of square 2 × 2 cm film LPIs was about 110 thousand items.
Being flexible and elastic, the LDPE samples behave during the experiment quite specifically. After 1 h of mixing with heavy pebbles, the films began bending two- or four-fold, but still remained larger than 5 mm and consequently–in the macro-size fraction. Square LPI pieces became crumpled, with a wrinkled surface. The total weight of dried samples slightly increased due to attaching small fractions of paint from the mixer's walls and crumbs from pebbles. After 9 h of mixing, films started drowning (i.e., they were floating submerged, under the surface). During the washing through the set of sieves, a part of samples flowed through the 5-mm sieve, thus formally getting in the class of MPs. However, the films on the 4.5, 4, 3.5, 3-mm sieves were not broken/ragged, but bent in elongated flattened tubes. On the 2.5-mm sieve and smaller, the particles were thin stretched-out threads (see Figure 2A). After 24 h, the total mass of dried samples was 5% larger than at the beginning, indicating that the part of particles smaller than 0.5 mm is negligible; 31% of the total mass of the dried samples passed through the 5-mm sieve, thus falling into the class of MPs. Increase in mass of the samples of the MPs class with time of mixing was significantly nonlinear, with a substantial jump after 20 h (see Figure 5A). Toward the end of the experiment, the LDPE-material of the samples became very soft, almost inelastic (non-stretching), wrinkled, and weary. Rough edges of the LDPE particles point at the ductile mechanism of failure, and indicate large plastic deformations. Such deformations require a large amount of energy absorption before failure (Mehmood et al., 2012), suggesting that higher-energy environmental conditions are more effective in generation of secondary LDPE MPs. Worn surface of the films reflects contribution of mechanical abrasion as well, which, however, has not yet contributed to the generation of MPs during 24 h of the experiment.
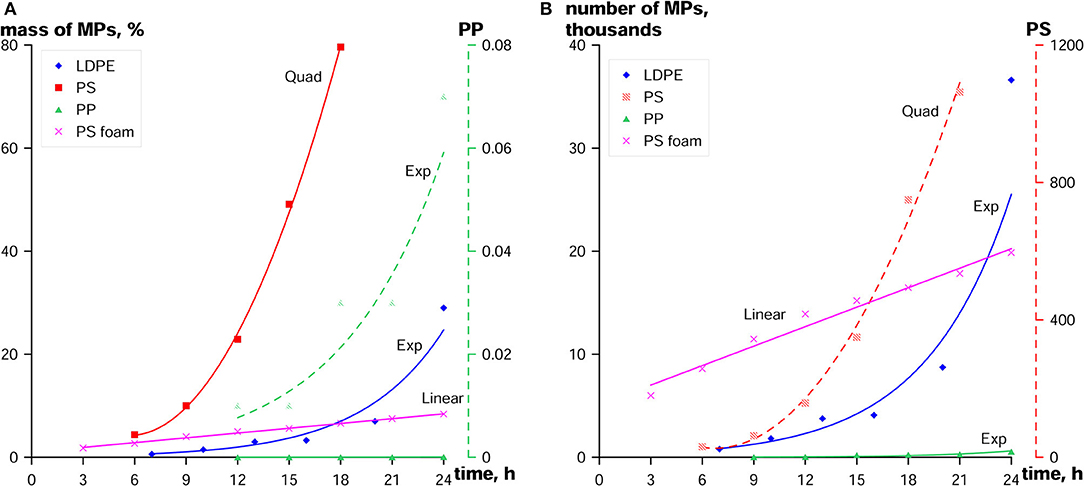
Figure 5. Increase in (A) mass (in per cent of the total mass of the given plastic) and (B) number of MPs particles with time of the experiment for four types of plastic materials. Initial mass of LPIs of LDPE, PS, and PP was 200 g, of PS-foam–50 g. Additional axes at the right-hand side, the dashed graphs, and pale markers show: (A) enlarged exponential best fit for the mass of PP MPs; data and graph at the same scale with other plastics are shown by green triangular markers/solid line; (B) best fit for the number of solid PS MPs at much compressed scale.
Solid PS
Solid PS is a brittle, hard material. The “rippled” bottom parts of common PS disposable plates were used to cut out square 2 × 2 cm LPI-pieces. After the first 3 h of mixing with pebbles, the surface of LPIs became significantly smoother. The main types of LPI-shape distortion included broken corners, triangular chips, and torn off thin strips. All the original LPIs got wrinkled, bent, fractured or twisted. The shapes of the pieces were getting more and more diverse, displaying all kinds of irregularity, e.g., segments, flakes, strips, crumbs, etc. After 15 h of mixing, about 50% of LPIs could still be identified visually as “original squares,” although obviously wrecked and crippled. Three hours later this number decreased to 20% only. The “original squares” disappeared completely from the remaining mass of LPIs after 21 h of mixing.
A remarkable feature of PS fragmentation process was sudden acceleration of growth of MPs mass after 20 h of mixing, manifesting the material fatigue. If during the first 9 h the LPIs mass was decreasing relatively slowly (minus 2%–4%−7% of the total mass per 3 h), as much as 48% of the LPIs mass was lost between 15 and 18 h. Still, even after 24 h of mixing there were a few LPI flakes (0.4 g) left. At the same time, the total mass of PS in the mixer after 24 h has decreased by 18% in comparison to the initial LPIs' mass, showing that about one third of the material had been fragmented to tiny pieces smaller than 0.5 mm. The same process of fast fragmentation of PS leads also to the shift in the MPs size distribution: after 21 h of mixing, a massive shift from larger 5–3.5 mm fractions to smaller 3–0.5 mm occurred. Overall, the experiments showed fast brittle failure of solid PS LPIs.
PP
Polypropylene is a springing, mechanically rugged plastic material. For the reported experiment, te LPIs (2 × 2 cm) were prepared from the side walls of single-use PP beverage glasses. Since plastic glasses are produced by stretching from the PP sheet, the material of the side walls is mechanically anisotropic: it fractures preferentially along the direction of stretching, see photo in Figure 1C. On the glasses used in the experiment, the walls were manufactured with wavy “ridges” perpendicular to the stretching lines (Figure 2C). This makes the walls more resistant to fracture. Still, however, the preferential direction of fracture of LPIs was obvious, and the main type of the generated MPs was a 2-cm long narrow strip (Figure 2C). All the LPIs obtained after the experiment were cracked, bent, broken or twisted one way or another, and the diversity of the shapes of MPs increased with time of fragmentation.
Among the plastics examined in the experiments, PP appeared to have maximum longevity: after 24 h of energetic abrasion by pebbles, about 97.6% of LPIs could still be visually identified as the “original squares” (>5 mm), although they were softer, more flexible, with smoother, and matte surface.
With its material density of 0.86 g cm−3, PP is positively buoyant. Nevertheless, during the experiment lots of LPIs and smaller fragments were found submerged, being captured in-between and underneath the pebbles.
Thus, a brittle fragmentation is characteristic of PP, and the specific feature of the used PP single-use glasses is anisotropy of their response to mechanical forcing by pebbles. It is worth noting that stretching of the glass out of the plastic sheet is a common technology, applied not only to PP (e.g., also to PS). However, anisotropic behavior of the very PP material is also mentioned in publications (e.g., Mehmood et al., 2012).
Foamed PS
The foamed (or expanded) PS is a rigid, tough, closed-cell foam, made of pre-expanded polystyrene beads. It has a very low density of 0.011 g cm−3, so during the mixing process it mostly kept floating on the water surface. For the experiment, we used the standard 2-cm thick building heat insulation plates, which were cut with a hot nichrome wire into PS LPIs–small cubes with each side of 2 cm. Overall, 50 g of PS LPIs gave about 600 such cubes. Already after the first 3 h-run, some changes in the cubes' shapes were observed: the edges of the cubes became more clipped, attrited, there were individual spherules of PS or their parts (trimmed parts of the edges of a cube left after the cube's been cut) in the water. Despite very high buoyancy, a lot of small parts of the PS spherules were found under the water stuck to the pebbles.
The LPIs broke down slowly, becoming smoother and more polished at the corners, and some were torn to pieces. Individual PS particles acquired a variety of shapes, demonstrating the material's compounds–spherules of different sizes. At the end of the experiment about 72.8% of the PS was still LPIs, most of which were generally cubic in shape (Figures 2, 5).
Thus, high buoyancy of foamed PS keeps its particles on the water surface, preventing effective fragmentation by moving pebbles. The main way of fragmentation of PS-foam LPIs is detaching of individual beads.
Summary of Qualitative Features
Inter-comparison of the mechanical degradation processes of different types of plastics, as well as of the specific features of the generated MPs particles leads to several conclusions. The most important one is that each type of the selected plastics/objects generated specific MPs particles. The slightly positively buoyant LDPE LPIs were transferred to the MPs class first due to folding in two or four. They effectively captured paint flakes, shards of pebbles, or other smallest suspended particles. This way, they became negatively buoyant quite soon and thus more effectively destroyed by rolling pebbles. Only then, they began fragmenting, stretching in oblong forms, became inelastic, thereby badly tearing and crumpling. Solid PS LPIs were destroyed in hard MPs of various shapes: segments, crumbs, flakes, and strips. After about 20 h of mixing, the PS MPs became suddenly very brittle, and crumbled into the smallest particles at the slightest touch. Samples of PP appeared to be the most resistive to fragmentation in comparison with others; they showed anisotropy, fragmenting into rectangular strips with sharp edges. The breaking lines were most probably defined by the production technique rather than the material fatigue. Foamed PS, being composed of individual spherules of different diameters, was first fragmented to its compounds.
At the same time, there are common tendencies in changes of plastic quality and behavior of samples during the experiment. All the plastic materials, sooner or later, became rippled and faded, worn, and crumpled, without glossy non-wettable coating. A very important observation is that all of the samples, disregarding the initial density, tend to get submerged with time and finally clog below the pebbles. The solid PS LPIs, which were the only negatively buoyant plastics in the experiments, still floated at the beginning of the experiment due to surface tension of water and non-wettability of a newly-made plastic surface. However, already after 10 min of mixing they did sink–and throughout the rest of the experiment were distributed among the pebbles, with a clear tendency to clog between and below them. The slightly positively buoyant LDPE (both macro- and micro-) items got submerged after 9 h, with the same tendency to concentrate among the lowest pebbles. The more buoyant PP and especially foamed PS LPIs stayed floating for the entire experiment, however the majority of MPs particles tended to penetrate among/beneath the pebbles as deep as possible (the smaller the particle was the deeper it could be found). In fact, the analogous physical so-called Brazil nut effect could be mentioned here: while shaking the container with loose items (a basket with berries or a truck with stones)–larger items tend to move upwards, leaving smaller ones below (https://en.wikipedia.org/wiki/Granular_convection). The effect for items (stones, berries, etc.) of similar density but different size is usually explained by the advantage in gravitational energy: smaller items settle in-between larger ones leading to a more compact medium, whose integral center of mass is eventually lower. In our case, with the mixture of heavy stones and light plastics, this effect is not so straightforward and in general could not be foreseen. Still, the same explanation works as well: pebbles with smaller plastics in-between and beneath them are more compact than pebbles with plastics on top of them, and thus–gravitationally more advantageous.
This fact of clogging of plastics under the stones in the mixing experiment suggests the analogous behavior on natural beaches. This is in agreement with observations: e.g., McWilliams et al. (McWilliams et al., 2017) found that at rocky shores of Fogo Island, Newfoundland and Labrador, a lot of plastics were found below the sediment surface.
Mass of MPs and the Number of Particles
Increase in the MPs Mass and the Number of Particles With Time
The particles were classified as MPs here if they had passed through the sieve with 5-mm mesh, but had been retained by one of the sieves with a smaller mesh size–down to 0.5 mm. For every plastic type, the mass of this 0.5–5 mm fraction was measured every 3 h. Figure 5A summarizes the results, while Figure S2 shows the generation of each type of microplastic separately and in more detail. The results show that solid PS samples (i.e., single-use PS tableware) are the most “productive”: they were practically completely fragmented between 21 and 24 h of the experiment. Of LDPE samples (thin garbage bags), only 31% was transferred to MPs after 24 h, followed by foamed PS (building insulation)–with about 8% of MPs, and PP (single-use cups), where <0.1% of initial mass was transferred to MPs.
Experimental data show an increase in mass and number of MPs with time for all the used materials; they are presented on Figures 5, 6. The data are provided in the Table S1 of the Supplementary Material. In order to describe the relations analytically, three model hypotheses for the fit curves were examined statistically: exponential, quadratic, and linear. Analytical dependencies were obtained using the method of least squares. The adequacies of the obtained models were determined by ANOVA (F-test). Because of a small number of samples for each experiment the significance for each coefficient in the obtained regression formulas was additionally tested using the Student's t-test. Table 1 shows the results of F-test and p-level analyses for all the fit curves. For the generation of MPs mass, the exponential regression can be considered as the best model for LDPE and PP (SE = 3.73, p = 0.0035 and SE = 0.01, p = 0.0096, correspondingly; here, SE is the standard error of the regression, and p is the significance of the F-value of the ANOVA of the regression). For PS, the quadratic regression is slightly better (SE = 1.43, p = 0.001) than the exponential one (SE = 7.53, p = 0.0036), however they both successfully pass the F-test. For the foamed PS, the best model is the linear regression (SE = 0.17, p = 2.86E-08).
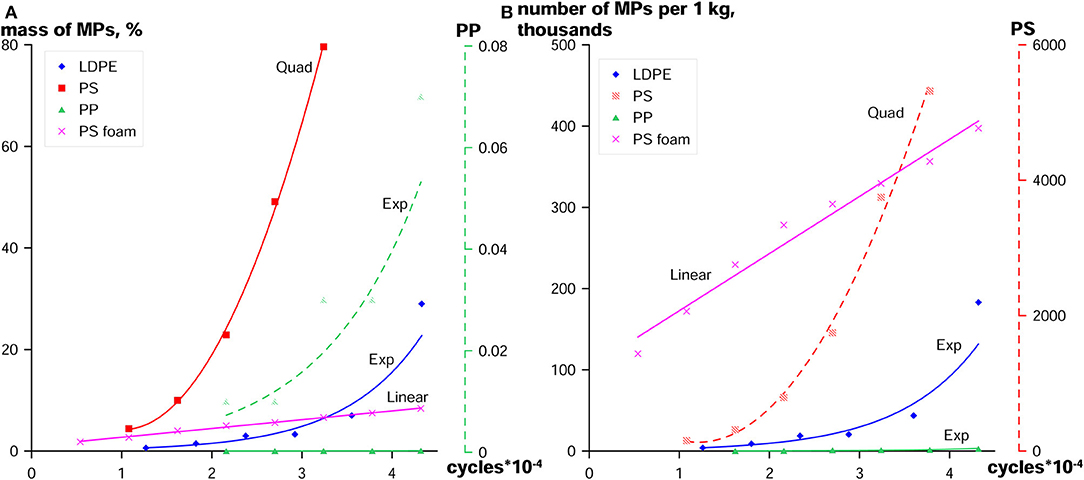
Figure 6. Dependence of (A) mass (in per cent of the total mass of the given plastic) and (B) number of MPs particles, generated from 1 kg of LPIs, on the number of “wave periods.” Analogously to Figure 5, additional axes at the right-hand side, the dashed graphs, and pale markers show: (A) enlarged exponential best fit for the mass of PP MPs; data and graph at the same scale with other plastics are shown by green triangular markers / solid line; (B) best fit for the number of solid PS MPs at much compressed scale.
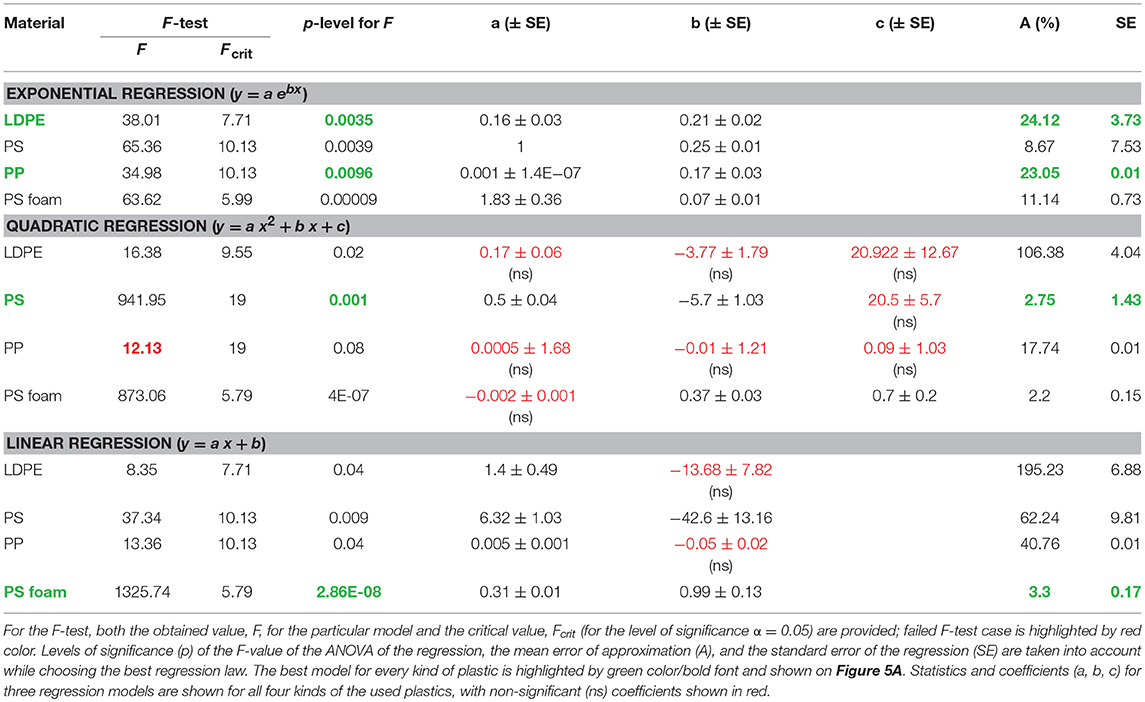
Table 1. Results of statistical analysis of exponential, quadratic, and linear models for relationship between the mass of microplastics and time of degradation of large plastic items in laboratory mixer.
Physically, linear dependence of mass of MPs, M, on time is equivalent to dM/dt = const, i.e., constant rate of production of MPs mass. This mirrors the fragmentation of foamed-PS LPIs first to their basic compounds–the bubbles of MPs size range. Since the material is highly buoyant, it is less affected by heavy moving pebbles. Twenty-four hours of the experiment are not enough to make a conclusion about further fragmentation of individual bubbles, however the change of the linear fragmentation model at further stages can be foreseen. Quadratic model for brittle solid PS (M ~ t2) leads to an increase in the growth rate of MPs mass with time, dM/dt ~ t, probably related to the observed material fatigue. Exponential law of the MPs mass growth with time seems to indicate that the process of fragmentation involves several wear mechanisms, e.g., tensile tearing plus surface abrasion for ductile LDPE, or cutting plus surface abrasion for springing anisotropic PP.
The obtained results allow for some useful comparative evaluations. This way, fragmentation of 50% of the initial macroplastic mass to MPs under experimental conditions will take about 15/28/29 h for PS/LDPE/PS foam, correspondingly. As for PP, it showed the slowest degradation rate, and evaluation of half-fragmentation time on the base of this experiment is hardly reliable.
The projection of these results to evaluation of the corresponding time intervals and fragmentation rates at natural conditions is not straightforward, because too many factors influence mechanical mixing at the beach face. First of all, these are the wave energy, the wave period, and the grain size of the beach sediment, as well as the beach face inclination angle and percolation of the beach sediment (e.g., Komar and Allan, 2010). The use of real time of the experiment gives obviously an underestimation for real-sea conditions, since surface waves with a period of 2 s are definitely too weak to roll pebbles and fragment plastics. As zero-approach, one may use the number of cycles of the mixer (see Figure 6) as a kind of the “dimensionless time,” and recalculate the increase in mass of MPs with time using a typical wave period for the given region instead of the period of rotation of the mixer. One may suggest considering environmental conditions with only moderate wave energy, capable of rolling only some pebbles at the beach face. The established inclination of the “beach face” in the mixer (about 1:2) also suggests the prototype with low wave energy conditions: natural clastic beaches have the slopes of about 1:4–1:10, with steeper slopes for milder external conditions (Carter and Orford, 1993). For the Baltic Sea, for example, the wave period could be about 5–6 s (Leppäranta and Myrberg, 2009), or about 3 times as large as the period of rotation in the above experiments. Thus, a rough estimate of intensity of mechanical fragmentation in the swash zone with coarse bottom sediments under rather moderate wind-wave conditions gives about 2–4 days for disintegration of 50% of the mass of PS and LDPE into MPs, and 10% of the mass of foamed PS. Disintegration of PP samples should last much longer.
In the majority of field monitoring data, the number of MPs particles is reported instead of the integral MPs mass. Thus, analysis of increase in the number of MPs particles is important as well. This is why, in order to calculate the number of MPs particles as exactly as possible, the nest of 9 sieves with different mesh sizes (from 0.5 to 4.5 mm) was used every 3 h and with every type of plastic. After washing of all the plastic material through the nest after each run, the number of particles on every sieve was either calculated directly (if it was not too high), or estimated using calculation of particles in the weighted sub-sample. The obtained increase in number of MPs particles with time is shown in Figure 5B, with the results of statistical analysis provided in Table 2. The best fit models for different plastics are similar to those obtained for the increase in mass: the exponential relation for LDPE and PP (SE = 4.91, p = 0.004 and SE = 0.1, p = 0.0019, correspondingly), the quadratic law for solid PS (SE = 43.69, p = 0.0005); for the foamed PS, quadratic and linear regressions are close (SE = 0.45, p = 4E-06 and SE = 0.81, p = 5E-06, correspondingly). In total, as calculated at the nest of sieves, the number of MPs particles of LDPE/PS/PP/PS-foam generated after 24 h is estimated as about 3.6·104/1.1·106/5.5·102/2.0·104 particles, correspondingly. Note that the total mass of solid PS decreased during the experiment to 82% of the initial mass, showing that about 18% of mass was transferred to the nano-sized particles.
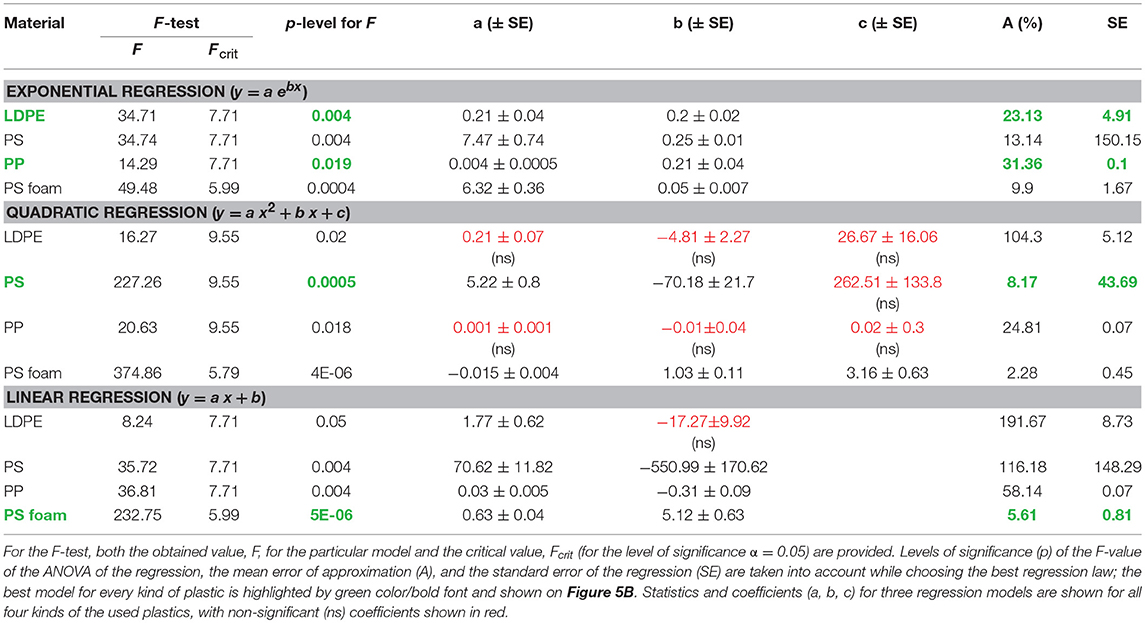
Table 2. Results of statistical analysis of exponential, quadratic, and linear models for relationship between the number of MPs particles and time of degradation of large plastic items in laboratory mixer.
In order to simplify any probable evaluations for real-beach cases, Figure 6 displays the same data as Figure 5, as dependent on the number of rotational cycles, which could be treated as the number of wave periods characteristic of the observation site. For vertical axes, the mass of the generated MPs is shown in per cent from the available mass of plastic LPIs, and the number of generated MPs particles is re-calculated per 1 kg of the particular plastic. Tables 3, 4 provide the results of statistical analyses of the three hypothesized models. Finally, for convenience, Table 5 summarizes the analytical expressions for the best models from Tables 3, 4.
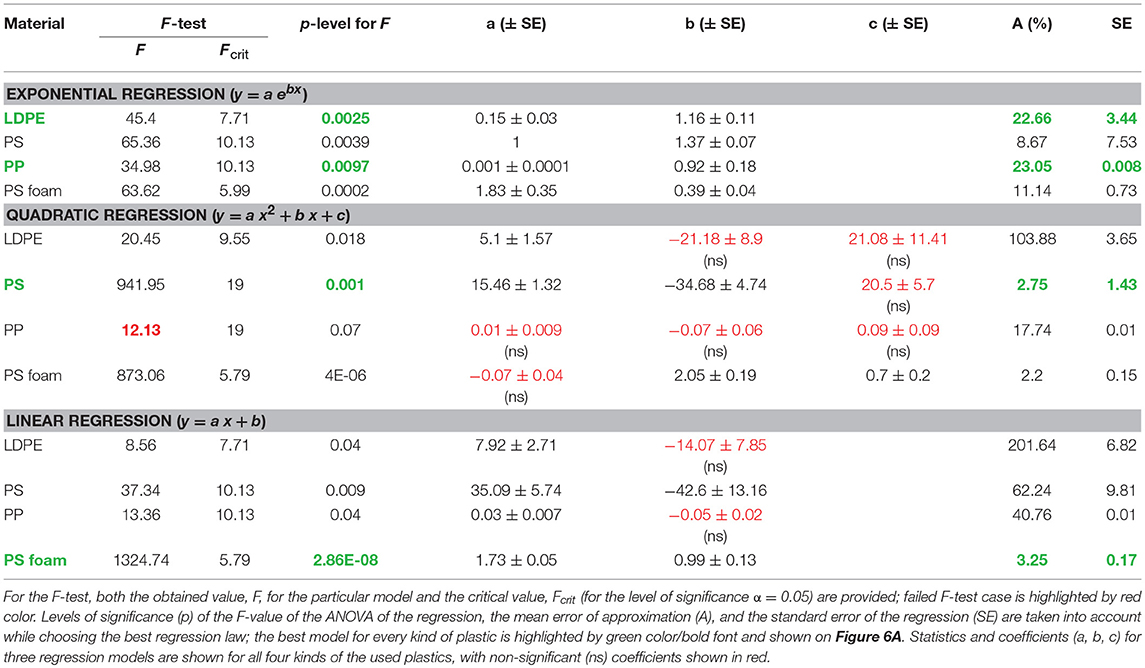
Table 3. Results of statistical analysis of exponential, quadratic, and linear models for relationship between the mass of MPs and dimentionless time of the degradation experiment.
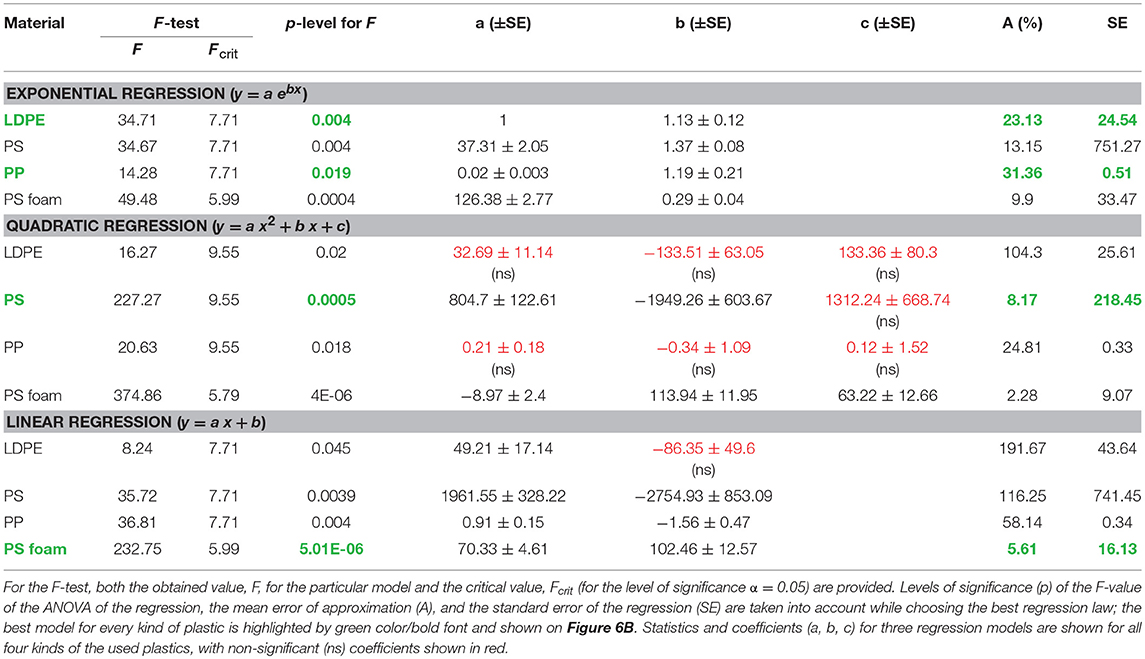
Table 4. Results of statistical analysis of exponential, quadratic, and linear models for relationship between the number of MPs particles and dimensionless time of degradation experiment.
The approximations summarized in Table 5 are applicable only during a certain time span. It begins from about 5 thousand of cycles, which is equivalent to about 3 h of the laboratory experiment, or about 9 h of fragmentation in the swash zone under waves of 6 s-wave period and moderate wave energy. The upper time limit for the models' applicability is defined by the condition, that there still should be enough larger objects for fragmentation. The only material passing this limit during the experiments was solid PS: after 18 h of fragmentation, when only 11.5% of the initial PS LPIs mass remained as large objects, the rate of growth of MPs mass began decreasing. Thus, the condition for the upper time limit might be formulated as follows: the approximations are valid until the mass of the large objects is no < 15% of the mass of the plastic initially available for fragmentation. For real beach applications and numerical modeling, this limitation can be considered together with an external supply of larger plastic objects.
Mass vs. Number of Particles
The laboratory experiment provides an opportunity to build up a correlation between the mass and the number of particles, that is of significant interest for both observational and modeling applications. Since for all the types of plastics both mass and number of particles grow similarly with time, a close-to-linear relationship between these variables might be expected (Figure 7). This result could not be foreseen in advance, because the distribution of particles by size (discussed below in Section Methodical Problems of Use of Sieves for Particles of Various Shapes) is different for different plastics, while in the same mass the number of smaller particles is larger. In view of further numerical modeling, field applications, analytical evaluations, etc., the simplest relationships are desirable, so we report here the obtained linear approximations. Their statistical significance is confirmed by F-test analysis and provided in Table 6. Figure 7 and Table 7 present the relation between the fraction of mass, converted to MPs, and the number of the MPs particles generated after fragmentation of 1 kg of plastics. These dependencies indirectly contain the duration of the fragmentation process (see Table 5): they show how many MPs particles will be generated when the certain per cent of available LPIs are fragmented. In particular, it follows from the equations of Figure 7 and Table 7
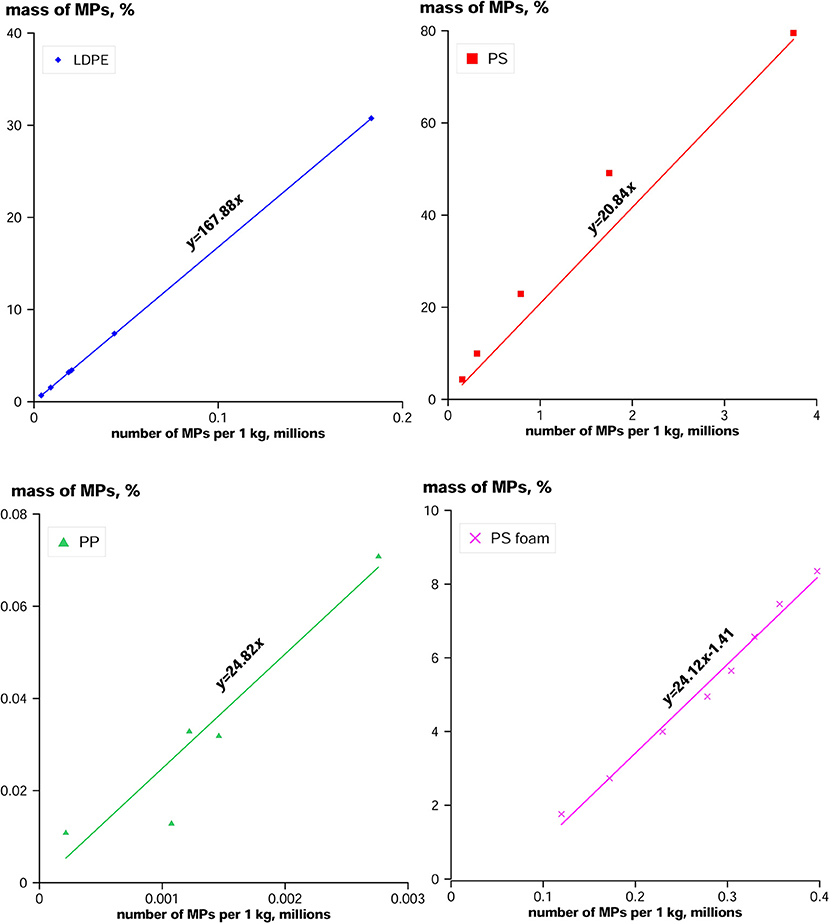
Figure 7. Correlation of the fraction of mass converted to MPs and the number of MPs particles generated from 1 kg of LPIs of LDPE, PS, and PP (for solid PS, data for 21 and 24 h are not included due to possibly too small remaining amount of LPIs available for fragmentation).

Table 6. Parameters of linear regression (y = a x+b) for a relationships between the mass of MPs and the number of MPs particles.

Table 7. Relations between the mass of MPs (0.5–5 mm); M%, expressed in per cent of the initial mass of LPIs; and the number of MPs particles; N, expressed in millions; generated from 1 kg of LPIs; for the types of plastics used in the experiments.
that the same mass of solid PS is 8 times more productive than LDPE in terms of the generated MPs particles. While building the approximations, we excluded data of the last stages of fragmentation of solid PS particles (21 and 24 h): at that stages of fragmentation there might not be enough LPIs to supply the MPs generation. For PP, the data points cover only initial stages of fragmentation of this hard plastic; however for some applications the relationship still may be useful. In contrast to other polymers, for foamed PS the free term b of a linear regression is also significant; this may be an indication that fragmentation of this material to individual spherules begins with some delay. The approximations are valid for the total MPs mass of more than 1 g.
Methodical Problems of Use of Sieves for Particles of Various Shapes
Size distributions of the number of MPs particles generated from different types of plastics in our experiments (see Figure S1) are not directly suitable for mathematical analysis and highlight several methodical issues.
Firstly, our (standard) set of metallic sieves with mesh sizes from 0.5 to 5 mm (with 0.5 mm step) contained both perforated sieves with round openings (1.5, 3.0, 4.0, 4.5, 5.0 mm), and woven wire sieves with square openings (0.5, 1.0, 2.0, 2.5, 3.5 mm). As the analysis shows, the sieves with round openings retain much more particles, and re-calculation of the number of particles via the relative area of the openings (Allen, 2003) does not lead to sensible results. Figure S3 shows size distributions of different plastics using all the sieves together (a), only perforated sieves (b), and only woven wire sieves (c). The first size distribution is rather chaotic, whilst the other two are more smooth, but significantly different. In broader context, this means that data obtained from different kinds of sieves should be compared with caution, and the type of the sieves used must be reported together with the data. Since in situ the most typical methods for sampling of MPs are nets and trawls, woven wire sieves should be preferred also for wet sieving.
Secondly, the sieves of different types seem to be “shape-selective.” Natural sediments, like sand, granules, etc., are 3-dimensional and rounded, and the nest of sieves gives a reliable result on the particles' size distribution regardless of the type of the sieve. MPs have various shapes, and the use of different types of sieves may introduce certain misbalance between the particles of different shapes. Our experiments show that elongated, flexible and, especially, fibrous MPs particles are much better retained by woven wire sieves. Fibrous particles (in our case–LDPE fragments, see Figure 2A right-hand part) get entangled, and are easily retained by woven wire sieves with the mesh size of about 10 times as large as the fiber diameter, but they easily flow through perforated plates. This way, a lot of thin flexible LDPE fragments in our experiments were retained by the woven wire sieves with the largest mesh size (see Figure S1A). As for long flat rigid particles (PP in our case, see Figure 2C right-hand panel), they are difficult to wash through, because they tend to stay flat-side down at the sieve surface even when their width permits to flow through. Eventually in our experiments, only for PS particles (both in solid and foamed modifications) wet sieving showed quite reliable results, and exactly these plastics produce more or less “rounded” MPs particles (Figures 2B,D). These outcomes suggest that using nets in the field, woven wire sieves for beach sediments, or woven filters in laboratory, we may retain disproportionally more fibrous and elongated rigid particles in comparison to 3-dimensional and rounded ones.
Size-distribution curves for solid and foamed PS (Figures S1B,D), which have more or less rounded particle' shapes, are quite smooth and less dependent on the sort of the sieve. They show an obvious gradual increase in mass of all the fractions in the first half of the experiment, and then a sudden decrease for larger MPs, related with the decrease in the number of LPI available for degradation and the fatigue of the working material. Quite surprisingly, the maximum number of particles at any time of the experiment is observed in the range of 1–2 mm, i.e., practically the same as in the distribution of MPs floating on the surface of the ocean (Cózar et al., 2014). Distribution curves for LDPE and PP (Figures S1A,C) are irregular and show direct influence of the kind of the sieve.
Concluding Remarks
The swash zone of the sea is an area where mechanical fragmentation of plastic objects and the corresponding generation of secondary microplastics (MPs) are the most intense. The performed experiments have shown both qualitative and quantitative trends in the behavior of plastic materials under laboratory conditions mimicking natural wave runup/rundown on the beach face. A detailed description of qualitative modifications of the samples during the fragmentation process is important for further analysis of their behavior and fate in marine environment, while the obtained quantitative dependencies are intended to support analytical evaluations and further numerical modeling.
For the most typical beach litter objects–polystyrene (PS) and polypropylene (PP) single-use tableware, polyethylene (LDPE) bags, and foamed polystyrene isolation sheets–statistically significant regressions are obtained for an increase in mass of MPs and the number of MPs particles in the sea swash zone with coarse bottom sediments. The hardest for mechanical degradation among the selected plastics is PP. Foamed PS, being composed of small spherules, tends first to disintegrate into individual bubbles, which then are further fragmented into pieces. Most productive in terms of mechanical fragmentation is solid PS: as much as 99.8% of its initial mass was transferred to MPs and nano-sized particles within the 24 h of the experiment, producing about 5·103 micro-particles and uncountable amount of nano-particles out of every gram of plastic.
Despite different distribution of the number of MPs particles Vs. their size for the selected plastics, the relation between the mass and the total number of the generated MPs particles can be approximated by statistically significant linear dependencies.
Qualitative observations during the experiments provide information both on the variability of the appearance of particles of different plastic types and on their characteristic behavior during the fragmentation process. An important outcome for field studies is the observed tendency of clogging of MPs particles beneath the sediment cover.
The obtained results are obviously “the case study” of the mechanical fragmentation of particular plastic objects in particular sediments, however they are thought to be useful for general evaluations of contamination of marine environment by MPs, for field monitoring, and for developing of proper parameterizations in numerical modeling.
Author Contributions
IE performed experiments with PP and foamed PS, wrote the text, and designed the figures. MB performed experiments with solid PS. AB analyzed experimental results. AK performed statistical analysis of the hypothesized dependencies obtained and designed corresponding figures and tables. IC designed the experiments, performed the experiments with LDPE, and worked with the text.
Conflict of Interest Statement
The authors declare that the research was conducted in the absence of any commercial or financial relationships that could be construed as a potential conflict of interest.
Acknowledgments
The investigations are supported by the Russian Foundation for Basic Research via grant number 18-55-76001 (as a part of ERA.Net RUS Plus S&T project 429 BalticLitter). Laboratory research facilities are maintained within the framework of the state assignment of FASO Russia (theme No. 0149-2018-0012). Development of parameterisations for numerical modeling is motivated by the work of IC within the WG 153 of the Scientific Committee on Oceanic Research (SCOR) which is supported by Grant OCE-1546580 to SCOR from the U.S. National Science Foundation.
Supplementary Material
The Supplementary Material for this article can be found online at: https://www.frontiersin.org/articles/10.3389/fmars.2018.00313/full#supplementary-material
References
Allen, T. (2003). “Chapter 4: particle size analysis by sieving,” in Powder Sampling and Particle Size Determination, eds T. Allen (Cape St. Francis: Elsevier), 208–250.
Andrady, A. L. (2011). Microplastics in the marine environment. Mar. Pollut. Bull. 62, 1596–1605. doi: 10.1016/j.marpolbul.2011.05.030
Andrady, A. L., and Neal, M. A. (2009). Applications and societal benefits of plastics. Philos. Trans. R Soc. B 364, 1977–1984. doi: 10.1098/rstb.2008.0304
Arthur, C., Baker, J., and Bamford, H. (2009). Proceedings of the International Research Workshop on the Occurrence, Effects and Fate of Microplastic Marine Debris. Sept 9–11, 2008, Vol. 2009. NOAA Technical Memorandum NOS-OR&R-30.
Barnes, D. K., Galgani, F., Thompson, R. C., and Barlaz, M. (2009). Accumulation and fragmentation of plastic debris in global environments. Philos. Trans. R Soc. B 364, 1985–1998. doi: 10.1098/rstb.2008.0205
Browne, M. A., Crump, P., Niven, S. J., Teuten, E., Tonkin, A., Galloway, T., et al. (2011). Accumulation of microplastic on shorelines woldwide: sources and sinks. Environ. Sci. Technol. 45, 9175–9179. doi: 10.1021/es201811s
Carson, H. S., Colbert, S. L., Kaylor, M. J., and McDermid, K. J. (2011). Small plastic debris changes water movement and heat transfer through beach sediments. Mar. Pollut. Bull. 62, 1708–1713. doi: 10.1016/j.marpolbul.2011.05.032
Carter, R. W. G., and Orford, J. D. (1993). The morphodynamics of coarse clastic beaches and barriers: a short- and longterm perspective. J. Coast Res. 158–179.
Chubarenko, I., Bagaev, A., Zobkov, M., and Esiukova, E. (2016). On some physical and dynamical properties of microplastic particles in marine environment. Mar. Pollut. Bull. 108, 105–112. doi: 10.1016/j.marpolbul.2016.04.048
Chubarenko, I., Esiukova, E., Bagaev, A., Isachenko, I., Demchenko, N., Zobkov, M., et al. (2018). “Chapter 6. Behaviour of Microplastics in Sea Coastal Zone,” in Microplastic Contamination in Aquatic Environments, 1st Edn., ed E. Zeng (Amsterdam: Elsevier), 175–223.
Chubarenko, I., and Stepanova, N. (2017). Microplastics in sea coastal zone: lessons learned from the Baltic amber. Environ Poll. 224, 243–254. doi: 10.1016/j.envpol.2017.01.085
Claessens, M., De Meester, S., Van Landuyt, L., De Clerck, K., and Janssen, C. R. (2011). Occurrence and distribution of microplastics in marine sediments along the Belgian coast. Mar. Pollut. Bull. 62, 2199–2204. doi: 10.1016/j.marpolbul.2011.06.030
Cózar, A., Echevarría, F., González-Gordillo, J. I., Irigoien, X., Ubeda, B., Hernández-León, S., et al. (2014). Plastic debris in the open ocean. Proc. Natl. Acad. Sci. U. S. A. 111, 10239–10244. doi: 10.1073/pnas.1314705111
Duis, K., and Coors, A. (2016). Microplastics in the aquatic and terrestrial environment: sources (with a specific focus on personal care products), fate and effects. Environ. Sci. Eur. 28:22. doi: 10.1186/s12302-015-0069-y
Efimova, I. V., and Chubarenko, I. P. (2018). Fragmentation of plastic garbage in the surf zone of the sea: a laboratory experiment on the example of expanded polystyrene. Ser. Earth Sci. 18, 10–13. doi: 10.18500/1819-7663-2018-18-1-10-13
Elfrink, B., and Baldock, T. (2002). Hydrodynamics and sediment transport in the swash zone: a review and perspective. Coast Eng. 45, 149–167. doi: 10.1016/S0378-3839(02)00032-7
Engler, R. E. (2012). The complex interaction between marine debris and toxic chemicals in the ocean. Environ. Sci. Technol. 46, 12302–12315. doi: 10.1021/es3027105
Esiukova, E. (2017). Plastic pollution on the Baltic beaches of Kaliningrad region, Russia. Mar. Pollut. Bull. 2, 1072–1080. doi: 10.1016/j.marpolbul.2016.10.001
Frias, J. P., Otero, V., and Sobral, P. (2014). Evidence of microplastics in samples of zooplankton from Portuguese coastal waters. Mar. Environ. Res. 95, 89–95. doi: 10.1016/j.marenvres.2014.01.001
Goldstein, M. C., and Goodwin, D. S. (2013). Gooseneck barnacles (Lepas spp.) ingest microplastic debris in the North Pacific Subtropical Gyre. Peer J 1:e184. doi: 10.7717/peerj.184
Gregory, M. R. (1996). Plastic ‘scrubbers’ in hand cleansers: a further (and minor) source for marine pollution identified. Mar. Pollut. Bull. 32, 867–871.
Hidalgo-Ruz, V., Gutow, L., Thompson, R. C., and Thiel, M. (2012). Microplastics in the marine environment: a review of the methods used for identification and quantification. Environ. Sci. Technol. 46, 3060–3075. doi: 10.1021/es2031505
Hintersteiner, I., Himmelsbach, M., and Buchberger, W. W. (2015). Characterization and quantitation of polyolefin microplastics in personal-care products using high-temperature gel-permeation chromatography. Anal. Bioanal. Chem. 407, 1253–1259. doi: 10.1007/s00216-014-8318-2
Karapanagioti, H. K. (2012). “Floating plastics, plastic pellets, and organic micropollutants in the Mediterranean Sea,” in Life in the Mediterranean Sea: a Look at Habitat Changes, ed N. Stambler (New York, NY: Nova Science Publishers), 557–593.
Khatmullina, L., and Isachenko, I. (2016). Settling velocity of microplastic particles of regular shapes. Mar. Pollut. Bull. 114, 871–880. doi: 10.1016/j.marpolbul.2016.11.024
Komar, P. D., and Allan, J. C. (2010). ““Design with Nature” strategies for shore protection—The construction of a cobble berm and artificial dune in an Oregon State Park,” in 2010, Puget Sound Shorelines and the Impacts of Armoring—Proceedings of a State of the Science Workshop, Vol. 5254, eds H. Shipman, M. N. Dethier, G. Gelfenbaum, K. L. Fresh, and R. S. Dinicola (Tillamook, OR: U.S. Geological Survey Scientific Investigations Report), 117–126.
Lancaster, J. K. (1969). Abrasive wear of polymers. Wear 14, 223–239. doi: 10.1016/0043-1648(69)90047-7
Lassen, C., Hansen, F. S., Magnusson, K., Norén, F., Hartmann, B. N. I., Jensen, R. P., et al. (2015). Microplastics—Occurrence, Effects and Sources of Releases to the Environment in Denmark. Environmental project No. 1793. Copenhagen: Environment Protection Agency, Ministry of Environment and Food of Denmark.
Leppäranta, M., and Myrberg, K. (2009). Physical Oceanography of the Baltic Sea. Chicester: Springer.
Li, W. C., Tse, H. F., and Fok, L. (2016). Plastic waste in the marine environment: a review of sources, occurrence and effects. Sci. Total Environ. 2016, 333–349. doi: 10.1016/j.scitotenv.2016.05.084
McWilliams, M., Liboiron, M., and Wiersma, Y. (2017). Rocky shoreline protocols miss microplastics in marine debris surveys (Fogo Island, Newfoundland and Labrador). Mar. Pollut. Bull. 129, 480–486. doi: 10.1016/j.marpolbul.2017.10.018
Mehmood, N., Mao, T., and Bhupati, G. (2012). Fracture Mechanical Trouser Tear Testing in Thin Polymer Films (Experiments Along with Numerical simulations). Master's Degree Thesis. School of Engineering, Department of Mechanical Engineering. Blekinge Institute of Technology. Available online at: https://www.researchgate.net/publication/235934734_Fracture_Mechanical_Trouser_Tear_Testing_in_Thin_Polymer_Films_Experiments_Along_with_Numerical_simulations (Accessed July 30, 2018).
Napper, I. E., Bakir, A., Rowland, S. J., and Thompson, R. C. (2015). Characterisation, quantity and sorptive properties of microplastics extracted from cosmetics. Mar. Pollut. Bull. 99, 178–185. doi: 10.1016/j.marpolbul.2015.07.029
Nerland, I. L., Halsband, C., Allan, I., and Thomas, K. V. (2014). Microplastics in Marine Environments: Occurrence, Distribution and Effects. Oslo: Norwegian Institute for Water Research.
Pejaković, V., Jisa, R., and Franek, F. (2015). Abrasion resistance of selected commercially available polymer materials. Tribol Finnish J. Tribol. 33, 21–7. Available Online at: https://journal.fi/tribologia/article/view/69241
Plastics Europe (2013). Plastics - the Facts 2013, an Analysis of European Plastics Production Demand and Waste Data. Available online at: http://www.plasticseurope.org/en/resources/publications/103-plastics-facts-2013
Plastics Europe (2014). Plastics - the Facts 2014, an Analysis of European Plastics Production, Demand and Waste Data. Available online at: http://plasticker.de/Kunststoff_News_23931_PlasticsEurope_Plastics_the_Facts_2014_erschienen.
Plastics Europe (2016). Plastics - the Facts 2016, an Analysis of European Plastics Production Demand and Waste Data. Available online at: http://www.plasticseurope.org/en/resources/publications/3-plastics-facts-2016
Ryan, P. G., Moore, C. J., van Franeker, J. A., and Moloney, C. L. (2009). Monitoring the abundance of plastic debris in the marine environment. Philos. Trans. R. Soc. Lond. B. 364, 1999–2012. doi: 10.1098/rstb.2008.0207
Shah, A. A., Hasan, F., Hameed, A., and Ahmed, S. (2008). Biological degradation of plastics: a comprehensive review. Biotechnol. Adv. 26, 246–265. doi: 10.1016/j.biotechadv.2007.12.005
Van Rijn, L. C. (2013). Erosion of Gravel/Shingle Beaches and Barriers. Available online at: http://www.leovanrijn-sediment.com/papers/Gravelbeaches2013.pdf
Vianello, A., Boldrin, A., Guerriero, P., Moschino, V., Rella, R., Sturaro, A., et al. (2013). Microplastic particles in sediments of Lagoon of Venice, Italy: first observations on occurrence, spatial patterns and identification. Estuar. Coast. Shelf Sci. 130, 54–61. doi: 10.1016/j.ecss.2013.03.022
Viswanath, N., and Bellow, D. G. (1995). Development of an equation for the wear of polymers. Wear 181–183, 42–9. doi: 10.1016/0043-1648(94)07055-5
Keywords: secondary microplastics, mechanical degradation, swash zone, pebble beach, mass of microplastics vs. number of particles
Citation: Efimova I, Bagaeva M, Bagaev A, Kileso A and Chubarenko IP (2018) Secondary Microplastics Generation in the Sea Swash Zone With Coarse Bottom Sediments: Laboratory Experiments. Front. Mar. Sci. 5:313. doi: 10.3389/fmars.2018.00313
Received: 31 May 2018; Accepted: 15 August 2018;
Published: 05 September 2018.
Edited by:
Haibo Zhang, Zhejiang Agriculture and Forestry University, ChinaReviewed by:
Monica F. Costa, Universidade Federal de Pernambuco, BrazilAndré Ricardo Araújo Lima, Universidade Federal de Pernambuco, Brazil
Copyright © 2018 Efimova, Bagaeva, Bagaev, Kileso and Chubarenko. This is an open-access article distributed under the terms of the Creative Commons Attribution License (CC BY). The use, distribution or reproduction in other forums is permitted, provided the original author(s) and the copyright owner(s) are credited and that the original publication in this journal is cited, in accordance with accepted academic practice. No use, distribution or reproduction is permitted which does not comply with these terms.
*Correspondence: Irina P. Chubarenko, aXJpbmFfY2h1YmFyZW5rb0BtYWlsLnJ1
 Irina Efimova
 Margarita Bagaeva
 Andrei Bagaev
 Alexander Kileso
 Irina P. Chubarenko