 Kui Xu
 Johann Lavaud
 Rupert Perkins3
 Marlène Bonnanfant
 Douglas A. Campbell
- 1Department of Biology, Mount Allison University, Sackville, NB, Canada
- 2UMI 3376 Takuvik CNRS, Université Laval, Département de Biologie, Québec, QC, Canada
- 3School of Earth and Ocean Sciences, Cardiff University, Cardiff, United Kingdom
- 4Mer-Molécules-Santé, Université de Maine, Nantes, France
The effective absorption cross section for photochemistry of Photosystem II in the light (σPSII′) comprises the probability of light capture by Photosystem II and the quantum yield for subsequent photochemistry. σPSII′ is used to model photosynthesis and aquatic productivity, and phytoplankters regulate σPSII′ to mitigate over- or under-excitation of Photosystem II. We used diverse phytoplankton taxa to compare short and long term changes in σPSII′ with the induction of the yield of non-photochemical quenching (YNPQ) of chlorophyll fluorescence, a measure of regulated excitation dissipation. In two picocyanobacteria σPSII′ showed no decline upon induction of moderate YNPQ, above light levels sufficient for saturation of electron transport. In the eukaryotic chl a/b Ostreococcus and the chl a/c diatom Thalassiosira, induction of non-photochemical quenching was stronger after growth under saturating light, an acclimation attributable to increased xanthophyll cycle pigment content. Across short and longer-term light histories to induce or relax regulatory processes Ostreococcus and Thalassiosira showed proportional variations between the level of YNPQ and the down regulation of σPSII′. The proportional down regulation of σPSII′ was, however, significantly smaller than the amplitude of YNPQ induction. For the eukaryotes we can predict changes in σPSII′, useful for modeling electron transport, productivity and acclimation, from measures of YNPQ, which are accessible from fluorescence yield measures that do not include σPSII′. This useful relation, however, does not extend to the tested prokaryotes, possibly as a result of differential violations of the rate constant assumptions that underlie the calculated YNPQ parameter.
Introduction
The effective absorption cross section for Photosystem II (PSII) photochemistry is a target-size formulation which can be extracted from the chlorophyll fluorescence induction curve provoked by a single turnover flash or train of repeated flashlets (Kolber et al., 1998) applied in darkness (σPSII) or in the presence of actinic light (σPSII′). Because σPSII is estimated based upon the response of PSII to light it measures both the capture of light by the antenna bed associated with PSII, along with an implicit quantum yield for subsequent photochemistry (Trissl and Lavergne, 1995; Kolber et al., 1998; Laney, 2003; Suggett et al., 2009). σPSII is a widely used measure for monitoring and estimating phytoplankton primary productivity and acclimation (Suggett et al., 2003, 2004, 2009; Oxborough et al., 2012; Silsbe et al., 2015). σPSII varies widely across species (Six et al., 2007a, 2008; Key et al., 2010) and changes through multiple short and longer term processes (Falkowski and Owens, 1980). In particular changes in growth light can cause compensatory changes in σPSII, as organisms allocate protein resources to light capture under limiting light, or to down-stream metabolism under saturating light (Falkowski and Owens, 1980).
Non-photochemical quenching (Horton et al., 1996; Gorbunov et al., 2011; Kirilovsky and Kerfeld, 2013) is a widely measured category of regulatory processes that are tracked through influences upon chlorophyll fluorescence (Miloslavina et al., 2009; Lambrev et al., 2012; Giovagnetti and Ruban, 2016). Non-photochemical quenching reflects changes in the dissipation of absorbed excitation as heat. There is a large literature across species and growth conditions (Ruban et al., 2004; Bailey et al., 2005; Lavaud et al., 2007; Kulk et al., 2012, 2013; Holzwarth et al., 2013; Lavaud and Lepetit, 2013; Giovagnetti and Ruban, 2016) reporting the patterns and responses of the unbounded Stern-Volmer parameterization, NPQ:
The NPQ parameter is not, however, a linear representation of the fraction of absorbed excitation flowing to non-photochemical quenching (Holzwarth et al., 2013). As an alternative, the fractional quantum yield of non-photochemical quenching (YNPQ, or ΦNPQ) was introduced by Kramer et al. (2004) and re-formulated by Hendrickson et al. (2004) and Klughammer and Schreiber (2008). YNPQ is a bounded coefficient capturing excitation flowing to regulated non-photochemical dissipation of excitation through paths parameterized through the rate constant knpq:
(Hendrickson et al., 2004; Klughammer and Schreiber, 2008)
The complementary yield of non-regulated excitation dissipation (YNO or ΦNO) (Hendrickson et al., 2004; Klughammer and Schreiber, 2008) then captures non-regulated flows of excitation through thermal de-excitation paths parameterized through the rate constant kd and through fluorescence, parameterized as kf:
Although termed non-regulated, YNO is not a constant, and can vary with changes in PSII photoinactivation, or with transitions from rapidly reversible quenching through knpq to sustained non-photochemical quenching through kd (Perkins et al., 2018). Finally, YPSII (or ΦPSII) parameterizes the yield of excitation driving PSII photochemistry (Genty et al., 1989) through the kp rate constant:
As coefficients that express the proportions of excitation flowing through three complementary paths, conservation of energy dictates that YNPQ + YNO + YPSII sum to 1, both algebraically and conceptually:
Furthermore, algebraically, Stern-Volmer
Thus the widely used Stern-Volmer NPQ actually captures the ratio between two sub-fractions of overall non-photochemical dissipation.
These calculated parameters reflect the combined influences of multiple mechanisms and kinetic phases (Boulay et al., 2008; Wu et al., 2012; Lavaud and Lepetit, 2013; Goss and Lepetit, 2015) whose relative influences vary with taxa and with physiological state. Differing growth lights can change the instantaneous capacity to induce non-photochemical quenching (Wu et al., 2012) through changes in the contents of key carotenoids and proteins that mediate non-photochemical quenching (Six et al., 2009; Wu et al., 2012; Kulk et al., 2013). Field studies are now using changes in measured non-photochemical quenching to help explain changes in the conversion of electron transport rates, based upon σPSII, to carbon-based marine productivity rate estimates (Schuback et al., 2015, 2016).
Explicit paired comparisons of Stern-Volmer NPQ with changes in σPSII′ under illumination on the same samples (KoblíŽek et al., 2001; Giovagnetti and Ruban, 2016) show that moderate induction of NPQ drives parallel down regulation of σPSII′ but that levels of Stern-Volmer NPQ above ~1 do not drive further down-regulation of σPSII′.
For this paper, we use the YNPQ yield parameterization because it is bounded from 0 to 1, and an increase in YNPQ in principle reflects a linear increase in regulated excitation dissipation. Nevertheless, in our experiments simultaneous determinations of YNPQ and Stern-Volmer NPQ were highly correlated (Figure S1) mainly because our treatments did not achieve the higher levels of measured Stern-Volmer NPQ (Ruban et al., 2004) where the departure from linearity would influence results.
An increase in YNPQ, or more generally an increase in (YNPQ + YNO) should cause a proportional decrease in σPSII′, because σPSII′ comprises both the absorption cross section of PSII, aPSII, and the maximum quantum yield for PSII photochemistry YPSIImax.
Our paper aims to test this hypothesis, to determine whether changes in YNPQ can be used to model short-term changes in σPSII′, to support productivity estimates under fluctuating conditions.
We also sought to systematically address several related questions:
1) Progressively increasing light drives an increase in excitation pressure (1-qL) as delivery of excitation to PSII outruns downstream electron transport. Does the threshold level of 1-qL at which induction of YNPQ begins differ with taxa, and/or with growth light? Thereafter, does the slope of the induction of YNPQ vs. 1-qL differ with species or with growth light, or both?
2) Does the relation between YNPQ and σPSII′ differ systematically across taxa or with growth light?
3) During the relaxation of YNPQ in darkness following saturating light, does the decline in YNPQ correlate with a proportional increase in σPSII? Is this relationship symmetrical to that between YNPQ and σPSII′ during induction, or is there a hysteresis between induction and relaxation? In other words, is there a consistent relation between instantaneous YNPQ and the degree of downregulation of σPSII′, or does the light history path of the cells to reach a given level of YNPQ alter the relation? This last point is critical for modeling photophysiological responses of phytoplankton in dynamic environments such as coastal systems and the ocean upper layer.
Materials and Methods
We grew four phylogenetically, structurally (Rast et al., 2015) and photophysiologically diverse marine phytoplankters (Table 1), using nutrient replete culture replicates previously described (Xu et al., 2017) in a temperature controlled incubator at 22°C. Prochlorococcus MED4 is a picocyanobacteria which captures light through Pcb divinyl chlorophyll a/b binding protein complexes (Ito and Tanaka, 2011) embedded within the thylakoid membranes. Synechococcus WH8102 is a picocyanobacteria which captures light through Phycobilisome (PBS) bilin-binding protein complexes associated with the surface of thylakoid membranes. Ostreococcus is a prasinophyte with a green primary endosymbiotic plastid, which captures light through chlorophyll a/b binding LHC proteins embedded within the thylakoids. Thalassiosira pseudonana CCMP1335 is a small centric diatom with a secondary endosymbiotic plastid derived from the red lineage. It captures light through chlorophyll a/c fucoxanthin binding proteins embedded within the thylakoids. These FCP complexes also mediate the large capacity for non-photochemical quenching typical of diatoms (Lavaud and Lepetit, 2013).
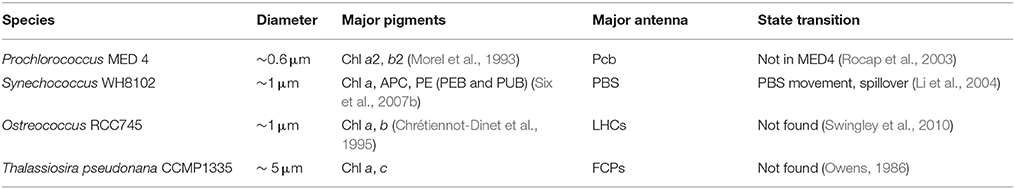
Table 1. Key properties of Prochlorococcus, Synechococcus, Ostreococcus, and Thalassiosira.
We applied a light/dark cycle of 12:12h, under either 30 μmol photons m−2s−1, representative of the bottom region of the photic zone, or under 260 μmol photons m−2s−1, equivalent to the middle of the photic zone. We chose these growth light levels as growth limiting or growth saturating light levels under our culture conditions, within the acclimatory tolerance ranges of the four diverse taxa (Six et al., 2009; Li and Campbell, 2013; Murphy et al., 2017). We tracked the growth of cultures by following fluorescence emission at 680 nm (Prochlorococcus, Ostreococcus, and Thalassiosira) or at 650 nm (Synechococcus) using a plate spectrofluorometer (SpectraMax Gemini EM, Molecular Devices, Sunnyvale, USA). Beyond these four taxa we include Supplementary Data from Chorella vulgaris (chlorophyte, chl a/b) (Bonnanfant and Campbell, unpublished); Haslea ostrearia and Haslea sp. (temperate and tropical pennate diatom strains, chl a/c) (Lavaud et al., unpublished) and Micromonas NCMA 2099 (arctic chl a/b Prasinophyte) (Ni et al., 2017). These strains were grown under comparable conditions, for different studies.
When cultures reached mid-exponential phase we took samples for whole cell absorbance measures in an integrating cavity spectrophotometer (OLIS-Cary14 with DSPC) (Ni et al., 2017). From these spectra we took second derivative spectra to detect changes in carotenoid absorbance resulting from xanthophyll cycling (Jesus et al., 2008). In parallel we took samples for chlorophyll fluorescence induction measurements, placed them in a 2 ml cuvette and then dark-adapted them for ~2 min. Samples were then exposed to a train of 40 blue (455 nm) flashlets with a duration of 1.2 μs separated by an intervening interval of 1.0 μs of darkness to induce a Fast Repetition and Relaxation fluorescence (FRRf) induction curve (Kolber et al., 1998), using a Photon Systems Instruments FL3500 fluorometer system (Brno, Czech Republic). This train of 40 blue flashlets cumulatively induced a single turnover of PSII which reduced QA and thereby closed the PSII pool. We chose the intensity of the flashlet for each species in order to saturate the fluorescence rise within around 30 of 40 flashlets (Figure 1, insets) (Laney, 2003; Laney and Letelier, 2008). We chose 455 nm as a compromise excitation wavelength absorbed by the long side of the chlorophyll a (or divinyl chlorophyll a) absorbance band, which is the only pigment present across all our diverse study strains. Emerging multi-spectra chlorophyll fluorometers will support more generalized analyses across multiple excitation bands delivered through different antenna complexes (Simis et al., 2012) across taxa.
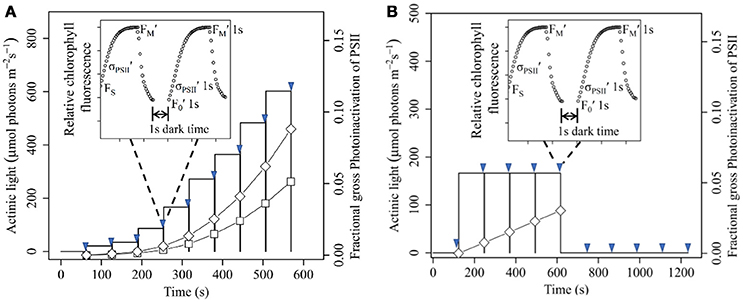
Figure 1. Light Response (A) and Saturating Light (B) treatment and measuring protocols. Arrowheads show applications of repeated Fast Repetition and Relaxation chlorophyll fluorescence measurements, as shown in representative annotated inset graphs. At each measurement we applied a first fluorescence induction and relaxation in the presence of background actinic light, and then again after 1 s of dark to allow re-opening of Photosystem II. One 1 s dark intervals are indicated by vertical lines separating flashlet steps of light treatment protocols. On the right Y axis we plot the estimated gross, cumulative photoinactivation of PSII during the treatments for Ostreococcus (open diamonds) or Thalassiosira (open squares) from growth-limiting light. Net photoinactivation would be lower through PSII repair.
For each FRRf induction curve we exported the data from the FluorWin data capture software to fit a model with four parameters (Table 2): minimal fluorescence, F0 (or FS); maximal fluorescence, FM (or (or FM '); effective absorption cross section for PSII photochemistry, σPSII (or σPSII′); and the coefficient of excitonic connectivity ρ (Kolber et al., 1998) using the PSIWORX-R package (A. Barnett, sourceforge.net) (Murphy et al., 2016; Ni et al., 2017). For each measurement we did an FRRf induction before and then again after a 1 s period of darkness to allow PSII to re-open after illumination. We thus determined in the dark F0, FM, σPSII, ρ; under actinic light FS, FM′, σPSII′ ρ′; and following 1 s of darkness after actinic light F0 ′1s, FM ′1s, ρ′1s, σPSII′1s.
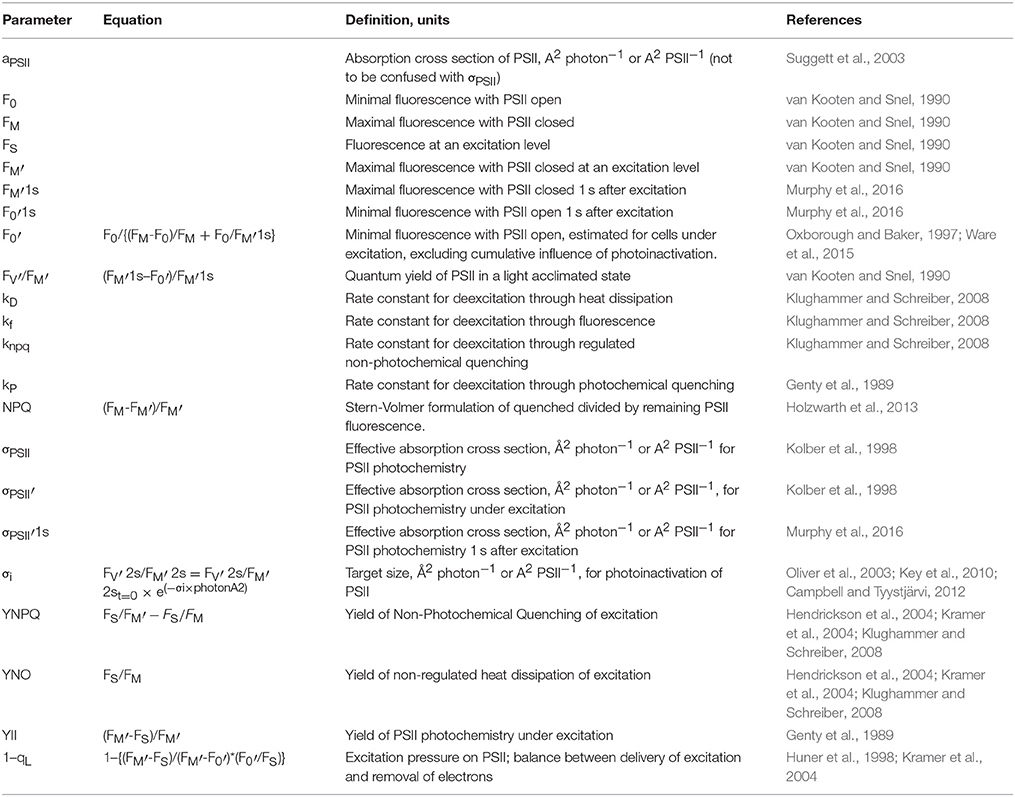
Table 2. Table of abbreviations and parameters.
To account for possible rapid changes in non-photochemical quenching during the 1 s dark interruption we estimated F0′ as:
To examine the response of PSII function to increasing light intensity in the four studied species, we set a series of 60 s exposures to increasing steps of actinic light levels from 0 to a maximal light level (Figure 1A) again delivered at 455 nm to match the effective absorption cross sections measured using the FRR chlorophyll inductions. We measured the FRRf induction curve at the end of each light level exposure, and then again after 1 s dark period to allow re-opening of PSII. We estimated the fraction of closed PSII reaction centers:
(Huner et al., 1998; Kramer et al., 2004).
1−qL is a measure of the instantaneous balance of excitation vs. electron transport in the cells. Low 1−qL indicates limiting or optimal light, while high 1−qL indicates incoming excitation in excess of the cellular capacity for down-stream electron transport or excitation dissipation (Huner et al., 1998).
For each actinic light step we estimated FV′/FM′ (van Kooten and Snel, 1990). For estimations of YNPQ and YNO (Hendrickson et al., 2004; Kramer et al., 2004; Klughammer and Schreiber, 2008) we used the maximum value of FM′ attained for a given sample (Serôdio et al., 2005), not necessarily the value measured after initial dark acclimation, as our FM basis. In some cases our light response curve extended to actinic light levels high enough to suppress the remaining variable fluorescence to small values. When the amplitude of remaining variable fluorescence is small the reliability of the PSIWORX-R curve fitting of FRR data is poor and the resulting estimates of σPSII′ suffer from wide confidence intervals. Therefore, we applied a screen to our data to exclude data points where the 95% C.I. of the estimate for σPSII′ exceeded half the value of σPSII′ (95% C.I./ σPSII′ > 0.5). This screen excluded some points from measures of Prochlorococcus and Ostreococcus measured under high actinic light.
Using the light response curves, we chose an actinic light level at the onset of saturation which we then used to examine the induction and relaxation of YNPQ and YNO during and after short and longer exposures (Figure 1B) to saturating light. We set an initial dark period of either 10 or 120 s and measured the FRRf induction at the end of the dark period. Then we applied 4 sequential periods of either 10 or 120 s of the saturating actinic light at 455 nm appropriate for each species from each growth light level, with an FRRf measurement every 10 or 120 s. Then we turned off the saturating light and tracked relaxation of YNPQ under darkness with an FRRf measurement every 10 or 120 s, for a total time course of either 50 or 600 s.
A possible confounding factor in our analyses is cumulative photoinactivation of PSII during the measurement/treatment protocols (Figure 1) we applied to induce YNPQ. There is a long history of treating “qI” or inhibitory quenching (Horton et al., 1996) as a component of non-photochemical quenching, in the broadest sense. Photoinactivation of PSII causes changes in PSII fluorescence emission variables, particularly increases in F0 and FσPSII′ (Oxborough and Baker, 1997; Ware et al., 2015) that could overlap or interfere with changes provoked by induction of YNPQ (Kulk et al., 2012, 2013). Although neither F0 nor FσPSII′ are explicitly included in calculation of YNPQ nor YNO, underlying changes in FσPSII′ could shift the level of steady state fluorescence under illumination, FS, which is part of the YNPQ and YNO parameters. We had previously determined the susceptibility of PSII to photoinactivation for each of the four taxa when grown under conditions comparable to this study (Six et al., 2009; Li and Campbell, 2013; Murphy et al., 2017) using a target size parameterization, σI (A2 photon−1) (Campbell and Tyystjärvi, 2012), derived from the exponential decline in PSII function plotted vs. cumulative incident photons, in the absence of PSII repair. For each treatment we therefore estimated gross cumulative photoinactivation of PSII by multiplying σI by cumulative photon dose imposed during during our measurement/treatment protocols to place an upper limit on the possible influences of PSII photoinactivation on the results. We furthermore compared changes in σPSII′ to the sum of (YNPQ + YNO), and to the maximum quantum yield of PSII under light acclimation, FV'/FM', which would capture changes in photoinhibitory quenching.
We also earlier measured (Xu et al., 2017) the excitonic connectivity parameter ρ (Kolber et al., 1998; Stirbet, 2013) across the same data sets used herein. ρ measures the probability of excitation sharing among PSII centers. As some PSII close under excitation, excitation sharing under a lake model of antenna function shared across multiple reaction centers contributes to an increase in the σPSII′ of the remaining open PSII. This possibility would complicate analyses of the interactions of induction of YNPQ and σPSII′. We found, however, that although ρ was significant in phytoplankters under darkness or low light, as PSII suffered closure under increasing excitation ρ dropped exponentially (Xu et al., 2017; Perkins et al., 2018). Therefore, once the phytoplankters started to induce significant YNPQ, ρ was no longer a significant factor, simplifying subsequent analyses.
Linear regressions, statistical analyses and plotting were performed using R (R Core Team, 2011) running under RStudio (RStudio Team, 2015) with the packages lsmeans (Lenth, 2016), minpack.lm (Elzhov et al., 2016), MASS (Venables and Ripley, 2002), and nlstools (Baty et al., 2015) Details of statistical analyses are provided in figure legends and in the Supplementary Statistical file.
Results and Discussion
In Table 3 we present the numeric estimates for cumulative gross photoinactivation of PSII imposed during the treatments, derived using previously determined estimates of the effective absorption cross sections for photoinactivation (σI). Note that these numeric estimates assume no counteracting repair of PSII during treatments. This assumption is probably fulfilled for Prochlorococcus where instantaneous PSII repair is slow (Six et al., 2007a). Synechococcus, Ostreococcus, and Thalassiosira show stronger PSII repair under moderately high light (Six et al., 2007a, 2009; Li and Campbell, 2013) to counteract photoinactivation as it occurs. Therefore although these taxa incurred a metabolic burden for PSII repair (Li et al., 2015; Murphy et al., 2017) their actual net photoinhibition is much less than the gross cumulative photoinactivation, presented as an upper limit in Table 3.
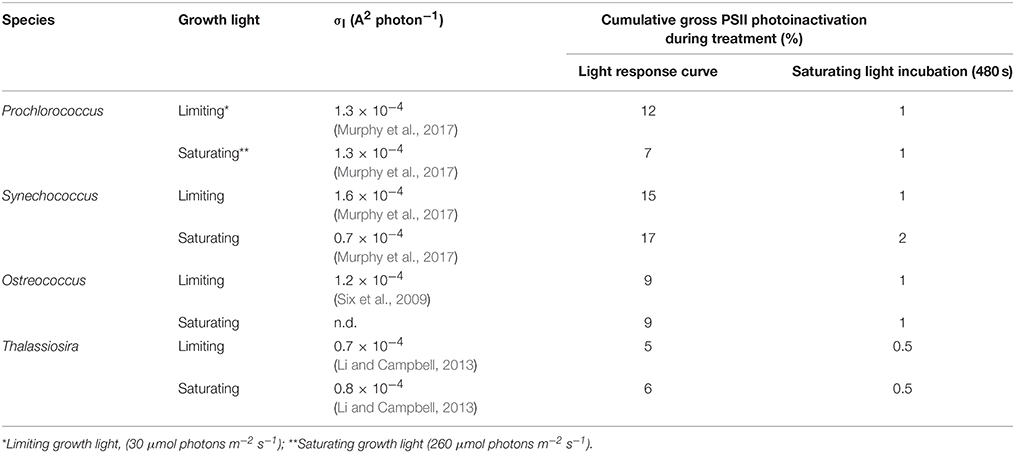
Table 3. Predicted Photosystem II Photoinactivation during Light Treatments.
Figure 2 plots σPSII′, measured in the presence of background actinic light, vs. fractional closure of PSII (1-qL), otherwise termed excitation pressure (Huner et al., 1998) or C (Suggett et al., 2015).
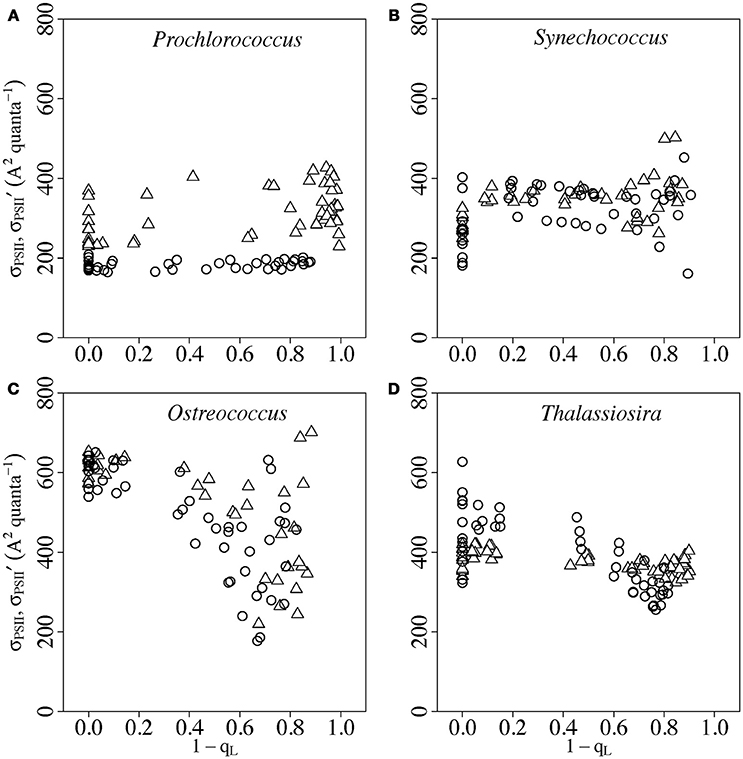
Figure 2. Response of σPSII′ to progressive closure of Photosystem II (1-qL) in Prochlorococcus (A), Synechococcus (B), Ostreococcus (C) or Thalassiosira (D) from growth-limiting (open triangles) or growth saturating light (open circles). Photosystem II closure was driven by increasing actinic light (Figure 1A). Paired determinations from 4 to 8 replicate cultures plotted individually.
Increasing PSII closure (Figure 2) was driven by progressively increasing the actinic light (Figure 1A) applied to samples of cultures after growth under limiting or saturating light. As actinic light increases the delivery of excitation to PSII outruns down stream electron transport and an increasing fraction of PSII become closed to photochemistry. We chose to analyze responses of σPSII′ measured in the presence of actinic light as our best approximation for the actual photophysiological performance of the cells. We in parallel measured σPSII′ 1s determined from FRRf curves applied after 1 s of darkness following actinic light (Figures 1A,B, insets), to allow PSII re-opening. Although the fluorescence induction curve fitting was generally of higher quality after the 1 s re-opening, subsequent interpretations are complicated by rapid, and differential, changes in photophysiology upon the transition to darkness. In Figure S2 we present σPSII′ 1s vs. σPSII′, which are indeed highly, but not perfectly, correlated.
In Prochlorococcus and Synechococcus (Figures 2A,B) we found higher σPSII′ in cultures grown under limiting light, but no evident trends in σPSII′ with PSII closure. In Ostreococcus (Figure 2C) and in Thalassiosira (Figure 2D) we found little effect of growth light upon σPSII′ but a downward trend in σPSII′ as PSII closure exceeded ~0.5.
Figure 3 then plots YNPQ vs. 1-qL determined from the same FRRf induction curves used for Figure 2.
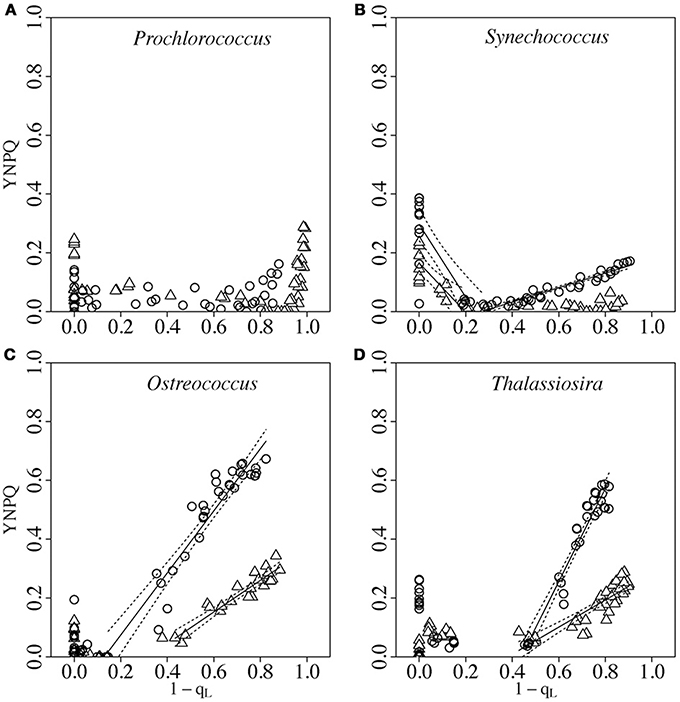
Figure 3. Response of YNPQ to progressive closure of Photosystem II (1-qL) in Prochlorococcus (A), Synechococcus (B), Ostreococcus (C) or Thalassiosira (D) from growth-limiting (open triangles) or growth saturating light (open circles). Photosystem II closure was driven by increasing actinic light (Figure 1A). Paired determinations from 4 to 8 replicate cultures plotted individually. Solid lines show segmented linear regressions to determine the break point for induction of YNPQ and the response of YNPQ to increasing Photosystem II closure. Dotted lines show 95% C.I. on the regression lines.
The YNPQ parameter relies upon the key assumption that the rate constants for excitation decay through constitutive excitation dissipation, kD, and for fluorescence emission, kF, remain constant (Klughammer and Schreiber, 2008) between the measurement of F0 or FS at the start of the FRRf induction and the measurement of FM or FM ′ at the peak of the FRRf induction. Examination of our FRRf induction curves shows that, particularly for diatoms, the fluorescence induction curve often increases to a peak and then subsequently declines within the 128 μs FRRf flashlet train (Xu et al., 2017). Since all PSII are closed and kP is thus driven to 0, and the flashlet intensity provoking fluorescence is constant during the flashlet train, a decrease in fluorescence implies some combination of a decrease in kF and increases in kD and/or kNPQ as fluorescence rises from F0 to FM. Thus for phytoplankton rapid modulation of rate constants for excitation decay can violate an underlying assumption of the YNPQ (and the more traditional Stern-Volmer NPQ) parameters, which were originally developed for application to green plant leaves (Kramer et al., 2004; Klughammer and Schreiber, 2008) which are both optically and physiologically distinct (Chow et al., 2012) from suspensions of phytoplankton cells. Indeed recent work (Magyar et al., 2018) supports rapid changes in kF in response to electrical effects induced within PSII during charge separation.
For both Synechococcus and Thalassiosira we saw a decrease in measured YNPQ as cells went from darkness to low light. In Synechococcus this dark to light decrease in measured YNPQ reflects a transition from State II to State I (Campbell and Oquist, 1996; Campbell et al., 1998) and corresponds to some increase in σPSII′ (Figure 2B). Diatoms are thought to lack state transitions (Owens, 1986) and the decrease in YNPQ from dark to low light in Thalassiosira is interpreted as relaxation of a phase of non-photochemical quenching present in the dark. This “sustained NPQ” is believed to be similar to that reported in higher plants, in that it depends on the maintenance of de-epoxidized xanthophyll (diatoxanthin-DT in diatoms) that keeps the PSII antenna in a dissipative state, independent of the instantaneous transthylakoidal proton gradient (Verhoeven, 2014). A molecular mechanism for the sustained fraction of NPQ in diatoms has been proposed (Lavaud and Goss, 2014), although debate over mechanism(s) continues (Giovagnetti and Ruban, 2016) and the relative importance of multiple processes likely varies across taxa (Lavaud and Lepetit, 2013; Goss and Lepetit, 2015; Lavaud et al., 2016). Sustained NPQ is found particularly in high light acclimated diatom cells and it depends on the maintenance of a high DT pool in the dark, which we indeed observe here in Thalassiosira (compare limiting and saturating light grown cells in Figure 3D and the second derivative spectra in Figures S3A,B).
To separate the dark-to-light decrease in YNPQ from any subsequent increase in YNPQ as 1-qL moved above a threshold level, we fit the data in Figure 3 with segmented linear regressions. With these plots we sought to determine whether induction of YNPQ correlated with a given threshold of PSII closure, represented by the X intercept of the rising phase. Ostreococcus, from growth-saturating light, showed a 1-qL threshold for induction of YNPQ well below the induction thresholds from growth-limiting light (Figure 3C), or for Thalassiosira from growth-saturating or growth-limiting light (Figure 3D) (Statistics, Figure S3). Thus growth saturating light induces a more sensitive induction of YNPQ in response to PSII closure in Ostreococcus, but not in the diatom Thalassiosira. Interestingly, a similar value for the induction threshold for non-photochemical quenching at closure of ~0.45 of PSII has been reported in the diatom Phaeodactylum tricornutum grown under low light (Ruban et al., 2004; Lavaud et al., 2007). The threshold level of 1-qL at which induction of YNPQ begins correlates well with the thresholds for light saturation of PSII electron transport, EK, determined for the respective cultures (Xu et al., 2017). This induction threshold feature is not observed in all diatoms (i.e., Skeletonema costatum) and may relate to differences in photophysiological adaptation to contrasting natural light climates (Lavaud and Lepetit, 2013; Lavaud et al., 2016).
Above this PSII closure threshold for induction of non-photochemical quenching, the slope of the rising phase of the regression then represents the sensitivity of induction of YNPQ to further progressive closure of PSII. In the study strain of Prochlorococcus we found a modest increase in measured YNPQ under high excitation pressure (Figure 3A), coinciding with the accumulation of significant predicted photoinactivation in the cultures (Table 3). Some strains of Prochlorococcus (Bailey et al., 2005; Kulk et al., 2012, 2013) have shown non-photochemical quenching phases whose induction and relaxation show temperature responses consistent with a dependence upon enzyme kinetics or membrane fluidity, which is not expected for a non-photochemical quenching response based upon photoinactivation of PSII.
We found that slopes of induction of YNPQ vs. 1-qL for Synechococcus, Ostreococcus, and Thalassiosira were significantly higher for cultures from growth-saturating light than for cultures from growth-limiting light (Statistics, Figure S3). Thus growth saturating light induces a stronger response of YNPQ induction to progressive PSII closure across the taxa; Synechoccoccus had the lowest induction slope, while Thalassiosira from growth saturating light had the highest induction slope, once 1-qL exceeded the induction threshold.
The stronger response of YNPQ induction in Synechococcus from growth saturating light (Figure 3B) likely represents a larger capacity for induction of non-photochemical quenching mediated by the Orange Carotenoid Protein (Boulay et al., 2008; Kirilovsky and Kerfeld, 2013; Kirilovsky, 2015). Whole cell spectra of our Synechococcus cultures indeed show changes in the region of 496 nm (Wilson et al., 2008), suggesting accumulation of activated Orange Carotenoid Protein of cultures from growth saturating light (Figure S4). We measured the induction of YNPQ under blue actinic and measuring light, absorbed primarily through chlorophyll. Cyanobacteria show stronger variations in YNPQ measured using light absorbed through the phycobilisome (Gorbunov et al., 2011) or through carotenoids (Zakar et al., 2016).
In Ostreococcus and Thalassiosira the stronger response of YNPQ induction in cells from growth saturating light (Figures 3C,D) likely results from a higher content of xanthophyll cycle pigments. Indeed, for the second derivative of whole cell spectra, we found a difference at 487 nm before and after 8 min of actinic light treatment in Ostreococcus from growth saturating light (Figure S5B), likely reflecting an increase in the de-epoxidised xanthophyll cycle pigment content zeaxanthin (485 nm) (Méléder et al., 2013; Ni et al., 2017). This light-dependent difference at 487 nm was not found in Ostreococcus from growth limiting light (Figure S5A), reflecting a smaller content of xanthophyll cycle pigments. We also found that the second derivative of whole cell spectra at 508 nm (Jesus et al., 2008) was different before and after actinic light treatment in Thalassiosira from growth saturating light, again likely reflecting an increase in the deepoxidized xanthophyll cycle pigment DT. We can attribute the spectral shift to an increase in the DT/DD ratio because the inhibitor dithiothreitol (Bachmann et al., 2004) blocks the response (Figure S3B).
Figure 4 presents the responses of σPSII′ to the induction of YNPQ driven by increasing actinic light (Figure 1A).
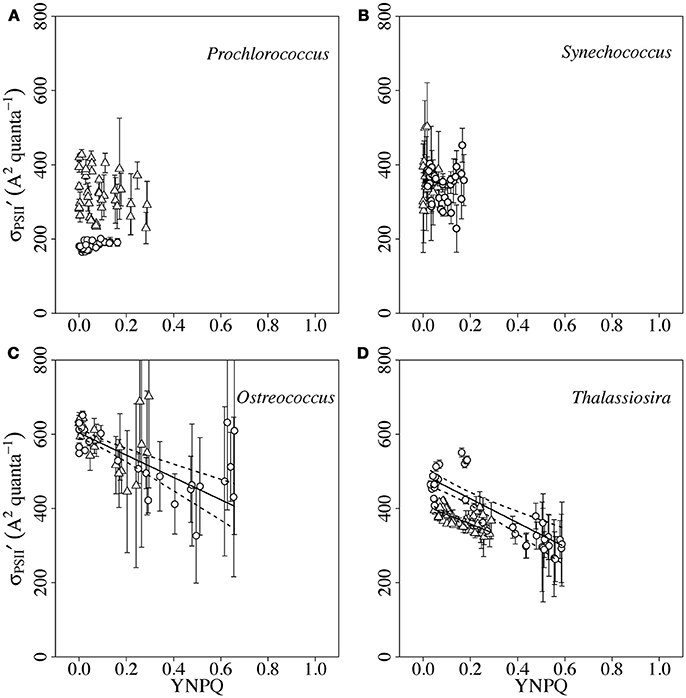
Figure 4. σPSII′ vs. YNPQ in Prochlorococcus (A), Synechococcus (B), Ostreococcus (C) or Thalassiosira (D) from growth-limiting (open triangles) or growth saturating light (open circles). Induction of YNPQ was driven by increasing actinic light (Figure 1A). Paired determinations from 4 to 8 replicate cultures plotted individually. Solid lines show linear regressions; dotted lines show 95% C.I. on the regression lines.
For the purposes of these analyses of σPSII′ vs. YNPQ, we excluded the points measured under darkness, to remove effects of state transitions and/or relaxation of YNPQ from darkness to low light (Figures 2, 3). In Prochlorococcus from growth-limiting light (Figure 4A), the induction of measured YNPQ reached ~0.3. This magnitude of YNPQ was sufficient to cause a detectable down-regulation of σPSII′ in Ostreococcus and Thalassiosira (Figures 4C,D), but in Prochlorococcus we found no significant down-regulation of σPSII′ with light induction of YNPQ even when the actinic light reached as high as 1,600 μmol photons m−2s−1. Therefore, whatever the underlying mechanism(s) (Bailey et al., 2005; Kulk et al., 2012, 2013), we find that changes in measured YNPQ were ineffective in altering σPSII′ in our studied strain of Prochlorococcus, measured with light absorbed through divinyl chl a. Indeed the relatively stable light and low nutrient regimes typical for Prochlorococcus strains argue against a large, rapidly regulated capacity for changes in excitation dissipation (Bailey et al., 2005) since it is more economical, in terms of N resource, to slowly regulate the content of antenna complexes to tune σPSII to a prevailing stable light regime, through changes in gene expression within a strain or changes in genomic encoded capacities among ecotypes (Rocap et al., 2003). Given the significant expected photoinactivation of PSII (Table 3) imposed by our light response treatment protocol we suggest that net photoinhibition dominated our measurements of YNPQ in this strain of Prochlorococcus.
In Synechococcus (Figure 4B) we found no significant down-regulation of σPSII′ in response to the modest increase in YNPQ induced by increasing actinic blue light. Synechococcus WH 8102 does contain the Orange Carotenoid Protein (Figure S3) that mediates an established mechanism of non-photochemical quenching of phycobilisome excitation transfer (Wilson et al., 2007; Boulay et al., 2008; Gorbunov et al., 2011; Kirilovsky and Kerfeld, 2013; Kirilovsky, 2015). But under our growth and blue light treatment conditions, the YNPQ induction in Synechococcus was insufficient to cause a detectable down-regulation of σPSII′. Note that Figure 4B excludes data points measured in darkness, where transition to State II does indeed cause a significant increase in measured YNPQ (Campbell et al., 1998) and a parallel detectable dark down-regulation of σPSII′ (Figure 2B). Therefore, our lack of response of σPSII′ to induction of YNPQ in Synechococcus under excess light was not a matter of analytical insensitivity. We find that YNPQ reflects at least two distinct processes in Synechococcus. We found an increase in σPSII′ (Figure 2B) during a dark to light transition, in parallel with simultaneous down-regulation of measured YNPQ (Figure 3B). In contrast we found a lack of response of σPSII′ to a comparable magnitude of YNPQ induction under excess blue light (Figure 4B). Our measures under 455 nm blue light, delivered to the small chl a absorption cross section associated with cyanobacterial PSII, largely bypass mechanisms including the Orange Carotenoid Protein that modulate excitation delivery through the phycobilisome (Gorbunov et al., 2011; Zakar et al., 2016), which could generate detectable changes in σPSII′.
In Ostreococcus (Figure 4C) cultures from growth-limiting or growth-saturating light showed a common Y-axis intercept, showing no significant acclimatory change in σPSII between the two growth light intensities. Data for Ostreococcus then fell upon a common regression of down regulation of σPSII′ with increasing YNPQ (Statistics, Figure S4). In Thalassiosira (Figure 4D) the cultures from growth-saturating light actually showed a slightly higher initial σPSII Y intercept. Cultures from growth limiting or growth saturating light then fell upon a common regression slope of down-regulation of σPSII′ with increasing YNPQ (Statistics, Figure S4). The higher initial σPSII Y intercept for Thalassiosira from growth saturating light is attributable to the relaxation of the sustained NPQ which was stronger in cultures from growth-saturating light (see Figure 3D). It is noteworthy that σPSII′ measured under high actinic light showed high variability and wide confidence intervals, since the amplitude of variable fluorescence remaining above steady state fluorescence was small (Xu et al., 2017). In Figure S6 we give the analogous plots of σPSII′ 1s with increasing YNPQ 1s, which support the same interpretations, consistent with the strong correlation of σPSII′ 1s vs. σPSII′ (Figure S2). The exception is that after 1s darkness Synechococcus shows a correlation between downregulation of σPSII′ 1s and the induction of YNPQ. We attribute this to the rapid transition from State I (light) to down regulated State II (dark) (Campbell et al., 1998).
The YNO yield parameterizes non-regulated excitation dissipation through the thermal deexcitation, kD, and fluorescence emission, kF, excitation decay rate constants (Kramer et al., 2004; Klughammer and Schreiber, 2008). We plotted σPSII′ vs. (YNPQ + YNO) (Figure 5) but found, as expected, that the plots showed weaker correlations than equivalent plots of σPSII′ vs. YNPQ, so that YNO had no additional power to explain changes in σPSII′. Indeed at least in diatoms the induction of YNPQ suppresses YNO (Perkins et al., 2018), so the measures tend to anti-correlate. Since YNO parameterizes processes largely mediated through the PSII reaction center it is reasonable that it has little influence upon σPSII′.
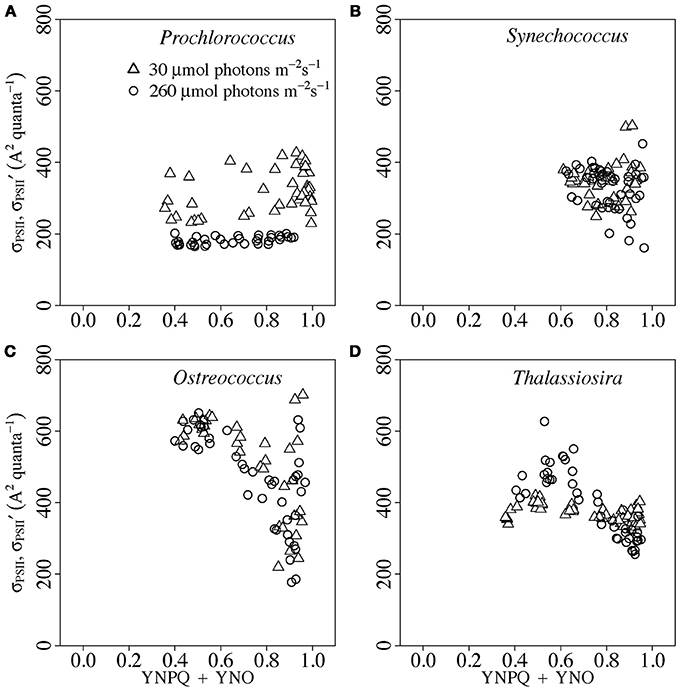
Figure 5. σPSII′ vs. YNO plus YNPQ in Prochlorococcus (A), Synechococcus (B), Ostreococcus (C), or Thalassiosira (D) from growth-limiting (open triangles) or growth saturating light (open circles). Induction of YNO and YNPQ was driven by increasing actinic light (Figure 1A). Paired determinations from 4 to 8 replicate cultures plotted individually.
To compare whether light induction of YNPQ had a proportional effect upon down regulation of σPSII′ we normalized σPSII′ to the Y intercept of the regression of σPSII′ vs. YNPQ (Figure 4) for each available combination of taxa and growth light (Figure 5), again excluding data points measured in darkness.
Since Prochlorococcus and Synechococcus did not show a statistically significant regression of σPSII′ vs. YNPQ under increasing light (Figures 4A,B) we did not perform the normalizations for those taxa. For Ostrecococcus (Figure 6A) and Thalassiosira (Figure 6B) cultures from both growth-limiting and growth-saturating light data fell upon slopes of −0.48 (−0.17 to −0.78, 95% C.I.) (Ostreococcus) or −0.68 (± −0.52 to −0.89, 95% C.I.) (Thalassiosira) for the intercept normalized σPSII′ vs. YNPQ. These slopes are significantly smaller in absolute magnitude than the −1 slope expected if YNPQ induction had a directly proportional effect upon σPSII′ (Statistics, Figure S5). In two diverse eukaryotic phytoplankters the effect of measured YNPQ upon down regulation of simultaneously measured σPSII′ was significant, but at less than the 1:1 proportionality expected for a yield coefficient.
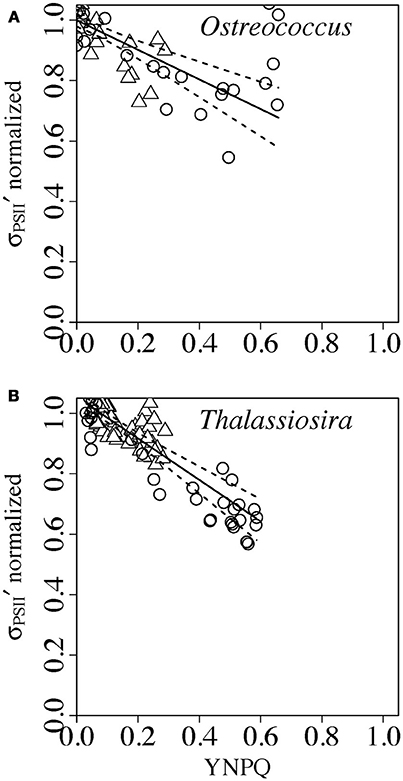
Figure 6. Normalized σPSII′ vs. YNPQ in Ostreococcus (A) or Thalassiosira (B) from growth-limiting (open triangles) or growth saturating light (open circles). Induction of YNPQ was driven by increasing actinic light (Figure 1A). σPSII′ was normalized to the regression intercept for a particular data set (Figure 4) to scale change in σPSII′ from 1 to 0. Paired determinations from 4 to 8 replicate cultures plotted individually. Solid lines show linear regressions; dotted lines show 95% C.I. on the regression lines.
We next sought to determine whether the relationship between down-regulation of σPSII′ and induction of YNPQ depends upon the immediate light history of the sample, or whether the relationship is consistent across differing histories of induction and relaxation. In Figure 7 we therefore plot intercept-normalized σPSII′ vs. YNPQ for culture samples exposed to either 40 or 480 s of saturating light (open symbols) followed by dark relaxation periods (closed symbols).
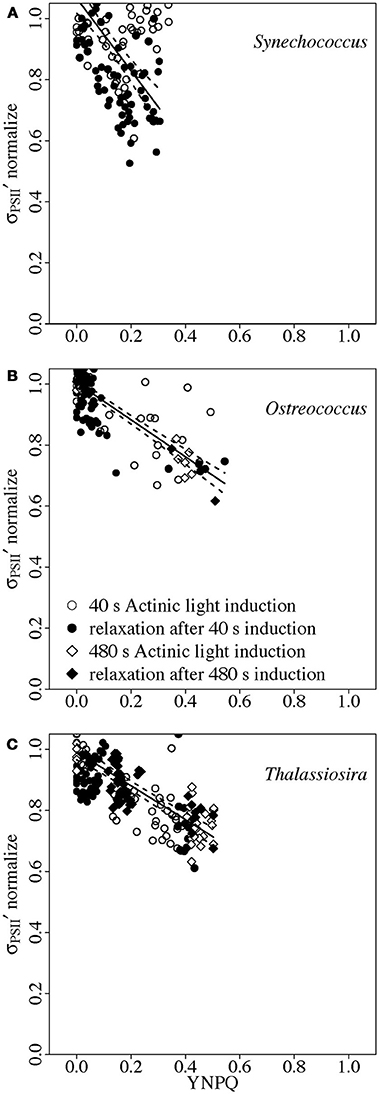
Figure 7. Normalized σPSII′ vs. YNPQ in Synechococcus (A), Ostreococcus (B), or Thalassiosira (C) from growth saturating light. Induction of YNPQ was driven by a time course exposure to saturating light (open symbols) for 40 s (circles) or 480 s (diamonds) (Figure 1B). Subsequent relaxation of YNPQ was thereafter tracked in darkness (Figure 1B) (closed symbols). σPSII′ was normalized to the regression intercept for a particular data set to scale change in σPSII′ from 1 to 0. Paired determinations from 4 to 8 replicate cultures plotted individually. Solid lines show linear regressions; dotted lines show 95% C.I. on the regression lines.
In Synechococcus from growth-saturating light (Figure 7A), there was no significant down-regulation of intercept-normalized σPSII′ vs. YNPQ during the saturating light incubation (open symbols). During the subsequent dark period we saw a significant down regulation of σPSII′ with increasing YNPQ as the cells reverted from State I (illumination) to State II (darkness) (closed symbols) (Campbell et al., 1998).
In Ostreococcus (Figure 7B) intercept-normalized σPSII′ vs. YNPQ from cultures from growth-saturating light, treated under saturating actinic light fell upon a common regression with the same cultures during dark relaxation from the saturating actinic light (Statistics, Figure S7). Thus, there was no hysteresis in the response of σPSII′ vs. YNPQ; the immediate light history of the samples had no significant influence upon a consistent downregulation of σPSII′ with increasing YNPQ. Furthermore, the slope of the common regression (Figure 7B) was not significantly different from that found in Figure 6A for Ostreococcus exposed to progressively increasing light (Statistics, Figure S6). Finally, cultures from growth-limiting or growth saturating light (Figure 6A) fell upon the same common regression, so longer term light acclimatory history had no significant effect upon the relation between σPSII′ with increasing YNPQ in Ostreococcus.
Similarly, in Thalassiosira (Figure 7C) intercept-normalized σPSII′ vs. YNPQ from cultures from growth-saturating light, treated under saturating actinic light fell upon a common regression with the same cultures during dark relaxation from saturating actinic light (Statistics, Figure S6). This common regression was not significantly different from the regression observed from cultures under progressively increasing light (Figure 6B), and cultures from growth-limiting or growth-saturating light fell upon the common regression (Figure 6B) (Statistics, Figure S6). Thus in both Ostreococcus or in Thalassiosira a given level of YNPQ imposes a consistent down-regulation upon σPSII′ within a given taxa, whatever the preceding light history. This likely reflects the fundamental commonalities in a YNPQ parameter dominated by xanthophyll mediated quenching in both Ostreococcus or in Thalassiosira. Maximum photoinhibition of PSII was small (less than 9%) under our treatments of these two eukaryotic taxa (Table 3), so any influence of photoinhibition upon YNPQ was negligible.
It is noteworthy that the prokaryotic Synechococcus does show a hysteresis in the relation between measured YNPQ and down-regulation of σPSII′ under blue light depending upon whether the measured YNPQ reflects a dark to light state transition, or an induction under high light attributable to the orange-carotenoid protein (Boulay et al., 2008).
If the regression line for σPSII′ vs. YNPQ in Ostreococcus (Figure 4C) is extrapolated out to a maximum YNPQ = 1 the residual ~286 A2 PSII−1, while the equivalent extrapolation to YNPQ = 1 gives a residual ~167 A2 PSII−1 for Thalassiosira (Figure 4D). In fact, across our studies to date (Ni et al., 2017; Figure S7) the maximum YNPQ we have consistently observed is ~0.6 in an arctic strain of the prasinophyte Micromonas. As a conceptual exercise we used the chlorophyll-specific absorption coefficient, corrected for cell size (Fujiki and Taguchi, 2002), and the 35 chlorophyll content of the core of PSII (Umena et al., 2011) to estimate the approximate effective absorption cross section for PSII in the absence of any associated antenna complexes. For Ostreococcus we estimate a minimal effective absorption cross section of ~96 A2 PSII−1 for the 35 chlorophylls of the PSII core complex, at our measurement light of 455 nm. The larger Thalassiosira suffers somewhat more optical screening through pigment packaging effects (Fujiki and Taguchi, 2002) and we estimate a minimal effective absorption cross section of ~79 A2 PSII−1. These estimates are 1/3–1/2 the size of the residual σPSII′ estimated from regression out to YNPQ = 1. Therefore there is a significant residual pigment bed serving PSII, functionally equivalent to ~74–104 chlorophylls that is not regulated by any degree of measured YNPQ induction. These results closely parallel findings in the diatom Phaeodactylum tricornutum that induction of Stern-Volmer NPQ above ~1 has no further effect upon down regulation of the PSII cross section (Giovagnetti and Ruban, 2016). This in turn suggests a violation in the theoretical model supporting the extraction of the YNPQ or the σPSII′ parameters. Given our observations of transient down-regulation of fluorescence emission during and immediately after FRRf flashlet trains (Xu et al., 2017) we suggest that the assumption of constant kD and kF required for derivation of YNPQ (Klughammer and Schreiber, 2008) can be violated in Ostrecoccocus and Thalassiosira even within the duration of an FRRf flashlet train. Experimental and theoretical work indeed supports changes in the fluorescence yield of PSII caused by transient changes in electric fields, and not directly related to photochemistry nor to non-photochemical dissipation of excitation (Magyar et al., 2018).
Conclusions
Measures of non-photochemical quenching of chlorophyll fluorescence are widely used to infer changes in excitation allocation and photoprotection in phytoplankters. In parallel σPSII from dark-acclimated cells or σPSII′ from light-acclimated cells are used to estimate photoacclimation status and electron transport rates.
In a strain of Prochlorococcus we measured induction of low levels of YNPQ, probably attributable to cumulative photoinactivaton of PSII, which had no significant effect upon σPSII′. In a strain of marine Synechococcus we found inductions of YNPQ under excess blue light, attributable to accumulation of activated Orange Carotenoid Protein, but again did not find a significant down-regulation of σPSII′ under excess blue light delivered directly to PSII. At similar levels of measured YNPQ in darkness we did find a detectable down-regulation of σPSII′ due to a state transition in Synechococcus. Thus for the two prokaryotes, detectable changes in YNPQ under excess blue light were not correlated with down regulation of σPSII′, but we did detect correlated changes in YNPQ and σPSII′ during dark to light state transitions.
In the chl a/b Prasinophyte phytoplankter Ostreococcus we found a significant induction of YNPQ with progressive closure of PSII. Growth under saturating light lowered the threshold for this induction of YNPQ and increased the subsequent induction slope, attributable to a higher content of xanthophyll cycle pigments. In the chl a/c diatom Thalassiosira we also found significant induction of YNPQ with progressive closure of PSII above a threshold. Growth under saturating light increased the induction slope, again attributable to a higher content of xanthophyll cycle pigments.
Within the tested eukaryotic taxa the supposed yield co-efficient for non-photochemical quenching, YNPQ, correlates with a consistent down-regulation of σPSII′, but it does not provoke a 1:1 down regulation of σPSII′ in either taxon, and significant residual σPSII′ remains even under a hypothetical maximum induction of YNPQ = 1. The discrepancy is even larger between the down regulation of σPSII′ and induction of the unbounded Stern-Volmer NPQ parameter (Giovagnetti and Ruban, 2016; Figure S1). The relation between a given level of YNPQ and a given down-regulation of σPSII′ was however consistent across different short- and long-term light histories for both Ostrecococcus and Thalassiosira.
The light threshold and magnitude of induction of YNPQ in relation to incident light or PSII closure changes with acclimation state. For representative eukaryotic taxa we can predict changes in σPSII′, useful for modeling acclimation or marine productivity (Suggett et al., 2009), from measures of YNPQ (Kramer et al., 2004; Klughammer and Schreiber, 2008) which are accessible from fluorescence measures that do not include σPSII′. This useful relation does not generally extend to the tested prokaryotes, at least for blue light. We sound caution on interpreting induction of YNPQ in terms of a directly proportional down-regulation of delivery of excitation to PSII as measured by σPSII′. The significant residual σPSII′ at maximum YNPQ shows that a fraction of the light harvesting capacity serving PSII, measured through σPSII′, is not subject to downregulation through the process(es) that drive measured YNPQ.
Summary
σPSII shows differing responses to YNPQ, depending upon phytoplankter taxa.
Author Contributions
KX grew the cultures, conducted the experiments, generated the figures, and did the data analyses. RP and JL contributed to the data analyses, interpretation, and discussion. EA guided the statistical analyses and interpretation of the data. MB contributed Figure S5 and contributed to discussions. DC designed the project, guided the data analyses, and wrote the draft of the manuscript with contributions from all authors.
Funding
This study was funded by the Natural Sciences and Engineering Research Council of Canada (DC) and the Canada Research Chairs (DC) using equipment funded by the New Brunswick Innovation Foundation (DC) and the Canada Foundation for Innovation (DC). EU Horizon 2020 No 734708/GHANA/H2020-MSCA-RISE-2016 supported the participation of JL, RP, and MB.
Conflict of Interest Statement
The authors declare that the research was conducted in the absence of any commercial or financial relationships that could be construed as a potential conflict of interest.
Acknowledgments
The authors thank Jessica Grant-Burt and Miranda Corkum for assistance with scripting and culturing. Dr. C. Mark Moore, National Oceanography Centre, University of Southhampton, UK, provided generous pre-review comments on derivations of fluorescence parameters.
Supplementary Material
The Supplementary Material for this article can be found online at: https://www.frontiersin.org/articles/10.3389/fmars.2018.00281/full#supplementary-material
Figure S1. NPQ vs. YNPQ in Prochlorococcus (A), Synechococcus (B), Ostreococcus (C), or Thalassiosira (D) from growth-limiting (open triangles) or growth saturating light (open circles). Induction of NPQ and YNPQ was driven by increasing actinic light (Figure 1A). Paired determinations from 4 to 8 replicate cultures plotted individually.
Figure S2. σPSII′ 1s vs. σPSII′ in Prochlorococcus (A), Synechococcus (B), Ostreococcus (C), or Thalassiosira (D) from growth-limiting (open triangles) or growth saturating light (open circles). σPSII′ was measured under increasing levels of actinic light (Figure 1A). σPSII′ 1s was measured after 1 s of darkness following each actinic light level (Figure 1A). Paired determinations from 4 to 8 replicate cultures plotted individually.
Figure S3. The normalized second derivative of whole cell spectra of Thalassiosira from growth-limiting (A,C) or growth saturating light (B,D). Samples were treated without or with dithiothreitol (DTT) to develop or inhibit the deepoxidation of the xanthophyll cycle. The whole cell spectra were measured before (solid line) and after (dashed line) 8 min of actinic light treatment. Average of paired determinations from 2 to 3 replicate cultures plotted.
Figure S4. The normalized second derivative of whole cell spectra of Synechococcus from growth-limiting (solid line) or growth saturating light (dotted line). Average of paired determinations from 2 to 3 replicate cultures plotted.
Figure S5. The normalized second derivative of whole cell spectra of Ostreococcus from growth-limiting (A,C) or growth saturating light (B,D). Samples were treated without or with dithiothreitol (DTT) to develop or inhibit the deepoxidation of the xanthophyll cycle. The whole cell spectra were measured before (solid line) and after (dashed line) 8 min of actinic light treatment. Average of paired determinations from 2 to 3 replicate cultures plotted.
Figure S6. σPSII′ 1s vs. YNPQ 1s in Prochlorococcus (A), Synechococcus (B), Ostreococcus (C), or Thalassiosira (D) from growth-limiting (open triangles) or growth saturating light (open circles). Induction of YNPQ 1s was driven by increasing actinic light (Figure 1A). Paired determinations from 4 to 8 replicate cultures plotted individually. Solid lines show linear regressions; dotted lines show 95% C.I. on the regression lines.
Figure S7. σPSII′ vs. YNPQ in (A) in Chlorella vulgaris, (B) Haslea ostrearia, (C) Haslea sp. (Indonesian strain), or (D) Micromonas NCMA 2099 (arctic strain growing at 2C). Induction of YNPQ was driven by increasing actinic light. Paired determinations from 3 to 15 cultures of each strain plotted individually and fitted with a linear regression (solid line); 95% C.I. on the regression shown by dotted lines.
References
Bachmann, K. M., Ebbert, V., Adams, W. W. III., Verhoeven, A. S., Logan, B. A., and Demmig-Adams, B. (2004). Effects of lincomycin on PSII efficiency, non-photochemical quenching, D1 protein and xanthophyll cycle during photoinhibition and recovery. Funct. Plant Biol. 31, 803–813. doi: 10.1071/FP04022
Bailey, S., Mann, N. H., Robinson, C., and Scanlan, D. J. (2005). The occurrence of rapidly reversible non-photochemical quenching of chlorophyll a fluorescence in cyanobacteria. FEBS Lett. 579, 275–280. doi: 10.1016/j.febslet.2004.11.091
Baty, F., Ritz, C., Charles, S., Brutsche, M., Flandrois, J.-P., and Delignette-Muller, M.-L. (2015). A toolbox for nonlinear regression in R: the package nlstools. J. Stat. Softw. 66, 1–21. doi: 10.18637/jss.v066.i05
Boulay, C., Abasova, L., Six, C., Vass, I., and Kirilovsky, D. (2008). Occurrence and function of the orange carotenoid protein in photoprotective mechanisms in various cyanobacteria. Biochim. Biophys. Acta 1777, 1344–1354. doi: 10.1016/j.bbabio.2008.07.002
Campbell, D. A., and Tyystjärvi, E. (2012). Parameterization of photosystem II photoinactivation and repair. Biochim. Biophys. Acta 1817, 258–265. doi: 10.1016/j.bbabio.2011.04.010
Campbell, D., Hurry, V., Clarke, A. K., Gustafsson, P., and Öquist, G. (1998). Chlorophyll fluorescence analysis of cyanobacterial photosynthesis and acclimation. Microbiol. Mol. Biol. Rev. 62, 667–683.
Campbell, D., and Oquist, G. (1996). Predicting light acclimation in Cyanobacteria from nonphotochemical quenching of photosystem II fluorescence, which reflects state transitions in these organisms. Plant Physiol. 111, 1293–1298.
Chow, W. S., Fan, D. Y., Oguchi, R., Jia, H., Losciale, P., Park, Y. I., et al. (2012). Quantifying and monitoring functional photosystem II and the stoichiometry of the two photosystems in leaf segments: approaches and approximations. Photosynth. Res. 113, 63–74. doi: 10.1007/s11120-012-9740-y
Chrétiennot-Dinet, M.-J., Courties, C., Vaquer, A., Neveux, J., Claustre, H., Lautier, J., et al. (1995). A new marine picoeucaryote: Ostreococcus tauri gen. et sp. nov. (Chlorophyta, Prasinophyceae). Phycologia 34, 285–292. doi: 10.2216/i0031-8884-34-4-285.1
Elzhov, T. V., Mullen, K. M., Spiess, A.-N., and Bolker, B. (2016). minpack.lm: R Interface to the Levenberg-Marquardt Nonlinear Least-Squares Algorithm Found in MINPACK, Plus Support for Bounds. Available online at: https://CRAN.R-project.org/package=minpack.lm
Fujiki, T., and Taguchi, S. (2002). Variability in chlorophyll a specific absorption coefficient in marine phytoplankton as a function of cell size and irradiance. J. Plankton Res. 24, 859–874. doi: 10.1093/plankt/24.9.859
Genty, B., Briantais, J.-M., and Baker, N. R. (1989). The relationship between the quantum yield of photosynthetic electron transport and quenching of chlorophyll fluorescence. Biochim. Biophys. Acta 990, 87–92. doi: 10.1016/S0304-4165(89)80016-9
Giovagnetti, V., and Ruban, A. V. (2016). Detachment of the fucoxanthin chlorophyll a/c binding protein (FCP) antenna is not involved in the acclimative regulation of photoprotection in the pennate diatom Phaeodactylum tricornutum. Biochim. Biophys. Acta. 1858, 218–230. doi: 10.1016/j.bbabio.2016.12.005
Gorbunov, M. Y., Kuzminov, F. I., Fadeev, V. V., Kim, J. D., and Falkowski, P. G. (2011). A kinetic model of non-photochemical quenching in cyanobacteria. Biochim. Biophys. Acta 1807, 1591–1599. doi: 10.1016/j.bbabio.2011.08.009
Goss, R., and Lepetit, B. (2015). Biodiversity of NPQ. J. Plant Physiol. 172, 13–32. doi: 10.1016/j.jplph.2014.03.004
Hendrickson, L., Furbank, R. T., and Chow, W. S. (2004). A simple alternative approach to assessing the fate of absorbed light energy using chlorophyll fluorescence. Photosynth. Res. 82, 73–81. doi: 10.1023/B:PRES.0000040446.87305.f4
Holzwarth, A. R., Lenk, D., and Jahns, P. (2013). On the analysis of non-photochemical chlorophyll fluorescence quenching curves. Biochim. Biophys. Acta 1827, 786–792. doi: 10.1016/j.bbabio.2013.02.011
Horton, P., Ruban, A. V., and Walters, R. G. (1996). Regulation of light harvesting in green plants. Annu. Rev. Plant Physiol. Plant Mol. Biol. 47, 655–684. doi: 10.1146/annurev.arplant.47.1.655
Huner, N. P., Öquist, G., and Sarhan, F. (1998). Energy balance and acclimation to light and cold. Trends Plant Sci. 3, 224–230. doi: 10.1016/S1360-1385(98)01248-5
Ito, H., and Tanaka, A. (2011). Evolution of a divinyl chlorophyll-based photosystem in Prochlorococcus. Proc. Natl. Acad. Sci. U.S.A. 108, 18014–18019. doi: 10.1073/pnas.1107590108
Jesus, B., Mouget, J.-L., and Perkins, R. G. (2008). Detection of diatom xanthophyll cycle using spectra reflectance. J. Phycol. 44, 1349–1359. doi: 10.1111/j.1529-8817.2008.00583.x
Key, T., Mccarthy, A., Campbell, D., Six, C., Roy, S., and Finkel, Z. (2010). Cell size trade-offs govern light exploitation strategies in marine phytoplankton. Environ. Microbiol. 12, 95–104. doi: 10.1111/j.1462-2920.2009.02046.x
Kirilovsky, D. (2015). Modulating energy arriving at photochemical reaction centers: orange carotenoid protein-related photoprotection and state transitions. Photosynth. Res. 126, 3–17. doi: 10.1007/s11120-014-0031-7
Kirilovsky, D., and Kerfeld, C. A. (2013). The orange carotenoid protein: a blue-green light photoactive protein. Photochem. Photobiol. Sci. 12, 1135–1143. doi: 10.1039/c3pp25406b
Klughammer, C., and Schreiber, U. (2008). Complementary PS II quantum yields calculated from simple fluorescence parameters measured by PAM fluorometry and the Saturation Pulse method. PAM Appl. Notes 1, 27–35.
KoblíŽek, M., Kaftan, D., and Nedbal, L. (2001). On the relationship between the non-photochemical quenching of the chlorophyll fluorescence and the Photosystem II light harvesting efficiency. A repetitive flash fluorescence induction study. Photosynth. Res. 68, 141–152. doi: 10.1023/A:1011830015167
Kolber, Z. S., Prasil, O., and Falkowski, P. G. (1998). Measurements of variable chlorophyll fluorescence using fast repetition rate techniques: defining methodology and experimental protocols. Biochim. Biophys. Acta 1367, 88–106. doi: 10.1016/S0005-2728(98)00135-2
Kramer, D. M., Johnson, G., Kiirats, O., and Edwards, G. E. (2004). New fluorescence parameters for the determination of QA redox state and excitation energy fluxes. Photosynth. Res. 79, 209–218. doi: 10.1023/B:PRES.0000015391.99477.0d
Kulk, G., de Vries, P., van de Poll, W., and Buma, A. G. J. (2013). “Temperature-dependent photoregulation in oceanic picophytoplankton during excessive irradiance exposure,” in Photosynthesis, ed Z. Dubinsky (London: InTech).
Kulk, G., de Vries, P., van de Poll, W., Visser, R., and Buma, A. (2012). Temperature-dependent growth and photophysiology of prokaryotic and eukaryotic oceanic picophytoplankton. Mar. Ecol. Prog. Ser. 466, 43–55. doi: 10.3354/meps09898
Lambrev, P. H., Miloslavina, Y., Jahns, P., and Holzwarth, A. R. (2012). On the relationship between non-photochemical quenching and photoprotection of Photosystem II. Biochim. Biophys. Acta 1817, 760–769. doi: 10.1016/j.bbabio.2012.02.002
Laney, S. R. (2003). Assessing the error in photosynthetic properties determined with Fast Repetition Rate fluorometry. Limnol. Oceanogr. 48, 2234–2242. doi: 10.4319/lo.2003.48.6.2234
Laney, S. R., and Letelier, R. M. (2008). Artifacts in measurements of chlorophyll fluorescence transients, with specific application to fast repetition rate fluorometry. Limnol. Oceanogr. Methods 6, 40–50. doi: 10.4319/lom.2008.6.40
Lavaud, J., and Goss, R. (2014). “The peculiar features of non-photochemical fluorescence quenching in diatoms and brown algae,” in Non-Photochemical Quenching and Energy Dissipation in Plants, Algae and Cyanobacteria Advances in Photosynthesis and Respiration, eds B. Demmig-Adams, G. Garab, W. A. III., and Govindjee (Dordrecht: Springer), 421–443.
Lavaud, J., and Lepetit, B. (2013). An explanation for the inter-species variability of the photoprotective non-photochemical chlorophyll fluorescence quenching in diatoms. Biochim. Biophys. Acta 1827, 294–302. doi: 10.1016/j.bbabio.2012.11.012
Lavaud, J., Six, C., and Campbell, D. A. (2016). Photosystem II repair in marine diatoms with contrasting photophysiologies. Photosynth. Res. 127, 189–199. doi: 10.1007/s11120-015-0172-3
Lavaud, J., Strzepek, R. F., and Kroth, P. G. (2007). Photoprotection capacity differs among diatoms: Possible consequences on the spatial distribution of diatoms related to fluctuations in the underwater light climate. Limnol. Oceanogr. 52, 1188–1194. doi: 10.4319/lo.2007.52.3.1188
Lenth, R. V. (2016). Least-squares means: the R package lsmeans. J. Stat. Softw. 69, 1–33. doi: 10.18637/jss.v069.i01
Li, D., Xie, J., Zhao, J., Xia, A., Li, D., and Gong, Y. (2004). Light-induced excitation energy redistribution in Spirulina platensis cells: “spillover” or “mobile PBSs”? Biochim. Biophys. Acta 1608, 114–121. doi: 10.1016/j.bbabio.2003.11.002
Li, G., Brown, C. M., Jeans, J. A., Donaher, N. A., McCarthy, A., and Campbell, D. A. (2015). The nitrogen costs of photosynthesis in a diatom under current and future pCO2. New Phytol. 205, 533–543. doi: 10.1111/nph.13037
Li, G., and Campbell, D. A. (2013). Rising CO2 interacts with growth light and growth rate to alter photosystem II photoinactivation of the coastal diatom Thalassiosira pseudonana. PLoS ONE 8:e55562. doi: 10.1371/journal.pone.0055562
Magyar, M., Sipka, G., Kovács, L., Ughy, B., Zhu, Q., Han, G., et al. (2018). Rate-limiting steps in the dark-to-light transition of Photosystem II - revealed by chlorophyll-a fluorescence induction. Sci. Rep. 8:2755. doi: 10.1038/s41598-018-21195-2
Méléder, V., Laviale, M., Jesus, B., Mouget, J. L., Lavaud, J., Kazemipour, F., et al. (2013). In vivo estimation of pigment composition and optical absorption cross-section by spectroradiometry in four aquatic photosynthetic micro-organisms. J. Photochem. Photobiol. B 129, 115–124. doi: 10.1016/j.jphotobiol.2013.10.005
Miloslavina, Y., Grouneva, I., Lambrev, P., Lepetit, B., Goss, R., Wilhelm, C., et al. (2009). Ultrafast fluorescence study on the location and mechanism of non-photochemical quenching in diatoms. Biochim. Biophys. Acta 1787, 1189–1197. doi: 10.1016/j.bbabio.2009.05.012
Morel, A., Ahn, Y.-H., Partensky, F., Vaulot, D., and Claustre, H. (1993). Prochlorococcus and Synechococcus: a comparative study of their optical properties in relation to their size and pigmentation. J. Mar. Res. 51, 617–649. doi: 10.1357/0022240933223963
Murphy, C. D., Ni, G., Suggett, D. J., Li, G., Barnett, A., Kui, X., et al. (2016). Quantitating active Photosystem II reaction center content from fluorescence induction transients. Limnol. Oceanogr. 15, 54–69. doi: 10.1002/lom3.10142
Murphy, C. D., Roodvoets, M. S., Austen, E. J., Dolan, A., Barnett, A., and Campbell, D. A. (2017). Photoinactivation of Photosystem II in Prochlorococcus and Synechococcus. PLOS ONE 12:e0168991. doi: 10.1371/journal.pone.0168991
Ni, G., Zimbalatti, G., Murphy, C. D., Barnett, A. B., Arsenault, C. M., Li, G., et al. (2017). Arctic Micromonas uses protein pools and non-photochemical quenching to cope with temperature restrictions on Photosystem II protein turnover. Photosynth. Res. 131, 203–220. doi: 10.1007/s11120-016-0310-6
Oliver, R. L., Whittington, J., Lorenz, Z., and Webster, I. T. (2003). The influence of vertical mixing on the photoinhibition of variable chlorophyll a fluorescence and its inclusion in a model of phytoplankton photosynthesis. J. Plankton Res. 25, 1107–1129. doi: 10.1093/plankt/25.9.1107
Owens, T. G. (1986). Light-harvesting function in the diatom Phaeodactylum tricornutum: II. distribution of excitation energy between the photosystems. Plant Physiol. 80, 739–746.
Oxborough, K., and Baker, N. R. (1997). Resolving chlorophyll a fluorescence images of photosynthetic efficiency into photochemical and non-photochemical components – calculation of qP and Fv′/Fm′; without measuring Fo′. Photosynth. Res. 54, 135–142. doi: 10.1023/A:1005936823310
Oxborough, K., Moore, C. M., Suggett, D. J., Lawson, T., Chan, H. G., and Geider, R. J. (2012). Direct estimation of functional PSII reaction center concentration and PSII electron flux on a volume basis: a new approach to the analysis of Fast Repetition Rate fluorometry (FRRf) data. Limnol. Oceanogr. Methods 10, 142–154. doi: 10.4319/lom.2012.10.142
Perkins, R., Williamson, C., Lavaud, J., Mouget, J.-L., and Campbell, D. A. (2018). Time-dependent upregulation of electron transport with concomitant induction of regulated excitation dissipation in Haslea diatoms. Photosynth. Res. doi: 10.1007/s11120-018-0508-x. [Epub ahead of print].
R Core Team (2011). R: A Language and Environment for Statistical Computing. Vienna: R Foundation for Statistical Computing. Available online at: https://www.R-project.org/
Rast, A., Heinz, S., and Nickelsen, J. (2015). Biogenesis of thylakoid membranes. Biochim. Biophys. Acta 1847, 821–830. doi: 10.1016/j.bbabio.2015.01.007
Rocap, G., Larimer, F. W., Lamerdin, J., Malfatti, S., Chain, P., Ahlgren, N. A., et al. (2003). Genome divergence in two Prochlorococcus ecotypes reflects oceanic niche differentiation. Nature 424, 1042–1047. doi: 10.1038/nature01947
RStudio Team (2015). RStudio: Integrated Development for R. RStudio, Inc., Boston, MA. Available online at: http://www.rstudio.com/
Ruban, A., Lavaud, J., Rousseau, B., Guglielmi, G., Horton, P., and Etienne, A.-L. (2004). The super-excess energy dissipation in diatom algae: comparative analysis with higher plants. Photosynth. Res. 82:165. doi: 10.1007/s11120-004-1456-1
Schuback, N., Flecken, M., Maldonado, M. T., and Tortell, P. D. (2016). Diurnal variation in the coupling of photosynthetic electron transport and carbon fixation in iron-limited phytoplankton in the NE subarctic Pacific. Biogeosciences 13, 1019–1035. doi: 10.5194/bg-13-1019-2016
Schuback, N., Schallenberg, C., Duckham, C., Maldonado, M. T., and Tortell, P. D. (2015). Interacting effects of light and iron availability on the coupling of photosynthetic electron transport and CO2-assimilation in marine phytoplankton. PLOS ONE 10:e0133235. doi: 10.1371/journal.pone.0133235
Serôdio, J., Cruz, S., Vieira, S., and Brotas, V. (2005). Non-photochemical quenching of chlorophyll fluorescence and operation of the xanthophyll cycle in estuarine microphytobenthos. J. Exp. Mar. Biol. Ecol. 326, 157–169. doi: 10.1016/j.jembe.2005.05.011
Silsbe, G. M., Oxborough, K., Suggett, D. J., Forster, R. M., Ihnken, S., Komárek, O., et al. (2015). Toward autonomous measurements of photosynthetic electron transport rates: an evaluation of active fluorescence-based measurements of photochemistry. Limnol. Oceanogr. Methods 13, 138–155. doi: 10.1002/lom3.10014
Simis, S. G. H., Huot, Y., Babin, M., Seppälä, J., and Metsamaa, L. (2012). Optimization of variable fluorescence measurements of phytoplankton communities with cyanobacteria. Photosynth. Res. 112, 13–30. doi: 10.1007/s11120-012-9729-6
Six, C., Finkel, Z., Rodriguez, F., Marie, D., Partensky, F., and Campbell, D. (2008). Contrasting photoacclimation costs in ecotypes of the marine eukaryotic picoplankter Ostreococcus. Limnol. Oceanogr. 53, 255–265. doi: 10.4319/lo.2008.53.1.0255
Six, C., Finkel, Z. V., Irwin, A. J., and Campbell, D. A. (2007a). Light variability illuminates niche-partitioning among marine picocyanobacteria. PLoS ONE 2:e1341. doi: 10.1371/journal.pone.0001341
Six, C., Sherrard, R., Lionard, M., Roy, S., and Campbell, D. (2009). Photosystem II and pigment dynamics among ecotypes of the green alga Ostreococcus. Plant Physiol. 151, 379–390. doi: 10.1104/pp.109.140566
Six, C., Thomas, J.-C., Garczarek, L., Ostrowski, M., Dufresne, A., Blot, N., et al. (2007b). Diversity and evolution of phycobilisomes in marine Synechococcus spp.: a comparative genomics study. Genome Biol. 8:R259. doi: 10.1186/gb-2007-8-12-r259
Stirbet, A. (2013). Excitonic connectivity between photosystem II units: what is it, and how to measure it? Photosynth. Res. 116, 189–214. doi: 10.1007/s11120-013-9863-9
Suggett, D. J., Goyen, S., Evenhuis, C., Szabó, M., Pettay, D. T., Warner, M. E., et al. (2015). Functional diversity of photobiological traits within the genus Symbiodinium appears to be governed by the interaction of cell size with cladal designation. New Phytol. 208, 370–381. doi: 10.1111/nph.13483
Suggett, D. J., Oxborough, K., Baker, N. R., MacIntyre, H. L., Kana, T. M., and Geider, R. J. (2003). Fast repetition rate and pulse amplitude modulation chlorophyll a fluorescence measurements for assessment of photosynthetic electron transport in marine phytoplankton. Eur. J. Phycol. 38, 371–384. doi: 10.1080/09670260310001612655
Suggett, D., MacIntyre, H., and Geider, R. (2004). Evaluation of biophysical and optical determinations of light absorption by photosystem II in phytoplankton. Limnol. Oceanogr. Methods 2, 316–332. doi: 10.4319/lom.2004.2.316
Suggett, D., MacIntyre, H., Kana, T., and Geider, R. (2009). Comparing electron transport with gas exchange: parameterising exchange rates between alternative photosynthetic currencies for eukaryotic phytoplankton. Aquat. Microb. Ecol. 56, 147–162. doi: 10.3354/ame01303
Swingley, W. D., Iwai, M., Chen, Y., Ozawa, S., Takizawa, K., Takahashi, Y., et al. (2010). Characterization of photosystem I antenna proteins in the prasinophyte Ostreococcus tauri. Biochim. Biophys. Acta 1797, 1458–1464. doi: 10.1016/j.bbabio.2010.04.017
Trissl, H. W., and Lavergne, J. (1995). Fluorescence induction from Photosystem II: analytical equations for the yields of photochemistry and fluorescence derived from analysis of a model including exciton-radical pair equilibrium and restricted energy transfer between photosynthetic units. Funct. Plant Biol. 22, 183–193. doi: 10.1071/pp9950183
Umena, Y., Kawakami, K., Shen, J.-R., and Kamiya, N. (2011). Crystal structure of oxygen-evolving photosystem II at a resolution of 1.9 Å. Nature 473, 55–60. doi: 10.1038/nature09913
van Kooten, O., and Snel, J. F. (1990). The use of chlorophyll fluorescence nomenclature in plant stress physiology. Photosynth. Res. 25, 147–150. doi: 10.1007/BF00033156
Venables, W. N., and Ripley, B. D. (2002). Modern Applied Statistics with S-PLUS. New York, NY: Springer.
Verhoeven, A. (2014). Sustained energy dissipation in winter evergreens. New Phytol. 201, 57–65. doi: 10.1111/nph.12466
Ware, M. A., Belgio, E., and Ruban, A. V. (2015). Photoprotective capacity of non-photochemical quenching in plants acclimated to different light intensities. Photosynth. Res. 126, 261–274. doi: 10.1007/s11120-015-0102-4
Wilson, A., Boulay, C., Wilde, A., Kerfeld, C., and Kirilovsky, D. (2007). Light-induced energy dissipation in iron-starved Cyanobacteria: roles of OCP and IsiA proteins. Plant Cell 19, 656–672. doi: 10.1105/tpc.106.045351
Wilson, A., Punginelli, C., Gall, A., Bonetti, C., Alexandre, M., Routaboul, J.-M., et al. (2008). A photoactive carotenoid protein acting as light intensity sensor. Proc. Natl. Acad. Sci. U.S.A. 105, 12075–12080. doi: 10.1073/pnas.0804636105
Wu, H., Roy, S., Alami, M., Green, B. R., and Campbell, D. A. (2012). Photosystem II photoinactivation, repair, and protection in marine centric diatoms. Plant Physiol. 160, 464–476. doi: 10.1104/pp.112.203067
Xu, K., Grant-Burt, J. L., Donaher, N., and Campbell, D. A. (2017). Connectivity among Photosystem II centers in phytoplankters: patterns and responses. Biochim. Biophys. Acta 858, 459–474. doi: 10.1016/j.bbabio.2017.03.003
Keywords: chlorophyll fluorescence, diatoms, light acclimation, photosynthesis, picocyanobacteria, prasinophytes, Prochlorococcus
Citation: Xu K, Lavaud J, Perkins R, Austen E, Bonnanfant M and Campbell DA (2018) Phytoplankton σPSII and Excitation Dissipation; Implications for Estimates of Primary Productivity. Front. Mar. Sci. 5:281. doi: 10.3389/fmars.2018.00281
Received: 31 May 2018; Accepted: 23 July 2018;
Published: 13 August 2018.
Edited by:
George S. Bullerjahn, Bowling Green State University, United StatesReviewed by:
Robert L. Burnap, Oklahoma State University, United StatesAssaf Sukenik, Israel Oceanographic and Limnological Research, Israel
Copyright © 2018 Xu, Lavaud, Perkins, Austen, Bonnanfant and Campbell. This is an open-access article distributed under the terms of the Creative Commons Attribution License (CC BY). The use, distribution or reproduction in other forums is permitted, provided the original author(s) and the copyright owner(s) are credited and that the original publication in this journal is cited, in accordance with accepted academic practice. No use, distribution or reproduction is permitted which does not comply with these terms.
*Correspondence: Douglas A. Campbell, ZGNhbXBiZWxsQG10YS5jYQ==