- 1Department of Marine Systems at Tallinn University of Technology, Tallinn, Estonia
- 2Leibniz Institute for Baltic Sea Research (LG), Warnemünde, Germany
- 3Marine Research Unit, Finnish Meteorological Institute, Helsinki, Finland
- 4Oceanographic Unit, Swedish Meteorological and Hydrological Institute, Norrköping, Sweden
Major Baltic Inflows (MBI) have a significant impact on physics, biogeochemistry, and marine life in the Baltic Sea. Spreading of the North Sea water from the Danish Straits to the Eastern Gotland Basin has been rigorously studied in recent decades. Investigations of lateral signal propagation using in-situ measurements, which cover the area from the Eastern Gotland Basin to the Gulf of Finland, are missing. Estonian–Swedish–German–Finnish oceanographic data from January 2014 to March 2017 were merged and analyzed to fill the gap. Recent MBIs caused considerable changes in water column properties, and salinity reached the highest values of the last 40–60 years. The arrivals of MBI waters were detected as peaks in the salinity and temperature time-series in the near-bottom layer of the Gotland Deep 4–5 months after the MBI events. Similar peaks were also identified in the Fårö Deep, Northern Deep, and Kõpu West (Northern Baltic Proper) with a further delay of 2–3, 3–5, and 4–6 months, respectively. The first impact of the 2014 December MBI occurred in the Gulf of Finland in 9 months as the arrival of the former Northern Baltic Proper deep layer water. Water renewal in the Fårö Deep occurred as a gravity current over the sill between Fårö and Gotland Deep. Deep layer water in the Northern Baltic Proper and the Gulf of Finland originated from the sub-halocline layer (110–120 m) of the Eastern Gotland Basin. The pre-condition for such mid-layer advection was a denser deep layer in the Gotland and Fårö Deep. Fresh oxygen, which arrived in the Gotland Deep in April 2015 and February 2016, was consumed in the near-bottom layer within 3–6 months. Since summer 2016, oxygenated waters occurred in the Gotland Deep in the layer from the halocline to 160 m depth. This oxygen did not reach the area further in the north, except a slight sign of ventilation of the Fårö Deep in February 2017. Thus, MBIs did not improve the oxygen conditions in the area north of the Gotland Deep and oxygen conditions rather worsened in the Northern Baltic Proper and the Gulf of Finland.
Introduction
The Baltic Sea is a semi-enclosed, shallow, and brackish sea with limited water exchange with the North Sea. High freshwater supply from rivers and irregular inflows of saline waters through the Danish Straits and the Sound maintain large horizontal salinity/density gradients and vertical stratification in the Baltic Sea (e.g., Myrberg and Leppäranta, 2009). Changes in freshwater flux (Hänninen and Vuorinen, 2011), despite its seasonality, accumulate, and emerge in the sea over decades (Schimanke and Meier, 2016). Strong stratification effectively restricts the direct ventilation of the deep basins below the permanent halocline at ~70 m depth. The eutrophication of the Baltic Sea, to a large extent caused by anthropogenic enrichment of the nutrients, is expressed in increased biomass production and sedimentation resulting in oxygen depletion of the deep layers and an increase of hypoxic bottom areas (Vahtera et al., 2007; Conley et al., 2009).
There are two types of saline water inflows through the Danish Straits leading to a renewal of sub-halocline waters of the Baltic Sea. Barotropic inflows are forced by sea level differences between the Kattegat and the Arkona Basin. Strong barotropic inflows, called Major Baltic Inflows (MBIs), are the main process to ventilate deep water in the Baltic Sea (Matthäus and Franck, 1992). Special atmospheric conditions are needed to evoke an MBI—a sequence of easterly winds lasting 20–30 days followed by strong westerly winds of similar duration (Matthäus and Lass, 1995). Franck et al. (1987) analyzed long-term salinity time series (1897–1976) measured at Darss Sill area and found 5–7 MBIs per decade. Since the 1980s, MBIs have been rather rare—strong MBIs occurred in 1993 (Matthäus and Lass, 1995) and 2003 (Feistel et al., 2006) and a moderate MBI in 1997 (Hagen and Feistel, 2001). The following inflow event in December 2014 was considered as the strongest since 1951 (Mohrholz et al., 2015). During this MBI event 320 km3 of salty and oxygen-rich water propagated into the western Baltic Sea after a 10-year stagnation period. Weaker MBIs followed in November 2015 and January–February (Naumann et al., submitted). Weaker barotropic inflows could occur several times per year and play an important role in maintaining haline stratification (Burchard et al., 2005). The second type is the baroclinic inflows forced by density gradient between the Baltic Sea and the Kattegat which usually occur during longer calm periods. If a baroclinic inflow lasts long enough, a clear signature of this inflowing water mass can be observed from the Danish Straits to the Baltic Proper (Feistel et al., 2004). Baroclinic inflows do not carry much oxygen from the North Sea, but they could pick up oxygen by entrainment with the cold intermediate layer at sills in the Baltic Sea and to some extent ventilate deeper basins (Feistel et al., 2006; Mohrholz et al., 2006).
Strong barotropic inflows cause considerable changes in environmental conditions not only in the layers they occupy, but also adjacent areas and water column above. The saltier North Sea water propagates as a dense bottom gravity current from the western Baltic to the central Baltic Sea. Strong inflows fill deep basins with high saline, oxygen-rich water, lift up the former stagnant water, and push it onwards. Transformation of water mass properties along the inflow pathway depends on advection and vertical mixing/entrainment. The impact of December 2014 MBI on the deepwater properties and dynamics in the Gotland Basin is well investigated. Schmale et al. (2016) followed the propagation of December 2014 MBI water and recorded its arrival into the Gotland Basin in the beginning of March when increasing oxygen levels in the deepest layers terminated the 10-year stagnation period. The near-bottom layer was a mixture of the inflow water, water flushed out from the near-bottom region of the neighboring Bornholm Basin, and surrounding water entrained along the pathway of the inflow. They also observed high current speed and turbulence levels in the near-bottom region along the slope and very low turbulence levels in the interior of deep basin. Holtermann et al. (2017) investigated the impact of December 2014 MBI on deepwater properties in the Gotland Basin using one-year observational data covering the inflow phase and the following stagnation period. Time series of vertical distribution of salinity and oxygen concentration allowed to separate three phases within the 5 month period starting from the end of February: (1) near-bottom propagation of saltier and moderately oxic waters, likely water masses displaced from the Bornholm Basin by the main inflow, gradually filling the 70–80 m thick near-bottom layer, (2) the main inflow pulse (duration 3–4 weeks) which doubled the oxygen concentrations and filled ~100 m thick layer, and (3) longer period (2.5 months) of oxic intrusions detached from gravity current at intermediate depth which imported the amount of oxygen comparable with the contribution of the main inflow pulse.
Up to now, a few field observations, focused only on single, separated areas along the pathway from the Gotland Basin to the Gulf of Finland and model simulations are performed. However, investigations of signal propagation and transformation based on field measurements, which would cover the whole pathway from the Gotland Basin to the Northern Baltic Proper and the Gulf of Finland, are missing. The Northern Baltic Proper and the Gulf of Finland are considered as dynamically active regions where wind forcing is an important factor also in the deep layer dynamics. In the Gulf of Finland south-westerly wind forcing causes the reversal of estuarine circulation: surface layer flows into the gulf and deep layer out of the gulf (Elken et al., 2003). In winter (no thermal stratification), the mixing of the whole water column was accompanied by improved oxygen conditions and decreased salinity in the deep layers (Liblik et al., 2013; Lips et al., 2017). Elken et al. (2006) showed that the impact of estuarine circulation reversal extended to the Northern Baltic Proper. Northeasterly and northerly winds support estuarine circulation resulting in transport of saline, hypoxic, and phosphate-rich water from the Northern Baltic Proper to the Gulf of Finland deep layer (Liblik and Lips, 2011; Lips et al., 2017). Thus, the variable wind forcing causes large temporal variations in the deep layer water properties in the Northern Baltic Proper and the Gulf of Finland (Lehtoranta et al., 2017).
The main aim of the present work was to analyze the impact of the recent MBIs in the Northern Baltic Proper and the Gulf of Finland in 2014–2017. The following three main questions were addressed in this study: (1) If and how fast the effect of MBIs can be seen in the pathway from the Gotland Deep to the Gulf of Finland? What is the quantitative impact on heat, salt, and oxygen content in the study area? How and in which layers the signal propagates toward northeast?
Data and Methods
The data analyzed in the present paper were collected in the frame of various national monitoring programs and projects by four institutions: Department of Marine Systems at Tallinn University of Technology in Estonia, Leibniz Institute for Baltic Sea Research in Germany, Swedish Meteorological and Hydrological Institute, and Finnish Meteorological Institute. Available data from research vessel cruises and moored vertical profilers (e.g., Lips et al., 2016) were used. In addition, HELCOM (Helsinki Commission) data (http://ocean.ices.dk/helcom, 31 January 2018) and historical data collected in the Department of Marine Systems were used. CTD (Conductivity, Temperature, Depth) probes with attached oxygen sensor were used to derive Conservative Temperature, Absolute Salinity (Ioc Scor Iapso, 2010) and oxygen profiles. Sensors were regularly calibrated by manufacturers; salinity and oxygen data were also calibrated against water sample analyses. Field measurements and data processing were in accordance with HELCOM Monitoring Manual (http://www.helcom.fi/action-areas/monitoring-and-assessment/manuals-and-guidelines/salinity-and-temperature/; Manual for Marine Monitoring in the COMBINE Programme of HELCOM, 2017). After processing, data were stored as vertical profiles with a step of 1 db. Density is given as potential density anomaly to a reference pressure of 0 db (σ0; kg m−3).
Vertical sections of monthly mean temperature, salinity, density, and oxygen along the pathway from the Gotland Deep to the Gulf of Finland were calculated using all available profiles for that month from the area marked with the black dashed line (Figure 1A). First, all vertical profiles were virtually crosswise placed to the section. Secondly, the distance of profiles from the Gotland Deep (0 km) was calculated. Next, monthly mean profiles were calculated for the horizontal grid of 5 km by averaging measured profiles within 5-km cells and filling empty cells by linear interpolation. Half-year average sections were calculated from the monthly mean fields, and half-year changes were estimated. Also, the half-year mean temperature and salinity in the water column below 80 m depth for the entire section (Figure 1A) were calculated. The monthly mean time-series of temperature, salinity, density, and oxygen concentration were calculated for the following six areas: Gotland Deep, Fårö Deep, Northern Deep, Kõpu West, Osmussaar, and Keri (orange boxes, Figure 1A) using all profiles from the particular box and month.
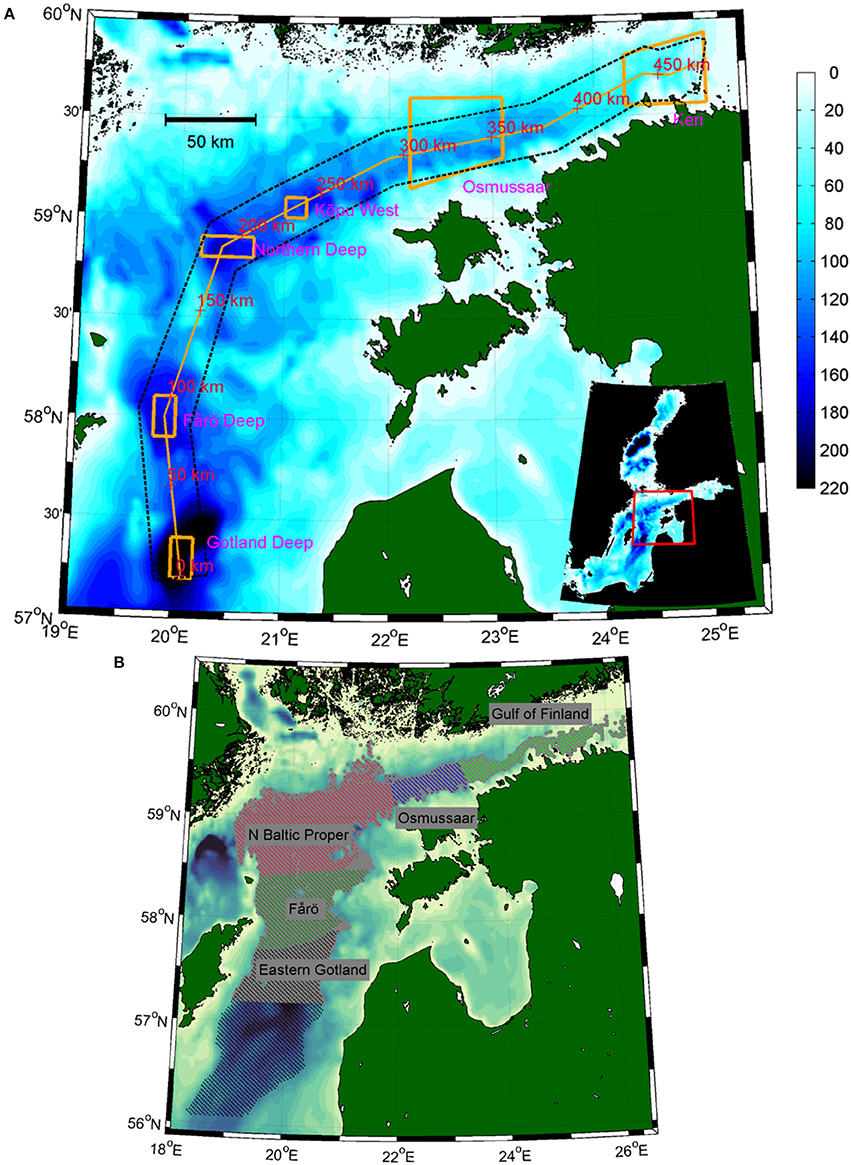
Figure 1. (A) Map of the study area in the Baltic Sea (inlay). Orange line maps the pathway under investigation from the Gotland Deep to the Gulf of Finland. Black dashed lines determine the extent of cross-sections wherefrom data were collected for calculation of monthly mean parameters along the pathway. Orange boxes mark time-series areas Gotland Deep, Fårö Deep, Northern Deep, Kõpu West, Osmussaar, and Keri. Red numbers show the distance from the Gotland Deep along the pathway. (B) Map of the basins defined for quantification of the impact of MBIs in the water column below 80 m depth. Gray area marks the basin from the Gotland Deep to the central Gulf of Finland. Following sub-basins are defined: Eastern Gotland Basin, Fårö Basin, Northern Baltic Proper, Osmussaar area, and Gulf of Finland.
To estimate the total half-year mean heat content (relative to 0°C) and salt mass of the deep area (gray area, Figure 1B) in the water column below 80 m depth, the half-year mean profiles were extrapolated perpendicular to the section over this area using the bathymetry data with the grid step of 1.5 km (Baltic Sea Hydrographic Commission, 2013). Deeper cells on the perpendicular sections, compared to the depth at the corresponding point of the section, were filled by extrapolation. Total heat and salt content were obtained by integrating over the extrapolated area. The changes of heat content and salt mass in relation to the heat content and salt mass in January–June 2014 were calculated. Similarly, the half-year mean content of heat, salt and oxygen in the water column below 80 m depth were estimated for the following five areas: Eastern Gotland Basin, Fårö Deep, Kõpu West, Osmussaar, and Keri (Figure 1B). The changes of the heat, salt and oxygen content in relation to the corresponding values in January–June 2014 were calculated.
There are various hypoxia thresholds across marine benthic organisms (Vaquer-Sunyer and Duarte, 2008). In this study, hypoxia was defined as oxygen concentration <2.9 mg l−1 and hypoxic depth as the shallowest depth of a profile, where oxygen is <2.9 mg l−1. Anoxia is defined as oxygen concentration <0.3 mg l−1. Since there were small offsets in various CTD probes, oxygen values <0.3 mg l−1 were replaced by <0.0 mg l−1 when calculating oxygen content.
For correlation analysis gaps in the measured time-series were filled using linear interpolation.
Results
Deep Layer Temperature, Salinity, Density, and Oxygen Distributions Along the Pathway Eastern Gotland Basin–Gulf of Finland
The thermohaline structure in the Gotland Deep at the beginning of the study period in February–March 2014 was characterized by 60–65 m thick mixed layer and the near-bottom water (at 230 m depth) with temperature, salinity, and potential density anomaly of 6.7°C, 12.2 g kg−1, and 9.5 kg m−3, respectively (Figures 2a,b, 3a). The increase of temperature, salinity and density was continuous from the base of the mixed layer down to the near-bottom layer whereas the sharpest part of the halocline was at the depth range of 70–100 m. It is noteworthy that the halocline, which started at 70 m depth in the most of the section, was found 10 m shallower in the Gulf of Finland. The border of the hypoxic layer (the depth where oxygen falls below 2.9 mg l−1) was located close to 80 m depth in the most of the study area while it was shallower in the easternmost part of the section (Figure 3b).
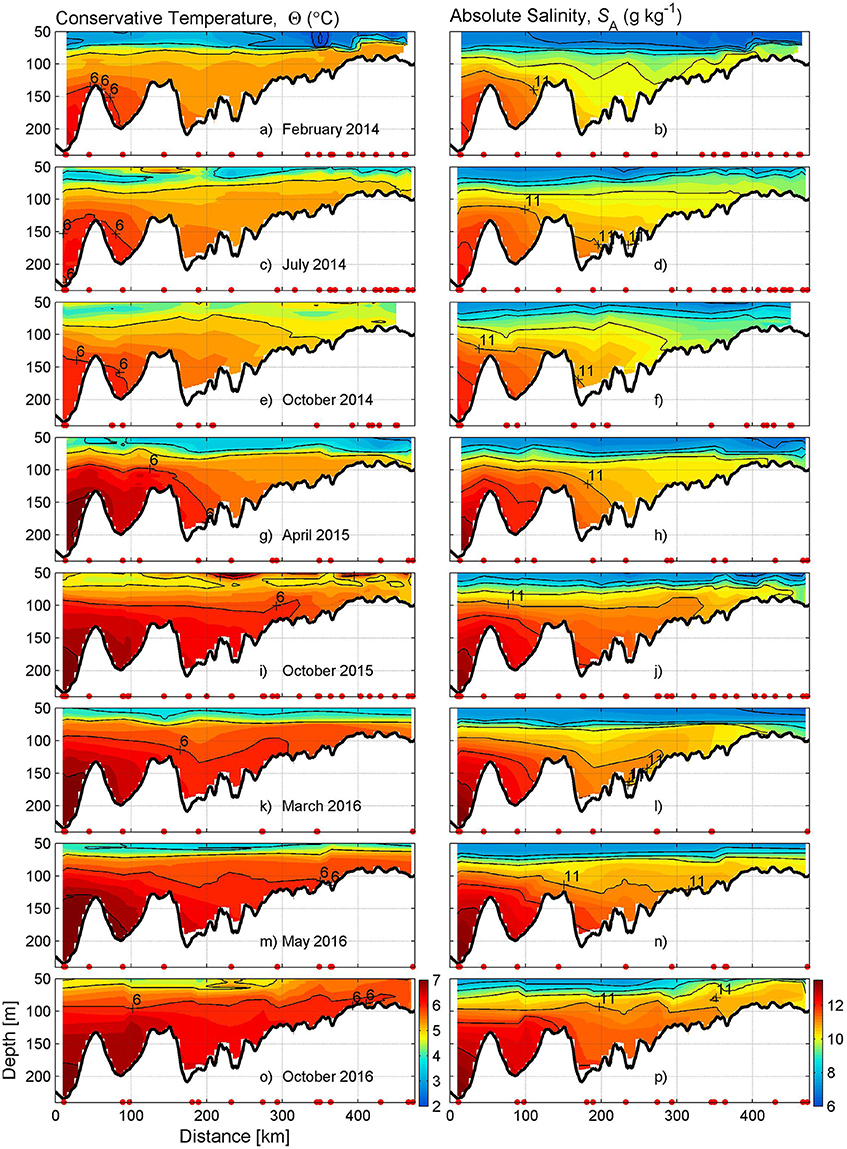
Figure 2. Vertical sections of monthly mean temperature and salinity along the pathway from the Gotland Deep to the Gulf of Finland (see Figure 1A) in February 2014 (a, b), July 2014 (c,d), October 2014 (e, f), April 2015 (g, h), October 2015 (i, j), March 2016 (k, l). May 2016 (m, n), October 2016 (o, p). Red dots on x-axis represent the locations of the CTD stations used. Black solid isolines are shown by 1°C and 1 g kg−1 step.
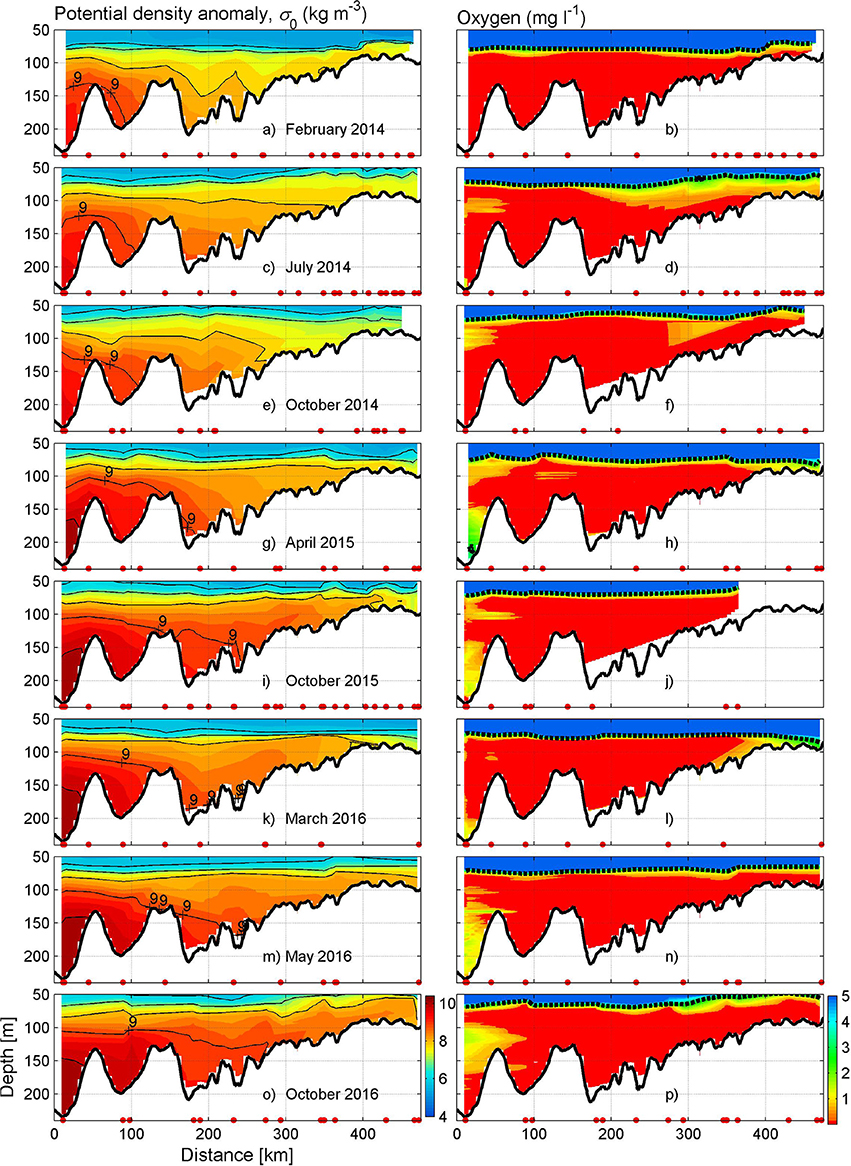
Figure 3. Vertical sections of monthly mean density and oxygen along the pathway from the Gotland Deep to the Gulf of Finland (see Figure 1A) in February 2014 (a, b), July 2014 (c,d), October 2014 (e, f), April 2015 (g, h), October 2015 (i, j), March 2016 (k, l), May 2016 (m, n), October 2016 (o, p). Red dots on x-axis represent the locations of the CTD stations used. Black solid isolines are shown on density plots by 1 kg m−3 step. Black dashed line (right panels) marks the dissolved oxygen concentration of 2.9 mg l−1 (threshold concentration for hypoxia).
The slightly saltier (12.3 g kg−1) and colder (5.9°C) and therefore denser (9.6 kg m−3) water propagated into the bottom layer of the Gotland Deep by July 2014 (Figures 2a,b, 3a). The changes were likely initiated by weak inflows in from the North Sea in winter 2013/2014 (Naumann et al., submitted). This new water contained also small amounts of oxygen; temporary oxygen concentrations up to 1.6 mg l−1 were measured within the near-bottom layer of about 20 m thickness (Figure 5b). The isopycnal 9.5 kg m−3 was observed 40 m higher, at 200 m depth (Figure 5a, gray dashed line). The propagation of new water mass caused the increase of salinity and density in the Fårö Deep (Figures 3c, 4c), Northern Deep and onwards along the section (Figures 2d, 3c). The hypoxic depth located around 70–75 m depth in the Gotland Deep and Fårö Deep area and shallowed starting from the Northern Deep to 65–70 m depth in the Gulf of Finland by July 2014 (Figure 3d).
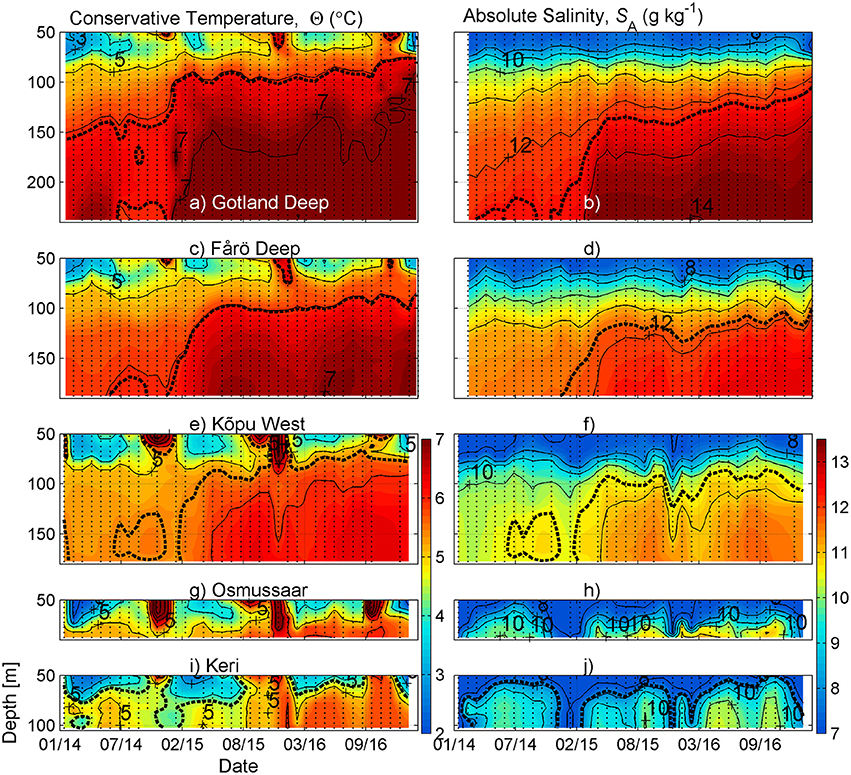
Figure 4. Time-series of monthly mean temperature and salinity in the Gotland Deep (a, b), Fårö Deep (c, d), Kõpu West (e, f), Osmussaar (g, h) and Keri area (i, j) from January 2014 to March 2017. Black solid isolines are shown by 1°C and 1 g kg−1 step. Black dashed lines show the near-bottom water temperature and salinity before the water of MBI in December 2014 arrived to the Gotland Deep. Vertical dashed lines represent the months with available data.
In the Gotland Deep and Fårö Deep, salinity slowly increased, but in the Northern Deep and farther along the section, slightly decreased from July to October 2014 (Figure 2f). The near-bottom water in the Gotland Deep and Fårö Deep became slightly warmer and saltier by 15 February 2015 (Figures 2a–d, 4c,d) while in the north-eastern Baltic Proper (Kõpu West) and Gulf of Finland (Keri) temporal course was more variable (Figures 2a–h, 4g–j). The small amount of oxygen that was observed in the Gotland Deep in July had disappeared by August 2014.
The arrival of December 2014 inflow water into the Gotland Deep in April 2015 caused a considerable increase of temperature (from 6.1 to 7.1°C), salinity (from 12.5 to 13.6 g kg−1), and density (from 9.6 to 10.6 kg m−3) and upward shift of isolines (Figures 4a,b, 5a). High oxygen concentrations (up to 3.8 mg l−1) were observed in the layer from bottom to 140 m depth (Figure 5b). Note that before the oxygenated water intruded, the warmer (7.5°C) water with a very low oxygen concentration was observed in the Gotland Deep in early 2015 (cf. Figures 4a, 5a). Likely, this water was the old anoxic Bornholm basin water. Saltier, warmer, and denser water was also observed in the Fårö Deep and Kõpu West. Note that the increase of these parameters in the Fårö Deep and Kõpu West was much smoother and with a delay compared to the Gotland Deep (Figure 6). The increase of temperature, salinity and density along the pathway from Kõpu West to the Gulf of Finland was observed in April and October 2015 (Figures 2g–j, 3i). There was no improvement in oxygen conditions in other basins than the Gotland Deep. Oxygen concentrations dropped close to zero in the near-bottom layer of the Gotland Deep already in September 2015 while in the depth range 170–220 m, relatively high concentrations (>1 mg l−1) remained by the end of 2015.
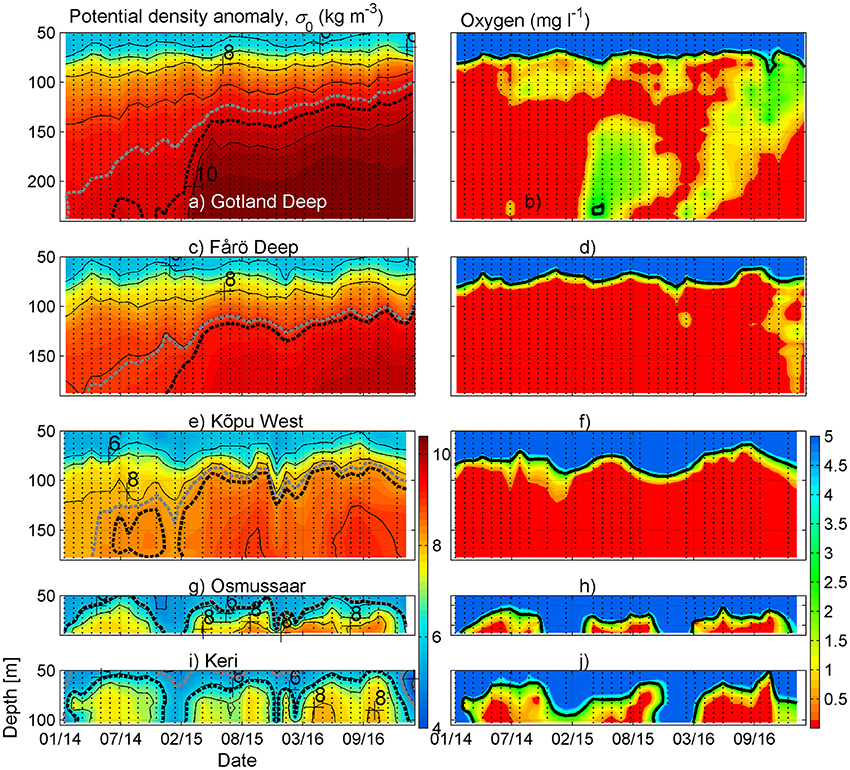
Figure 5. Time-series of monthly mean density and oxygen in the Gotland Deep (a, b), Fårö Deep (c, d), Kõpu West (e, f), Osmussaar (g, h) and Keri area (i, j) from January 2014 to March 2017. Black dashed lines (left panels) show the near-bottom water density before the water of MBI in December 2014 arrived to the Gotland Deep. Gray dashed lines show density in the beginning of our study period (February 2014). Black solid isolines are shown on density plots by 1 kg m−3 step. A black bold line (right panels) marks the dissolved oxygen concentration of 2.9 mg l−1 (threshold concentration for hypoxia). Vertical dashed lines represent the months with available data.
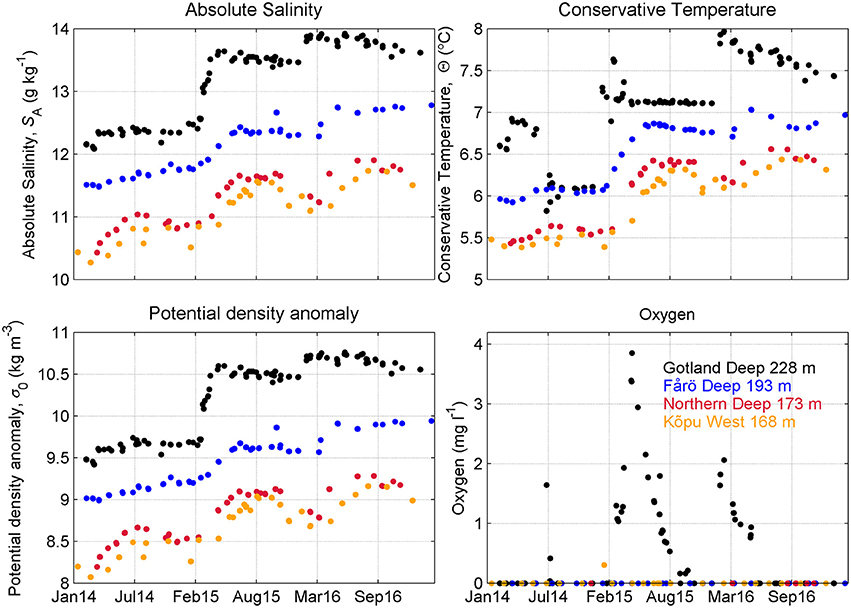
Figure 6. Time series of temperature, salinity, potential density anomaly and oxygen concentration in the near-bottom layers of the Gotland Deep, Fårö Deep, Northern Deep and Kõpu West. The daily mean was calculated when there was more than one CTD cast. The depths was chosen according to the amount of available data. It means, in some cases occasional deeper measurements might show slightly higher values. For example, the highest salinity during the study period, 14.1 g kg−1 was observed in the Gotland Deep at 235 m depth on 16 February 2016.
Two moderate MBIs occurred in November 2015 and January–February 2016 (Naumann et al., submitted). The arrival of saltier and denser water into the Gotland Deep near-bottom layer can be seen in the next two snapshots in March and May 2016 (Figures 2l,n, 3k,m) when salinity increased up to 14.1 g kg−1. In the Northern Deep and farther along the pathway, first salinity decreased in the deep layer while temperature increased along the whole section (Figures 2k,l). By May 2016, an increase in deep layer temperature and salinity was observed along the whole pathway (Figures 2m,n). The Gotland Deep was occupied by oxygenated water from bottom to 130–140 m depth while the Fårö Deep had received some denser water with very low oxygen concentration (Figures 3c,n). Oxygen concentration in the near-bottom layer of the Gotland Deep reached to about 2 mg l−1. Last snapshot in October 2016 showed the lack of oxygen again in the depth range of 170–240 m in the Gotland Deep while within the layer above (up to 90 m depth) low oxygen concentrations were detected (Figure 3p). No oxygen was observed in the deep basins toward the north from Gotland Deep. A remarkably thick hypoxic layer with the upper border at 50–55 m depth was found in the Gulf of Finland in October 2016 (Figure 4h).
Several pulses of increased oxygen concentration were observed in the depth range of 80–120 m in the Gotland Deep likely caused by transport of oxygen from the SW Baltic (Figure 5b). Due to the lower density of these waters, they spread above the denser deeper layers. A relatively thick oxygenated layer was observed down to 160–170 m depth in the Gotland Deep from summer to winter 2016 (Figure 5b). Unlike to the previous mid-layer oxygen pulses in the Gotland Deep, the sign of the lateral oxygen transport was observed in autumn 2016/17 also in the Fårö Deep (Figure 5d). Oxygen was also observed in the lower layers of the Fårö Deep in February 2017 (Figure 5d).
Note that the temporal variability of temperature, salinity and density in the deep layers of Kõpu West and particularly in the Osmussaar and Keri area was high and likely influenced by MBI events and estuarine circulation reversals forced by local wind (Figures 2a–p, 3a–p, 4e,g,i). Despite high variability, the Gulf of Finland deep layer has been warmer and saltier in the second half of the study period. Gulf of Finland deep layer remained hypoxic most of the time (Figure 5j). Only occasional estuarine circulation reversal events during winters (e.g., two events in winter 2013/14, see Lips et al., 2017) temporarily (1–1.5 month) improved oxygen conditions there.
Progress of Sub-Halocline Advection Along the Section
In order to assess propagation and transformation of the MBI water, we evaluated the changes in water characteristics at sills and deep basins: Gotland Deep, Fårö Deep, Northern Deep, Kõpu West, and Kõpu North. We assume that if there is a change to saltier and denser water in the deep basin, this water has to come over the previous sill along the pathway from south to north. As temporal data coverage at sills is sparse, we compare the monthly average values in the deepest part of a basin with the monthly average values from the preceding deep basin at the sill depth. For example, we compare the deepest available measurements (at 192.5 m) in the Fårö Deep with the data in the Gotland Deep at 137.5 m depth, which is the sill depth between the Gotland Deep and the Fårö Deep. If there is a correlation between the two time-series, one can expect lateral water renewal in the near bottom layer of the basin.
Baltic Proper
Salinity and temperature time-series follow each other closely (correlation coefficient r = 0.98 for salinity and r = 0.94 for temperature; p < 0.01) in the Fårö Deep at 192.5 m and the Gotland Deep at 137.5 m depth, the latter corresponding to the sill depth between the Gotland Deep and the Fårö Deep (Figures 7a,b). A smooth increase in temperature and salinity and associated 20 m uplift of the halocline was observed from February 2014 to February 2015. In spring 2015, a rapid increase in temperature and salinity occurred due to the uplift of old Gotland Deep near-bottom water caused by the arrival of December 2014 MBI water into the near bottom layer. One can note that the TS-characteristics of the near-bottom waters in the Gotland Deep and the Fårö Deep coincided with a time lag of more than 1 year (Figure 8), i.e., the early 2014 Gotland Deep near-bottom water reached the Fårö Deep in May–June 2015 as an effect of the December 2014 MBI. Interestingly, there is no signature of the summer 2014 cold Gotland Deep near-bottom water in the Fårö Deep. The Fårö Deep near-bottom layer received even more saline water in April–May 2016. It coincides with the arrival of the next MBI water (November 2015 and January–February 2016) to the Gotland Deep. Thus, another uplift of isopycnals in the Gotland Deep caused an overflow of denser water to the Fårö Deep. Water, which arrived to the near-bottom layer of the Fårö Deep in spring 2016 was saltier and denser than the Gotland Deep near-bottom water before the MBI in December 2014. This means that since spring 2016 the near-bottom layer of the Fårö Deep also consisted of water that originated from the MBIs (or the Bornholm Basin). The TS-diagram suggests that since spring 2016, the Fårö Deep water contained about 2/3 of the early 2014 Gotland Deep water and 1/3 of the December 2014 MBI water. The December 2014 MBI water in the Gotland Basin was already depleted of oxygen by the end of 2016 (Figure 5b). Therefore, no oxygen import into the near-bottom layer of the Fårö Deep was observed.
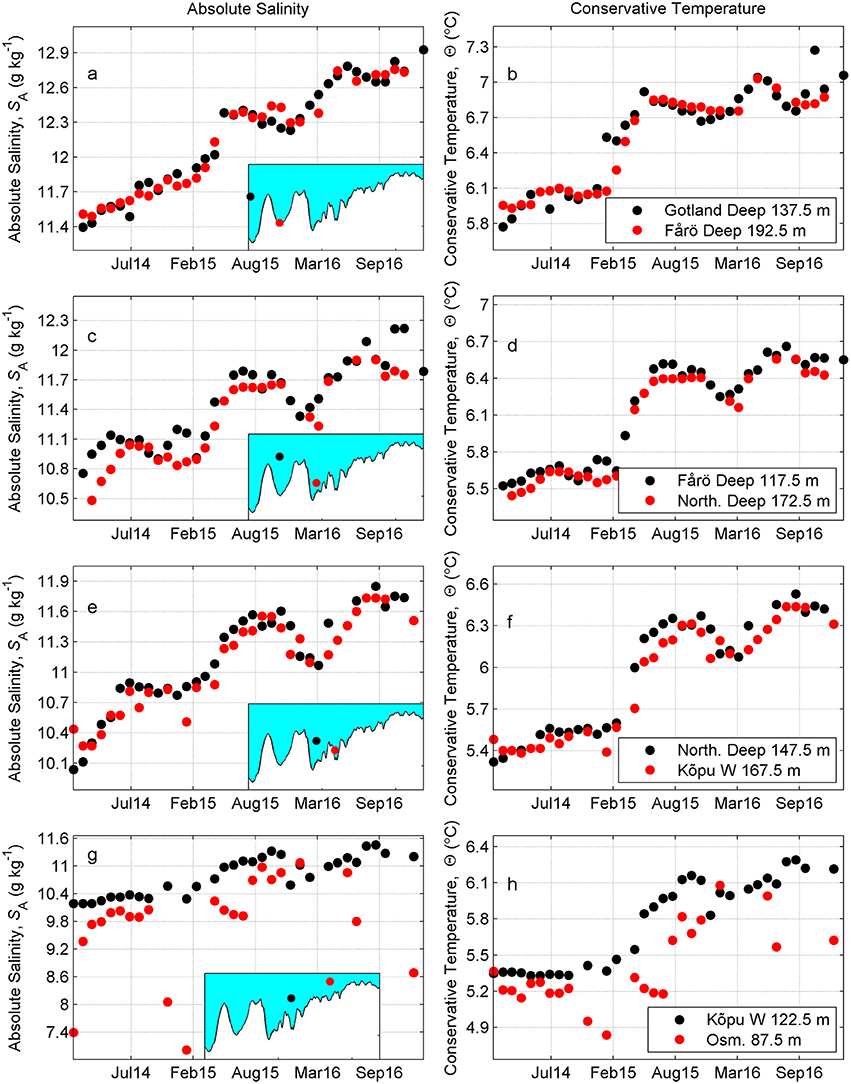
Figure 7. Temporal course of monthly averaged salinity and temperature at the selected depths along pathway in the Gotland Deep (a, b), Fårö Deep (a-d), Northern Deep (c-f), Kõpu West (e-h), and Osmussaar (g,h).
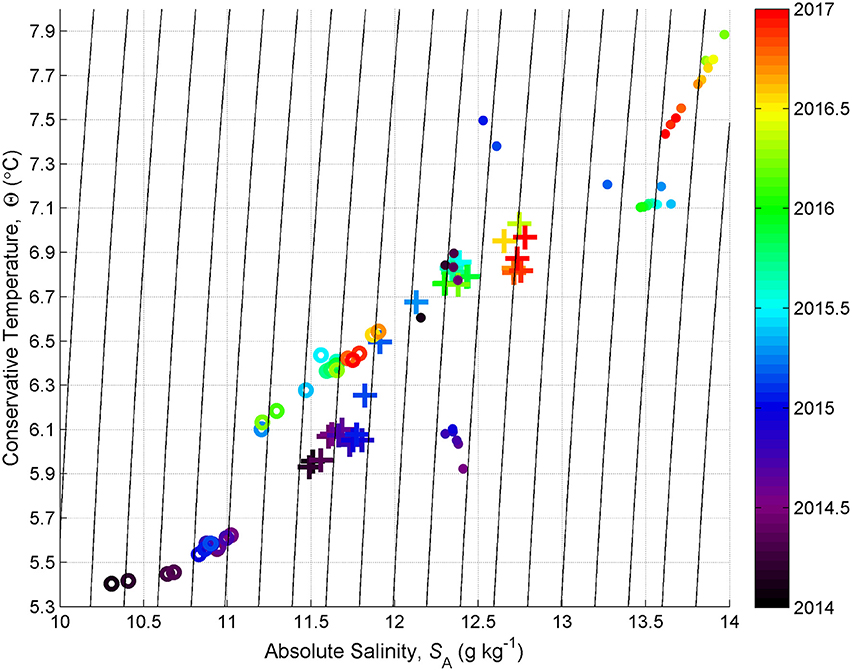
Figure 8. Temporal development of near-bottom temperature-salinity in the Gotland Deep (filled circles), Fårö Deep (crosses), and Northern Deep (circles). Color scale represents time (years).
Next, we compare salinity and temperature time series of the Northern Deep at 172.5 m and Fårö Deep at 117.5 m depth, which is the sill depth between these basins (Figures 7c,d). Despite the relatively long distance between the locations (100 km), concurrence is good (r = 0.93 for salinity and r = 0.99 for temperature; p < 0.01). Two salinity and temperature increase events in early summer 2015 and spring/summer 2016, likely as reactions to MBIs, can be detected. Also, one can see an increase in salinity from the beginning of 2014 until July 2014, likely related to the slow upward movement of the halocline in the Fårö Deep. The uplift was only 10 m during half a year, but due to the strong vertical salinity gradient at the sill depth, it was enough to increase salinity by 0.5 g kg−1 in the deep layers of the Northern Deep.
Water in the Northern Deep was already slightly saltier and clearly warmer in June 2015 than in the Fårö Deep before December 2014 MBI (Figures 7c,d). Thus, the water in the Northern Deep in June 2015 could not be purely uplifted old Fårö Deep water transported over the sill. Moreover, the CTD profiles collected prior to the MBIs showed that such water, which together with the Fårö Deep water could form the Northern Deep near-bottom layer water in June 2015, could not be found in the study area. Water with similar properties appeared in the Gotland Deep at 110–120 m depth in January 2015 and the Fårö Deep at the same depth range (110–120 m) in April–May 2015. The inspection of TS-diagrams (Figure 8) suggests that, at first, Fårö Deep was filled with the early 2014 Gotland Deep water. Later the new water with slightly lower density spread over the old denser water, i.e., it did not pass the deepest layers of the Fårö Deep, and reached the deep layers of the Northern Deep. Next increase in salinity and temperature in the near-bottom layer of the Northern Deep occurred from April to July 2016 (Figure 7). The salinity and temperature of this water mass were 11.7–11.9 g kg−1 and 6.4–6.6°C, respectively; and therefore, it was lighter than the near-bottom water in the Fårö Deep since June 2015. Thus, also the water that arrived in the Northern Deep in April–July 2016 did not spread along the bottom, but was buoyant, when passed the Fårö Basin.
Further along the transect Kõpu West is located in the small trench and is separated from the Northern Deep with the sill of 145–150 m depth. The three events of salinity increase, well correlated (r = 0.94 p < 0.01) with the course of salinity in the Northern Deep at sill depth were observed in the near-bottom layer of Kõpu West (Figure 7). Similarly to the Northern Deep, a salinity increase was observed in the near-bottom layer of Kõpu West during the first half of 2014. The next salinity increase occurred from the middle of February until the middle of August 2015, and the third increase started in March 2016 after a temporary salinity decrease by 0.5 g kg−1. Likewise temperature was well-correlated between 145 and 150 m layer at Northern Deep and Kõpu West (r = 0.97, p < 0.01). At Osmussaar, the near-bottom salinity generally followed the course of salinity in Kõpu West. However occasionally lower temperatures and salinities can be observed as well, which is likely impact of estuarine circulation reversals in the Gulf of Finland. Latter events reduced the correlation between two time-series (r = 0.51 for salinity and r = 0.76 for temperature; p < 0.05).
Gulf of Finland
Temperature and salinity in the deep layers of the Gulf of Finland had greater variability at monthly to seasonal scale compared to the Northern Baltic Proper. Temperature and salinity in the halocline and deep layer in the Keri area did not exceed 5.3°C and 9.9 g kg−1, respectively, from January 2014 to early August 2015 (Figures 4g,i,j). Since the end of August 2015 to mid-September 2015, salinities up to 10.2 g kg−1 were observed. Two periods of high salinity (>10 g kg−1) in the near-bottom layer were observed in the Keri area in 2016. In April–May, salinity peaked close to 10.4 g kg−1 at the beginning of April and at 10.5 g kg−1 in mid-May. At the end of October, salinity reached to 10.77 g kg−1.
There was an accompanying shift to warmer halocline along with the increase in salinity in the deep layer in 2015–2016. The same shift of TS-characteristics in the halocline can be seen in the whole study area (Figure 9). Unlike to the Keri area, one can see that the new warm and saltier bottom water appeared first beneath the old colder and fresher near-bottom water in Kõpu West. In monthly average bottom temperature and salinity time series, the penetration of the new water can be seen from June to October 2015 as an increase in temperature and salinity in the near-bottom layer at Kõpu West (Figures 7, 9). The old bottom water was raised up to the depth of 80–90 m (Figures 4e,f, 5e,f) and thus this water was available for penetration to the Gulf of Finland. TS-diagram reveals that the old near-bottom water signature remains at Kõpu West until autumn 2015. Note that the shift to a slightly saltier near-bottom water at Keri area occurred within the same time frame (August 2015). Likely the observed increase in salinity and the uplift of the halocline in the central Gulf of Finland was caused by spreading of the old near-bottom water from the Kõpu West area. This is well-supported by the comparison of TS-diagrams of the two areas—the old Kõpu West water can be the source of the near-bottom water observed at Keri in August 2015 (Figure 9). As conclusion, the 2014 December MBI indirectly impacted the Gulf of Finland deep layer waters already 9 months after the MBI occurred. The mean signal propagation speed from entrance of the Baltic to the entrance of the Gulf of Finland would be in the order of 3–5 cm s−1.
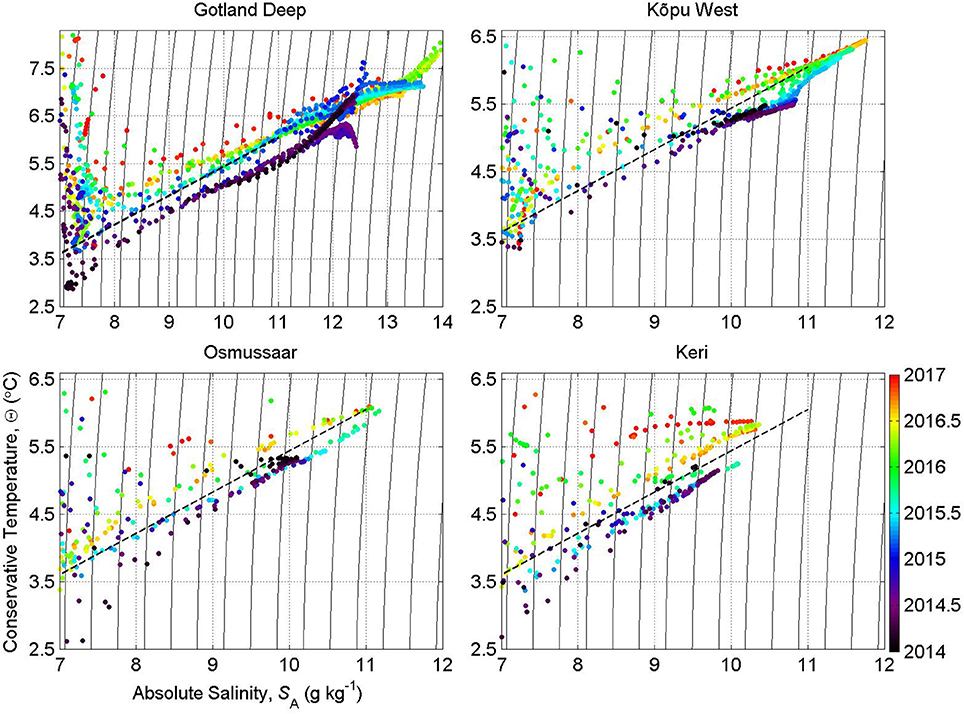
Figure 9. Temporal development of temperature-salinity in the Gotland Deep, Kõpu West, Osmussaar, and Gulf of Finland (Keri). Color scale represents years. Black dashed line was added to make data in subplots better comparable. Note that limits of y-axis are different for the Gotland Deep subplot and rest of the time-series.
In December 2016 very low stratification was observed (Figure 5) in the Gulf of Finland indicating the estuarine circulation reversal. The shift to warmer halocline had occurred in January and in spring 2016 high salinities were observed in the deep layer of the gulf. The old waters with their TS-characteristics at Keri and Kõpu West in 2014 (see dots concentrated along the lower line in TS-diagram, Figure 9) were not observed there after November 2015. Thus, we can suggest that the waters in the deep layer and halocline of the Gulf of Finland were pushed eastward and/or mixed with waters above.
Quantification of MBI Impact
In order to quantify changes in the thermohaline structure, we calculated differences in temperature and salinity along the section below 50 m depth with the 6-month time-span (Figure 10). The mean thermohaline fields in January–June 2014 were defined as the initial state. Changes of temperature and salinity in the section were extrapolated across the section to adjacent areas. In this way total changes in heat and salt in the area from Gotland Deep to the Gulf of Finland (gray background area in Figure 1B) below 80 m depth were estimated.
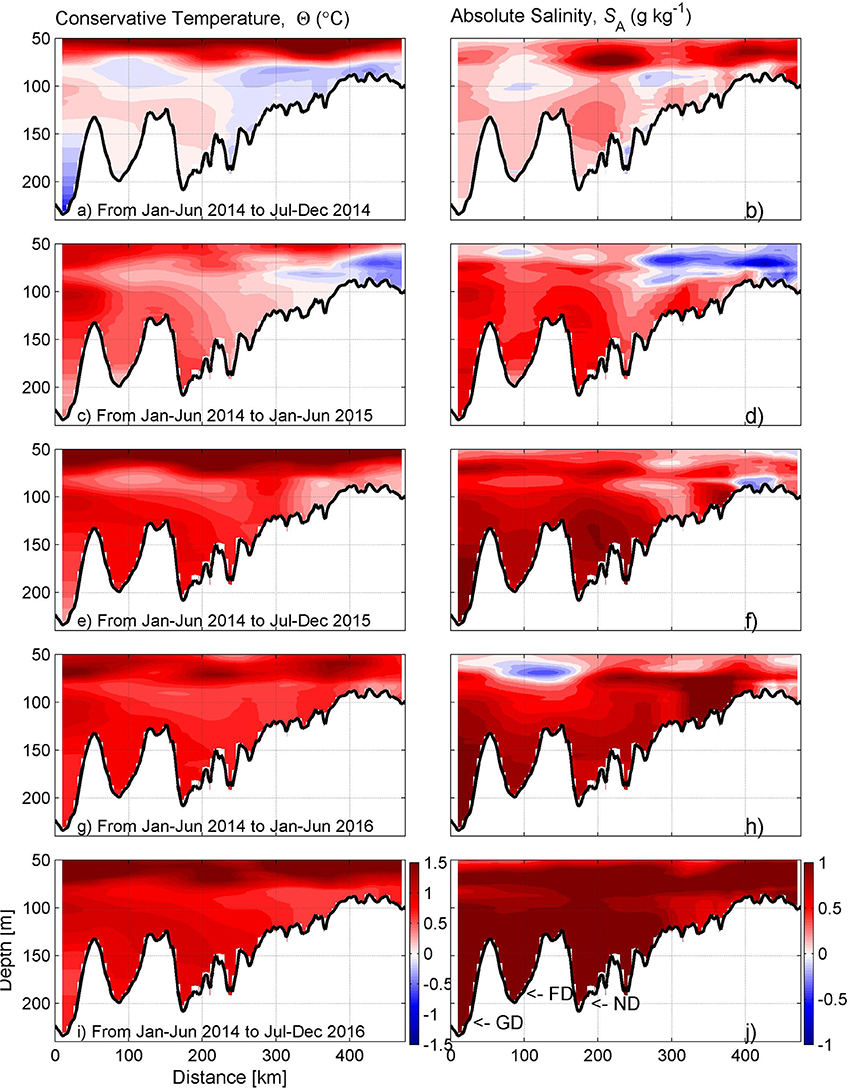
Figure 10. Vertical sections of half-year averaged temperature and salinity changes relative to the mean fields in the period January-June 2014 along the pathway from Gotland Deep to the Gulf of Finland in July-December 2014 (a, b), January-June 2015 (c, d), July-December 2015 (e, f), January-June 2016 (g, h), July-December 2016 (i, j). Locations of the Gotland Deep (GD), Fårö Deep (FD), and Northern Deep (ND) are shown in the lowermost right panel.
To quantify the impact of MBIs on the physical parameters and oxygen content in the water column below 80 m depth on basin scales, half-year changes were calculated for the whole area north from the Gotland Deep and the following sub-basins: Eastern Gotland Basin, Fårö Basin, Northern Baltic Proper, Osmussaar area, and Gulf of Finland (Figure 1B).
Rather small salinity changes were observed in the deep layer of the section from January–June to July–December 2014 (Figure 10). Strongest temperature decrease occurred in the Gotland Deep due to the arrival of denser and colder water to the bottom layer in July 2014. Increase in temperature and salinity was observed at 50–75 m depth due to the uplift of halocline. Warmer and saltier water was observed in the southern half of the section in January–June 2015. This was caused by the December 2014 MBI, concurrent uplift of isolines, and arrival of warm waters to mid-layer. Contrary, colder, and less saline deep layer was observed on the northern side of the section as a result of deeper halocline. The next half-year steps show a clear increasing tendency both in temperature and salinity. Thus, the difference in temperature and salinity between initial state (January–June 2014) to July–December 2016 show clearly higher values of salinity and temperature in the whole section.
The overall temperature and salinity increase in the area below 80 m depth from January–June 2014 to July–December 2016 was in the order of 1°C and 1 g kg−1, respectively. This corresponds to the increase of 3.7 × 10¹⁸ J in heat and 1.06 × 10⁹ t in salt content in the whole area (Table A1 in Appendix). The largest increase occurred in the period January–June 2015.
Heat and salt content in the Eastern Gotland Basin, Fårö Deep, and Northern Baltic Proper gradually increased in the layer below 80 m depth during 2014–2016 while the largest increase was in the Eastern Gotland Basin (Table 1). The heat content increase per unit volume was 4.25 × 10¹⁵ J km−3 in the Eastern Gotland Basin, 3.81 × 10¹⁵ J km−3 in the Fårö Deep, 3.29 × 10¹⁵ J km−3 in the Northern Baltic Proper, and 1.81 1015 J km−3 in the Osmussaar area by the end of study period. The salt content increase per unit volume was 11.44 × 10⁵, 10.22 × 10⁵, 10.50 × 10⁵ t km−3, and 5.75 × 10⁵ t km−3, respectively. It is noteworthy that contribution of >130 m layer to the total change from 80 m to bottom in the Eastern Gotland Basin, Fårö Deep, and Northern Baltic Proper were 18–24% for heat and 21–32% for salt. This share is roughly in accordance with the hypsographic curve of the area, which means that the increase in salinity and temperature was vertically rather even (Figure 10). By the end of study period, heat content increased up to 2.38 × 10¹⁵ J km−3 and salt content up to 5.81 × 10⁵ t km−3 in the Gulf of Finland.
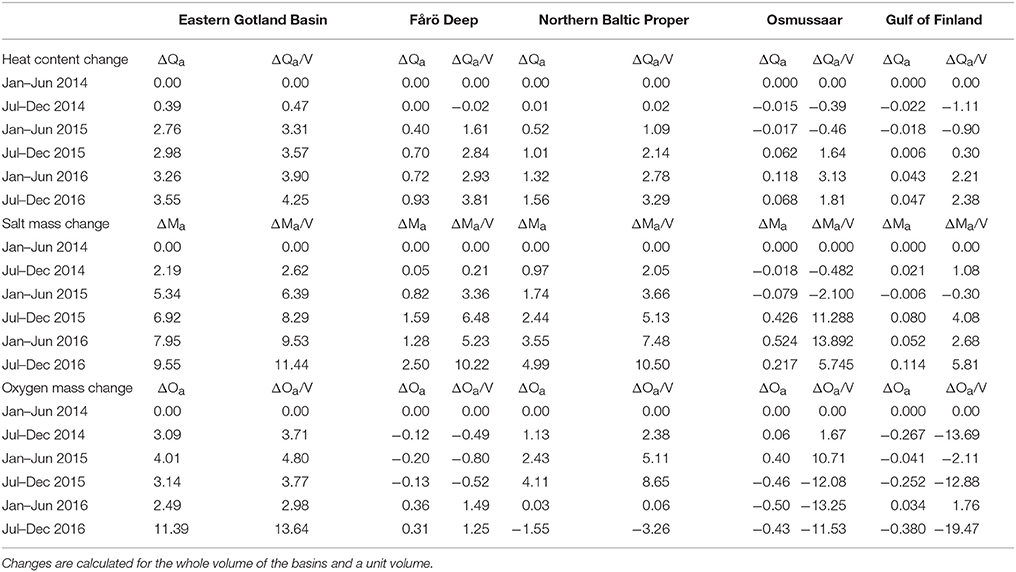
Table 1. Changes in heat content (ΔQa, 1018 J), heat content per volume (ΔQa/V, 1015 J km−3), salt mass (ΔMa, 108 t), salt mass per volume (ΔMa/V, 105 t km−3), oxygen content (ΔOa 105 t), and oxygen content per volume (ΔOa/V 102 t km−3) in the water column below 80 m depth in the Eastern Gotland Basin, Fårö Deep, Northern Baltic Proper, Osmussaar area, and Gulf of Finland area (Figure 1B) in relation to the heat content, salt mass, and oxygen content in January–June 2014.
Changes in the oxygen content, compared to January–June 2014 were different in the five basins (Table 1). The Eastern Gotland Basin experienced an increase (although variable) in oxygen content compared to the reference state. Note that the highest increase of oxygen content (11.39 × 10⁵ t) was found for the last period, July–December 2016, when the deepest layer of the basin was already out of oxygen, but relatively high oxygen concentrations were detected in the depths range 80–160 m (Figure 5b). Changes were rather small and variable in the Fårö Deep. Oxygen content was less than the reference state until January–June 2016, and after that, a small increase was observed. In the Northern Baltic Proper, an increase of oxygen mass was estimated until July–December 2015 due to deeper than 80 m oxycline. However, in the layer from 130 m depth to bottom, no significant increase in oxygen content was detected in the Northern Baltic Proper and Fårö Deep. In the Osmussaar area the lower oxygen values were observed in the second half of the study period. In the Gulf of Finland, there is a clear tendency whereby clearly lower oxygen values occur in the deep layer in the second half of the season. The lowest content, −19.47 × 10⁵ t km−3 from the initial state, were found in July–December 2016.
Discussion
An international measurement campaign was conducted to capture the impact of the recent MBIs and signal propagation from the Gotland Deep toward the Gulf of Finland. The water column from the bottom to the halocline in the area from the Gotland Deep to the Gulf of Finland has become warmer and saltier in the order of 1°C and 1 g kg−1, respectively, after the recent MBI activity since December 2014.
Oxygen appeared in the deep layers of the Gotland Deep in spring 2015, and another pulse was registered in February 2016. Some oxygen intrusions probably arrived in the Gotland Deep before the MBIs, as H2S concentrations started to decrease there already in February 2015 (Holtermann et al., 2017). Oxygen disappeared from the near-bottom layer after 3–6 months due to high consumption. Several pulses of oxygen were observed in the sub-halocline layers of the Gotland Deep, particularly thick layer with relatively high oxygen levels down to 160 m depth was found there since summer 2016. Although this layer in the Gotland Deep feeds the deep layer of the Fårö Deep, only low amount of oxygen was detected in the Fårö Deep in February 2017. Oxygen content rather decreased in the Northern Baltic Proper and the Gulf of Finland during the study period 2014–2016 due to shallower halocline and hypoxic depth. Unusually high bottom layer salinities and thick hypoxic bottom layer were observed in the Gulf of Finland in 2016. This result is in line with the tendencies after the previous MBIs: stronger stratification and increased hypoxia were observed in the Northeastern Baltic Sea since the mid-1990s (Laine et al., 2007; Liblik and Lips, 2011; Lehtoranta et al., 2017). In the present study, we used only oxygen measurements for the estimates of changes in the oxygen content. The inclusion of H2S in further studies might reveal more details about the oxygen transport to the Northern Baltic Proper and the Gulf of Finland. A recent study (Kankaanpää and Virtasalo, 2017) shows that H2S distributions are variable and sensible for physical processes in the Gulf of Finland.
The two occasions of sudden salinity increase in the Gotland Deep in April 2015 (Holtermann et al., 2017) and in February 2016 (Figure 6) marked arrivals of the 2014 December (Mohrholz et al., 2015) and 2015 November (Naumann et al., submitted) MBI waters. Another, 2016 January–February MBI did not reach the near bottom layer of the Gotland Deep, as it was not dense enough to replace near-bottom waters from previous MBIs in the Gotland Deep.
The two main near-bottom layer renewal events were also registered in the further basins in the north (Figure 6). Salinity peaked at 13.60 g kg−1 during the first event and 14.11 g kg−1 during the second event in the near-bottom layer of the Gotland Deep. Salinity was last time that high in the Gotland Deep after the 1951 MBI (Fonselius and Valderrama, 2003), which is considered the strongest inflow event in the record from 1880 (Franck et al., 1987; Matthäus and Franck, 1992; Fischer and Matthäus, 1996; Mohrholz et al., 2015). The highest salinity values during the study period in the near bottom layer of the Fårö Deep (12.79 g kg−1), Northern Deep (11.92 g kg−1), and Northern Baltic Proper (Kõpu West, 11.77 g kg−1) were registered in May 2016, July 2016 and August 2016, respectively. That high salinity was last time observed in the Fårö Deep during the 1960s while in the Northern Deep and Kõpu West during the 1970s (Figure 11). Similar, only slightly lower salinity values were observed in the Northern Deep and Kõpu West during the mid-2000s. Salinity peaked in the Gulf of Finland at 10.77 g kg−1 in October 2016, which is the highest value in this area since 1974 (Alenius et al., 1998). The latest period with higher salinities (occasionally >10.5 g kg−1) was observed in the Gulf of Finland in 2006–2008. In conclusion, the highest salinity was observed in the deep layers from the Gotland Deep to the Gulf of Finland in 2016 since last 40–60 years. Exceptionally high salinities comparing to historical records were also observed in the southern basins of the Baltic as consequence of 2014 December MBI (Rak, 2016).
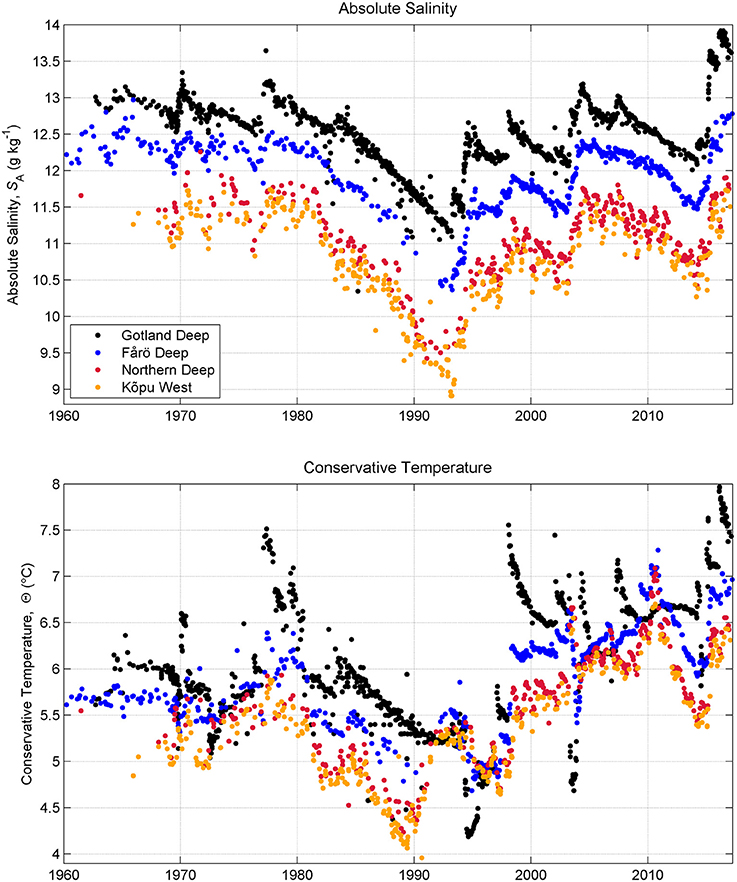
Figure 11. Time series of salinity and temperature in the Gotland Deep (228 m depth), Fårö Deep (193 m depth), Northern Deep (173 m), and Kõpu West (168 m) in 1960–2017. The daily mean was calculated when there was more than one CTD cast available. Note that the deepest bin was chosen at the depth, where enough measurements were available. It means, in some cases, occasional deeper measurements might show slightly higher values. For example, the highest salinity during the study period, 14.1 g kg−1, was observed in the Gotland Deep at 235 m depth on 16 February 2016.
The salinity decline rate in the deep layers of the Gotland Deep has been 1.5 g kg−1 during the stagnation period 1983–1993 (Reissmann et al., 2009), 0.6 g kg−1 from 1998 to 2002 and 0.7 g kg−1 from 2008 to 2014 (Figure 11). Therefore, the annual salinity decline in the deep layer of the Gotland Deep has been in the order of 0.12–0.15 g kg−1 y−1. Salinity in the near-bottom layer of the Gotland Deep was 13.6 g kg−1 at the beginning of 2017. Thus, one might expect that even if further MBIs do not follow, deep layer salinity will not decline back to the early 2014 level (12.2 g kg−1) before 2026–2029 and to pre-1993 MBI (Jakobsen, 1995) level (11.2 g kg−1) not before 2033–2037.
The long-term time-series of the deep layer salinity in the Fårö Deep, Northern Deep, and Kõpu West are generally in good accordance with the Gotland Deep time-series (Figure 11). The best correlation between Gotland Deep and Fårö Deep salinity (r = 0.94; p < 0.01) was found, when the time lag of 3 months was used for Fårö Deep time-series. The best correlation time lags for Northern Deep (r = 0.89; p < 0.01) and Kõpu West (r = 0.90; p < 0.01) in respect to Gotland Deep were 3 months and 4 months, respectively. This result is well in accordance with our observations in 2014–2017—salinity increased by a delay of 2–3 months in the Fårö Deep, 3–5 months in the Northern Deep, and 4–6 months in Kõpu West after salinity peaked in the Gotland Deep (Figure 6).
The signal in these time-series is more damped and variable, particularly in the Northern Deep and Kõpu West. Moreover, some discrepancies can be found between the Gotland Deep and the other three salinity time-series. Salinity decline during the stagnation periods, first, is slower in the northern areas compared to the Gotland Deep, but after about 4–5 years of stagnation, salinity starts to decrease faster there. Discrepancies are obvious in temperature time-series (Figure 11). This result shows that the densest MBI water usually does not reach further from the Gotland Deep. Only several consecutive MBIs can directly reach or control temporal developments in further basins. We observed the 2014 December MBI water that first occupied the near bottom layers of the Gotland Deep in the Fårö Deep after the November 2015 and January–February 2016 MBI waters arrived in the Gotland Deep. Uplifted dense water flowed to the Fårö Deep over the sill as a gravity current. However, the MBI water that occupied the sub-halocline mid-depths in the Gotland Deep can be tracked all the way to the Gulf of Finland. In conclusion, a very strong MBI (Franck et al., 1987) that renews the water column from bottom to the halocline of the Central Baltic Sea also affects the Northern Baltic Sea, including the Gulf of Finland.
We extended the time-series from the near-bottom layer of the Fårö Deep and Gotland Deep at 137.5 m depth, which indicates the sill depth between the two basins (Figures 7, 12). There is a good correlation between two historical time-series (r = 0.91 for salinity and r = 0.96 for temperature; p < 0.01). Coincidence is particularly strong when there is an increase in salinity, which corresponds to the periods where lateral transport of denser water over the sill between the Gotland Deep and Fårö Deep was dominant process. The declining salinity corresponds to the stagnation periods, indicating that lateral transport from the Gotland Deep to the near bottom layer of Fårö Deep did not occur. The near-bottom salinity time-series in Figure 11 give an impression that changes in the near-bottom layer of the Fårö Deep only occur if there is a water renewal in the near-bottom layer of the Gotland Deep. The question is, do buoyant sub-halocline flows (interleaving currents from the southern Baltic to the Eastern Gotland Basin) impact the Fårö Deep as well? We checked the monthly average density time-series and found that when there was a density rise at least 0.01 kg m−3 in the near-bottom layer of the Fårö Deep (the layer from 175 m to bottom was integrated), the rise can also be seen in the same month 50% of cases in the sill layer between the Gotland Deep and Fårö Deep (110–150 m range in the Gotland Deep station data was integrated). The graph (Figure 12) suggests that the coincidence is even stronger (more than 50% of cases), but the rough method (long time-step) probably misses some events. Half (52 %) of the density rise cases, which can be simultaneously seen at the sill between the two basins and in the near-bottom layer of the Fårö Deep, can also be detected in the near-bottom layer (220–240 m layer was integrated) of the Gotland deep. This finding suggests that about half of the changes in the near bottom layer of the Fårö Deep are initiated by water renewal in the deepest layer of the Gotland Deep and consequent uplift of isopycnals. The other half are caused by the events, which cannot be seen in the deepest layer of the Gotland Deep, but can be seen in the layers above (integrated layers of 175–200, 150–175, 110–150 were checked). The density rise events occur in groups after MBIs. Thus, even if half of the cases at the sill occur because of interleaving flows, the precondition for these events is often a recent MBI. A richness of intermediate layer intrusions after the recent MBIs was detected by high-resolution observations in the Gotland Deep (Holtermann et al., 2017).
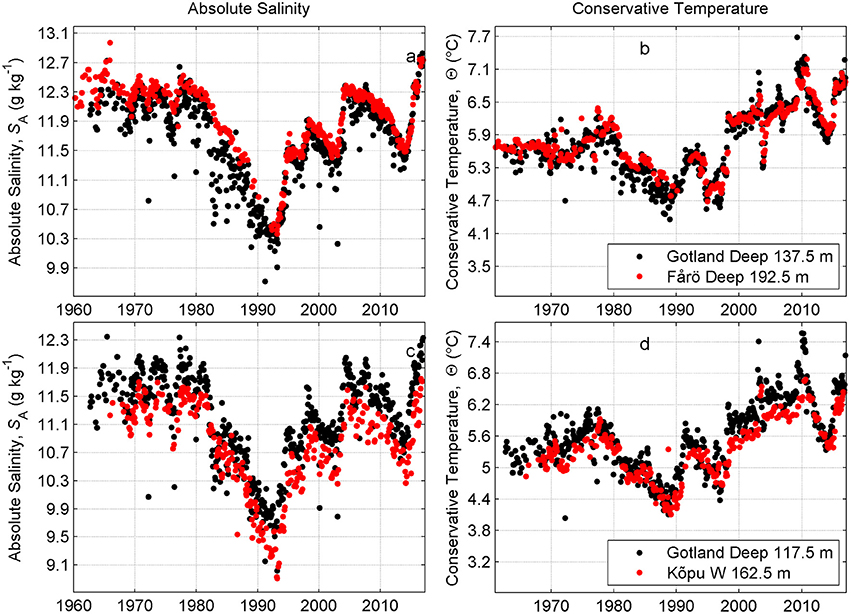
Figure 12. Temporal course of monthly average salinity and temperature at the selected depths along the pathway Gotland Deep (a-d), Fårö Deep (a, b), and Kõpu West (c, d) 1960–2016.
T-S analysis showed that the pre-MBI Fårö Deep bottom water did not contribute to the mixture forming the new bottom water in the Northern Deep. Warm and salty water, which arrived to the deep layers of the Northern Deep in summer 2015 (30 June 2015 profiles in the middle panel in Figure 13) appeared in the Gotland Deep area at the depths of 110–120 in early 2015 (10 February and 21 March 2015 profiles in the upper panel in Figure 13). A signature of the same warm and salty water mass was detected in the Gulf of Finland in February–March 2016.
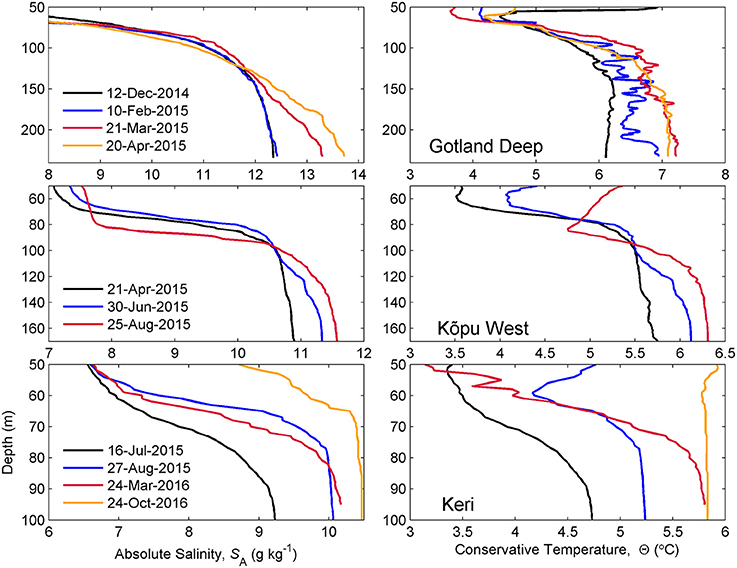
Figure 13. Selected temperature and salinity profiles in the Gotland Deep, Northern Baltic Proper (Kõpu West) and the Gulf of Finland (Keri).
We suggest that the MBIs create a pre-condition for the denser water transport and water renewal in the deep layers of the Northern Baltic Proper. First, MBIs create dense enough Gotland and Fårö Deep near-bottom layer, which allows relatively dense water to pass both deep areas without a bottom touch and arrive in the deep layers of the Northern Deep and further areas. The longer time-series of temperature-salinity in the Gotland Deep at a depth of 117.5 and bottom layer (162.5 m) of the Kõpu West confirm that sub-halocline layer below 100 m in the Central Baltic Proper (Gotland Deep) likely controls the water renewal in the deep layers of the Northern Baltic Proper (Figure 12). There is a strong correlation between two time-series (Figure 12) – r = 0.90 for salinity and r = 0.94 for temperature; p < 0.01. The best correlation was found, when the time lag of 3–4 months was used for Kõpu West time-series. This result explains why the deep layer salinity decline is slower in the Northern Baltic Proper than in the Gotland Deep during first stagnation years. In the absence of MBIs, there is no import of salt to the deep layers of the Gotland Deep. Contrary, the sub-halocline layer of the Gotland Deep (which is the source for the deep layer water in the Northern Baltic Proper) receives salt from the deeper layers, particularly after MBIs. Secondly, after an MBI relatively dense water can advect from the southern Baltic to the north. Thus, weak barotropic (Sellschopp et al., 2006) or baroclinic inflows (Feistel et al., 2004) from the North Sea that do not affect the bottom layers in the Gotland Deep, might still impact the sub-halocline layers in the Central Baltic and deep layers further north. This suggestion is supported by a long-term model simulation (1961–2007), which showed that horizontally integrated low-passed northward transport with a maximum at about 100 m depth remarkably increased during MBIs and such high transport values remained in this layer of the Gotland Basin for about 5 years after the MBI (Väli et al., 2013). The further (after 4–5 years of an MBI) acceleration of the salinity decline in the deep layers of the Northern Baltic Proper and sub-halocline layer of the Gotland Deep could be explained by decreased upward vertical flux of salt due to decreased salinity in the deep layer. Secondly, if the halocline gets weaker during the stagnation period, the vertical mixing can reach deeper. Comparison of salinity data in the Gulf of Finland between stagnation period at the end of the 1980s and post-MBI period after the mid-1990s showed a considerable difference in the deep layer, but virtually same values in the cold-intermediate layer, which were explained by deeper winter mixing and concurrent salt flux during stagnation years (Liblik and Lips, 2011). Thus, the vertical flux from the deep layer to the sub-halocline layer is decreasing during the stagnation period while the vertical flux through the halocline remains the same or even increases during the stagnation period.
The first impact of the 2014 December MBI was observed in the Gulf of Finland 9 months after the MBI passed the Danish Straits. The old deep layer in the Northern Baltic Proper was replaced in the bottom layer and pushed upwards to 80–90 m depth by the new warm and salty water that arrived from the Central Baltic. The signs of the old Northern Baltic Proper (Kõpu West) deep water can be first found in the Keri T-S profile in August 2015 (profiles from 27 August 2015 shown in the lowest panel in Figure 13). The shift to warmer-saltier deep layer and halocline occurred in the Gulf of Finland in January–March 2016 (profiles from 24 March 2016 in the lowest panel in Figure 13).
Strong estuarine circulation event(s) occurred in the Gulf of Finland in December 2015. It can be seen as very weak stratification in Figure 4i. The reversal event resulted in a deeper and weaker halocline that can also be seen in the Northern Baltic Proper. Estuarine circulation events can reach the Northern Baltic Proper (Elken et al., 2006) and cause considerable vertical mixing of heat, salt and nutrients (Liblik et al., 2013; Lips et al., 2017). Moreover, strong SW winds that cause reversals (Elken et al., 2003) also induce erosion of the halocline by wind stirring during winters (Lass et al., 2003). The comparison of profiles in the Northern Baltic Proper in November and December 2015 shows that in the latter month the halocline deepened because both its erosion (upward vertical mixing of salt can be seen) and accumulation of the upper layer water (effect of reversal). However, the increase in salinity in the whole layer, particularly in the halocline and deep layer, can be identified in Kõpu West in January 2016. The temperature-salinity characteristics of Kõpu West and Gulf of Finland show that the deep layer water that arrived in the latter basin originated from the Kõpu West. Due to sparse data, we cannot determine the exact origin depth, but the T-S diagram suggests it can originate from the deeper part of the halocline (90–100 m) or the layer below. It was suggested that salt wedge that penetrated to the Gulf of Finland in January 2012 originated from the Northern Baltic Proper from the depth of 110–115 m (Liblik et al., 2013). Since the reversal event together with wind stirring eroded only the very upper part of the halocline, but otherwise weakened the halocline and pushed it deeper, one can expect that this reversal event did not evoke, but rather postponed the warmer-saltier water mass arrival to the Gulf of Finland. Therefore, the change of temperature and salinity in the Gulf of Finland was caused by the warmer and saltier water mass that arrived in the sub-halocline layer of the Gotland Deep in early 2015 and later advected to the deep layers of the Northern Baltic Proper. As the new water in the Northern Baltic Proper accumulated from bottom to a certain depth level (110–115 m according to Liblik et al., 2013), it became available for the Gulf of Finland and penetrated there as wind conditions were favorable (Elken et al., 2003).
In summary, the Gulf of Finland receives its deep layer water from the deeper segment of the halocline in the Northern Baltic Proper. The deep layer of the Northern Baltic Proper is determined by the characteristics in the sub-halocline depth range in the Gotland Deep (Figure 12). Thus, despite high variability due to estuarine circulation reversals, there must be long-term correlation between the temporal changes in sub-halocline water mass in the Gotland Deep and the deep layer of the Gulf of Finland. Comparison of annual mean temperature and salinity in the depth of 117.5 m in the Gotland Deep and annual maximum in the deep layer of Osmussaar and Keri is shown in Figure 14. The annual maximum values, unlike the mean values, do not include such strong effect of circulation reversals. Both compared time-series show reasonable correlation, particularly in the Osmussaar vs. Gotland Deep salinity time-series (r = 0.90 for salinity and r = 0.37 for temperature; p < 0.01). Correlation is weaker, but significant between Keri and Gotland Deep as well (r = 0.73 for salinity and r = 0.56 for temperature; p < 0.01). This result once more supports our conclusion that the characteristics of sub-halocline water mass in the Central Baltic controls not only changes in the deep layer water in the Northern Baltic Proper, but also in the Gulf of Finland.
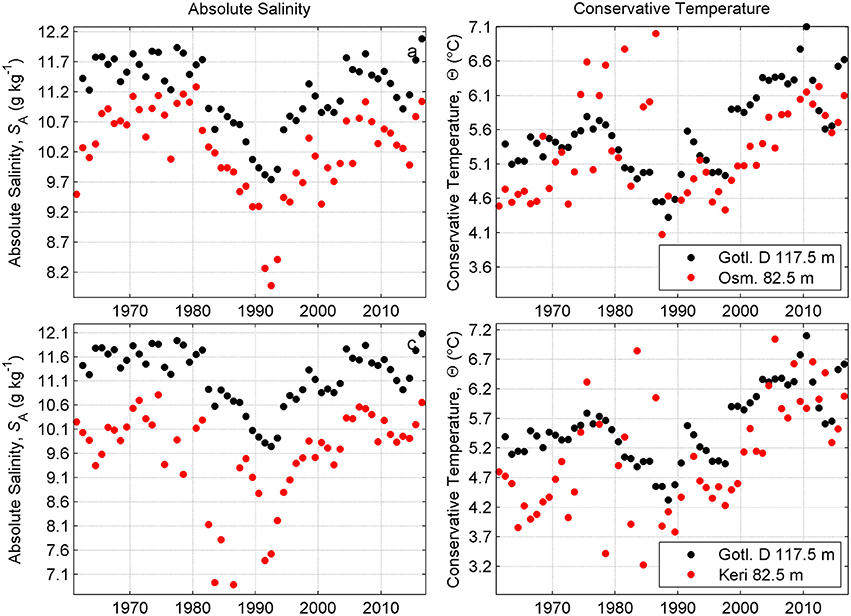
Figure 14. Temporal course of yearly average salinity and temperature at 117.5 depth in the Gotland Deep, and yearly maximum salinity and temperature in the Osmussaar and Keri area.
Conclusions
Recent MBIs (December 2014, November 2015 and January–February 2016) have caused considerable changes in water column structure in the area from the Gotland Deep to the Gulf of Finland. Overall temperature and salinity increase in the order of 1°C and 1 g kg−1 were observed in the deep layers below 80 m depth. Highest salinities since last 40–60 years were observed in the whole study area. Renewal of the deep layer water was observed in the Gotland Deep in April 2015 and February 2016. The fresh oxygen was consumed by 3–6 months in the near-bottom layer. Enhanced lateral import of oxygen was registered in the mid-layer down to 160 m depth in the Gotland Deep since summer 2016. Oxygen appeared in the sub-halocline layer of the Fårö Deep in February 2017 while during the rest of the study period this area remained anoxic. Low oxygen layer thickened in the Norther Baltic Proper and the Gulf of Finland.
The arrival of December 2014 and November 2015 MBIs were detected as clear peaks in salinity and temperature in the near-bottom layers of the Gotland Deep in April 2015 and February 2016. The peaks were also detected in the further basins: in the Fårö Deep by 2–3 months delay, in the Northern Deep by 3–5 month delay, and in the Kõpu West (Northern Baltic Proper) by 4–6 month delay. The time lags were confirmed by correlation analysis of longer time-series. No clear peaks can be detected in the Gulf of Finland, but T-S analysis shows the first impact of MBI as the arrival of forward pushed former Northern Baltic Proper deep layer water in August 2015. The warmer and saltier MBI water arrived in the Gulf of Finland in February–March 2016, i.e., 14–15 months after occurrence of the December 2014 MBI.
Water renewal in the Fårö Deep occurred as gravity current over the sill between Fårö and Gotland Deep. Water that replaced near-bottom waters in the Northern Baltic Proper and in the Gulf of Finland originated from the Eastern Gotland Basin at the depth of 110–120 m. The pre-condition for such sub-halocline advection is dense enough deep layer in the Gotland Deep and the Fårö Deep. Such water renewal regimes in the deep layers of the Fårö Deep, and Northern Baltic Proper and in the Gulf of Finland are supported by long-term time-series.
In conclusion, the warm and salty water from MBIs has influenced the whole area from Gotland Deep to the Gulf of Finland.
Author Contributions
TL was responsible for compiling the data, data analyzes, and writing manuscript. MN, PA, and MH were responsible for compilation of data in their institutes. All authors contributed to data collection, processing, and writing of the manuscript.
Conflict of Interest Statement
The authors declare that the research was conducted in the absence of any commercial or financial relationships that could be construed as a potential conflict of interest.
Acknowledgments
We would like to thank our colleagues and research vessels crews for performing all measurements. The present work was supported by institutional research funding IUT (IUT19-6) of the Estonian Ministry of Education and Research. Additional funding we received from the European Union Seventh Framework Programme (FP7/2007-2013) under grant agreement n° 312762 for ship time within EUROFLEETS2 (PROSID2014—Propagation of the saltwater inflow from December 2014). The continuous long-term data acquisition of the Leibniz Institute for Baltic Sea Research and Swedish monitoring programme operated by the Swedish Meteorological and Hydrological Institute contributed with their latest measurements. We thank the areviewers for their careful reading and helpful suggestions.
References
Alenius, P., Myrberg, K., and Nekrasov, A. (1998). The physical oceanography of the Gulf of Finland: a review. Boreal Env. Res. 3, 97–1205.
Burchard, H., Lass, H. U., Mohrholz, V., Umlauf, L., Sellschopp, J., Fiekas, V., et al. (2005). Dynamics of medium-intensity dense water plumes in the Arkona Basin, Western Baltic Sea. Ocean Dynamics 55, 391–402. doi: 10.1007/s10236-005-0025-2
Conley, D. J., Björck, S., Bonsdorff, E., Carstensen, J., Destouni, G., Gustafsson, B. G., et al. (2009). Hypoxia-related processes in the Baltic Sea. Environ. Sci. Technol. 43, 3412–3420. doi: 10.1021/es802762a
Elken, J., Malkki, P., Alenius, P., and Stipa, T. (2006). Large halocline variations in the Northern Baltic Proper and associated meso-and basin-scale processes. Oceanologia 48, 91–117.
Elken, J., Raudsepp, U., and Lips, U. (2003). On the estuarine transport reversal in deep layers of the Gulf of Finland. J. Sea Res. 49, 267–274. doi: 10.1016/S1385-1101(03)00018-2
Feistel, R., Hagen, E., and Nausch, G. (2006). Unusual Baltic inflow activity in 2002–2003 and varying deep-water properties. Oceanologia 48, 21–35.
Feistel, R., Nausch, C., Heene, T., Piechura, J., Hagen, E. A. F, Feistel, R., et al. (2004). Evidence for a warm water inflow into the Baltic Proper in summer. Oceanologia 46, 581–598.
Fischer, H., and Matthäus, W. (1996). The importance of the Drogden Sill in the Sound for major Baltic inflows. J. Mar. Syst. 9, 137–157. doi: 10.1016/S0924-7963(96)00046-2
Fonselius, S., and Valderrama, J. (2003). One hundred years of hydrographic measurements in the Baltic Sea. J. Sea Res. 49, 229–241. doi: 10.1016/S1385-1101(03)00035-2
Franck, H., Matthäus, H., and Sammler, R. (1987). Major inflows of saline water into the Baltic Sea during the present century. Gerlands Beitr. Geophys. 96, 517–531.
Hagen, E., and Feistel, R. (2001). Spreading of baltic deep water: a case study for the Winter 1997-1998. Meereswiss. Ber. 45, 99–133.
Hänninen, J., and Vuorinen, I. (2011). Time-varying parameter analysis of the baltic sea freshwater runoffs. Environ. Model. Assess. 16, 53–60. doi: 10.1007/s10666-010-9231-5
Holtermann, P. L., Prien, R., Naumann, M., Mohrholz, V., and Umlauf, L. (2017). Deepwater dynamics and mixing processes during a major inflow event in the central Baltic Sea. J. Geophys. Res. Ocean. 122, 6648–6667. doi: 10.1002/2017JC013050
Ioc Scor and Iapso (2010). The international thermodynamic equation of seawater – 2010: Calculation and use of thermodynamic properties. Intergov. Oceanogr. Comm. Manuals Guid. 56:196.
Jakobsen, F. (1995). The major inflow to the Baltic Sea during January 1993. J. Mar. Syst. 6, 227–240. doi: 10.1016/0924-7963(94)00025-7
Kankaanpää, H. T., and Virtasalo, J. J. (2017). Rapid fluctuations in the northern Baltic Sea H2S layer. J. Mar. Syst. 176, 24–37. doi: 10.1016/j.jmarsys.2017.07.001
Laine, A. O., Andersin, A.-B., Leiniö, S., and Zuur, A. F. (2007). Stratification-induced hypoxia as a structuring factor of macrozoobenthos in the open Gulf of Finland (Baltic Sea). J. Sea Res. 57, 65–77. doi: 10.1016/j.seares.2006.08.003
Lass, H. U., Prandke, H., and Liljebladh, B. (2003). Dissipation in the Baltic proper during winter stratification. J. Geophys. Res. 108:3187. doi: 10.1029/2002JC001401
Lehtoranta, J., Savchuk, O. P., Elken, J., Dahlbo, K., Kuosa, H., Raateoja, M., et al. (2017). Atmospheric forcing controlling inter-annual nutrient dynamics in the open Gulf of Finland. J. Mar. Syst. doi: 10.1016/j.jmarsys.2017.02.001
Liblik, T., Laanemets, J., Raudsepp, U., Elken, J., and Suhhova, I. (2013). Estuarine circulation reversals and related rapid changes in winter near-bottom oxygen conditions in the Gulf of Finland, Baltic Sea. Ocean Sci. 9, 917–930. doi: 10.5194/os-9-917-2013
Liblik, T., and Lips, U. (2011). Characteristics and variability of the vertical thermohaline structure in the Gulf of Finland in summer. Boreal Environ. Res. 16, 73–83.
Lips, U., Kikas, V., Liblik, T., and Lips, I. (2016). Multi-sensor in situ observations to resolve the sub-mesoscale features in the stratified Gulf of Finland, Baltic Sea. Ocean Sci. 12, 715–732. doi: 10.5194/os-12-715-2016
Lips, U., Laanemets, J., Lips, I., Liblik, T., Suhhova, I., and Suursaar, Ü. (2017). Wind-driven residual circulation and related oxygen and nutrient dynamics in the Gulf of Finland (Baltic Sea) in winter. Estuar. Coast. Shelf Sci. 195, 4–15 doi: 10.1016/j.ecss.2016.10.006
Manual for Marine Monitoring in the COMBINE Programme of HELCOM. (2017). Available online at: http://www.helcom.fi/Documents/Actionareas/Monitorin and assessment/Manuals and Guidelines/Manual for Marine Monitoring in the COMBINE Programme of HELCOM.pdf (Accessed December 19, 2017).
Matthäus, W., and Franck, H. (1992). Characteristics of major Baltic inflows-a statistical analysis. Cont. Shelf Res. 12, 1375–1400. doi: 10.1016/0278-4343(92)90060-W
Matthäus, W., and Lass, H. U. (1995). The recent salt inflow into the Baltic Sea. J. Phys. Oceanogr. 25, 280–286. doi: 10.1175/1520-0485(1995)025<0280:TRSIIT>2.0.CO;2
Mohrholz, V., Dutz, J., and Kraus, G. (2006). The impact of exceptionally warm summer inflow events on the environmental conditions in the Bornholm Basin. J. Mar. Syst. 60, 285–301. doi: 10.1016/j.jmarsys.2005.10.002
Mohrholz, V., Naumann, M., Nausch, G., Krüger, S., and Gräwe, U. (2015). Fresh oxygen for the Baltic Sea - an exceptional saline inflow after a decade of stagnation. J. Mar. Syst. 148, 152–166. doi: 10.1016/j.jmarsys.2015.03.005
Myrberg, K., and Leppäranta, M. (2009). “Topography and hydrography of the Baltic Sea,” in Physical Oceanography of the Baltic Sea (Berlin; Heidelberg: Springer Berlin Heidelberg), 41–88.
Reissmann, J. H., Burchard, H., Feistel, R., Hagen, E., Lass, H. U., Mohrholz, V., et al. (2009). Vertical mixing in the Baltic Sea and consequences for eutrophication - A review. Prog. Oceanogr. 82, 47–80. doi: 10.1016/j.pocean.2007.10.004
Schimanke, S., and Meier, H. E. M. (2016). Decadal-to-centennial variability of salinity in the Baltic Sea. J. Clim. 29, 7173–7188. doi: 10.1175/JCLI-D-15-0443.1
Schmale, O., Krause, S., Holtermann, P., Power Guerra, N. C., and Umlauf, L. (2016). Dense bottom gravity currents and their impact on pelagic methanotrophy at oxic/anoxic transition zones. Geophys. Res. Lett. 43, 5225–5232. doi: 10.1002/2016GL069032
Sellschopp, J., Arneborg, L., Knoll, M., Fiekas, V., Gerdes, F., Burchard, H., et al. (2006). Direct observations of a medium-intensity inflow into the Baltic Sea. Cont. Shelf Res. 26, 2393–2414. doi: 10.1016/j.csr.2006.07.004
Vahtera, E., Conley, D. J., Gustafsson, B. G., Kuosa, H., Pitkänen, H., Savchuk, O. P., et al. (2007). Internal ecosystem feedbacks enhance nitrogen-fixing cyanobacteria blooms and complicate management in the Baltic Sea. AMBIO A J. Hum. Environ. 36, 186–194. doi: 10.1579/0044-7447(2007)36[186:IEFENC]2.0.CO;2
Väli, G., Meier, H. E. M., and Elken, J. (2013). Simulated halocline variability in the Baltic Sea and its impact on hypoxia during 1961-2007. J. Geophys. Res. Ocean. 118, 6982–7000. doi: 10.1002/2013JC009192
Vaquer-Sunyer, R., and Duarte, C. M. (2008). Thresholds of hypoxia for marine biodiversity. Proc. Natl. Acad. Sci.U.S.A. 105, 15452–15457. doi: 10.1073/pnas.0803833105
Appendix

Table A1. The mean temperature (Ts) and salinity (Ss) along the section (see Figure 1A) in the water column below 80 m depth.
Keywords: Major Baltic Inflow, Baltic Sea, hypoxia, water masses, halocline
Citation: Liblik T, Naumann M, Alenius P, Hansson M, Lips U, Nausch G, Tuomi L, Wesslander K, Laanemets J and Viktorsson L (2018) Propagation of Impact of the Recent Major Baltic Inflows From the Eastern Gotland Basin to the Gulf of Finland. Front. Mar. Sci. 5:222. doi: 10.3389/fmars.2018.00222
Received: 30 March 2018; Accepted: 08 June 2018;
Published: 11 July 2018.
Edited by:
Isabel Iglesias, Centro Interdisciplinar de Pesquisa Marine e Ambiental (CIIMAR), PortugalReviewed by:
Alexander B. Rabinovich, P.P. Shirshov Institute of Oceanology (RAS), RussiaJesus Dubert, University of Aveiro, Portugal
Copyright © 2018 Liblik, Naumann, Alenius, Hansson, Lips, Nausch, Tuomi, Wesslander, Laanemets and Viktorsson. This is an open-access article distributed under the terms of the Creative Commons Attribution License (CC BY). The use, distribution or reproduction in other forums is permitted, provided the original author(s) and the copyright owner(s) are credited and that the original publication in this journal is cited, in accordance with accepted academic practice. No use, distribution or reproduction is permitted which does not comply with these terms.
*Correspondence: Taavi Liblik, dGFhdmkubGlibGlrQHR0dS5lZQ==
 Taavi Liblik
 Michael Naumann
 Pekka Alenius
 Martin Hansson4
 Urmas Lips
 Günther Nausch
 Laura Tuomi
 Lena Viktorsson