 Marina Sanz-Martín1,2*
 Melissa Chierici3,4Elena Mesa5Paloma Carrillo-de-Albornoz6
 Antonio Delgado-Huertas5
 Susana Agustí6,7
 Marit Reigstad8
 Svein Kristiansen8
 Paul F. J. Wassmann8
 Carlos M. Duarte6,8
- 1Departament of Global Change, Instituto Mediterráneo de Estudios Avanzados (IMEDEA/CSIC-UIB), Esporles, Spain
- 2Facultat de Ciències de la Terra, Universitat de Barcelona (UB), Barcelona, Spain
- 3Institute of Marine Research, Tromsø, Norway
- 4University Centre in Svalbard, Longyearbyen, Norway
- 5Instituto Andaluz de Ciencias de la Tierra (IACT/CSIC-UGR), Armilla, Spain
- 6Red Sea Research Center, King Abdullah University of Science and Technology, Thuwal, Saudi Arabia
- 7UiT The Arctic University of Tromsø, Tromsø, Norway
- 8Department of Bioscience, Aarhus University, Arctic Research Centre, Arhus, Denmark
The European Sector of the Arctic Ocean is characterized by low CO2 concentrations in seawater during spring and summer, largely due to strong biological uptake driven by extensive plankton blooms in spring. The spring plankton bloom is eventually terminated by nutrient depletion and grazing. However, low CO2 concentrations in seawater and low atmospheric resupply of CO2 can cause episodes during which the phytoplankton growth is limited by CO2. Here, we show that gross primary production (GPP) of Arctic plankton communities increases from 32 to 72% on average with CO2 additions in spring. Enhanced GPP with CO2 additions occur during episodes of high productivity, low CO2 concentration and in the presence of dissolved inorganic nutrients. However, during summer the addition of CO2 supresses planktonic Arctic GPP. Events of CO2 limitation in spring may contribute to the termination of the Arctic spring plankton blooms. The stimulation of GPP by CO2 during the spring bloom provides a biotic feedback loop that might influence the global role played by the Arctic Ocean as a CO2 sink in the future.
Introduction
The shelf seas and the shelf edge of the European Artic Sector are characterized by strong spring plankton blooms that extend between 70 and 80°N in the Barents Sea and the northern Svalbard shelf (Wassmann and Reigstad, 2011). These blooms support high net community production (NCP) rates and fuel the Arctic food web (Vaquer-Sunyer et al., 2013). The strength of the spring Arctic plankton bloom results not only from high primary productivity, but also from a very low respiratory demand of the planktonic community at that time, which leads to high NCP (Vaquer-Sunyer et al., 2013). The spring bloom is associated with increased photoperiod, and depends on light availability, ice cover, water masses and nutrient availability, which lead to extremely pronounced seasonality and spatial heterogeneity (Vaquer-Sunyer et al., 2013). The high biological CO2 uptake in shallow stratified layers during the spring bloom results in rapid CO2 drawdown in the surface waters of the Arctic Ocean (Chierici et al., 2011; Yasunaka et al., 2016). Values as low as 100 μatm of partial pressure of CO2 (pCO2) have been recorded at the end of the spring bloom (Fransson et al., 2009), which is among the lowest pCO2 values reported across the open ocean (Takahashi et al., 2009). As a consequence, several regions of the Arctic Ocean such as the Eurasian shelves and the Barents Sea (Fransson et al., 2001, 2009) and the Bering-Chukchi shelves (Kaltin and Anderson, 2005), act as intense carbon sink for atmospheric CO2, taken up ~66–199 Tg C yr−1 during spring and summer (Bates and Mathis, 2009).
Arctic spring plankton blooms are generally triggered by increased solar radiation with increased photoperiod, and the associated increase in temperature, melting ice and the consequent increase in underwater irradiance and water column stratification (Sakshaug and Skjoldal, 1989; Niebauer, 1991; Reigstad et al., 2002; Hodal et al., 2012; Juul-Pedersen et al., 2015). The spring bloom is usually considered to be terminated by nutrient depletion and grazing, but secondary blooms can be produced by wind-driven events that break down the weak stratification and supply nutrients to the euphotic zone (Sakshaug and Skjoldal, 1989; Niebauer, 1991; Wassmann et al., 1999; Tremblay et al., 2006; Fransson et al., 2017). However, experimental assessments suggest that low CO2 concentrations can limit primary production (Mercado and Gordillo, 2011), such as the low CO2 concentrations observed during spring and summer in the Arctic Ocean (Bates and Mathis, 2009).
Limitation by CO2 in plankton communities has indeed been experimentally observed in the European Arctic sector (Engel et al., 2013; Holding et al., 2015) and in sub-ice blooms in the Baltic Sea (Spilling, 2007) as well as in temperate regions of the Atlantic Ocean (Hein and Sand-Jensen, 1997). However, Arctic CO2 limitation seems to be temperature-dependent (Holding et al., 2015), light-dependent and acclimation of subarctic plankton productivity to high levels of CO2 has been observed (Hoppe et al., 2017). When CO2 is depleted, the intracellular CO2 concentration decreases, leading to a lower diffusive CO2 supply that reduces photosynthetic rates (Riebesell et al., 1993) and results in CO2-limited phytoplankton production (Rost et al., 2006). In polar regions, CO2 limitation is more likely than in temperate regions because the conversion of to CO2 in cold waters with high pH supplies little CO2, < 5% of the required CO2 for one polar diatom species (Riebesell et al., 1993). Isotopic evidence also points at CO2 limitation during peak and late bloom phases in the Arctic Ocean, reflected in heavier δ13C signatures in plankton (Tamelander et al., 2009). However, experimental and observational evidence of CO2 limitation of phytoplankton production during the spring phytoplankton bloom is limited, so whether this is an episodic or chronic situation remains unclear.
Here, we test the hypothesis that the characteristically low CO2 concentrations in seawater during the Arctic spring and early summer limit the primary productivity of plankton communities before dissolved inorganic nutrients are fully consumed. To test this hypothesis, we conducted a series of seven experiments to test the response of planktonic gross primary production (GPP) to elevated CO2. These communities were sampled west and northwest of Svalbard (European Arctic sector), during spring and summer. The locations of the experiments were heterogeneous (Figure S1); four of the experiments were located in the path of the West Spitsbergen Current (WSC), that flows northward along the shelf edge at the west of the Svalbard Islands, and two of the experiments were located in the mouths of two western fjords. We sampled seven subsurface plankton communities in the spring and summer of 2014 and 2015, thereby experiencing a wide range of conditions in terms of community metabolism and biogeochemical conditions. We evaluated the net biological demand for CO2, as the NCP in the euphotic layer, compared this to the atmospheric supply of CO2 through air-sea exchange, and assessed the experimental response of the GPP of the plankton communities sampled to elevated CO2.
Materials and Methods
Three cruises were conducted to the west and northwest of the Svalbard shelf where seven experiments on CO2 addition were carried out on board R/V Helmer Hanssen in 2014 and 2015: two experiments were run in May, three in August 2014 and two in May 2015 (Figure S1). Results of the first experiment, in May 2014, were previously Holding et al. (2015).
A 50 L sample of subsurface seawater (3 m) was collected using a Rosette sampler system, which was fitted with Niskin bottles and a calibrated CTD profiler (Seabird 911plus), and located in two 25 L closed tanks using silicon tubes. Samples to measure the carbonate system parameters, chlorophyll a concentration (Chl a), nutrients concentrations and phytoplankton community composition were taken and preserved for further analysis.
To simulate the predicted scenario of atmospheric pCO2 by 2,100 (IPCC Panel, 2014), 25 L of seawater was stored in a closed tank and the remaining 25 L were bubbled with CO2 until ~1,000 ppm pCO2 was reached, using an Environmental Gas Monitor (EGM-3) to measure pCO2 while a water pump ensured proper mixing. The treated and untreated water were gently mixed in 10 L carboys to produce an intermediate level and a gradient of increasing pCO2 between treatments. In 2014, this gradient included four pCO2 levels in the experiments, but the experimental design was simplified, based on the results obtained, to have only two elevated pCO2 levels in 2015. This allowed experiments with a greater number of communities to be conducted within the time available (see pCO2 of each treatment in Table S1).
After every treatment reached the targeted pCO2 (45 min), two sets of samples were collected. The first set was immediately preserved to determinate the initial dissolved O2 concentration, δ18O (in dissolved O2), total alkalinity (TA) and total dissolved inorganic carbon (DIC). The second set of samples was incubated for 24 h and subsequently preserved to determinate the same parameters at the end of the incubation. In 2014 the second set of samples was incubated in transparent methacrylate tubes which allowed the 60% transmittance of photosynthetically active radiation surface (PAR) to simulate the irradiance at 3 m depth, with flow-through surface seawater baths to maintain samples close to the in-situ temperature during the cruises of 2014. In May 2015, samples were incubated in a 40-L tank with circulation of surface seawater and neutral screens allowed the 80% transmittance of surface PAR.
Gross primary production (GPP) was measured from the photosynthetic production of 18O2 following the addition of O during a 24 h incubation, according to Bender et al. (1987) and Grande (1988). Four 12-ml vials per treatment, made of borosilicate, were immediately fixed with 100 μl of saturated HgCl2 solution and stored in darkness for further δ18Oinitial analysis. Four other vials per treatment containing glass beads to mix, were labeled with 80 μl of 98% O, shaken to ensure mixing, incubated for 24 h on deck and subsequently fixed with 100 μl of saturated HgCl2 solution for further analysis. At the Stable-Isotope Laboratory of the Instituto Andaluz de Ciencias de la Tierra (IACT-CSIC) Stable-Isotope Laboratory, a 4-ml headspace of Helium was generated in each vial. Vials were left to equilibrate for 24 h at room temperature letting the dissolved gases in water equilibrate with the headspace, originally Helium 100%. After 24 h, the δ18O of dissolved oxygen in the headspace was measured in a Finnigan GasBench II attached to a Finnigan DeltaPlusXP isotope ratio mass spectrometer, with precision better than 0.1%0. The flow was passed through a liquid nitrogen trap to remove water vapor before entering GasBench II. Oxygen and nitrogen were separated in a Molecular Sieve 5Å chromatographic column. Data, which were corrected with atmospheric air, are reported as δ18O value (%0) relative to V-SMOW (Vienna Standard Mean Ocean Water) standard.
The δ18O(H2O) composition of labeled samples was measured 3 weeks later in a liquid water isotope analyzer (Los Gatos Research) with precision of 0.2%0 In order to avoid contamination of the analyzer with highly 18O-enriched H2O (≈3,000%0), the labeled water was diluted (approximately 1:20) with a laboratory standard of known isotopic composition. GPP was calculated from Bender et al. (1999) as:
where δ18Oinitial and δ18Ofinal are the initial and final δ18O of dissolved O2 (%0 vs. V-SMOV), respectively, δ18Owater is the δ18O of the labeled seawater (%0 vs. V-SMOV) and [O2]initial is the initial O2 concentration (μmol O2 L−1) measured by high-precision Winkler titration.
In addition tothe 18O method, the O2 mass balance method (Carpenter, 1965; Carritt and Carpenter, 1966) was used to estimate the NCP and the community respiration (R) in darkness in the water column of the CO2 experiments stations, as well as in 5 additional stations in the nearby area. NCP and R rates were calculated by subtracting initial dissolved oxygen concentrations from dissolved oxygen concentrations measured after incubation in the dark and light conditions, respectively. GPP measured with the O2 mass balance method (GPP-O2) was calculated by solving the mass balance equation GPP-O2 = NCP + R (Carpenter, 1965; Carritt and Carpenter, 1966). NCP and R was determined at 3 different depths on the euphotic layer (3 m, 15 m and 25 m, on average). Seawater samples were collected with a Rosette sampler system fitted with 10-L Niskin bottles and a calibrated CTD (Seabird 911plus). Seawater was carefully siphoned from the Niskin bottles into 100 ml narrow-mouth, borosilicate Winkler bottles. Seven replicates were used to determine the initial oxygen concentration, and seven replicates were incubated for 24 h in dark and in light. The bottles were incubated on deck, following the same procedure previously mentioned for GPP samples measured with the 18O method. Light attenuation inside each methacrylate incubator was estimated with a Photosynthetically Available Radiation (PAR) radiometer (Biospherical Instruments Inc. QSL-101). Light attenuation was simulated using screens as a % of the on-deck PAR with 0 screen, 2 screens, 3 screens, simulating 60, 33, and 25% of surface PAR, respectively. GPP-O2 was calculated by the difference between the mean final oxygen concentration of light incubated bottles and the mean final oxygen concentration of dark incubated bottles. Oxygen concentrations were determined by automated high-precision Winkler titration (Carpenter, 1965; Carritt and Carpenter, 1966), using a potentiometric electrode and automated endpoint detection (Oudot et al., 1988). Values that reported O2 production in darkness were considered unviable and were discarded from the database. The communities were then characterized as autotrophic communities (GPP/R ratios > 1, NCP > 0) or heterotrophic (GPP/R ratios < 1, NCP < 0).
Sampling and analyses for the determination of the carbonate chemistry in the experiments followed the standard operating procedures from Dickson et al. (2007). Seawater for TA and DIC analyses were collected from each treatment carboy with a silicon tube and carefully siphoned in two 250 mL borosilicate bottles per treatment. Initial samples were preserved with 60 μL of mercury chloride and stored in dark and cold until analysis onboard and the final samples were preserved after 24 h of incubation and analyzed onboard. TA was determined using potentiometric titration in open cell with 0.05 mol l−1 hydrochloric acid using a Titrino system (Metrohm, Switzerland). The precision was ±2 μmol kg−1, obtained by triplicate analysis of one sample on a daily basis and Certified Reference Material provided by Dr. Andrew Dickson (Scripps Institution of Oceanography, University of California) was used for accuracy check of the TA analyses. pH was determined spectrophotometrically, using m-cresol purple and a diode-array spectrophotometer, HP8453 (Clayton and Byrne, 1993). The analytical precision was estimated to ±0.002 pH units, which was determined by triplicate analysis of one sample every day. The pH of the indicator solution was measured daily using a 0.2-mm flow cell, this was then used as correction for the perturbation caused by the addition of the indicator solution (Chierici et al., 1999).
The CO2 concentration was calculated from TA and DIC analysis using the program CO2SYS (Pierrot et al., 2006) and output parameters were standardized to standard pressure and in situ water temperature. We used the carbonate dissociation constants (K1 and K2) of Mehrbach et al. (1973) as refitted by Dickson and Millero (1987), and the KSO4 determined by Dickson (1990). The CO2 removal rates were calculated from the difference in CO2 concentration during 24 h incubation.
The air-sea CO2 flux (F) was calculated using the measured f CO2 according to the gas flux formulation:
Where K0 is the solubility, k is the transfer velocity for air-sea CO2 exchange, f CO2 air and f CO2 are the atmospheric and sea surface f CO2, respectively, u is the wind speed (mean daily) and Sc is the Schmidt number. The solubility (K0) was calculated according to Weiss (1974) using the measured sea surface temperature (SST) and salinity values. The transfer velocities (k) and the Schmidt number (Sc) were calculated according to Wanninkhof (1992) for monthly and daily average observed wind speed (Equation 3) and are based on wind speed (u). The f CO2 air was estimated from the monthly xCO2air from Ny-Ålesund (www.nilu.no). The dry atmospheric mole fraction was converted into the atmospheric pCO2 (pCO2air) in wet air using the relative air humidity, air pressure and air temperature for the date when the fluxes based on ship data were estimated.
Chlorophyll a concentration (Chl a) was collected from the same depth at which seawater was collected for the experiments conducted in May 2015 and was determined fluorometrically by filtering 200 mL of the sub-surface seawater sampled through Whatman GF/F filters and extracted in 90% acetone for 24 h before spectrofluorometric determination using a Shimadzu RF-5301PC spectrofluorometer, following Parsons et al. (1984). For the experiments conducted in May and August 2014, Chl a was derived from the fluorescence measured in a calibrated CTD (Seabird 911plus) at the depth of the sampled seawater using linear regression equations between results of Chl a and fluorescence measured in from previous vertical profiles in same stations (R2 > 0.67 and n = 12 for every regression equation).
Samples of unfiltered 50 mL seawater was collected at the same depth of the experiments conducted in May 2015 for analysis of phosphorus, nitrate-nitrite, and silicate concentrations and vials were kept frozen until analysis using standard seawater methods using a Flow Solution IV analyzer from O.I. Analytical, USA. The analyzer was calibrated using reference seawater from Ocean Scientific International Ltd. UK. Nutrients concentrations of the experiments conducted in May and August 2014 were analyzed in a previous vertical profile from the same station.
Samples of 100 mL of untreated plankton community were collected from each experimental community, at the onset of the experiment, and fixed with glutaraldehyde (at 1–1.5%). Cells were counted following the Utermöhl method, while also measuring the linear dimensions of the different taxa present to allow biovolume calculations by approximation to the nearest geometrical figure. Samples were concentrated in 50-ml chambers for 48 h and counted in a transmitted-light inverted microscope (Zeiss Axiovert 200) at 200x or 400x magnification depending on cell size. Phytoplankton cells were differentiated into species or genus, and their contribution to the communities is presented as % of the community biovolume.
The response of GPP to increased CO2 was compared among experiments using the Ln-transformed effect size:
Where GPPE and GPPC are the mean response in the experimental and control treatments, respectively (n = 3–4). The effect size is frequently used in experimental ecology to quantify the proportional effect of a treatment and to facilitate the comparison of biological responses across experiments (Hedges et al., 1999). An Ln effect size of GPP of zero is interpreted as having no effect on GPP, whereas a positive value indicates a positive effect of CO2 on GPP and a negative value indicates a negative effect of CO2 on GPP. The variance in the Ln effect size was calculated following Kroeker et al. (2010). Moreover, comparisons based on the Ln effect size GPP did not assume normality and were heterogeneous because the experiments encompassed distinct phases of blooms, which occur rapidly and yield extreme data (i.e., very low pCO2 and high GPP; R Core Team, 2014). The analyses were carried out using RStudio 0.98.945 and the “Metafor package” designed for meta-analyses (Viechtbauer, 2010).
Results
Community Metabolism and CO2 Demand
GPP-O2 within the euphotic layer increased with increasing Chl a concentration (p < 0.0001, R2 = 0.81, Figure S2), resulting in low-CO2 waters (ranging from 281 to 128 μatm of pCO2, Table 1). GPP, measured with the 18O method, of these low-CO2 communities ranged from 5.8 to 82.4 μmol O2 L−1 d−1 in spring, under blooming conditions, while in summer GPP was much lower (0.4–1.4 μmol O2 L−1 d−1), reflecting a recycling phase. The GPP-O2/R ratio was extremely high in the euphotic layer in spring (43.4 ± 0.85, with a maximum value of 244.6) compared with low values in summer (2.67 ± 0.73). As a result, the waters sampled were consistently undersaturated in CO2 and with a broad range of primary productivity rates. Consistent with the role of biota as a CO2 sink, there was oceanic uptake of atmospheric CO2 at the stations sampled, which increased with increasing NCP in the euphotic layer (Figure 1, Table 1). However, the resulting input of atmospheric CO2 was much smaller than the net CO2 demand by the plankton community, calculated assuming a 1:1 ratio between O2 and C, accounting for 19%, on average, of the net biological removal (Figure 1, Table 1).
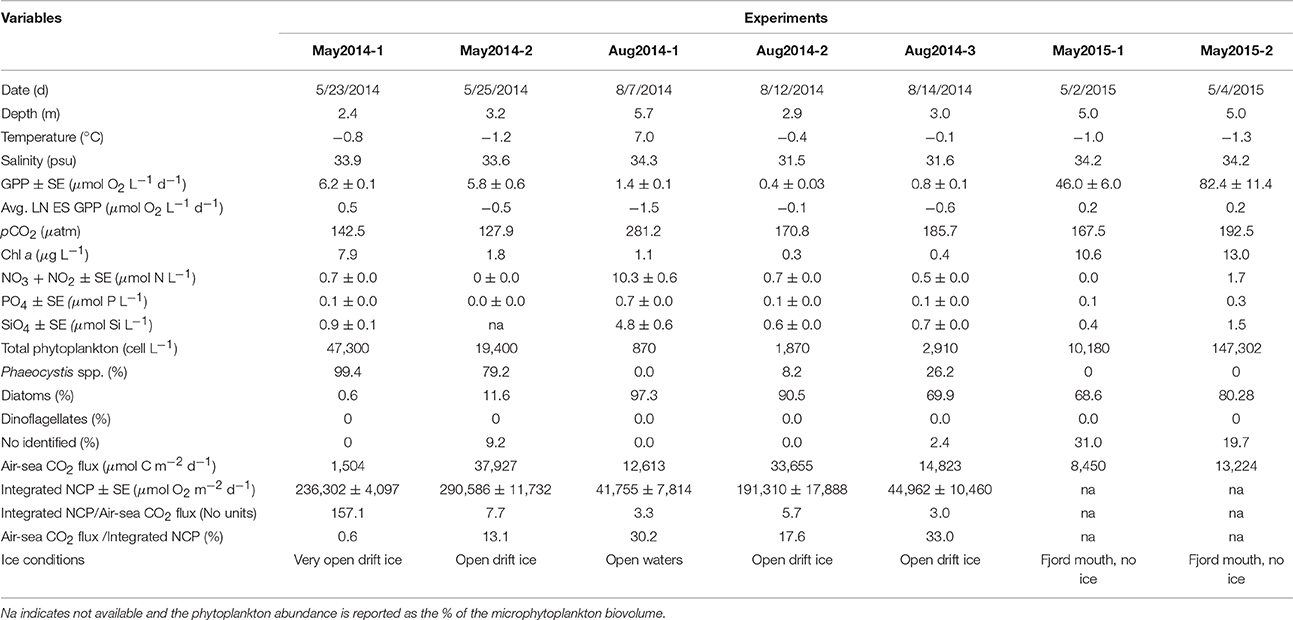
Table 1. In situ conditions and results of the seven experiments conducted in the west and northwest of Svalbard.
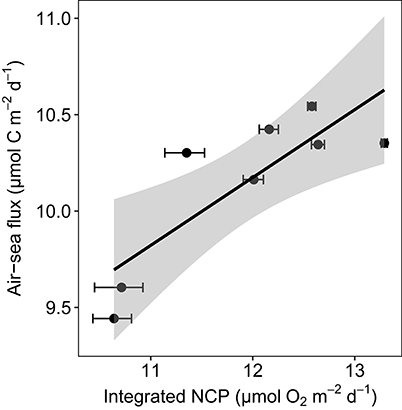
Figure 1. Oceanic uptake of CO2 shown by the relationship between the Ln-transformed air-sea CO2 flux and the Ln-transformed NCP integrated in the water column from 3 to 25 m and the regression equation [Ln air-sea flux = 0.35 (±0.1) + 5.95 (±1.1); p = 0.01, R2 = 0.64, df = 6]. The shaded area represents the confidence interval (CI).
Response to Experimental CO2 Additions
In situ pCO2 ranged from 128 to 281 μatm (Table 1, Table S1), within reported in situ pCO2 across the Arctic Ocean (78 to 765 μatm; Bakker et al., 2016), and the experimentally-elevated pCO2 ranged from 178 to 1,096 μatm (Table S1), consistent with predicted scenarios of atmospheric CO2 by 2,100 (IPCC, 2014). The experimentally tested plankton communities represented variable biogeochemical parameters, from low-productivity communities supported by nutrient recycling sampled in August 2014, to pre-bloom, blooming and decay phases, sampled in May 2014 and 2015. All of the waters sampled were characterized by low salinity (< 34.3) and low temperatures (< 0.1°C), except in August 2014-1 (7°C), probably due to the proximity of surface waters to the WSC that transports warm Atlantic water mass.
Three of the experiments showed positive responses to CO2 additions, all of them for communities sampled in May (May 2014-1, May 2015-1, May 2015-2). These were characterized by the highest in situ GPP (6.2, 46, and 82.4 μmol O2 L−1 d−1, respectively), high Chl a concentration (7.9, 10.6, and 13 μg Chl a L−1), low pCO2 (< 193 μatm) and either low nutrient concentrations (0.7 μmol N L−1, 0.1 μmol P L−1, and 0.9 μmol Si L−1, in May 2014-1), depleted in nitrite and nitrate (0 NO3 + NO2, 0.1 PO4, 0.4 SiO4, in May 2015-1) or slightly higher nitrate, phosphate and silicate (1.7 NO3 + NO2, 0.3 PO4, 1.5 SiO4, in May 2015-2) (Table 1). In these three experiments the phytoplankton communities supported high cell density, with a dominance of diatoms in May 2015-1 and 2, such as the centric diatoms Thalassiosira sp. and Chaetoceros sp., and a community dominated by Phaeocystis sp. in May 2014-1 (Table 1). The GPP yield per μmol of added CO2 of every community tested was calculated as the slope of the fitted regression equations between GPP and the concentration of added CO2 (Table S1, Figure 2). The GPP yield per μmol added CO2 increased with increased GPP at in situ CO2 concentration, being 10-fold higher in spring than in summer (Figure 2).
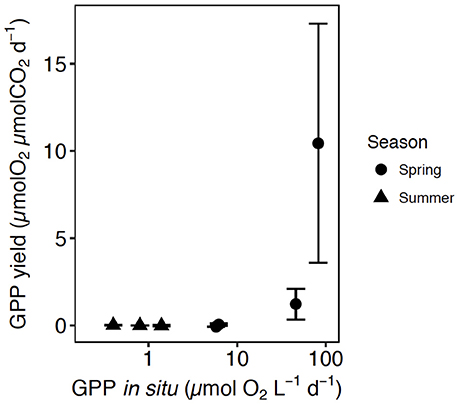
Figure 2. The relationship between the average (±SE) GPP yield per μmol of added CO2 in each community tested and the GPP at in situ pCO2. The shape corresponds with the communities tested in spring (circles) and summer (triangles).
The response of GPP to CO2 addition was negative in four of the seven experiments, including all of the experiments conducted in August and one experiment in May 2014 (2014-2, Table 1), with communities generally characterized by low GPP (from 5.8 to 0.4 μmol O2 L−1 d−1), low Chl a concentration (1.8 to 0.3 μg L−1), low pCO2 (ranging from 128 to 281 μatm) and low abundance of phytoplankton, dominated by diatoms such as Chaetoceros sp. and a presence of dinoflagellates, such as Protoperidinium sp. (Table 1). Dissolved inorganic nutrients concentrations were generally low (nitrite and nitrate ~0.7 μmol N L−1, phosphate ~0.1 μmol P L−1, and silicate ~0.6 μmol Si L−1), except for the experiment conducted in August 2014 (2014-1), which showed high nitrate (10.3 μmol N L−1) and silicate concentrations (4.8 μmol Si L−1), despite low in situ GPP (1.4 μmol O2 L−1 d−1).
A meta-analysis of the experimental results revealed consistent patterns in the responses observed. In particular, the response to CO2 enrichment, measured as the Ln effect size for GPP, increased significantly with the biomass of the communities tested (p = 0.002, R2 = 0.36, Figure 3A). The Ln effect size of GPP became positive, indicative of an increase in GPP under elevated CO2, during dense blooms with Chl a concentrations in excess of 7 μg Chl a L−1 (Figure 3A). The Ln effect size for GPP declined with increasing in situ pCO2 and became positive when the in situ pCO2 was below 150 μatm (Figure 3B). The strongest GPP stimulation was found in a community with intermediate GPP (6.2 ± 0.1 μmol O2 L−1 d−1, experiment May 2014-1) and dominated by Phaeocystis sp. (99.4% of the biovolume, Table 1, Table S1, Figure 4). Two diatom-dominated communities (51.5% and 76.6% of the microphytoplankton biovolume) with high GPP (46 ± 6 and 82.4 ± 11.4 μmol O2 L−1 d−1) were also stimulated by CO2 enrichment (May 2015-1 and May 2015-2 respectively, Table 1, Table S1). As a result of the CO2 unsaturated waters and the low atmospheric CO2 input (Figure 1), the turnover of CO2 pool in the communities tested, calculated as the slopes of fitted regression equations between the CO2 removal rates (in units of μmol CO2 L−1 d−1) and the concentration of added CO2, increased with increasing in situ GPP (Figure 5, Table S1).
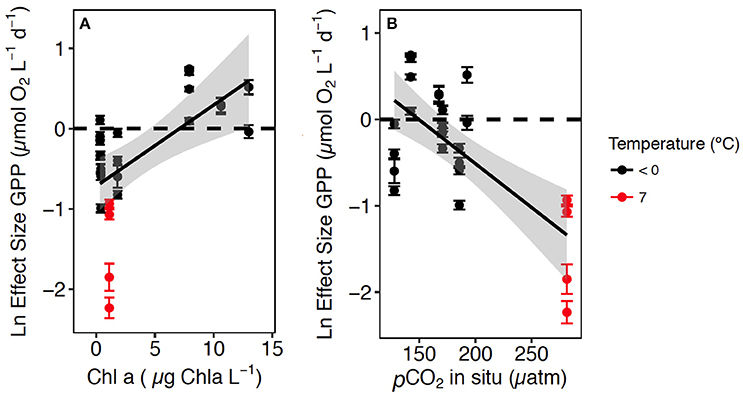
Figure 3. The relationship between the Ln Effect Size of GPP (±SE) and: (A) the in situ Chl a concentration in the communities tested and the regression equation [Ln Effect Size of GPP = −0.7 (±0.17) + 0.10 (±0.3) Chl a; R2 = 0.36, p = 0.002]; and (B) the in situ pCO2 and the regression equation [Log Effect Size of GPP = 1.52 (±0.43) – 0.01 (±0.00) in situ pCO2; R2 = 0.50, p = 0.0001] at temperature < 0°C in black and 7°C in red. The shaded area area represents the CI indicates de 95% confidence interval (CI) of the regression equation.
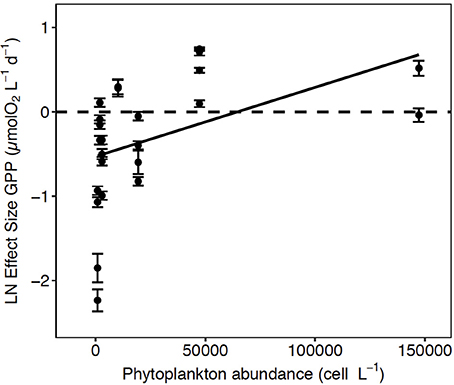
Figure 4. The Ln effect size of GPP (±SE) in relation to the total abundance of phytoplankton. The solid line represents the regression equation (p < 0.05, R2 = 0.20).
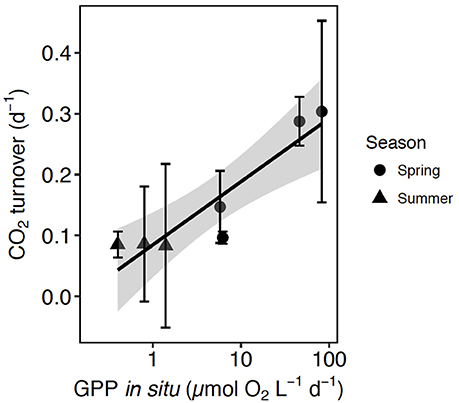
Figure 5. The relationship between CO2 turnover (± SE) and GPP at in situ pCO2 and the regression equation [CO2 turnover = 0.10 (±0.02) + 0.003 (±0.0005) GPP in situ, R2 = 0.87, p-value = 0.001], the shaded area indicates the 95% confidence interval (CI) of the regression equation. The shape corresponds with the communities tested in spring (circles) and summer (triangles).
Discussion
The atmospheric resupply of CO2 was far too slow to compensate for the observed biological drawdown of CO2 (19% of removal, Figure 1), resulting in low-CO2 waters at the end of the Arctic spring bloom (Kaltin et al., 2002; Bates et al., 2006; Bates and Mathis, 2009; Fransson et al., 2009, 2017). Upward CO2 supply from deeper layers was also likely to be low because the seasonal stratification produced by melting sea ice in the same area leads to small upward diffusive fluxes (Randelhoff et al., 2016). The large imbalances that we observed between net biological CO2 consumption and supply explain the sensitivity of the Arctic phytoplankton community to CO2 limitation. The time for photosynthetic removal of the CO2 pool, in the absence of recycling mechanisms, ranged from more than 10 days for the least productive communities to 3 days for communities in the most active phase of the spring bloom (Figure 5). Respiratory remineralization of CO2 was characteristically low during the spring bloom (40-fold lower than photosynthetic uptake, i.e., P/R = 43) as is the atmospheric input of CO2, leading to CO2 depletion, thereby creating the conditions for CO2 limitation during the spring bloom. The peak of the spring Arctic bloom was characterized by autotrophic communities with high net biological CO2 demand and high P/R ratios on average (43 ± 0.8) showed consistent with previous reports (Vaquer-Sunyer et al., 2013), with the communities acting as strong CO2 sinks during spring. In August, when recycling processes drive primary production, the average GPP-O2/R ratio (3 ± 0.7) was more than 10-fold lower than that in spring.
The plankton communities tested spanned a range of bloom stages according to the season and the location and yielded a broad diversity of responses to increased CO2, from increased GPP, generally observed (3 of 4 experiments) in the spring, along with a very high GPP yield per unit CO2 added, to suppression of GPP in the summer experiments. This is consistent with expectations, as high net biological demand for CO2 in spring, along with low resupply from low respiration rates and air-sea exchange, lead to a rapid CO2 depletion. In contrast, a closer balance between community production and respiration during the recycling mode, in summer, when communities are strongly nutrient-limited, relives them from CO2 limitation. The finding of a prevalence of suppression of GPP with CO2 enrichment in the summer was unexpected, as we expected no effect but not a negative one, which we are unable to explain and may in fact reflect pH-dependent processes, as CO2 enrichment leads to decrease in pH, rather than negative effects of CO2 itself.
The broad diversity of responses observed further allowed us, through a meta-analysis approach, to explore the conditions associated with CO2 limitation. In particular, we found that these divergent results were dependent on the biological demand for CO2 and the extent of CO2 depletion in the water column. These findings point at a shifting role of CO2 with seasons, supporting the hypothesis of the existence of transient time windows of CO2 limitation during highly productive periods in spring.
We observed the most negative effect size (i.e., suppression of GPP with addition of CO2) in a community sampled in warm surface water and slightly influenced by melting sea ice (with 7°C temperature and 34.3 salinity), likely indicating an influence of the WSC, transporting warm Atlantic water mass. This community supported low Chl a concentration and the highest pCO2 (281 μatm) observed in this study (Figures 3A,B). This negative result is consistent with the temperature-dependence of the response of GPP to CO2 reported by Holding et al. (2015), as well as with the temperature threshold of 5°C at which Arctic plankton communities have been shown to shift from autotrophic to heterotrophic (Holding et al., 2013). However, the mechanism through which added CO2 suppresses GPP is unclear. It may involve indirect effects of changes in pH on cellular composition (Taraldsvik and Myklestad, 2000) or the pH-dependence of the availability of other nutrients, such as trace metals (Saito and Goepfert, 2008; Shi et al., 2010; Xu et al., 2010, 2012). No or little response to CO2 enrichment was expected in waters with pCO2 near atmospheric equilibrium (Mercado and Gordillo, 2011). In turn, an increase in GPP with CO2 enrichment was expected in cold waters depleted in CO2 relative to atmospheric equilibrium but still containing enough dissolved inorganic nutrients to support primary production (Holding et al., 2015).
Our results showed that GPP increased by 32–72% (Table S1) on average when CO2 was supplied to blooming phytoplankton communities (Chl a > 7 μg L−1) supporting high CO2 demand (GPP > 6 μmol O2 L−1 d−1), and growing under low pCO2 (< 150 μatm) and in the presence of low, but inorganic nutrients concentrations. These conditions, found during the Arctic spring bloom, therefore, define those under which episodes episodic CO2 limitation is expected. It was previously found that the CO2 concentration limits photosynthesis of phytoplankton bloom episodes in semi-enclosed systems (Mercado and Gordillo, 2011), but the environmental conditions for CO2 limitation in Arctic communities have not yet been defined. Moreover, previous experimental results showed that increased CO2 concentrations may increase primary production in nutrient-poor communities (Hein and Sand-Jensen, 1997) and during nutrient-depleted conditions resulting in “carbon-overconsumption” (Taucher et al., 2015). Such carbon-overconsumption has been observed (Sambrotto et al., 1993; Banse, 1994) and has been associated with experimental nutrient stress (Taucher et al., 2012, 2015), suggesting that episodes of CO2 limitation could extend into the later phases of a bloom.
Enhanced GPP in response to elevated CO2 was observed in highly productive communities, one dominated by Phaeocystis sp. and two communities dominated by diatoms (Figure 4). However, the strongest enhancement was observed in the community dominated by Phaeocystis sp. (Table 1, Table S1), which is an important Arctic haptophyte that tends to be dominant close to drifting ice (Wassmann et al., 1999), and with increasing salinity and temperature following ice melt events (Lasternas and Agustí, 2010). Phaeocystis sp. is considered to have less-efficient carbon concentration mechanisms (CCMs) than diatoms do (Rost et al., 2008). Elevated CO2 produces a decrease in inorganic carbon affinity and leads to strong downregulation in the expression of CCMs in some eukaryotic algae, such that the diffusive entry of CO2 can be facilitated (Giordano et al., 2005; Reinfelder, 2010; Raven et al., 2011). This suggests a possible mechanism through which the GPP of Phaeocystis sp. and diatom communities are stimulated during CO2-enriched conditions. Besides, the abundance of Phaeocystis sp. was greatest when pCO2 concentrations were lower than 150 μatm, which can potentially influence competitions among phytoplankton species (Tortell et al., 2002), a possibility that was not evaluated in our study. Phaeocystis sp. replaces diatoms when the growth of diatoms is limited by the availability of silicic acid while other nutrients remain available to support growth of non-diatom taxa (Lasternas and Agustí, 2010). Recently, an under ice bloom in the Arctic dominated by Phaeocystis pouchetii was detected earlier than expected with subsequent decline of DIC (Assmy et al., 2017). Our results indicate that both Phaeocystis sp. and diatoms are sensitive to CO2 limitation during highly productive periods in the west of Svalbard shelf. Although we cannot extrapolate our results beyond the study area, they are nevertheless relevant because the European sector of the Arctic contributes 50% of the annual Arctic Ocean plankton production (Arrigo, 2007).
Our results suggest that increased atmospheric CO2 and the resulting increased air-sea CO2 supply may stimulate Arctic gross production of spring algal blooms under conditions of high biomass, high phytoplankton abundance, presence of nutrients and low pCO2. In contrast, increased CO2 may supress gross production during summer conditions, when phytoplankton biomass and production are low, although the mechanisms involved are unknown. Moreover, our results are consistent with previous reports that the response of primary production to increased CO2 is suppressed at water temperatures above 7°C (Holding et al., 2015). The expectation of GPP stimulation with increased CO2 during spring blooms assumes that the nutrient supply will not be affected by concurrent changes. Increased stratification, due to Arctic warming and freshening may reduce vertical nutrient supplies from deeper layers (Sarmiento et al., 2004; Wassmann, 2011; Randelhoff et al., 2017), possibly reducing the intensity and timing of the spring algal bloom and, therefore, its carbon demand and potential CO2 limitation. In contrast, areas currently covered by ice would, as the extent of ice continues to decline, support stronger algal spring blooms (Arrigo et al., 2008), which may experience episodic CO2 limitation. The greatest increases in primary production in a future Arctic are expected in the Eurasian perimeter (Slagstad et al., 2015). However, current models do not consider the effects of episodic CO2 limitation during the Arctic spring.
The global increase in CO2 seems to have stimulated the primary production of terrestrial plants on a global scale due to CO2 fertilization, possibly affecting the rate of increase in atmospheric CO2 concentration and global temperatures (Denman et al., 2007; Leggett and Ball, 2015) during the last 10 years (Keenan et al., 2016). However, the existence of this slow-down remains controversial (Cowtan and Way, 2014; Karl et al., 2015). Given the relevant role that the Arctic Ocean plays as a sink for atmospheric CO2 (Bates and Mathis, 2009), stimulation of Arctic GPP by CO2 during highly productive periods in spring may strengthen the Arctic CO2 sink and add, modestly, to biotic feedbacks that may affects global trends in atmospheric CO2. However, negative effects of CO2 on primary production of Arctic plankton communities in summer suggest that the “fertilization effect” of CO2 on Arctic plankton, resulting in enhanced primary production during the short, 2–3 weeks, period of the spring bloom, maybe offset by negative effects through the much longer, 2–3 months, recycling phase, with potentially negative effects for the ecosystem. Whereas the mechanisms leading to enhanced GPP in Arctic plankton with increased CO2 during spring appear clear, the mechanisms leading to suppression of GPP with CO2 enrichment during summer need be resolved.
Author Contributions
CD and MS-M designed the fieldwork and experiments. MS-M and PC executed the fieldwork and experiments. MS-M, PC, MC, EM, SK, and SA executed laboratory analyses. MS-M and CD analyzed the data and all authors contributed to the writing and editing of the manuscript.
Funding
This study is a contribution to the Carbon Bridge (RCN-226415) project funded by the Norwegian Research Council.
Conflict of Interest Statement
The authors declare that the research was conducted in the absence of any commercial or financial relationships that could be construed as a potential conflict of interest.
Acknowledgments
We thank the crew of R/V Helmer Hanssen, I. Hendriks, M. Vernet, E. Falk, H. Hodal, and A. Granados for their help. J. Holding and L. Meire for valuable comments and V. Unkefer for improvements to the text. MS-M was supported by a La Caixa Ph.D. fellowship.
Supplementary Material
The Supplementary Material for this article can be found online at: https://www.frontiersin.org/articles/10.3389/fmars.2018.00221/full#supplementary-material
References
Arrigo, K. R. (2007). “Chapter 7: Physical control of primary productivity in arctic and antarctic polynyas,” in Polynyas: Windows to the World, Vol. 74 (Berlin: Elsevier), 223–238.
Arrigo, K. R., van Dijken, G., and Pabi, S. (2008). Impact of a shrinking Arctic ice cover on marine primary production. Geophys. Res. Lett. 35, 1–6. doi: 10.1029/2008GL035028
Assmy, P., Fernández-Méndez, M., and Granskog, M. A. (2017). Leads in Arctic pack ice enable early phytoplankton blooms below snow-covered sea ice. Sci. Rep. 7:40850. doi: 10.1038/srep40850
Bakker, D. C. E., Pfeil, B., Landa, C. S., Metzl, N., O'Brien, K. M., Olsen, A., et al. (2016). A multi-decade record of high quality f CO2 data in version 3 of the Surface Ocean Co2 Atlas (SOCAT). Earth Syst. Sci. Data Discuss. 8, 383–413. doi: 10.5194/essd-8-383-2016
Banse, K. (1994). Uptake of inorganic carbon and nitrate by marine plankton and the Redfield Ratio. Global Biogeochem. Cycles 8, 81–84. doi: 10.1029/93GB02865
Bates, N. R., and Mathis, J. T. (2009). The Arctic Ocean marine carbon cycle: evaluation of air-sea CO2 exchanges, ocean acidification impacts and potential feedbacks. Biogeosciences 6, 2433–2459. doi: 10.5194/bg-6-2433-2009
Bates, N. R., Moran, S. B., Hansell, D. A., and Mathis, J. T. (2006). An increasing CO2 sink in the Arctic Ocean due to sea-ice loss. Geophys. Res. Lett. 33, 1–7. doi: 10.1029/2006GL027028
Bender, M. L., Grande, K., Johnson, K., Marra, J., Williams, P. J., Sieburth, J., et al. (1987). A comparison of four methods for determining planktonic community production. Limnol. Oceanogr. 32, 1085–1098. doi: 10.4319/lo.1987.32.5.1085
Bender, M. L., Orchardo, J., Dickson, M. L., Barber, R. T., and Lindley, S. (1999). In vitro O2 fluxes compared with 14C production and other rate terms during the JGOFS Equatorial Pacific experiment. Deep Res. Part I 46, 637–654.
Carpenter, J. H. (1965). The accuracy of the Winkler method for dissolved oxygen analysis. Limnol. Oceanogr. 10, 135–140.
Carritt, D. E., and Carpenter, J. H. (1966). Comparison and evaluation of currently employed modifications of the Winkler method for determining dissolved oxygen in seawater. J. Mar. Res. 24, 286–318.
Chierici, M., Fransson, A., and Anderson, L. G. (1999). Influence of m-cresol purple indicator additions on the pH of seawater samples: correction factors evaluated from a chemical speciation model. Mar. Chem. 65, 281–290. doi: 10.1016/S0304-4203(99)00020-1
Chierici, M., Fransson, A., Lansard, B., Miller, L. A., Mucci, A., Shadwick, E., et al. (2011). Impact of biogeochemical processes and environmental factors on the calcium carbonate saturation state in the Circumpolar Flaw Lead in the Amundsen Gulf, Arctic Ocean. J. Geophys. Res. Ocean 116, 1–12. doi: 10.1029/2011JC007184
Clayton, T. D., and Byrne, R. H. (1993). Spectrophotometric seawater pH measurements: total hydrogen ion concentration scale calibration of m-cresol purple and at-sea results. Deep Sea Res. Part I Oceanogr. Res. Pap. 40, 2115–2129. doi: 10.1016/0967-0637(93)90048-8
Cowtan, K., and Way, R. G. (2014). Coverage bias in the HadCRUT4 temperature series and its impact on recent temperature trends. Q. J. R. Meteorol. Soc. 140, 1935–1944. doi: 10.1002/qj.2297
Denman, K. L., Brasseur, G. P., Chidthaisong, A., Ciais, P., Cox, P. M., Dickinson, R. E., et al. (2007). “Couplings between changes in the climate system and biogeochemistry,” in Climate Change 2007: The Physical Science Basis. Contribution of Working Group I to the Fourth Assessment Report of the Intergovernmental Panel on Climate Change, eds S. Solomon, D. Qin, M. Manning, Z. Chen, M. Marquis, and K. B. Averyt (New York, NY; Cambridge: Cambridge University Press), 996.
Dickson, A. G. (1990). Standard potential of the reaction: AgCl (s)+ 1/2H2 (g) = Ag (s)+ HCl (aq), and the standard acidity constant of the ion in synthetic sea water from 273.15 to 318.15 K. J. Chem. Thermodyn. 22, 113–127. doi: 10.1016/0021-9614(90)90074-Z
Dickson, A. G., and Millero, F. J. (1987). A comparison of the equilibrium constants for the dissociation of carbonic acid in seawater media, Deep Sea Res. Part A. Oceanogr. Res. Pap. 34, 1733–1743.
Dickson, A. G., Sabine, C. L., and Christian, J. R. (2007). Guide to Best Practices for Ocean CO2 Measurements. Sidney: PICES Spec. Publ.
Engel, A., Borchard, C., Piontek, J., Schulz, K. G., Riebesell, U., and Bellerby, R. (2013). CO2 increases 14C primary production in an Arctic plankton community, Biogeosciences 10, 1291–1308. doi: 10.5194/bg-10-1291-2013
Fransson, A., Chierici, M., and Nojiri, Y. (2009). New insights into the spatial variability of the surface water carbon dioxide in varying sea ice conditions in the Arctic Ocean. Cont. Shelf Res. 29, 1317–1328. doi: 10.1016/j.csr.2009.03.008
Fransson, A., Chierici, M., Anderson, L. G., Bussman, I., Kattner, G., Jones, E. P., et al. (2001). The importance of shelf processes for the modification of chemical constituents in the waters of the Eurasian Arctic Ocean: implication for carbon fluxe. Cont. Shelf Res. 21, 225–242. doi: 10.1016/S0278-4343(00)00088-1
Fransson, A., Chierici, M., Skjelvan, I., Olsen, A., Assmy, P., Peterson, A. K., et al. (2017). Effects of sea-ice and biogeochemical processes and storms on under-ice water f CO2 during the winter-spring transition in the high Arctic Ocean: implications for sea-air CO2 fluxes. J. Geophys. Res. Ocean. 122, 5566–5587. doi: 10.1002/2016JC012478
Giordano, M., Beardall, J., and Raven, J. A. (2005). CO2 concentrating mechanisms in algae: mechanisms, environmental modulation, and evolution, Annu. Rev. Plant Biol. 56, 99–131. doi: 10.1146/annurev.arplant.56.032604.144052
Grande, K. D. (1988). The Use of the Stable Isotope, Oxygen-18, as a Tracer to Measure Gross Primary Production in Coastal and Oligotrophic Waters and in Monoclonal Cultures of Marine Phytoplankton. Kingston, RI: University of Rhode Island.
Hedges, L. V., Gurevitch, J., and Curtis, P. S. (1999). The meta-analysis of response ratios in experimental ecology. Ecology 80, 1150–1156. doi: 10.1890/0012-9658(1999)080[1150:TMAORR]2.0.CO;2
Hein, M., and Sand-Jensen, K. (1997). CO2 increases oceanic primary production. Nature 388, 526–527. doi: 10.1038/41457
Hodal, H., Falk-Petersen, S., Hop, H., Kristiansen, S., and Reigstad, M. (2012). Spring bloom dynamics in Kongsfjorden, Svalbard: nutrients, phytoplankton, protozoans and primary production. Polar Biol. 35, 191–203. doi: 10.1007/s00300-011-1053-7
Holding, J. M., Duarte, C. M., Arrieta, J. M., Vaquer-Suyner, R., Coello-Camba, A., Wassmann, P. F., et al. (2013). Experimentally determined temperature thresholds for Arctic plankton community metabolism. Biogeosciences 10, 357–370. doi: 10.5194/bg-10-357-2013
Holding, J. M., Duarte, C. M., Sanz-Martín, M., Mesa, E., Arrieta, J. M., Chierici, M., et al. (2015). Temperature dependence of CO2-enhanced primary production in the European Arctic Ocean. Nat. Clim. Chang. 5, 1079–1082. doi: 10.1038/nclimate2768
Hoppe, J. C. M., Schuback, N., Semeniuk, D. M., Maldonado, M. T., and Rost, B. (2017). Functional redundancy facilitates resilience of subarctic phytoplankton assemblages toward ocean acidification and high irradiance. Front. Mar. Sci. 4:229. doi: 10.3389/fmars.2017.00229
IPCC (2014). Climate Change 2014: Synthesis Report. Contribution of Working Groups, I., II and III to the Fifth Assessment Report of the Intergovernmental Panel on Climate Change.
IPCC Panel (2014). Climate Change 2014: Synthesis Report, Contribution, eds R. K. Pachauri, and L. A. Meyer, Geneva.
Juul-Pedersen, T., Arendt, K. E., Mortensen, J., Blicher, M. E., Søgaard, D. H., and Rysgaard, S. (2015). Seasonal and interannual phytoplankton production in a sub-Arctic tidewater outlet glacier fjord, SW Greenland. Mar. Ecol. Prog. Ser. 524, 27–38. doi: 10.3354/meps11174
Kaltin, S., and Anderson, L. G. (2005). Uptake of atmospheric carbon dioxide in Arctic shelf seas: Evaluation of the relative importance of processes that influence pCO2 in water transported over the Bering-Chukchi Sea shelf. Mar. Chem. 94, 67–79. doi: 10.1016/j.marchem.2004.07.010
Kaltin, S., Anderson, L. G., Olsson, K., Fransson, A., and Chierici, M. (2002). Uptake of atmospheric carbon dioxide in the Barents Sea. J. Mar. Syst. 38, 31–45. doi: 10.1016/S0924-7963(02)00168-9
Karl, T. R., Arguez, A., Huang, B., Lawrimore, J. H., McMahon, J. R., Menne, M. J., et al. (2015). Possible artifacts of data biases in the recent global surface warming hiatus. Science, 348, 1469–1472. doi: 10.1126/science.aaa5632
Keenan, T. F., Prentice, I. C., Canadell, J. G., Williams, C. A., Wang, H., Raupach, M. R., and Collatz, G. J. (2016). Recent pause in the growth rate of atmospheric CO2 due to enhanced terrestrial carbon uptake. Nat. Commun. 7:13428. doi: 10.1038/ncomms13428
Kroeker, K. J., Kordas, R. L., Crim, R. N., and Singh, G. G. (2010). Meta-analysis reveals negative yet variable effects of ocean acidification on marine organisms. Ecol. Lett. 13, 1419–1434. doi: 10.1111/j.1461-0248.2010.01518.x
Lasternas, S., and Agustí, S. (2010). Phytoplankton community structure during the record Arctic ice-melting of summer 2007. Polar Biol. 33, 1709–1717. doi: 10.1007/s00300-010-0877-x
Leggett, L. M. W., and Ball, D. A. (2015). Granger causality from changes in level of atmospheric CO2 to global surface temperature and the El Niño – Southern Oscillation, and a candidate mechanism in global photosynthesis. Atmos. Chem. Phys. Discuss. 15, 11571–11592. doi: 10.5194/acp-15-11571-2015
Mehrbach, C., Culberson, C. H., Hawley, J. E., and Pytkowicx, R. M. (1973). Measurement of the apparent dissociation constants of carbonic acid in seawater at atmospheric pressure, Limnol. Oceanogr. 18, 897–907. doi: 10.4319/lo.1973.18.6.0897
Mercado, J. M., and Gordillo, F. (2011). Inorganic carbon acquisition in algal communities: are the laboratory data relevant to the natural ecosystems? Photosynth. Res. 109, 257–267. doi: 10.1007/s11120-011-9646-0
Niebauer, H. J. (1991). Bio-physical oceanographic interactions at the edge of the Arctic ice pack. J. Mar. Syst. 2, 209–232. doi: 10.1016/0924-7963(91)90025-P
Oudot, C., Gerard, R., Morin, P., and Gningue, I. (1988). Precise shipboard determination of dissolved oxygen (Winkler procedure) for productivity studies with a commercial system. Limnol. Oceanogr. 33, 146–150. doi: 10.4319/lo.1988.33.1.0146
Parsons, T. R., Maita, Y., and Lalli, C. M. (1984). A Manual of Biological and Chemical Methods for Seawater Analysis. Oxford: Pergamon Press.
Pierrot, D., Lewis, E. R., and Wallace, D. W. R. (2006). MS Excel Program Developed for Co2 System Calculations, Carbon Dioxide Information Analysis Center, Oak Ridge National Laboratory. Oak Ridge: US Department of Energy.
Randelhoff, A., Fer, I., and Sundfjord, A. (2017). Turbulent upper-ocean mixing affected by meltwater layers during arctic summer. J. Phys. Oceanogr. 47, 835–853. doi: 10.1175/JPO-D-16-0200.1
Randelhoff, A., Fer, I., Sundfjord, A. J., Tremblay, E., and Reigstad, M. (2016). Vertical fluxes of nitrate in the seasonal nitracline of the Atlantic sector of the Arctic Ocean. J. Geophys. Res. Ocean. 121, 3372–3380. doi: 10.1002/2016JC011779
Raven, J. A., Giordano, M., Beardall, J., and Maberly, S. C. (2011). Algal and aquatic plant carbon concentrating mechanisms in relation to environmental change. Photosynth. Res. 109, 281–296. doi: 10.1007/s11120-011-9632-6
R Core Team (2014). R: A Language and Environment for Statistical Computing. Vienna: R Foundation for Statistical Computing.
Reigstad, M., Wassmann, P., Wexels Riser, C., Øygarden, S., and Rey, F. (2002). Variations in hydrography, nutrients and chlorophyll a in the marginal ice-zone and the central Barents Sea. J. Mar. Syst. 38, 9–29. doi: 10.1016/S0924-7963(02)00167-7
Reinfelder, J. R. (2010). Carbon concentrating mechanisms in eukaryotic marine phytoplankton. Ann. Rev. Mar. Sci. 3, 291–315. doi: 10.1146/annurev-marine-120709-142720
Riebesell, U., Wolf-Gladrow, D., and Smetacek, V. (1993). Carbon dioxide limitation of marine phytoplankton growth rates. Nature 361, 249.
Rost, B., Riebesell, U., and Sültemeyer, D. (2006). Carbon acquisition of marine phytoplankton: effect of photoperiod length. Limnol. Oceanogr. 51, 12–20. doi: 10.4319/lo.2006.51.1.0012
Rost, B., Zondervan, I., and Wolf-Gladrow, D. (2008). Sensitivity of phytoplankton to future changes in ocean carbonate chemistry: current knowledge, contradictions and research directions. Mar. Ecol. Prog. Ser. 373, 227–237. doi: 10.3354/meps07776
Saito, M. A., and Goepfert, T. J. (2008). Zinc-cobalt colimitation of Phaeocystis Antarctica. Limnol. Oceanogr. 53, 266–275. doi: 10.4319/lo.2008.53.1.0266
Sambrotto, R. N., Savidge, G., Robinson, C., Boyd, P., Takahashi, T., Karl, D. M., et al. (1993). Elevated consumption of carbon relative to nitrogen in the surface ocean. Nature 363, 248–250. doi: 10.1038/363248a0
Sarmiento, J. L., Slater, R., Barber, R., Bopp, L., Doney, S. C., Hirst, A. C., et al. (2004). Response of ocean ecosystems to climate warming, Global Biogeochem. Cycles 18, 1–23. doi: 10.1029/2003GB002134
Shi, D., Xu, Y., Hopkinson, B. M., and Morel, F. M. M. (2010). Effect of ocean acidification on iron availability to marine phytoplankton. Science 327(5966). 676–679. doi: 10.1126/science.1183517
Slagstad, D., Wassmann, P. F. J., and Ellingsen, I. (2015). Physical constrains and productivity in the future Arctic Ocean. Front. Mar. Sci. 2:85. doi: 10.3389/fmars.2015.00085
Spilling, K. (2007). Dense sub-ice bloom of dinoflagellates in the Baltic Sea, potentially limited by high pH. J. Plankton Res. 29, 895–901. doi: 10.1093/plankt/fbm067
Takahashi, T., Sutherland, S. C., Wanninkhof, R., Sweeney, C., Feely, R. A., Chipman, D. W., et al. (2009). Climatological mean and decadal change in surface ocean pCO2, and net sea-air CO2 flux over the global oceans. Deep. Res. Part II Top. Stud. Oceanogr. 56, 554–577. doi: 10.1016/j.dsr2.2008.12.009
Tamelander, T., Kivimäe, C., Bellerby, R. G. J., Renaud, P. E., and Kristiansen, S. (2009). Base-line variations in stable isotope values in an Arctic marine ecosystem: effects of carbon and nitrogen uptake by phytoplankton. Hydrobiologia 630, 63–73. doi: 10.1007/s10750-009-9780-2
Taraldsvik, M., and Myklestad, S. M. (2000). The effect of pH on growth rate, biochemical composition and extracellular carbohydrate production of the marine diatom Skeletonema costatum. Eur. J. Phycol. 35, 189–194. doi: 10.1080/09670260010001735781
Taucher, J., Jones, J., James, A. K., Brzezinski, M. A., Carlson, C. A., Riebesell, U., et al. (2015). Combined effects of CO2 and temperature on carbon uptake and partitioning by the marine diatoms Thalassiosira weissflogii and Dactyliosolen fragilissimus. Limnol. Oceanogr. 361, 901–919. doi: 10.1002/lno.10063
Taucher, J., Schulz, K. G., Dittmar, T., Sommer, U., Oschlies, A., and Riebesell, U. (2012). Enhanced carbon overconsumption in response to increasing temperatures during a mesocosm experiment. Biogeosciences 9, 3531–3545. doi: 10.5194/bg-9-3531-2012
Tortell, P. D., DiTullio, G. R., Sigman, D. M., and Morel, F. M. M. (2002). CO2 effects on taxonomic composition and nutrient utilization in an Equatorial Pacific phytoplankton assemblage. Mar. Ecol. Prog. Ser. 236, 37–43. doi: 10.3354/meps236037
Tremblay, J.-E., Michel, C., Hobson, K. A., Gosselin, M., Price, N. M., Michel, C., et al. (2006). Bloom dynamics in early opening waters of the Arctic Ocean. Limnol. Oceanogr. 51, 900–912. doi: 10.4319/lo.2006.51.2.0900
Vaquer-Sunyer, R., Duarte, C. M., Regaudie-De-Gioux, A., Holding, J. M., García-Corral, L. S., Reigstad, M., et al. (2013). Seasonal patterns in Arctic planktonic metabolism (Fram Strait - Svalbard region), Biogeosciences 10, 1451–1469. doi: 10.5194/bg-10-1451-2013
Viechtbauer, W. (2010). Conducting Meta-Analyses in R with the metafor Package. J. Stat. Softw. 36, 1–16. doi: 10.18637/jss.v036.i03
Wanninkhof, R. (1992). Relationship between wind speed and gas exchange over the ocean. J. Geophys. Res. Ocean 97, 7373–7382. doi: 10.1029/92JC00188
Wassmann, P. (2011). Arctic marine ecosystems in an era of rapid climate change. Prog. Oceanogr. 90, 1–17. doi: 10.1016/j.pocean.2011.02.002
Wassmann, P. F., Ratkova, T., Andreassen, I., Vernet, M., Pedersen, G., and Rey, F. (1999). Spring bloom development in the marginal ice zone and the central Barents Sea. Mar. Ecol. 20, 321–346. doi: 10.1046/j.1439-0485.1999.2034081.x
Wassmann, P., and Reigstad, M. (2011). Future Arctic Ocean seasonal ice zones and implications for pelagic-benthic coupling. Oceanography 24, 220–231. doi: 10.5670/oceanog.2011.74
Weiss, R. F. (1974). Carbon dioxide in water and seawater: the solubility of a non-ideal gas. Mar. Chem. 2, 203–215. doi: 10.1016/0304-4203(74)90015-2
Xu, Y., Shi, D., Aristilde, L., and Morel, F. M. M. (2012). The effect of pH on the uptake of zinc and cadmium in marine phytoplankton: possible role of weak complexes. Limnol. Oceanogr. 57, 293–304. doi: 10.4319/lo.2012.57.1.0293
Xu, Z., Zou, D., and Gao, K. (2010). Effects of elevated CO2 and phosphorus supply on growth, photosynthesis and nutrient uptake in the marine macroalga Gracilaria lemaneiformis (Rhodophyta). Bot. Mar. 53, 123–129. doi: 10.1515/BOT.2010.012
Keywords: CO2 limitation, gross primary production, Arctic Ocean, spring blooms, plankton communities, CO2 additions
Citation: Sanz-Martín M, Chierici M, Mesa E, Carrillo-de-Albornoz P, Delgado-Huertas A, Agustí S, Reigstad M, Kristiansen S, Wassmann PFJ and Duarte CM (2018) Episodic Arctic CO2 Limitation in the West Svalbard Shelf. Front. Mar. Sci. 5:221. doi: 10.3389/fmars.2018.00221
Received: 17 January 2018; Accepted: 08 June 2018;
Published: 06 July 2018.
Edited by:
Christopher Edward Cornwall, Victoria University of Wellington, New ZealandReviewed by:
Yuanyuan Feng, Tianjin University of Science and Technology, ChinaAndrew McMinn, University of Tasmania, Australia
Copyright © 2018 Sanz-Martín, Chierici, Mesa, Carrillo-de-Albornoz, Delgado-Huertas, Agustí, Reigstad, Kristiansen, Wassmann and Duarte. This is an open-access article distributed under the terms of the Creative Commons Attribution License (CC BY). The use, distribution or reproduction in other forums is permitted, provided the original author(s) and the copyright owner(s) are credited and that the original publication in this journal is cited, in accordance with accepted academic practice. No use, distribution or reproduction is permitted which does not comply with these terms.
*Correspondence: Marina Sanz-Martín, c2Fuem1hcnRpbi5tYXJpbmFAZ21haWwuY29t;bWFyaW5hQGltZWRlYS51aWItY3NpYy5lcw==