 Yuichiro Takeshita
 Tyler Cyronak
 Todd R. Martz
 Theodor Kindeberg
 Andreas J. Andersson
94% of researchers rate our articles as excellent or good
Learn more about the work of our research integrity team to safeguard the quality of each article we publish.
Find out more
ORIGINAL RESEARCH article
Front. Mar. Sci. , 22 May 2018
Sec. Coastal Ocean Processes
Volume 5 - 2018 | https://doi.org/10.3389/fmars.2018.00175
This article is part of the Research Topic Spatial and Temporal Variability of Seawater Chemistry in Coastal Ecosystems in the Context of Global Change View all 13 articles
There is a growing recognition for the need to understand how seawater carbonate chemistry over coral reef environments will change in a high-CO2 world to better assess the impacts of ocean acidification on these valuable ecosystems. Coral reefs modify overlying water column chemistry through biogeochemical processes such as net community organic carbon production (NCP) and calcification (NCC). However, the relative importance and influence of these processes on seawater carbonate chemistry vary across multiple functional scales (defined here as space, time, and benthic community composition), and have not been fully constrained. Here, we use Bermuda as a case study to assess (1) spatiotemporal variability in physical and chemical parameters along a depth gradient at a rim reef location, (2) the spatial variability of total alkalinity (TA) and dissolved inorganic carbon (DIC) over distinct benthic habitats to infer NCC:NCP ratios [< several km2; rim reef vs. seagrass and calcium carbonate (CaCO3) sediments] on diel timescales, and (3) compare how TA-DIC relationships and NCC:NCP vary as we expand functional scales from local habitats to the entire reef platform (10's of km2) on seasonal to interannual timescales. Our results demonstrate that TA-DIC relationships were strongly driven by local benthic metabolism and community composition over diel cycles. However, as the spatial scale expanded to the reef platform, the TA-DIC relationship reflected processes that were integrated over larger spatiotemporal scales, with effects of NCC becoming increasingly more important over NCP. This study demonstrates the importance of considering drivers across multiple functional scales to constrain carbonate chemistry variability over coral reefs.
Coral reefs provide ecosystem services worth trillions of dollars (Costanza et al., 2014) that are threatened by local (e.g., overfishing, eutrophication, sedimentation) and global anthropogenic stressors (e.g., climate change and ocean acidification; Hoegh-Guldberg et al., 2007; Wilkinson, 2008; Hughes et al., 2017). Coral reefs are thought to be particularly vulnerable to ocean acidification, largely because the ecosystem foundation is built from biogenically precipitated calcium carbonate (CaCO3) (Kleypas et al., 1999; Kleypas and Yates, 2009). Numerous experimental studies have demonstrated decreases in coral calcification rates (Chan and Connolly, 2013) and increases in rates of CaCO3 substrate and sediment dissolution (Andersson et al., 2009; Cyronak et al., 2013) under increasing seawater CO2 concentrations and decreasing pH. Thus, ocean acidification poses a direct threat to the ability of coral reef ecosystems to maintain positive CaCO3 accretion (Eyre et al., 2014). However, extrapolating and scaling these experimental results to in situ community and ecosystem scales poses multiple challenges (Andersson et al., 2015; Edmunds et al., 2016).
One of the challenges when making projections on how coral reefs will respond to ocean acidification on an ecosystem scale is the tightly coupled feedback between water column chemistry and benthic metabolic processes (Anthony et al., 2011; Kleypas et al., 2011; Albright et al., 2013; Andersson and Gledhill, 2013; Shaw et al., 2015; Takeshita, 2017). Coral reefs modulate the overlying seawater chemistry through two main metabolic processes: net community production (NCP) and net community calcification (NCC). NCP describes the balance of primary production and total respiration, whereas NCC describes the balance of calcification and CaCO3 dissolution. Metabolically driven variability of pH in many coral reef habitats over diel and/or seasonal timescales is often significantly larger than the projected mean decline in the open ocean due to ocean acidification over the next century. In addition to reef metabolism, reef pH variability is strongly modified by physical properties such as geomorphology, flow trajectory, flow rates and residence time, which alter properties such as biomass to water volume ratio and the contact time between seawater and the benthos (Falter et al., 2013; Lowe and Falter, 2015). However, the relative importance of these drivers and how they influence seawater carbonate chemistry variability over multiple functional scales, defined here as space, time, and benthic community composition, in the natural environment is not fully constrained.
Traditionally, NCP and NCC have been calculated by measuring changes in TA and DIC while characterizing residence time and water volume (Gattuso et al., 1996; Venti et al., 2012; Albright et al., 2015). This complicates our ability to study the feedbacks between benthic metabolism and carbonate chemistry variability, as both are derived from the same set of discrete measurements. Thus, an independent assessment of NCP and NCC would be useful. Recently, Takeshita et al. (2016) reported an autonomous system that simultaneously measures NCP and NCC using a boundary layer gradient flux approach. They observed significantly different ratios of NCC to NCP (NCC:NCP) over two different benthic communities, one dominated by calcifiers and the other dominated by non-calcifiers, directly demonstrating the effects of benthic community composition on metabolic ratios in situ. However, the relationship between benthic metabolism and water column chemistry was not assessed in that study. Here, we used the Bermuda coral reef platform as a case study to examine benthic metabolism and the variability of carbonate chemistry across multiple functional scales. Bermuda is a highly suitable location to conduct this study, as historical spatial data exist on the ecosystem scale (Andersson et al., 2014; Yeakel et al., 2015), residence time over the reef platform is constrained (Venti et al., 2012), and multiple estimates of NCC exist using independent approaches (Bates et al., 2010; Courtney et al., 2016, 2017). Seawater chemistry measurements were made across spatial scales ranging from a single point on a rim reef to the entire reef platform (10's of km2) over varying benthic communities, and over short-term (hourly to diel) and long-term (seasonal to interannual) time scales. We directly measured NCC and NCP using a gradient flux approach on the rim reef (Takeshita et al., 2016), and compared NCC:NCP to that inferred from discrete total alkalinity (TA) and dissolved inorganic carbon (DIC) measurements taken around this community. We also examined how patterns of TA and DIC changed on the community scale over different benthic habitats (i.e., a coral dominated rim reef vs. a seagrass bed), and compared the community scale metabolic footprints to those observed across the whole platform. This sampling approach allowed us to assess the variability in seawater carbonate chemistry and the NCC to NCP ratio across multiple functional scales.
The study was performed on the Bermuda coral reef platform in July, 2015. Specifically, sensors were deployed and discrete samples were taken near Hog Reef (32.457°N 64.845°W) located ~16 km northwest of the Bermuda Institute of Ocean Sciences (BIOS) research station, and in Bailey's Bay (32.350°N, 64.725°W), located ~3 km west of BIOS (Figure 1). Depth across Hog Reef ranged from ~4 to 25 m, with water depth increasing offshore toward northwest. Typically there is a MAPCO2 buoy that autonomously measures pCO2 at Hog Reef (T3; Figure 1), however, it was not operating at the time of this study due to maintenance. The benthic community composition from this site has been reported previously (MEP, 2007; Courtney et al., 2016) and consists of 27 ± 5% hard coral, 16 ± 2% soft coral, 35 ± 3% macroalgae, 20 ± 4% turf algae, and < 5% of sediments, rubble, and coralline algae. Bailey's Bay is a semi-enclosed bay, with water depth ranging from 1 to 3 m. Carbonate sediments dominate the bay with patches of increasing seagrass density occurring in the northeastern portion of the bay, predominantly composed of Thalassia testudinum. Carbonate chemistry data from Bailey's Bay have been reported previously (Cyronak et al., 2018a).
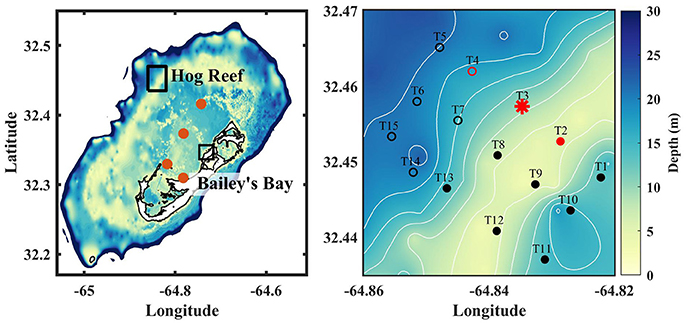
Figure 1. (Left) Bathymetry of the Bermuda coral reef platform. Water depth >200 m is represented as white. Brown circles represent the four time series stations where monthly surface discrete samples for DIC and TA were taken between 2007 and 2012 (Andersson et al., 2014). Hog reef and Bailey's Bay are outlined in black. (Right) Bathymetry of Hog reef; contours are every 3 m. Stations for the spatial survey are shown as black circles. Open circles represent deep stations (> 10 m) that were not included in the regression analysis of TA-DIC data (see main text). Red circles indicate sensor deployment sites; BEAMS was deployed at T3 (red star).
Autonomous sensors were deployed between July 12 and 30, 2015 at stations T2, T3, and T4, ranging in depth from ~4.5 m (T2) to 18.5 m (T4) (Table 1). pH was measured using either a SeaFET or SeapHOx (Bresnahan et al., 2014), based on the Honeywell Durafet combination electrode (Martz et al., 2010; Takeshita et al., 2014). SeapHOxes were deployed at T2 and T4, providing pH, O2, temperature, pressure, and salinity measurements every 15 min. At T3, pH, temperature (SeaFET), and photosynthetically active radiation (PAR; Wetlabs ECO-PAR) were measured. The pH sensors were calibrated pre-deployment in a holding tank overnight by collecting discrete samples for DIC and TA (n = 2) and using CO2SYS to calculate tank pH with equilibrium constants measured by Mehrbach et al. (1973), refit by Lueker et al. (2000). The accuracy of the sensor pH is estimated to be ± 0.015. Samples for DIC and TA were collected alongside the sensors at the time of recovery to assess sensor drift, and no drift was detected for any of the sensors. pH is reported on the total scale at in situ conditions.
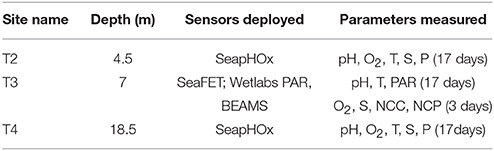
Table 1. Summary of sensor deployments for this study.
Benthic NCP and NCC at T3 were measured for 3 days between July 26 and 29, 2015 at 10 min intervals using the Benthic Ecosystem and Acidification Measurement System (BEAMS). BEAMS was deployed at 7 m depth. The details of this approach are explained elsewhere (McGillis et al., 2011; Takeshita et al., 2016), but will be summarized here. Gradients of O2, TA, and current velocity in the benthic boundary layer were used to calculate benthic NCP and NCC. The gradient in TA was estimated using simultaneous measurements of pH and O2 (Barnes, 1983; Takeshita et al., 2016), assuming a net photosynthetic quotient (Q) of 1, defined as ΔCO2/ΔO2. Studies from reefs worldwide have demonstrated that this ratio is near 1 in coral reefs (Kinsey, 1985; Falter et al., 2012). The pH and O2 at 20, 40, and 70 cm above the benthos were measured by sequentially pumping seawater from the respective heights through a single SeapHOx. The current velocity profile with 5 cm resolution was measured using an Aquadopp High Resolution 1 MHz current profiler at 1 Hz sampling frequency; current velocity profiles were averaged for 5 min to obtain a mean current velocity at 1 m above benthos, U0, and the friction velocity, . The mean drag coefficient, CD at this site was 0.012 ± 0.002. (CD = /U), which is in broad agreement with other reef measurements (Reidenbach et al., 2006; McGillis et al., 2011; Takeshita et al., 2016). NCP and NCC are reported in mmol O2 m−2 h−1 and mmol CaCO3 m−2 h−1, respectively. NCP-Irradiance and NCC-Irradiance curves were established by fitting an exponential relationship to the observed metabolic rates (Takeshita et al., 2016).
Surface DIC and TA samples were collected from 15 different stations, encompassing roughly 1.5 × 3 km area of Hog Reef (Figure 1). Three total spatial surveys were conducted for DIC and TA, one in the morning (~09:00) and afternoon (~15:00) on July 27, 2015, and one in the morning (~10:00) on July 29, 2015. All samples were collected within 1.5 h for each sampling interval. In addition to these spatial surveys, two transects between T1 and T5 were undertaken on July 13 (~17:00) and July 17 (~16:00).
Surface DIC and TA samples were collected in 250 ml borosilicate glass bottles. The bottles were rinsed with seawater three times before submerging to ~30 cm below the surface to collect the samples. The samples were preserved and stored following standard protocols (Dickson et al., 2007). Temperature, salinity, and oxygen were measured using a YSI Pro 2030 meter (Xylem) at each sampling location. DIC was analyzed using an Automated Infrared Inorganic Carbon Analyzer (AIRICA, Marianda, Inc.) equipped with a LI-COR infrared CO2 analyzer. Total alkalinity was determined by open-cell potentiometric acid titration using an 876 Dosimat (Metrohm) and Ecotrode Plus pH electrode (Metrohm) (Dickson et al., 2007). All samples were measured within 6 months of collection. Accuracy and precision of the measurements were assessed through routine measurements of Certified Reference Materials, provided by Prof. A. Dickson at Scripps Institution of Oceanography (Dickson et al., 2003). Accuracy was within ± 3 μmol kg −1 for both DIC and TA, whereas precision calculated as the standard deviation of replicate CRMs was ± 1.7 μmol kg −1 (n = 41) and ± 2.7 μmol kg −1 (n = 18), respectively. DIC and TA were normalized to salinity of 36.5 (Andersson et al., 2014), and the slope between nDIC and nTA was determined using a model II linear regression. The variability of carbonate chemistry at reef platform functional scale was assessed using data collected monthly between 2007 and 2012 at four time series sites across the Bermuda reef platform (Andersson et al., 2014; Figure 1).
Observed trends and variability in temperature, pH, and O2 were nearly identical between T2 and T3, whereas T4 was distinctly different from these stations (Figure 2). The mean temperature, salinity, pH, and O2 were similar at all sites (Table 2). Clear diel cycles in O2 and pH were observed at T2 and T3, with average diel ranges of 43 ± 12 (1σ) μmol kg−1 and 0.056 ± 0.016, respectively. The diel cycles were smaller at T4, with an average diel range of 22 ± 12 μmol kg−1 and 0.034 ± 0.017 for O2 and pH, respectively.
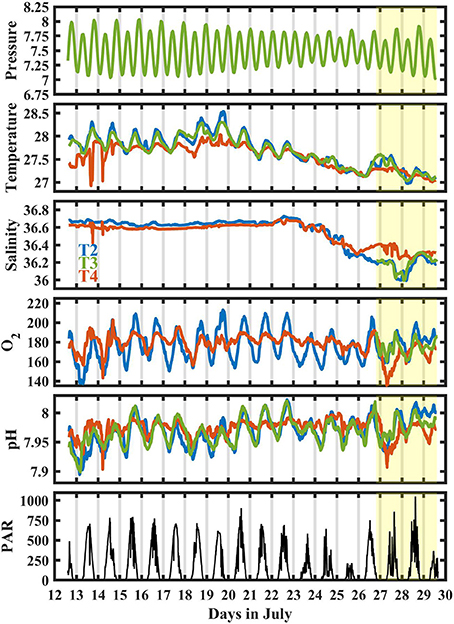
Figure 2. Time series at T2 (blue), T3 (green), and T4 (red) for pressure [dBar], temperature [Celsius], salinity, O2 [μmol kg−1], pH [total scale], and PAR at 11 m at T3 [μmol photons m−2 s−1]. Only pressure at T3 is shown for clarity. Shaded yellow represents when BEAMS was deployed.
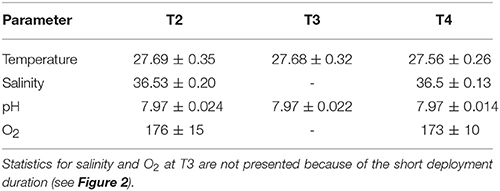
Table 2. Mean ± 1 σ of temperature [Celsius], salinity, pH [total], and O2 [μmol kg−1] from T2, T3, and T4.
Large, episodic shifts in O2 and pH were observed at T4 (e.g., July 14 and July 27), coincident with sharp changes in temperature and salinity. During these events, as observed on July 14, O2 and pH shifted by up to 30 μmol kg−1 and 0.08 within an hour, respectively. Overall, salinity was consistently around 36.6 for the first half of the deployment and decreased by ~0.6 during the second half of the deployment. A reduction in PAR and temperature associated with stormy weather was observed between July 23 and 26. Between July 26 and 29, salinity at T4 (15 m depth) was significantly higher and temperature slightly lower than at T2 and T3, indicating stratification.
A clear, consistent diel cycle in both NCP and NCC was observed, with positive NCP and NCC observed during the day, and negative NCP and variable NCC (positive or negative) near 0 observed during the night (Figure 3). On average, daytime NCP was 5.2 ± 9.2 (1 σ) mmol O2 m−2 h−1, and reached as high as 31.6 mmol O2 m−2 h−1 during peak daylight, whereas average daytime NCC was 3.8 ± 2.7 (1 σ) mmol CaCO3 m−2 h−1, and reached as high as 11.4 mmol CaCO3 m−2 h−1. On average, nighttime NCP was −11.7 ± 5.5 mmol O2 m−2 h−1, whereas nighttime NCC was 0.0 ± 2.8 mmol CaCO3 m−2 h1. Given that the precision of the BEAMS approach is ~3 mmol O2 (or CaCO3) m−2 h−1 (Takeshita et al., 2016), it cannot be quantitatively established whether Hog Reef experienced net dissolution at night. If NCC was calculated assuming Q = 1.1, then the average nighttime NCC becomes −1.4 ± 3.5 mmol CaCO2 m−2 h−1, indicating net dissolution during the night. However, since Q was not quantified during this study, this remains a source of uncertainty in the reported NCC. At the hourly scale, it is sometimes difficult to separate the biogeochemical processes from transient physical signals. For example, a negative anomaly for NCP and a positive anomaly for NCC were observed on the night of the 27th (Figure 3A). Although the origin of these signals remains unclear, they likely represent a physical process that temporarily negated the steady-state turbulent boundary layer assumption inherent in the gradient flux approach. In contrast, as discussed below, daytime transient signals associated with light are often well-understood and reflected in the measured NCC and NCP as one might expect. We have chosen to report daily integrated values here, and do not focus on the sub-daily patterns beyond their qualitative description.
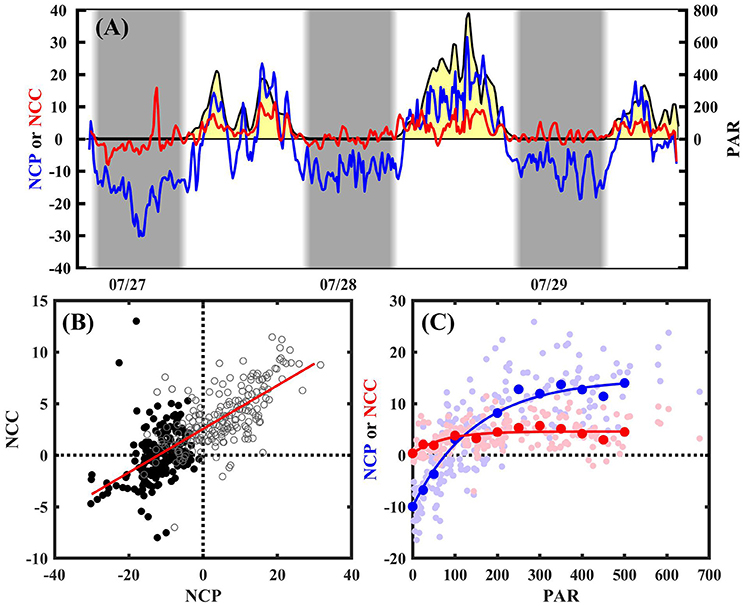
Figure 3. (A) Benthic NCP (blue; mmol O2 m−2 h−1), NCC (red; mmol CaCO3 m−2 h−1), and PAR (shaded yellow; μmol photons m−2 s−1) measured every 10 min at site T3. Gray background represents night time. (B) NCP vs. NCC during the day (open gray circles) and night (black circles). Model II regression is shown in red, with slope = 0.21 ± 0.01 (R2 = 0.48) (C) NCP-Irradiance (blue) and NCC-Irradiance (red) curve for daytime data. Small dots are individual measurements, whereas larger solid dots represent binned averages (0, 25, 50, then every 50 until 500). Solid lines represent fit.
A positive, linear relationship between NCC and NCP was observed (Figure 3B), with a slope of 0.21 ± 0.01 (R2 = 0.48). This slope changed to 0.08 ± 0.01 and 0.33 ± 0.01 when Q = 0.9 and 1.1, respectively. Both NCC and NCP were strongly correlated to light, and followed a simple exponential relationship (Platt et al., 1980; Takeshita et al., 2016):
The metabolic rates were dynamic and sensitive to changes in PAR, and effects were observed within minutes. For example, a sharp decrease followed by an increase in both NCC and NCP occurred concomitantly with changes in PAR associated with a passing rain-storm around noon on July 27 (Figure 3A). During this time, net respiration was observed for a brief period, while NCC decreased to near zero. Diel integrated NCP (ΣNCP) and NCC (ΣNCC) for July 27 and 28 were −123 and 38 mmol O2 m−2 d−1, and 45 and 63 mmol CaCO3 m−2 d−1, respectively. Both net heterotrophy and autotrophy over the course of a diel cycle were observed, whereas net calcification was observed for the duration of both days. The uncertainty for ΣNCP and ΣNCC is estimated to be ± 13 mmol O2 m−2 d−1 and ± 15 mmol CaCO3 m−2 d−1, respectively (Takeshita et al., 2016).
The results for the spatial surveys at Hog Reef are summarized in Table 3 and Figure 4. In general, temporal variability across the survey area followed a diel cycle, where on average, higher nDIC and lower O2 were observed during the morning (7/27 09:00 and 7/20 10:00) compared to the afternoon (7/27 16:00). Spatial distributions of O2 and DIC were inversely correlated (R2 = 0.80) whereas correlations between DIC and TA were less pronounced (R2 = 0.43; Figure 5). The slope of nTA and nDIC regression was 0.35 ± 0.24, which equates to a NCC:NCP of 0.21 (Figure 6), the same as the NCC:NCP ratio of 0.21 determined from BEAMS measurements. Samples taken from deep sites (water depth > 10 m; shown as open circles in Figure 4) were not included in the regression, because the water column at these sites was stratified at this time (Figure 2), thus, the benthic reef metabolism would have small or delayed effects on the water chemistry at the surface.
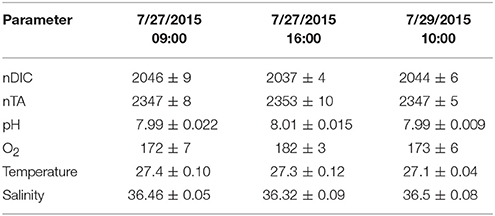
Table 3. Mean ± 1 σ of nDIC [μmol kg−1], nTA [μmol kg−1], pH [total scale], O2 [μmol kg−1], Temperature [Celsius], and Salinity for the three spatial surveys at Hog Reef.
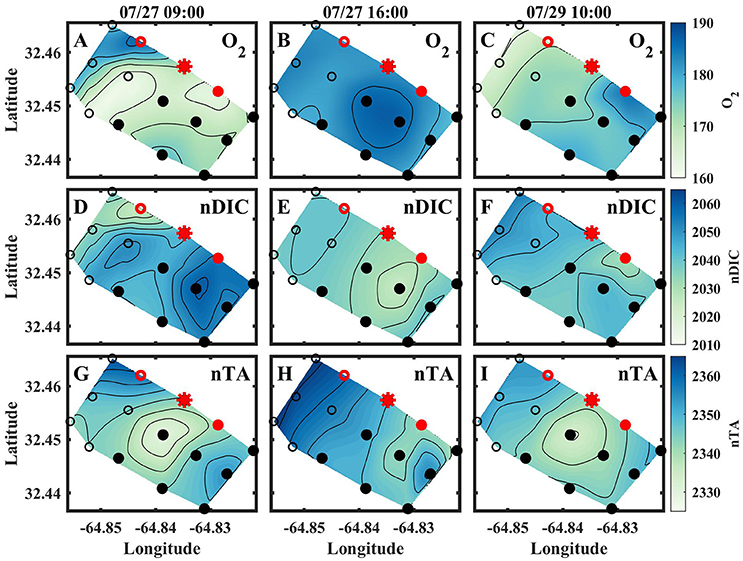
Figure 4. Spatial contour plots for O2 [μmol kg−1] (A–C), nDIC [μmol kg−1] (D–F), and nTA [μmol kg−1] (G–I) from the morning of July 27 (left column), afternoon of July 27 (middle column), and morning of July 29 (right column). Contours are 5 μmol kg−1 for all plots. Red indicates where sensors were deployed, and the red star indicates where BEAMS was deployed.
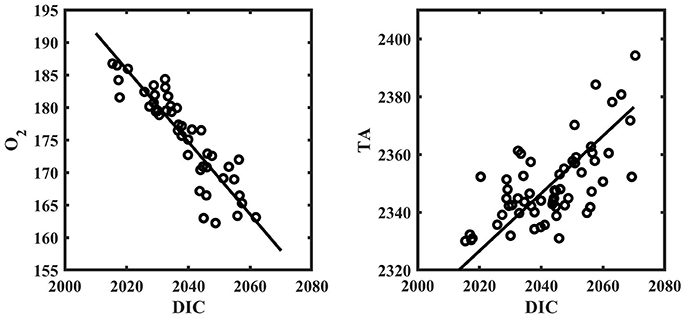
Figure 5. O2 [μmol kg−1] vs. DIC [μmol kg−1] (left) and TA [μmol kg−1] vs. DIC [μmol kg−1] (right) from spatial survey data around Hog Reef. Solid line represents model II regression. All samples from the spatial surveys are included.
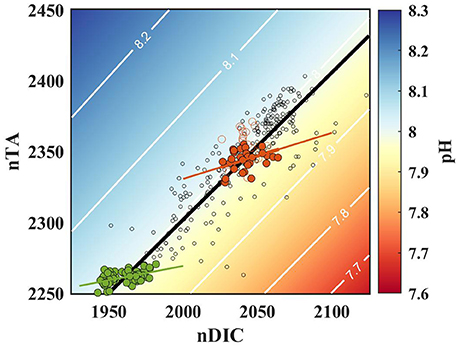
Figure 6. Salinity normalized (36.5) nDIC and nTA at Hog Reef (red circles), Bailey's Bay (green circles), and across the Bermuda coral reef platform between 2007 to 2012 (open black circles), and the resulting seawater pH (contours; salinity = 36.5, temperature = 27.5°C). Open red circles represent data from deep stations, and were not included in the model II regression. Solid red, green, and black lines represent model II regression for the Hog Reef, Bailey's Bay, and the reef platform, respectively.
Clear diel cycles in O2 and pH were observed at all sensor sites, suggesting that organic carbon metabolism was the dominant driver in chemical variability at Hog Reef. This is supported by a stronger correlation between O2 and DIC (R2 = 0.80) relative to TA and DIC (R2 = 0.43) from spatial surveys (Figure 5). The magnitude of biologically-driven diel variability in chemistry is a function of the imbalance of NCC and NCP, metabolic rates, water depth, and residence time. Greater imbalance of NCC and NCP, higher metabolic rates and longer residence times lead to larger changes in seawater chemistry, whereas increasing water depth proportionally reduces the changes, assuming a well-mixed water column. Qualitatively, the benthic cover at T4 was similar to that at the shallower sites, yet, T4 had a significantly smaller diel amplitude for both pH and O2 (Figure 2). This is mainly because T4 was the deepest site, and thus, the chemical signatures of the metabolic fluxes were diluted over a larger water column. It is worth noting that chemical variability at T4 was significantly affected by episodic events linked to transient physical processes (e.g., internal waves) as observed on July 14th (and July 27th) where O2 and pH decreased by > 30 μmol kg−1 and 0.08, respectively, within an hour coincident with sudden drops in temperature and salinity (Figure 2). This highlights the importance of episodic physical processes influencing high frequency temporal chemical variability over coral reefs.
Projections on how high frequency, diel pH variability at these sites will be affected in a future high CO2 world are dependent on a number of factors. First, changes in the relative proportion of NCC to NCP could either increase or decrease diel fluctuations in pH, where a lower NCC:NCP would lead to larger variability (Andersson and Gledhill, 2013). It is commonly hypothesized that NCC:NCP will decrease in the future due to shifts from coral to algae-dominated states (Hoegh-Guldberg et al., 2007; Enochs et al., 2015) and reductions in NCC due to ocean acidification (Chan and Connolly, 2013; Albright et al., 2016, 2018). These changes will most likely increase the difference between the daily extreme values relative to the mean pH due to increasing dominance by NCP over NCC, although, nighttime pH could be partially buffered due to increasing CaCO3 dissolution (Page et al., 2016). Furthermore, increased CO2 due to ocean acidification will lead to larger diel cycles in pH due to decreased buffering capacity of seawater (Jury et al., 2013; Shaw et al., 2013; Takeshita et al., 2015).
Short term BEAMS measurements demonstrated that NCC and NCP were tightly coupled over multiple days (Figure 3B), which is consistent with previous observations from various coral reefs (McMahon et al., 2013; Albright et al., 2015; Shaw et al., 2015; Takeshita et al., 2016). The NCC:NCP based on a model II regression between the two parameters was 0.21 ± 0.01, though this ratio calculated from O2 and pH measurements is dependent on the assumed Q, and varies between 0.08 and 0.33 when Q is set equal to 0.9 and 1.1, respectively (Figure 3). While previous studies from reefs worldwide demonstrate that Q is near 1 (Kinsey, 1985; Falter et al., 2012), the assumed Q remains a source of uncertainty of the calculated NCC from the BEAMS approach. Simultaneous measurements of pH, O2, and TA in an enclosure would allow direct observations of Q, however, properly sealing such enclosures in a natural reef environment is challenging (Nakamura and Nakamori, 2008), especially on hard substrate like at Hog Reef. Alternatively, simultaneous measurements of the pH, O2, and TA gradients in the turbulent benthic boundary layer would also quantify Q, as chemical gradients in the turbulent boundary layer are driven by benthic metabolism. However, autonomous TA sensing technology still remains in the prototype phase and is not widely available (Crespo et al., 2012; Spaulding et al., 2014; Briggs et al., 2017).
The ΣNCC determined from BEAMS (45 and 63 mmol CaCO3 m−2 d−1) was scaled up to an annual rate in order to compare with previously reported NCC rates at Hog Reef (Courtney et al., 2016). The seasonal variability in NCC was modeled by assuming that NCC at Hog Reef followed the standardized seasonal growth rate derived from colonies of D. labyrinthiformis and P. astreoides at Hog Reef over 2 years [Equation 1 in (Courtney et al., 2016)]. The standardized growth rate curve was multiplied by 37.65 mmol CaCO3 m−2 d−1 so that ΣNCC from the growth curve equaled the mean ΣNCC from BEAMS (53.5 ± 15 mmol CaCO3 m−2 d−1) on July 28th. The BEAMS-based annual NCC rate was 14.3 ± 4.0 mol CaCO3 m−2 year−1 (or 1.43 ± 0.40 kg CaCO3 m−2 year−1), which is in broad agreement with previously reported annual NCC rates using census-based (2.35 ± 1.01 kg CaCO3 m−2 year−1) and chemistry-based (2.23 ± 1.02 kg CaCO3 m−2 year−1) approaches (Courtney et al., 2016). However, given the limited deployment length of BEAMS during this study and the large variability in diel, seasonal, and interannual metabolic rates over coral reefs (Falter et al., 2008, 2012; Yeakel et al., 2015; Takeshita et al., 2016), caution needs to be exercised in the interpretation of these results. We suspect that the BEAMS-based annual NCC estimated here may be skewed low due to heavy rainfall on the first day of deployment, which depressed daytime NCC (Figure 3). Longer term deployment of BEAMS over seasonal to annual timescales would provide a more robust estimate of annual NCC rates, and the environmental drivers across multiple temporal scales ranging from hourly to seasonal timescales.
The relationship between TA and DIC has been proposed as an approach to calculate NCC:NCP over benthic communities, as NCC and NCP alter TA and DIC in known ratios (Deffeyes, 1965; Suzuki and Kawahata, 2003; Andersson and Gledhill, 2013; Cyronak et al., 2018b). Consequently, TA-DIC relationships reflect the relative balance of the inorganic to organic carbon cycles, which are functions of the community composition and metabolic rates. Higher slopes in TA vs. DIC indicate a higher NCC:NCP, and can be calculated using a simple equation (Koweek et al., 2015). Distinct TA-DIC relationships have been observed for well-defined communities in mesocosms with larger slopes for calcifying (e.g., corals, sediments, and calcifying algae) relative to non-calcifying communities (e.g., fleshy algae), and intermediate slopes for mixed communities of calcifiers and non-calcifiers (Anthony et al., 2013; Page et al., 2016; Lantz et al., 2017). However, it is not clear at what spatiotemporal scales TA and DIC samples should be collected in order to obtain a robust estimate of NCC:NCP in natural environments. At Hog Reef, we had an independent estimate of NCC:NCP from BEAMS, enabling us to assess this approach. When data were combined from all spatial surveys (spanning several km2 and multiple days), the derived NCC:NCP from TA-DIC data (0.21) was in agreement with direct measurements from BEAMS (0.21). However, linear regressions performed on individual surveys resulted in inconsistent estimates of the NCC:NCP, ranging from −2 to 2.1. This is most likely because multiple processes affect the carbonate chemistry variability on short temporal and small spatial scales of a few km2, such as local metabolic rates, advection, and mixing. Furthermore, metabolic rates are highly dynamic and can change drastically over minutes to hours, as demonstrated during the storm event on July 27 (Figure 3). The metabolic rates do not necessarily change at a constant ratio during these rapid events, as positive NCC and negative NCP were observed during this storm. One of our spatial surveys followed this rain-storm, most likely contributing to the variability observed in the slope of TA to DIC between individual surveys. Nonetheless, despite this variability from survey to survey, the slope of TA to DIC was consistent with the metabolic rates determined from BEAMS when data were taken over sufficiently large spatial scales and multiple days. This demonstrates the critical importance of collecting TA-DIC samples at the appropriate spatiotemporal scales to obtain accurate estimates of NCC:NCP over a given benthic community.
There are additional considerations when using this approach to assess NCC:NCP over specific benthic communities. For example, advection of a different water mass into the survey area could introduce chemical changes that do not reflect local benthic metabolism, but rather the signature of upstream communities. Thus, it is important to characterize the upstream chemical TA-DIC signature and carefully consider the dominant flow trajectory and mixing across multiple habitats (Watanabe et al., 2006). In addition, water depth can also affect the interpretation of TA-DIC relationship in several ways. First, deeper sites have a higher potential for stratification, as was observed at Hog Reef (open circles in Figure 4). When stratified, benthic chemical fluxes are not represented in surface samples and should not be included in regression analysis to determine benthic NCC:NCP of a specific community. Alternatively, samples could be collected near the bottom to minimize this effect and/or throughout the water column to characterize the vertical gradients for which actual fluxes could be approximated in certain environments (Andersson et al., 2007). Second, the magnitude of variability (but not the TA-DIC slope) is dependent on water depth and flow rates, as shallower depth and slower flow rates will allow for larger accumulation of chemical signatures. This has been well characterized and observed on reef flat environments (Shaw et al., 2012; McMahon et al., 2013; Kwiatkowski et al., 2016). A larger range in TA and DIC will lead to more robust linear regression results, and thus lower uncertainty in NCC:NCP. Such considerations are important for choosing appropriate study sites, defining the spatiotemporal scale of a study, and in interpreting TA-DIC and NCC:NCP data from various environments.
There is a growing recognition of the importance of examining biogeochemical processes across different functional scales (i.e., across time, space, and different benthic communities) on coral reefs to get a comprehensive understanding of the natural variability of seawater carbonate chemistry, the metabolic function of different habitats (e.g., net calcifying vs. net dissolving), and their ability to alleviate or exacerbate ocean acidification (Cyronak et al., 2018b). To place the current results into a broader context, we compared the TA-DIC relationships from Hog Reef with TA-DIC relationships from Bailey's Bay (similar spatiotemporal scales but different benthic communities) and across the entire Bermuda reef platform.
Spatial surveys were conducted at Hog Reef and Bailey's Bay (Cyronak et al., 2018a) over similar spatiotemporal scales (several days, and 100 s of m2 to several km2), with the major difference being the benthic community composition. Hog Reef has a higher abundance of calcifying organisms relative to Bailey's Bay, implying there should be a higher NCC:NCP at Hog Reef (Page et al., 2016; Lantz et al., 2017). As expected, the TA-DIC slope was higher at Hog reef (0.35; NCC:NCP = 0.21) relative to Bailey's Bay (0.20; NCC:NCP = 0.10), most likely explained by the different benthic communities between the two sites (Figure 6). These results demonstrate that carbonate chemistry variability on small spatial scales over diel timescales follow a TA-DIC relationship that is determined by local benthic metabolic processes (red and green line in Figure 6). However, the magnitude of change along this TA-DIC ratio is driven by metabolic rates that are strongly dependent on many other factors including light intensity (Gattuso et al., 1996; Takeshita et al., 2016), residence time, and water depth (Falter et al., 2013).
When we expand the spatiotemporal scale to the entire Bermuda reef platform, a different pattern for TA and DIC emerges (Figure 6). Andersson et al. (2014) presented surface TA and DIC data that were collected monthly at four time series stations across the reef platform between 2007 and 2012 (Figure 1), shown as black circles in Figure 6. The residence time over the Bermuda platform increases closer to shore, and was on the order of several days to a week near the time series stations (Venti et al., 2012). The sampling stations were chosen in locations that were not in the direct vicinity of highly productive benthic communities to minimize influence from local benthic fluxes. Therefore, the platform-scale data represent chemical variability that results from processes integrated over days to more than a week across multiple habitats around the reef platform, and thus, TA and DIC depletion is strongly correlated with residence time (Venti et al., 2012). The slope of the TA-DIC relationship at the platform-scale was 1.05 ± 0.04 (NCC:NCP = 1.1), which follows an isoline of pH at constant temperature and salinity, maintaining relatively constant pH as water traverses across the reef platform over multiple days. This is in contrast to both Hog Reef and Bailey's Bay, where TA-DIC relationships had a significantly lower slope which intersects pH-isolines, leading to clear diel cycles in pH (Figure 2). The platform-scale samples were collected monthly, which is significantly longer than the residence time of the water, yet a consistent slope in TA-DIC was observed. This implies that NCC:NCP at this spatiotemporal scale remains relatively consistent over seasonal to interannual timescales, although variability associated with larger scale oceanic and climatic process such as the North Atlantic Oscillation (NAO) is evident (Yeakel et al., 2015).
The TA-DIC slope on the platform-scale was significantly higher than at Hog Reef and Bailey's Bay, consistent with patterns observed from reefs globally, where TA-DIC slopes were typically higher when collected over larger spatial scales (Cyronak et al., 2018b). The larger slope is most likely driven by the longer residence time of seawater, i.e., the integration length for NCC and NCP. The metabolic ratios that determine the slope of TA-DIC are integrated over multiple days on the platform scale, whereas they represent instantaneous metabolic ratios on diel timescales over specific benthic habitats at Hog Reef and Bailey's Bay. In general, NCC:NCP increases with longer integration time because the influence of NCC on carbonate chemistry becomes more important than NCP when integrated over multiple days (Gattuso et al., 1999; Falter et al., 2013). This is because daytime organic production is nearly balanced by nighttime respiration over a diel cycle (i.e., ΣNCP ~0) (Kinsey, 1985; Gattuso et al., 1999; Falter et al., 2012), whereas NCC remains consistently positive over a day (ΣNCC > 0) (Figure 3). Therefore, if the residence time of the water is > 1 day, the chemical signature of ΣNCC accumulates disproportionately over ΣNCP, leading to a higher slope in TA-DIC. Given that the residence time for the platform-scale data were several days to a week (Venti et al., 2012), the TA-DIC slope was higher than those from smaller spatial surveys representing variability over diel cycles. It is possible that air-sea CO2 exchange plays a role on the platform scale, since gas exchange becomes more important with longer residence time. The effect of gas exchange would be to push the TA-DIC relationship toward a pCO2 isoline near atmospheric concentration. However, previous analysis has demonstrated that gas exchange plays a significantly smaller role than metabolism in Bermuda (Yeakel et al., 2015) and from reefs worldwide (Frankignoulle et al., 1996; Watanabe et al., 2006; Falter et al., 2013), thus it only plays a minor role in driving DIC variability on the platform scale.
The carbonate chemistry at any given point in time and space on the reef is determined through a combination of drivers that simultaneously operate across multiple functional scales. The platform-scale processes can be thought of as determining the “upstream” properties for different sections of the reef depending on location and recirculation patterns, whereas metabolism on local scales induces additional high frequency variability on diel timescales determined by benthic community composition, depth, and residence time. This poses a challenge for predicting future pH (or any CO2 parameter of interest) on coral reefs because it requires understanding of how biogeochemical feedbacks due to changes in benthic metabolism and physical processes interact across different spatiotemporal scales. For example, if the platform-scale ΣNCC:ΣNCP decreases, pH would increase as water travels across the reef platform, leading to a potential partial offset in ocean acidification on the platform-scale (Andersson et al., 2014). However, the TA-DIC relationship at the platform-scale is determined by multiple processes including the large-scale oceanographic processes such as the NAO (Yeakel et al., 2015) or Pacific Decadal Oscillation (PDO) (Pelejero et al., 2005) affecting rates and ratios of benthic metabolism across multiple habitats (Andersson et al., 2014; Andersson, 2015), making accurate predictions elusive but not unattainable. At the local-scale, a decrease in NCC:NCP due to changes in benthic community composition toward more algae-dominated states (Hoegh-Guldberg et al., 2007) would lead to larger diel cycles in pH. Understanding the relative strengths and interactions of such feedbacks is critical to project future seawater carbonate chemistry conditions on coral reefs.
The main objective of this study was to present carbonate chemistry variability and the relative importance of NCC:NCP affecting TA-DIC relationships across multiple functional scales, which is critical to better understand the implications of future acidification to coral reefs. At the community-scale [several km2 over day(s)], TA-DIC relationships were driven by local metabolism and community composition, where higher slopes of TA-DIC were observed at Hog Reef (coral reef) relative to Bailey's Bay (seagrass bed). The inferred NCC:NCP at Hog Reef using the TA-DIC data was in agreement with an independent measurement of benthic metabolism using a gradient flux approach when averaged over multiple days. The TA-DIC relationship had a significantly higher slope at the platform-scale, where the chemical variability reflected processes that were integrated over longer periods. This is most likely because the contribution from NCC on TA-DIC changes becomes increasingly important over NCP over longer integration timescales (Falter et al., 2013; Cyronak et al., 2018b). The results presented here demonstrate that drivers of carbonate chemistry variability cannot be viewed in isolation, but must be interpreted in the context of how they interact across overlapping functional scales.
YT, TC, TM, and AA: contributed to the development, planning, data collection, data analysis and interpretation; TK: analyzed and quality controlled the discrete samples. All authors contributed to the writing of the manuscript.
The authors declare that the research was conducted in the absence of any commercial or financial relationships that could be construed as a potential conflict of interest.
This work was funded by the National Science Foundation grants CRI-OA 1316047 (YT, TM), OCE 12-55042 (AA), and OCE 14-16518 (AA). TC gratefully thanks the Scripps postdoctoral scholarship for their support. YT thanks the Dave & Lucile Packard Foundation for supporting YT. We would like to thank Ashley Cyronak for helping with the sample collection. BEAMS, spatial surveys, and autonomous sensor data are available at BCO- DMO under project BEAMS.
Albright, R., Caldeira, L., Hosfelt, J., Kwiatkowski, L., Maclaren, J. K., Mason, B. M., et al. (2016). Reversal of ocean acidification enhances net coral reef calcification. Nature 531, 362–365. doi: 10.1038/nature17155
Albright, R., Langdon, C., and Anthony, K. R. N. (2013). Dynamics of seawater carbonate chemistry, production, and calcification of a coral reef flat, Central Great Barrier Reef. Biogeosciences 10, 7641–7676, doi: 10.5194/bgd-10-7641-2013
Albright, R., Benthuysen, J., Cantin, N., Caldeira, K., and Anthony, K. (2015). Coral reef metabolism and carbon chemistry dynamics of a coral reef flat. Geophys. Res. Lett. 42, 3980–3988. doi: 10.1002/2015GL063488
Albright, R., Takeshita, Y., Koweek, D. A., Ninokawa, A., Wolfe, K., Rivlin, T. et al. (2018). Carbon dioxide addition to coral reef waters suppresses net community calcification. Nature 555, 516–519. doi: 10.1038/nature25968
Andersson, A. J., Kline, D. I., Edmunds, P. J., Archer, S. D., Bednaršek, N., Carpenter, R. C., et al. (2015), Understanding ocean acidification impacts on organismal to ecological scales. Oceanography 25, 16–27. doi: 10.5670/oceanog.2015.27.
Andersson, A. J. (2015). A fundamental paradigm for coral reef carbonate sediment dissolution. Front. Mar. Sci. 2:52. doi: 10.3389/fmars.2015.00052
Andersson, A. J., and Gledhill, D. (2013). Ocean acidification and coral reefs: effects on breakdown, dissolution, and net ecosystem calcification. Ann. Rev. Mar. Sci. 5, 321–348. doi: 10.1146/annurev-marine-121211-172241
Andersson, A. J., Yeakel, K. L., Bates, N. R., and de Putron, S. J. (2014). Partial offsets in ocean acidification from changing coral reef biogeochemistry. Nat. Clim. Change 4, 56–61. doi: 10.1038/nclimate2050
Andersson, A. J., Bates, N. R., and Mackenzie, F. T. (2007). Dissolution of carbonate sediments under rising pCO2 and ocean acidification: observations from devil's hole, bermuda. Aquat. Geochem. 13, 237–264. doi: 10.1007/s10498-007-9018-8
Andersson, A. J., Kuffner, I. B., Mackenzie, F. T., Jokiel, P. L., Rodgers, K. S., and Tan, A. (2009). Net loss of CaCO3 from a subtropical calcifying community due to seawater acidification: mesocosm-scale experimental evidence. Biogeosciences 6, 1811–1823. doi: 10.5194/bg-6-1811-2009.
Anthony, K. R. N., Diaz-Pulido, G., Verlinden, N., Tilbrook, B., and Andersson, A. J. (2013). Benthic buffers and boosters of ocean acidification on coral reefs. Biogeosciences 10, 4897–4909. doi: 10.5194/bg-10-4897-2013
Anthony, K. R. N., Kleypas, J. A., and Gattuso, J.-P. (2011). Coral reefs modify their seawater carbon chemistry - implications for impacts of ocean acidification. Glob. Change Biol. 17, 3655–3666. doi: 10.1111/j.1365-2486.2011.02510.x
Barnes, D. J. (1983). Profiling coral reef productivity and calcification using pH and oxygen electrodes. J. Exp. Mar. Bio. Ecol. 66, 149–161. doi: 10.1016/0022-0981(83)90036-9
Bates, N. R., Amat, A., and Andersson, A. J. (2010). Feedbacks and responses of coral calcification on the Bermuda reef system to seasonal changes in biological processes and ocean acidification. Biogeosciences 7, 2509–2530. doi: 10.5194/bg-7-2509-2010
Bresnahan, P. J., Martz, T. R., Takeshita, Y., Johnson, K. S., and, LaShomb, M. (2014). Best practices for autonomous measurement of seawater pH with the Honeywell Durafet. Methods Oceanogr. 9, 44–60. doi: 10.1016/j.mio.2014.08.003
Briggs, E. M., Sandoval, S., Erten, A., Takeshita, Y., Kummel, A. C., and Martz, T. R. (2017). Solid state sensor for simultaneous measurement of total alkalinity and pH of seawater. ACS Sens. 2, 1302–1309. doi: 10.1021/acssensors.7b00305
Chan, N. C., and Connolly, S. R. (2013). Sensitivity of coral calcification to ocean acidification: a meta-analysis. Glob. Change Biol. 19, 282–290. doi: 10.1111/gcb.12011
Costanza, R., de Groot, R., Sutton, P., van der Ploeg, S., Anderson, S. J., Turner, I., et al. (2014). Changes in the global value of ecosystem services. Glob. Environ. Change 26, 152–158. doi: 10.1016/j.gloenvcha.2014.04.002
Courtney, T. A., Andersson, A. J., Bates, N. R., Collins, A., Cyronak, T., de Putron, S. J., et al. (2016). Comparing chemistry and census-based estimates of net ecosystem calcification on a rim reef in bermuda. Front. Mar. Sci. 3:181. doi: 10.3389/fmars.2016.00181
Courtney, T. A., Lebrato, M., Bates, N. R., Collins, A., de Putron, S. J., Garley, R., et al. (2017). Environmental controls on modern scleractinian coral and reef-scale calcification. Sci. Adv. 3:e1701356. doi: 10.1126/sciadv.1701356
Crespo, G. A., Ghahraman Afshar, M., and Bakker, E. (2012). Direct detection of acidity, alkalinity, and pH with membrane electrodes. Anal. Chem. 84, 10165–10169. doi: 10.1021/ac302868u
Cyronak, T., Andersson, A. J., Langdon, C., Albright, R., Bates, N. R., and Caldeira, K. (2018b). Taking the metabolic pulse of the world's coral reefs. PLoS ONE 13:e0190872. doi: 10.1371/journal.pone.0190872
Cyronak, T., Andersson, A. J., D'Angelo, S., Bresnahan, P., Davidson, C., White, A., et al. (2018a). Short-term spatial and temporal carbonate chemistry variability in two contrasting seagrass meadows: implications for pH buffering capacities. Estuar. Coasts doi: 10.1007/s12237-017-0356-5. [Epub ahead of print].
Cyronak, T., Santos, I. R., and Eyre, B. D. (2013). Permeable coral reef sediment dissolution driven by elevated p CO 2 and pore water advection. Geophys. Res. Lett. 40, 4876–4881. doi: 10.1002/grl.50948
Deffeyes, K. S. (1965). Carbonate equilibria: a graphic and algebraic approach1. Limnol. Oceanogr. 10, 412–426. doi: 10.4319/lo.1965.10.3.0412
Dickson, A. G., Sabine, C. L., and Christian, J. R., Eds. (2007). Guide to Best Practices for Ocean CO2 Measurements. PICES Special Publication. 3.
Dickson, A. G., Afghan, J. D., and Anderson, G. C. (2003). Reference materials for oceanic CO2 analysis: a method for the certification of total alkalinity. Mar. Chem. 80, 185–197. doi: 10.1016/S0304-4203(02)00133-0
Edmunds, P. J., Comeau, S., Lantz, C., Andersson, A., Briggs, C., Cohen, A., et al. (2016). Integrating the effects of ocean acidification across functional scales on tropical coral reefs. Bioscience 66:biw023. doi: 10.1093/biosci/biw023
Enochs, I. C., Manzello, D. P., Donham, E. M., Kolodziej, G., Okano, R., Johnston, L., et al. (2015). Shift from coral to macroalgae dominance on a volcanically acidified reef. Nat. Clim. Change 5, 1–9. doi: 10.1038/nclimate2758.
Eyre, B. D., Andersson, A. J., and Cyronak, T. (2014). Benthic coral reef calcium carbonate dissolution in an acidifying ocean. Nat. Clim. Change 4, 969–976. doi: 10.1038/nclimate2380
Falter, J. L., Lowe, R. J., Atkinson, M. J., and Cuet, P. (2012). Seasonal coupling and de-coupling of net calcification rates from coral reef metabolism and carbonate chemistry at Ningaloo Reef, Western Australia. J. Geophys. Res. Ocean. 117, 1–14. doi: 10.1029/2011JC007268
Falter, J. L., Lowe, R. J., Atkinson, M. J., Monismith, S. G., and Schar, D. W. (2008). Continuous measurements of net production over a shallow reef community using a modified Eulerian approach. J. Geophys. Res. 113, 1–14. doi: 10.1029/2007JC004663
Falter, J. L., Lowe, R. J., Zhang, Z., and McCulloch, M. (2013). Physical and biological controls on the carbonate chemistry of coral reef waters: effects of metabolism, wave forcing, sea level, and geomorphology. PLoS ONE 8:e53303. doi: 10.1371/journal.pone.0053303
Frankignoulle, M., Gattuso, J. P., Biondo, R., Bourge, I., Copin-Montegut, G., and Pichon, M. (1996). Carbon fluxes in coral reefs. 2. eulerian study of inorganic carbon dynamics and measurement of air-sea CO2 exchanges. Mar. Ecol. Prog. Ser. 145, 123–132. doi: 10.3354/meps145123
Gattuso, J. P., Allemand, D., and Frankignoulle, M. (1999). Photosynthesis and calcification at cellular, organismal and community levels in coral reefs: a review on interactions and control by carbonate chemistry. Am. Zool. 39, 160–183. doi: 10.1093/icb/39.1.160
Gattuso, J. P., Pichon, M., Delesalle, B., Canon, C., and Frankignoulle, M. (1996). Carbon fluxes in coral reefs. I. Lagrangian measurement of community metabolism and resulting air-sea CO2 disequilibrium. Mar. Ecol. Prog. Ser. 145, 109–121. doi: 10.3354/meps145109
Hoegh-Guldberg, O., Mumby, P. J., Hooten, A. J., Steneck, R. S., Greenfield, P., Gomez, E., et al. (2007). Coral reefs under rapid climate change and ocean acidification. Science 318, 1737–1742. doi: 10.1126/science.1152509
Hughes, T. P., Barnes, M. L., Bellwood, D. R., Cinner, J. E., Cumming, G. S., Jackson, J. B. C., et al. (2017). Coral reefs in the Anthropocene. Nature 546, 82–90. doi: 10.1038/nature22901
Jury, C. P., Thomas, F. I. M., Atkinson, M. J., and Toonen, R. J. (2013). Buffer capacity, ecosystem feedbacks, and seawater chemistry under global change. Water 5, 1303–1325. doi: 10.3390/w5031303
Kinsey, D. W. (1985). Metabolism, calcification and carbon production: 1 systems level studies. Fifth Int. Coral Reef Congr. 4, 505–526.
Kleypas, J. A., Buddemeier, R. W., Archer, D., Gattuso, J.-P., Langdon, C., and Opdyke, B. N. (1999). Geochemical consequences of increased atmospheric carbon dioxide on coral reefs. Science 284, 118–120. doi: 10.1126/science.284.5411.118
Kleypas, J. A., Anthony, K. R. N., and Gattuso, J.-P. (2011). Coral reefs modify their seawater carbon chemistry - case study from a barrier reef (Moorea, French Polynesia). Glob. Change Biol. 17, 3667–3678. doi: 10.1111/j.1365-2486.2011.02530.x
Kleypas, J., and Yates, K. (2009). Coral reefs and ocean acidification. Oceanography 22, 108–117. doi: 10.5670/oceanog.2009.101
Koweek, D. A., Dunbar, R. B., Monismith, S. G., Mucciarone, D. A., Woodson, C. B., and Samuel, L. (2015). High-resolution physical and biogeochemical variability from a shallow back reef on Ofu, American Samoa: an end-member perspective. Coral Reefs 34, 979–991. doi: 10.1007/s00338-015-1308-9
Kwiatkowski, L. R., Albright, J., Hosfelt, Y., Nebuchina, A., Ninokawa, T., Rivlin, T., et al. (2016). Interannual stability of organic to inorganic carbon production on a coral atoll. Geophys. Res. Lett. 43, 3880–3888. doi: 10.1002/2016GL068723
Lantz, C. A., Carpenter, R. C., Comeau, S., and Edmunds, P. J. (2017). Organisms composing an experimental coral reef community from mo'orea, french polynesia, exhibit taxon-specific net production: net calcification ratios. Front. Mar. Sci. 4:298. doi: 10.3389/fmars.2017.00298
Lowe, R. J., and Falter, J. L. (2015). Oceanic forcing of coral reefs. Ann. Rev. Mar. Sci. 7, 43–66. doi: 10.1146/annurev-marine-010814-015834
Lueker, T. J., Dickson, A. G., and Keeling, C. D. (2000). Ocean pCO2 calculated from dissolved inorganic carbon, alkalinity, and equations for K1 and K2: validation based on laboratory measurements of CO2 in gas and seawater at equilibrium. Mar. Chem. 70, 105–119. doi: 10.1016/S0304-4203(00)00022-0
Martz, T. R., Connery, J. G., and Johnson, K. S. (2010). Testing the honeywell durafet for seawater pH applications. Limnol. Oceanogr. Methods 8, 172–184. doi: 10.4319/lom.2010.8.172
McGillis, W. R., Langdon, C., Loose, B., Yates, K. K., and Corredor, J. (2011). Productivity of a coral reef using boundary layer and enclosure methods. Geophys. Res. Lett. 38, 1–5. doi: 10.1029/2010GL046179
McMahon, A., Santos, I. R., Cyronak, T., and Eyre, B. D. (2013). Hysteresis between coral reef calcification and the seawater aragonite saturation state. Geophys. Res. Lett. 40, 4675–4679. doi: 10.1002/grl.50802
Mehrbach, C., Culberson, C. H., Hawley, J. E., and Pytkowicz, R. M. (1973). Measurement of the apparent dissociation constants of carbonic acid in seawater at atmospheric pressure. Limnol. Oceanogr. 18, 897–907. doi: 10.4319/lo.1973.18.6.0897
MEP (2007). Marine Environmental Program Annual Report, 2006-2007. Bermuda Institute of Ocean Sciences. 80.
Nakamura, T., and Nakamori, T. (2008). Estimation of photosynthesis and calcification rates at a fringing reef by accounting for diurnal variations and the zonation of coral reef communities on reef flat and slope: a case study for the Shiraho reef, Ishigaki Island, southwest Japan. Coral Reefs 28, 229–250. doi: 10.1007/s00338-008-0454-8
Page, H. N., Andersson, A. J., Jokiel, P. L., Rodgers, K. S., Lebrato, M., Bahr, K. D., et al. (2016). Differential modification of seawater carbonate chemistry by major coral reef benthic communities. Coral Reefs 35, 1311–1325. doi: 10.1007/s00338-016-1490-4
Pelejero, C., Calvo, E., McCulloch, M. T., Marshall, J. F., Gagan, M. K., Opdyke, J. M., et al. (2005). Ocean science: preindustrial to modern interdecadal variability in coral reef pH. Science 309, 2204–2207. doi: 10.1126/science.1113692
Platt, T., Gallegos, C. L., and Harrison, W. G. (1980). Photoinibition of photosynthesis in natural assemblages of marine phytoplankton. J. Mar. Res. 38, 687–701.
Reidenbach, M. A., Monismith, S. G., Koseff, J. R., Yahel, G., and Genin, A. (2006). Boundary layer turbulence and flow structure over a fringing coral reef. Limnol. Oceanogr. 51, 1956–1968. doi: 10.4319/lo.2006.51.5.1956
Shaw, E. C., McNeil, B. I., and Tilbrook, B. (2012). Impacts of ocean acidification in naturally variable coral reef flat ecosystems. J. Geophys. Res. 117:C03038. doi: 10.1029/2011JC007655
Shaw, E. C., McNeil, B. I., Tilbrook, B., Matear, R., and Bates, M. L. (2013). Anthropogenic changes to seawater buffer capacity combined with natural reef metabolism induce extreme future coral reef CO2 conditions. Glob. Change Biol. 19, 1632–1641. doi: 10.1111/gcb.12154
Shaw, E. C., Phinn, S. R., Tilbrook, B., and Steven, A. (2015). Natural in situ relationships suggest coral reef calcium carbonate production will decline with ocean acidification. Limnol. Oceanogr. 60, 777–788. doi: 10.1002/lno.10048
Spaulding, R. S., DeGrandpre, M. D., Beck, J. C., Hart, R. D., Peterson, B., De Carlo, E. H., et al. (2014). Autonomous in situ measurements of seawater alkalinity. Environ. Sci. Technol. 48, 9573–9581. doi: 10.1021/es501615x
Suzuki, A., and Kawahata, H. (2003). Carbon budget of coral reef systems: an overview of observations in fringing reefs, barrier reefs and atolls in the Indo-Pacific regions. Tellus Ser. B Chem. Phys. Meteorol. 55, 428–444. doi: 10.1034/j.1600-0889.2003.01442.x
Takeshita, Y. (2017). Understanding feedbacks between ocean acidification and coral reef metabolism. J. Geophys. Res. Ocean. 122, 1639–1642. doi: 10.1002/2017JC012740
Takeshita, Y., Frieder, C. A., Martz, T. R., Ballard, J. R., Feely, R. A., Smith, J. E., et al. (2015). Including high-frequency variability in coastal ocean acidification projections. Biogeosciences 12, 5853–5870. doi: 10.5194/bg-12-5853-2015
Takeshita, Y., Martz, T. R., Johnson, K. S., and Dickson, A. G. (2014). Characterization of an ion sensitive field effect transistor and chloride ion selective electrodes for pH measurements in seawater. Anal. Chem. 86, 11189–11195. doi: 10.1021/ac502631z
Takeshita, Y. W., McGillis, E. M., Briggs, A. L., Carter, E. M., Donham, T. R., Smith, J. E., et al. (2016). Assessment of net community production and calcification of a coral reef using a boundary layer approach. J. Geophys. Res. Ocean. 121, 5655–5671. doi: 10.1002/2016JC011886
Venti, A. D., Kadko, A. J., Andersson, C., Langdon, C., and Bates, N. R. (2012). A multi-tracer model approach to estimate reef water residence times. Limnol. Oceanogr. Methods 10, 1078–1095. doi: 10.4319/lom.2012.10.1078
Watanabe, A. H., Kayanne, H., Hata, S., Kudo, K., Nozaki, K., Yamano, H., et al. (2006). Analysis of the seawater CO2 system in the barrier reef-lagoon system of Palau using total alkalinity-dissolved inorganic carbon diagrams. Limnol. Oceanogr. 51, 1614–1628, doi: 10.4319/lo.2006.51.4.1614
Wilkinson, C. (2008). Status of Coral Reefs of the World: 2008. Townsville, QLD: Global Coral Reef Monitoring Network and Reef and Rainforest Research Centre.
Keywords: coral reef biogeochemistry, carbonate chemistry variability, bermuda, beams, NCP and NCC
Citation: Takeshita Y, Cyronak T, Martz TR, Kindeberg T and Andersson AJ (2018) Coral Reef Carbonate Chemistry Variability at Different Functional Scales. Front. Mar. Sci. 5:175. doi: 10.3389/fmars.2018.00175
Received: 13 January 2018; Accepted: 02 May 2018;
Published: 22 May 2018.
Edited by:
Anas Ghadouani, University of Western Australia, AustraliaReviewed by:
Ruy Kenji Papa De Kikuchi, Universidade Federal da Bahia, BrazilCopyright © 2018 Takeshita, Cyronak, Martz, Kindeberg and Andersson. This is an open-access article distributed under the terms of the Creative Commons Attribution License (CC BY). The use, distribution or reproduction in other forums is permitted, provided the original author(s) and the copyright owner are credited and that the original publication in this journal is cited, in accordance with accepted academic practice. No use, distribution or reproduction is permitted which does not comply with these terms.
*Correspondence: Yuichiro Takeshita, eXVpQG1iYXJpLm9yZw==
Disclaimer: All claims expressed in this article are solely those of the authors and do not necessarily represent those of their affiliated organizations, or those of the publisher, the editors and the reviewers. Any product that may be evaluated in this article or claim that may be made by its manufacturer is not guaranteed or endorsed by the publisher.
Research integrity at Frontiers
Learn more about the work of our research integrity team to safeguard the quality of each article we publish.