 Yu Chen1,2,3†
 Yingying Huang4†
 Xuan Gao5†
 Yi Li4†
 Jing Lin1,2,3Lizhu Chen1,2,3Lianpeng Chang5
 Gang Chen3,6Yanfang Guan5Leong Kin Pan7,8
 Xuefeng Xia5Zengqing Guo1,2,3Jianji Pan2,3,9Yaping Xu5
 Xin Yi5Chuanben Chen2,3,9*†
- 1Department of Medical Oncology, Fujian Medical University Cancer Hospital & Fujian Cancer Hospital, Fuzhou, China
- 2Cancer Bio-immunotherapy Center, Fujian Medical University Cancer Hospital & Fujian Cancer Hospital, Fuzhou, China
- 3Fujian Provincial Key Laboratory of Translational Cancer Medicine, Fuzhou, China
- 4Fujian Medical University Cancer Hospital, Fuzhou, China
- 5Geneplus-Beijing, Beijing, China
- 6Department of Pathology, Fujian Medical University Cancer Hospital & Fujian Cancer Hospital, Fuzhou, China
- 7CCIC Group, Kuok Kim (Macao) Medical Center III, Macao, China
- 8Hui Xian Medical Center, Macao, China
- 9Department of Radiation Oncology, Fujian Medical University Cancer Hospital & Fujian Cancer Hospital, Fuzhou, China
Cyclin D1 (CCND1) amplification relevant to malignant biological behavior exists in solid tumors. The prevalence and utility of CCND1 amplification as a biomarker for the clinical response to treatment with immune checkpoint inhibitors (ICIs) are unknown. Our study is a preliminary investigation mainly focused on the predictive function of CCND1 amplification in the tumor microenvironment (TME) in the aspect of genome and transcriptome. We examined the prevalence of CCND1 amplification and its potential as a biomarker for the efficacy of ICI therapy for solid tumors using a local database (n = 6,536), The Cancer Genome Atlas (TCGA) database (n = 10,606), and the Memorial Sloan Kettering Cancer Center (MSKCC) database (n = 10,109). Comprehensive profiling was performed to determine the prevalence of CCND1 amplification and the correlation with the prognosis and the response to ICIs. A CCND1 amplification occurs in many cancer types and correlates with shorter overall survival and inferior outcomes with ICI therapy. Transcriptomic analysis showed various degrees of immune cell exclusion, including cytotoxic cells, T cells, CD8+ T cells, dendritic cells (DCs), and B cells in the TME in a TCGA CCND1 amplification population. The gene set enrichment analysis suggested that CCND1 amplification correlates with multiple aggressive, immunosuppressive hallmarks including epithelial–mesenchymal transition, transforming growth factor (TGF)-β signaling, KRAS signaling, phosphoinositide 3-kinase (PI3K)/AKT/mammalian target of rapamycin (mTOR) signaling, p53 pathway, and hypoxia signaling in solid tumors. These findings indicate that CCND1 amplification may be a key point related to immunosuppression in TME and multiple malignancy hallmarks, and it hinders not only the natural host immune responses but also the efficacy of ICIs.
Introduction
Immunotherapies targeting immune checkpoints have durable antitumor responses in multiple cancer types, which can contribute to a remarkable improvement in treatment outcomes in a subset of patients with advanced cancer (1). This led to the approval of therapeutic inhibitors of programmed cell death 1 (PD-1) pathway, pembrolizumab, nivolumab, and cemiplimab, and of the programmed cell death ligand 1 (PD-L1) pathway, atezolizumab, durvalumab, and avelumab, by the US Food and Drug Administration (FDA) for the treatment of advanced melanoma, non-small-cell lung cancer, renal cell carcinoma, head and neck squamous cell carcinoma (HNSCC), Hodgkin's lymphoma, squamous cell cancer of the skin, and urothelial bladder cancer. Despite this progress, only a minority of patients within each cancer subtype present with a durable response to immune checkpoint inhibitors (ICIs), and the molecular mechanisms of primary resistance remain incompletely understood (2).
The efficiency of PD-1/PD-L1 inhibitors depends on cancer-specific cytotoxic immune cell activation and infiltration into the tumor microenvironment (TME) (2). Cyclin D1 protein encoded by the CCND1 gene located on human chromosome 11q13.3 is the critical gatekeeping protein in charge of regulating the transition through the restriction point in the G1 phase to S phase of the cell cycle (3). The CCND1 gene is considered an oncogene, and it reinforces cell proliferation, growth, angiogenesis, and resistance to chemotherapy and radiotherapy (3, 4). Recently, several studies revealed that CCND1 amplification associates with a negative response to ICIs. In a study by Saada-Bouzid et al. (5), pretreatment tumor tissue samples from patients who present with hyper-progression after treatments of ICIs were retrospectively detected with next-generation sequencing (NGS). Three out of five patients presented with CCND1 amplification (5). A retrospective study of melanoma also showed that 30 out of 56 patients with innate resistance to anti-PD-1 therapy presented with CCND1 amplification (6). Although there are currently few reported cases, the clinical phenomena suggest the potential value of CCND1 amplification as a biomarker for predicting negative therapeutic effects of ICIs.
We hypothesized that CCND1 amplification may be associated with poor clinical benefits of ICI therapy through suppressing the antitumor immunity in TME. We mainly focused on the predictive function of CCND1 amplification in the TME in the aspect of genome and transcriptome. In this study, we performed an integrative analysis of The Cancer Genome Atlas (TCGA), Geneplus, and Memorial Sloan Kettering Cancer Center (MSKCC) databases to clarify the frequency of amplification of CCND1. Importantly, we aimed to explore whether CCND1 amplification correlates with a poor response to ICIs in solid tumors, for which the potential mechanism may be correlated with events within the TME.
Materials and Methods
Patient Populations
From August 12, 2015, through March 19, 2019, 6,536 tumor tissue samples from 6,536 patients with solid tumors underwent an NGS assay at Geneplus-Beijing (Beijing, China). All procedures were conducted in accordance with the Helsinki Declaration (7) and with approval from the Ethics Committee of Fujian Provincial Cancer Hospital. Written informed consent was obtained from all participants.
Tissue Processing and DNA Extraction
The germline genomic DNA of peripheral blood lymphocytes and frozen tissue samples was extracted using the DNeasy Blood & Tissue Kit (Qiagen, Hilden, Germany). The formalin-fixed, paraffin-embedded (FFPE) tissue samples were isolated using a commercially available kit (Maxwell® 16 FFPE Plus LEV DNA Purification, Qiagen, Hilden, Germany Kit, catalog: AS1135). The DNA concentration was measured using a Qubit fluorometer and the Qubit dsDNA HS (High Sensitivity) Assay Kit (Invitrogen, Carlsbad, CA, USA). The total DNA yield must be ≥1 μg, while 260/280 and 260/230 ratios are ≥1.8 and 2, respectively.
Library Preparation, Target Capture, and Next-Generation Sequencing
Sequencing was carried out using Illumina 2 × 75-bp paired-end reads on an Illumina HiSeq 3000 instrument according to the manufacturer's recommendations using the KAPA DNA Library Preparation Kit (Kapa Biosystems, Wilmington, MA, USA). Bar-coded libraries were hybridized to a customized panel of 1,021 genes containing whole exons and selected introns of 288 genes and selected regions of 733 genes (Table S1). The libraries were sequenced to a uniform median depth (>500×) and assessed for somatic variants including single-nucleotide variants (SNVs), small insertions and deletions (InDels), copy number alterations (CNAs), and gene fusions/rearrangements.
Next-Generation Sequencing Analysis
MuTect2 (version 1.1.4) (8) was employed to identify somatic InDels and SNVs. Contra (v2.0.8) (9) was used to identify CNAs. The CNA was expressed as the ratio of adjusted depth between ctDNA and germline DNA and analyzed using FACETS (10)-with log2ratio thresholds of 0.848 and −0.515 for gain and loss, respectively. Specifically, for the CCND1 gene, samples with chromosome 11q13.3 alterations were further reviewed for CNAs.
Data Sources
Solid tumors, which had CNAs identified in the data from 10,606 tumor tissue samples from 10,606 patients with solid tumors in the TCGA, were obtained from the Broad Institute Genomic Data Analysis Center (https://gdac.broadinstitute.org/). The TCGA cohort consisted of adrenocortical cancer (ACC, n = 90), bladder urothelial carcinoma (BLCA, n = 408), breast invasive carcinoma (BRCA, n = 1,080), cervical and endocervical cancer (CESC, n = 295), cholangiocarcinoma (CHOL, n = 36), colon and rectum adenocarcinoma (COADREAD, n = 616), esophageal carcinoma (ESCA, n = 184), glioblastoma multiforme (GBM, n = 577), HNSCC (n = 522), kidney chromophobe carcinoma (KICH, n = 66), kidney clear cell carcinoma (KIRC, n = 528), kidney papillary cell carcinoma (KIRP, n = 288), lower grade glioma (LGG, n = 513), liver hepatocellular carcinoma (LIHC, n = 370), lung adenocarcinoma (LUAD, n = 516), lung squamous cell carcinoma (LUSC, n = 501), mesothelioma (MESO, n = 87), ovarian serous cystadenocarcinoma (OV, n = 579), pancreatic adenocarcinoma (PAAD, n = 184), pheochromocytoma and paraganglioma (PCPG, n = 162), prostate adenocarcinoma (PRAD, n = 492), sarcoma (SARC, n = 257), skin cutaneous melanoma (SKCM, n = 367), stomach adenocarcinoma (STAD, n = 441), testicular germ cell tumor (TGCT, n = 150), thyroid carcinoma (THCA, n = 499), thymoma (THYM, n = 123), uterine corpus endometrial carcinoma (UCEC, n = 539), uterine carcinosarcoma (UCS, n = 56), and uveal melanoma (UVM, n = 80). Survival information (11) and RSEM-normalized gene-level data from cancers with CCND1 amplification frequency ranked first to 10th were further downloaded. The data of CHOL were excluded for a limited number of samples (n = 36). Patients with CCND1 amplification or neutral phenotypes were further analyzed. Patients with overall survival (OS) more than 10 days and gene-level data were enrolled as the TCGA pan-cancer cohort (n = 2,633). The TCGA pan-cancer cohort consisted of BLCA (n = 247), BRCA (n = 714), ESCA (n = 122), HNSCC (n = 359), LIHC (n = 277), LUSC (n = 292), OV (n = 145), SKCM (n = 203), and STAD (n = 274). OS was defined from the date of initial pathologic diagnosis.
We reviewed the CNA data from 10,109 solid tumor tissue samples from 10,109 patients in the MSKCC database who were enrolled as the MSKCC cohort (12). Survival information from cancers with CCND1 amplification frequency ranked first to 10th was further downloaded. These patients with an OS of more than 10 days were enrolled as the MSKCC pan-cancer cohort (n = 3,629). Their OS was defined from the date of initial pathologic diagnosis. A total of 1,105 patients treated at MSKCC who had received at least one dose of ICIs had an OS defined from the date of first infusion of any ICI and were enrolled as the MSKCC-IO cohort (13).
To explore the association between CCND1 amplification and the clinical outcomes of ICIs, we included CNA and clinical data from four clinical cohorts treated with ICIs. The first cohort consisted of 72 patients with melanoma treated with anti-cytotoxic T lymphocyte-associated protein 4 (CTLA-4) therapy (Allen cohort) (14). The second pooled cohort consisted of 464 melanoma patients treated with ICIs (Robert cohort treated with anti-PD-1/L1 or anti-CTLA-4 or combination therapy, Allen and Snyder cohorts treated with anti-CTLA-4 therapy, David cohort treated with anti-PD-1 therapy) (13–16).
Database Analysis for CCND1 and Tumor Mutational Burden
We analyzed the CNA in the TCGA and MSKCC cohorts. The CN changes, including putative biallelic CNA (+2) or putative biallelic neutral (0), identified using the GISTIC2 (17) algorithm in the TCGA samples and those using the FACETS (10) algorithm in the MSKCC samples, were the focus of our study. For the assessment of tumor mutational burden (TMB), the total number of somatic mutations identified was normalized to the exonic coverage of the respective MSK-IMPACT panel in megabases (13). Mutations in driver oncogenes were not excluded from the analysis (13). For each histology, cases in the top 20th, 40th, 60th, and 80th percentile of TMB were identified (13). Cases in the top 20th percentile of TMB within each histology were enrolled as the TMB-High group (n = 268).
Tumor Purity Estimate and Infiltration Levels of Immune Cells
To investigate the immune infiltration status of the tumors, we computed tumor purity using the ESTIMATE (18) (Estimation of STromal and Immune cells in MAlignant Tumor tissues using Expression data) method to analyze immune components and overall stroma in the TCGA pan-cancer cohort. To measure the relative levels of tumor-infiltrating lymphocyte subsets, we then employed gene expression-based computational methods to profile the infiltration levels of 25 immune cell populations in the TCGA pan-cancer cohort. Among the 25 immune cell populations, 24 immune cell populations were calculated using methods named Immune Infiltration Score (IIS) and T cell Infiltration Score (TIS), while infiltration of myeloid-derived suppressor cells (MDSCs) was calculated utilizing an algorithm named Tumor Immune Dysfunction and Exclusion (TIDE) (19, 20).
Gene Set Enrichment Analysis
Based on the hallmark gene sets (21), Gene Set Enrichment Analysis (GSEA) software version 3.0 (Broad Institute) (22) was used to identify the different regulated pathways between the CCND1 amplification and neutral groups in the TCGA pan-cancer cohort (|NES| > 1, NOM P-value <0.10, FDR q-value <0.25). For significantly enriched pathways in the amplification group, single-sample gene set enrichment analysis (ssGSEA) was used to calculate the enrichment score in individual samples. The rank-sum test was performed to evaluate the statistical difference.
Statistical Methods
Differences between the two groups were examined by two-tailed, unpaired t-test. Kaplan–Meier survival and multivariate Cox regression analyses were used to analyze associations between CCND1 status and survival. Log-rank tests were used to determine significant differences of survival curves stratified by TMB. Statistical analyses were performed using SPSS statistical software version 23.0 (SPSS) and Prism analysis and graphic software version 8.0.1 (GraphPad). A two-sided P-value of <0.05 was considered statistically significant.
Result
Distribution and Clinical Implication of the CCND1 Amplification Profile Landscape
We analyzed CCND1 amplification of 6,536 patients from the Geneplus 1,021 panel in a Chinese population and found that HNSCC had a high CCND1 amplification in 25.00% of the cases (7/28), followed by ESCA in 23.88% (16/67), BLCA in 9.76% (8/82), and melanoma in 6.67% of cases (6/90) (Figure 1A and Table S2). Comparison of CCND1 amplification in 10,606 patients from the TCGA database and 10,109 patients from the MSKCC database revealed that ESCA and breast carcinoma had the highest incidence in the TCGA patients at 34.78% (64/184) and MSKCC patients at 18.55% (228/1,229) databases, respectively (Figure 1A). Gene expression analysis from the TCGA database showed that CCND1 amplification was significantly related to the upregulation of mRNA expression of CCND1 across the top nine cancer types (TCGA pan-cancer: cancers with CCND1 amplification frequency ranked first to 10th; CHOL was excluded because of the limited number of samples) (Figure 1B).
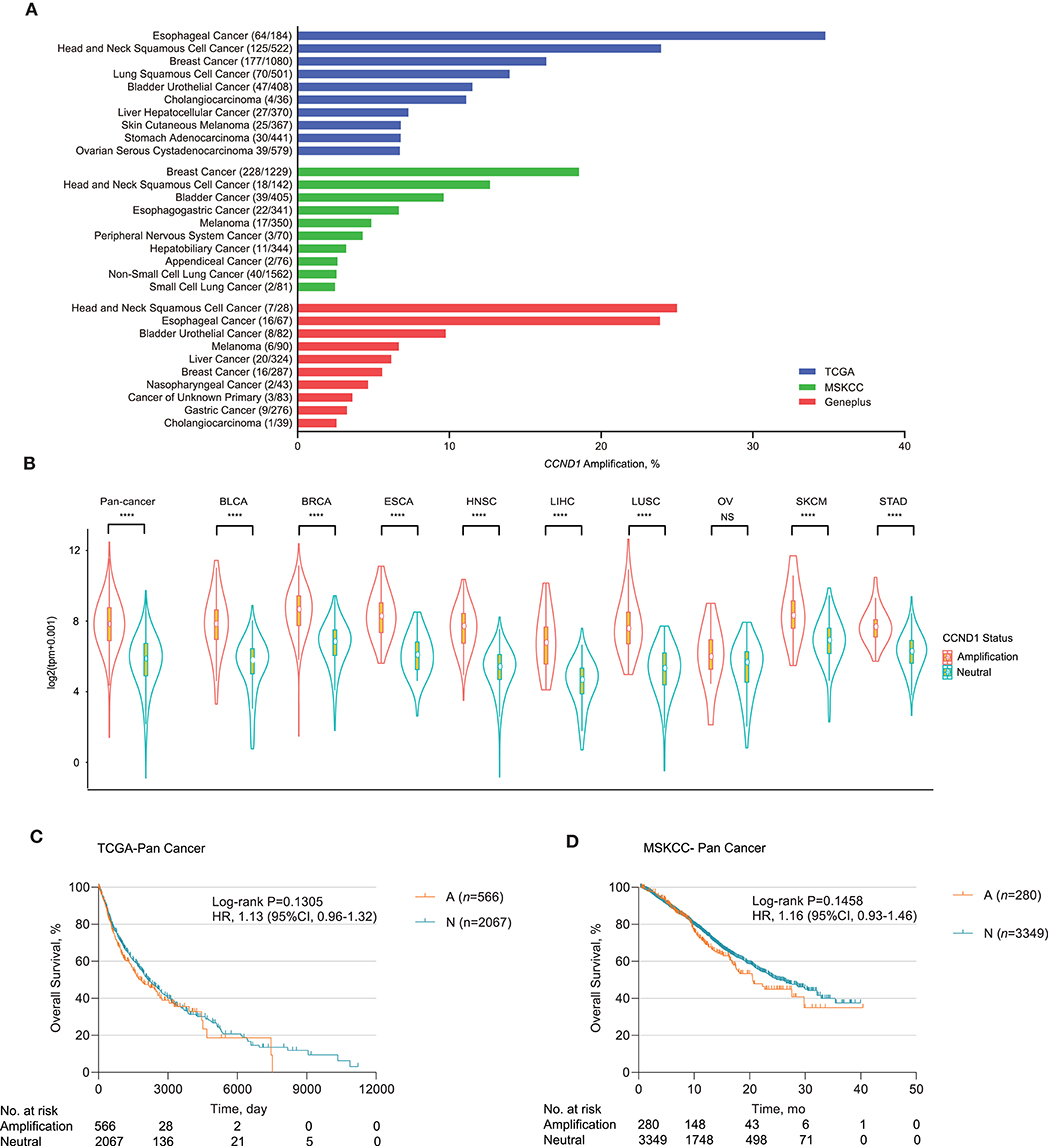
Figure 1. Profile of cyclin D1 (CCND1) amplification and association with prognosis. (A) Distribution of the top 10 cancer types with the frequency of CCND1 amplification in The Cancer Genome Atlas (TCGA) (n = 10,606), Memorial Sloan Kettering Cancer Center (MSKCC) (n = 10,109), and Geneplus (n = 6,536) databases. Cancers were sorted according to the frequency of CCND1 amplification. (B) The gene expression profile of CCND1 between the amplification group and the neutral group in the TCGA pan-cancer cohort (n = 2,633). The white dot represents the median value. The bottom and top of the violins are the 25th and 75th percentiles (interquartile range). Differences between the two groups were evaluated by unpaired t-tests. ns P ≥ 0.05; *P < 0.05; **P < 1 × 10⁻²; ***P < 1 × 10⁻³; ****P < 1 × 10⁻⁴. (C) Kaplan–Meier survival analysis of overall survival (OS) comparing the CCND1 amplification and neutral groups in patients in the TCGA pan-cancer cohort (n = 2,633). (D) Kaplan–Meier survival analysis of OS comparing the CCND1 amplification and neutral groups in patients in the MSKCC pan-cancer cohort (n = 3,629).
Next, we examined the association of CCND1 amplification with clinical outcome for pan-cancer in the TCGA and MSKCC databases. Kaplan–Meier survival analysis showed that CCND1 amplification was not associated with median OS for pan-cancer in the TCGA database. The median OS for the CCND1 amplification and CCND1 neutral groups was 1,838.0 and 2,133.0 days, respectively [P = 0.1305, HR 1.13 (95% CI 0.96–1.32); Figure 1C]. In the MSKCC database, the median OS for the CCND1 amplification and CCND1 neutral groups was 20.6 and 25.4 months, respectively [P = 0.1458, HR 1.16 (95% CI 0.93–1.46); Figure 1D]. We then further investigated the role of CCND1 amplification in specific cancer types. We did find a significantly decreased OS for HNSCC in the TCGA database. The median OS for the CCND1 amplification and CCND1 neutral groups was 1,079.0 and 2,002.0 days, respectively [P = 0.0125, HR 1.51 (95% CI 1.07–2.11); Figure S1A]. For melanoma in the MSKCC database, the median OS for the CCND1 amplification and CCND1 neutral groups was 13.5 months and not reached [P = 0.0139, HR 2.56 (95% CI 0.79–8.29); Figure S1B].
CCND1 Amplification Associated With Poor Prognosis in Patients Who Received Immune Checkpoint Inhibitors
We further explored the relationship between CCND1 amplification and the clinical outcomes of ICIs. Publicly available datasets were utilized for this analysis, including four melanoma clinical cohorts. The Allen cohort (14) included 72 patients with melanoma treated with anti-CTLA-4, among whom six patients were classified as CCND1 amplification; their disease-free survival (DFS) was inferior to that of 66 patients with the neutral phenotype [2.667 vs. 3.233 months, P = 0.1196, HR 2.001 (95% CI 0.5786–6.922); Figure S1C]. Then, we performed a pooled analysis on four melanoma cohorts treated with ICIs (the Robert cohort treated with anti-PD-1/L1 or anti-CTLA-4 or combination therapy, the Allen and Snyder cohorts treated with anti-CTLA-4 therapy, and the David cohort treated with anti-PD-1 therapy, n = 464) (13–16). A total of 31 patients were classified as having CCND1 amplification, and their median OS was significantly shorter than 433 patients with a CCND1 neutral status [18.51 vs. 32.27 months, P = 0.0426, HR 1.58 (95% CI 0.9163–2.724); Figure 2A].
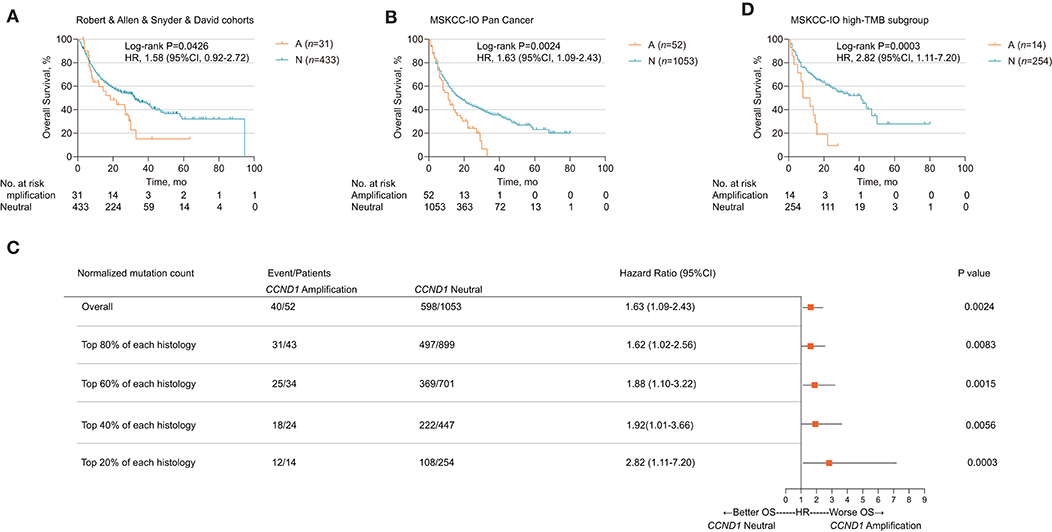
Figure 2. Association of cyclin D1 (CCND1) amplification with prognosis in the Memorial Sloan Kettering Cancer Center (MSKCC)-IO cohort. (A) Kaplan–Meier survival analysis of overall survival (OS) comparing the CCND1 amplification and neutral groups in patients with melanoma treated with immune checkpoint inhibitors (ICIs) from the Robert, Allen, Snyder, and David cohorts (n = 464). (B) Kaplan–Meier survival analysis of OS comparing the CCND1 amplification and neutral groups in patients with solid tumors treated with ICIs in the MSKCC-IO pan-cancer cohort (n = 1,105). (C) Hazard ratios of CCND1 status across patients with different levels of tumor mutational burden (TMB) in the MSKCC-IO pan-cancer cohort (n = 1,105). (D) Kaplan–Meier survival analysis of OS comparing the CCND1 amplification and neutral groups in patients with solid tumors treated with ICIs identified with top 20% TMB within each histology in the MSKCC-IO cohort (n = 268).
Based on the impact of CCND1 amplification as a negative prognostic factor for efficacy of ICIs in melanoma, we further investigated its role in patients with a solid tumor. To validate CCND1 amplification as a clinical factor associated with poor prognosis in patients with solid tumors treated with ICIs, we performed three analyses. First, a total of 1,105 patients with a variety of cancer types who had received MSKCC-IMPACT testing and at least one dose of ICIs were evaluated and named the MSKCC-IO cohort (13). Fifty-two patients with CCND1 amplification were identified comprising of 14 melanomas, 11 head and neck carcinomas (HNCs), 11 bladder carcinomas, eight non-small-cell lung carcinomas, five breast carcinomas, three esophagogastric carcinomas, and one glioma (Table S3). Across the entire cohort, CCND1 amplification was associated with a decreased OS. The median OS for the CCND1 amplification and CCND1 neutral groups was 11.0 and 18.0 months, respectively [P = 0.0024, HR 1.63 (95% CI 1.09–2.43); Figure 2B]. We performed a stratified analysis with the melanoma (n = 231) and bladder carcinoma patients (n = 111) and observed a similar association between CCND1 amplification with a shorter OS. In melanoma (n = 231), the median OS for the CCND1 amplification and CCND1 neutral groups was 22.0 and 42.0 months [P = 0.0029, HR 2.48 (95% CI 0.99–6.23); Figure S1D]. In bladder carcinoma (n = 111), the median OS for the CCND1 amplification and CCND1 neutral groups was 8.0 and 16.0 months, respectively [P = 0.0244, HR 2.17 (95% CI 0.83–5.66); Figure S1E].
Recent studies have shown that a high level of TMB associates with improved survival in patients receiving ICIs across a wide variety of cancer types (13, 23). We therefore explored the relationship between CCND1 amplification and TMB, and their interaction related to ICI efficacy. We compared the TMB between the CCND1 amplification group and the CCND1 neutral group in the MSKCC-IO cohort and found no difference between the two groups. The median TMB for the CCND1 amplification and CCND1 neutral groups was 6.79 vs. 5.90 (P = 0.46; Figure S2). We then prepared a stratified analysis of the MSKCC IO-cohort by the percentile of the TMB subgroup. A clear profile demonstrated that the CCND1 amplification patients did not benefit from ICIs regardless of TMB status (Figure 2C). Of note, according to a study by Robert M. Samstein et al. (13), in patients treated with ICIs, there is a significant association between a high level of TMB and a better OS. But in our stratified analysis, in spite of a high level of TMB, patients with CCND1 amplification have a significantly decreased median OS [10.0 vs. 41.0 months, HR 2.82 (95% CI 1.11–7.20), P = 0.0003; Figure 2D]. Finally, a multivariable analysis using Cox proportional-hazards regression demonstrated that CCND1 amplification was significantly associated with a shorter median OS [HR 1.60 (95% CI 1.16–2.21), P = 0.0040], with adjustment for TMB, cancer type, age, drug class of ICI, and the year of ICI start (Table S4).
Furthermore, we compared the OS in CCND1 amplification patients who received or did not receive ICIs. In the MSKCC cohort, data from Zehir et al. (12) reported 319 patients with CCND1 amplification and 46 cases received ICIs. We found that the ICI group has a shorter median OS than the non-ICI group [17.5 vs. 22.6 months, HR 1.258 (95% CI 0.75–2.10), P = 0.3411; Figure S3]. Taken together, this implies that ICIs would not be useful for treating the CCND1 amplification population.
CCND1 Amplification Is Significantly Associated With a Signature of Tumor Immunosuppression and Immune Cell Exclusion
Remarkable associations have been observed between the presence of immune cells, especially with tumor-specific T cell infiltration, and/or a T cell-associated inflammatory gene expression signature and the response to ICIs (23, 24). To assess the relationship between CCND1 amplification and the landscape of immune cell infiltration, we used an algorithm called ESTIMATE (18) to analyze the infiltrating fraction of stromal and immune cells in tumor samples from the TCGA pan-cancer cohort (n = 2,633). We found that the median ESTIMATE score in the CCND1 amplification group was significantly inferior to that in the neutral group (−849.10 vs. −696.23, P = 0.0051; Figure 3A). The analysis in nine individual cancer types showed that most cancer types exhibited a similar trend with the exception of melanoma, ESCA, and liver hepatocellular carcinoma. For example, in breast cancer, the CCND1 amplification group showed a lower median ESTIMATE score (−669.12 vs. −245.99, P = 0.0130; Figure 3A). In HNSCC, the CCND1 amplification group also exhibited a lower median ESTIMATE score (−849.10 vs. −716.92, P = 0.0190; Figure 3A).
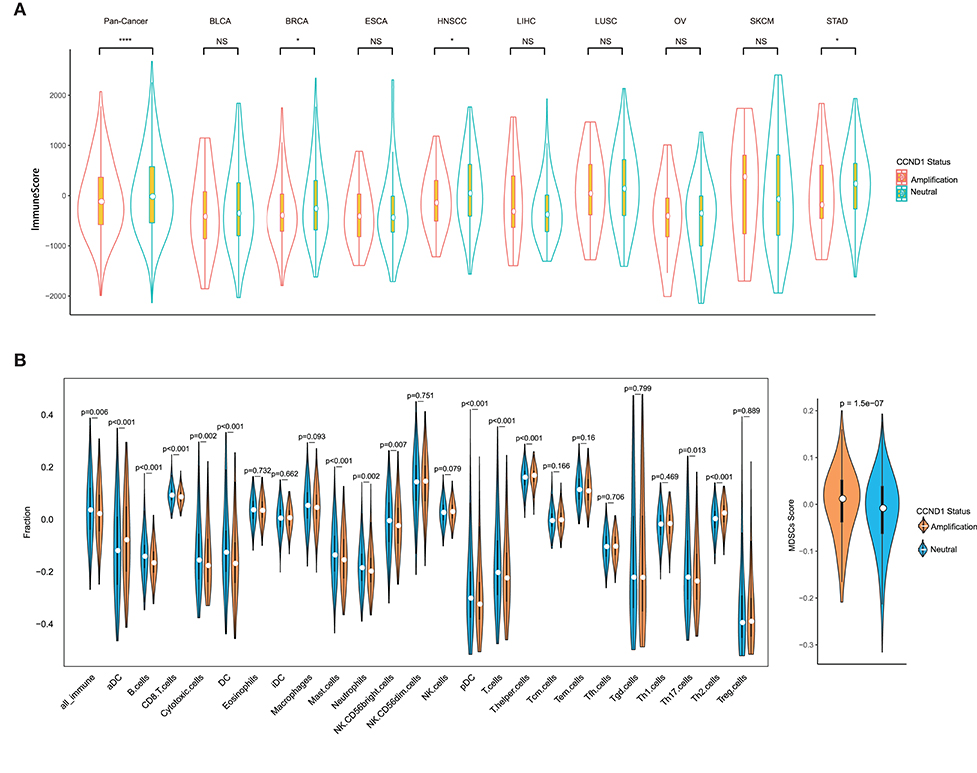
Figure 3. Tumor purity estimate and infiltration levels of immune cells in The Cancer Genome Atlas (TCGA) pan-cancer cohort. (A) The ESTIMATE (Estimation of STromal and Immune cells in MAlignant Tumor tissues using Expression data) score of cancers between the cyclin D1 (CCND1) amplification group and the neutral group in TCGA pan-cancer cohort (n = 2,633). The white dot represents the median value. The bottom and top of the violins are the 25th and 75th percentiles (interquartile range). Differences between the two groups were evaluated by unpaired t-tests. ns P ≥ 0.05; *P < 0.05; **P < 1 × 10⁻²; ***P < 1 × 10⁻³; ****P < 1 × 10⁻⁴. (B) The measurement of the infiltration levels of 25 immune cell populations between the CCND1 amplification group and the neutral group in the TCGA pan-cancer cohort (n = 2,633). The median white dot represents the median value, while the upper and lower represent the minimum and maximum values. Differences between the two groups were evaluated by unpaired t-tests.
To further characterize the levels of distinct immune cell subsets and the signals that are chemotactic for them, we employed a gene expression-based computational method to dissect infiltration of 25 immune cell subsets in the TCGA pan-cancer cohort (19, 20). Strikingly, the analysis of the transcriptomes revealed that, compared with the CCND1 neutral group, the CCND1 amplification group had a decrease in the median value of CD8+ T cells (0.0854 vs. 0.0920, P < 0.001), cytotoxic cells (−0.1772 vs. −0.1564, P = 0.0020), dendritic cells (DCs) (−0.1692 vs. −0.1266, P < 0.001), plasmacytoid DC cells (pDCs) (−0.3249 vs. −0.3020, P < 0.001), and B cells (−0.1666 vs. −0.1419, P < 0.001). There was an increase in T helper cells (0.1677 vs. 0.1603, P < 0.001), regulatory T (Treg) cells (0.0240 vs. −0.3954, P = 0.8890), activated dendritic cell (−0.0787 vs. 0.0356, P < 0.001), and MDSCs (0.0115 vs. −0.0087, P < 0.001) (Figure 3B).
In the subtype analysis of 25 immune cell components in nine tumor types, we found that various degrees of tumor microenvironmental immunosuppression occurs (Figure S4). For example, the median values of B cells (−0.1870 vs. −0.1691, P < 0.001), T cells (−0.2160 vs. −0.1935, P = 0.0090), CD8+ T cells (0.0914 vs. 0.1009, P < 0.001), and DC cells (−0.1810 vs. −0.1465, P = 0.0170) were significantly attenuated in the CCND1 amplification group in breast cancer, while Th2 cells (0.05419 vs. 0.0148, P < 0.001) and MDSCs (0.0051 vs. −0.0198, P = 0.0094) appear upregulated (Figure S4). The signature of immune cell subsets in HNSCC showed a dramatic decrease in median values of cytotoxic cells (−0.1418 vs. −0.0970, P = 0.0030), T cells (−0.2357 vs. −0.2056, P = 0.0010), CD8+ T cells (0.0730 vs. 0.0761, P = 0.1310), DC cells (−0.2267 vs. −0.1796, P < 0.001), and B cells (−0.1676 vs. −0.1373, P < 0.001), while MDSCs (0.0250 vs. −0.0058, P < 0.001) (Figure S4).
Multiple Aggressive, Immunosuppressive, and Angiogenic Hallmarks Related With CCND1 Amplification
To investigate signaling pathways activated for CCND1 amplification tumors, we performed GSEA comparing the CCND1 amplification group and the CCND1 neutral group in the TCGA pan-cancer cohort. GSEA revealed significant differences (false discovery rate-q ≤ 0.25) in the enrichment of the Hallmark database (Figure 4A). Notably, gene sets related to epithelial mesenchymal transition, mitotic spindle, myc targets, transforming growth factor (TGF)-β signaling, KRAS signaling, tumor necrosis factor (TNF)-α signaling via nuclear factor (NF)-κB, phosphoinositide 3-kinase (PI3K)/AKT/mammalian target of rapamycin (mTOR) signaling, p53 pathway, mTOR complex 1 (MTORC1) signaling, and the hypoxia signaling pathways were differentially upregulated in the CCND1 amplification phenotype (Figure 4A). Interestingly, in HNSCC, we also found angiogenesis in the CCND1 amplification phenotype, while the activities of the interferon-α/β response, interleukin (IL)6-Janus kinase (JAK)-signal transducer and activator of transcription (STAT)3 signaling, and Wnt-β catenin signaling pathways were increased in the neutral phenotype (Figure S5).
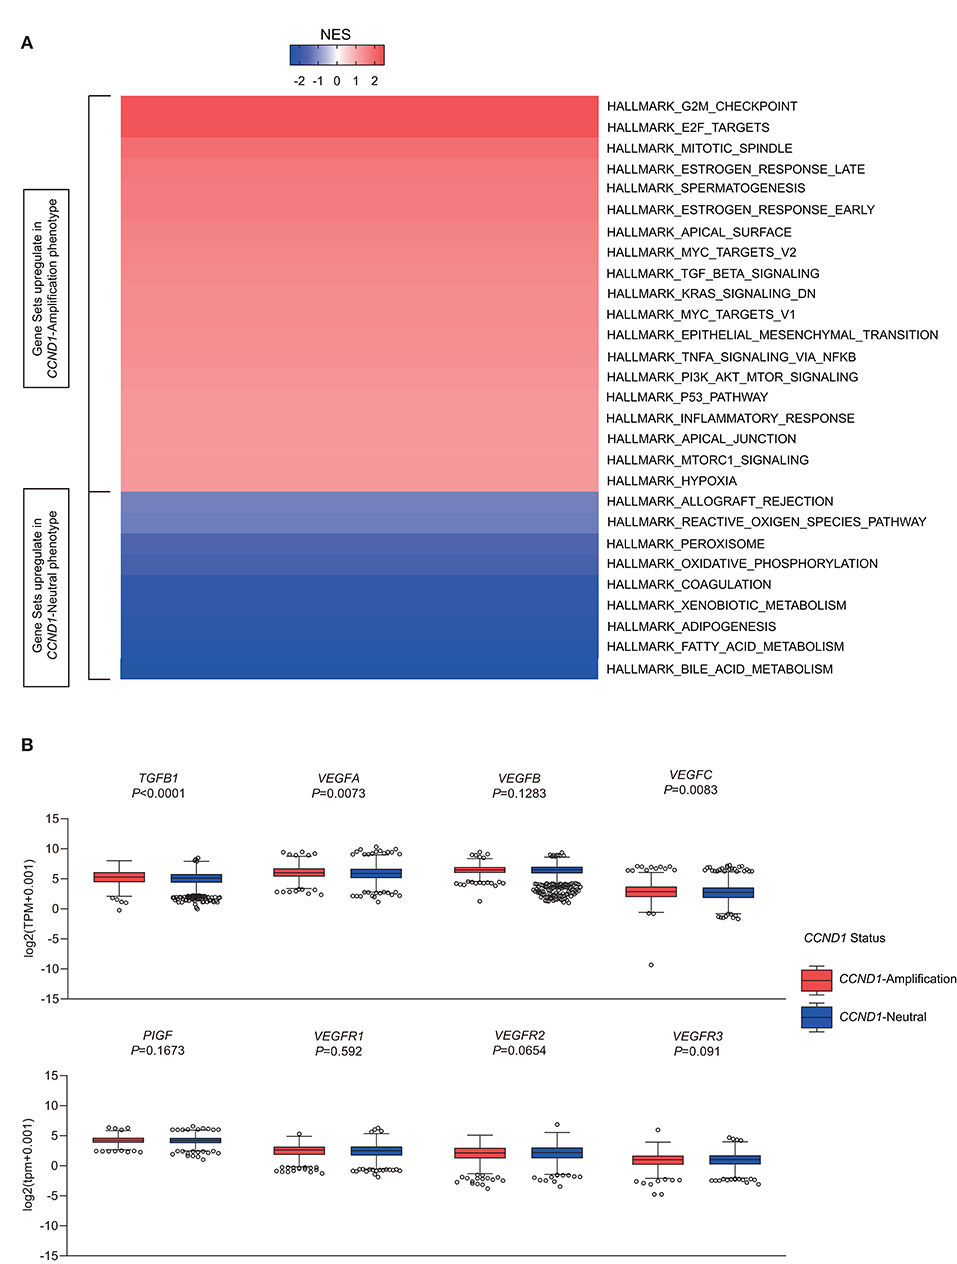
Figure 4. Identification of hallmarks associated with cyclin D1 (CCND1) amplification in The Cancer Genome Atlas (TCGA) pan-cancer cohort (n = 2,633). (A) Different upregulation of inflammatory pathways among the CCND1 amplification group and the CCND1 neutral group in the TCGA pan-cancer cohort. The result is expressed according to the normalized enrichment score (NES). (B) The box and whiskers plots depict differences in transcript-level changes of transforming growth factor (TGF)B1, vascular endothelial growth factor (VEGF)A–C, placental growth factor (PIGF), and VEGF receptor (VEGFR)1–3 between the CCND1 amplification group and the neutral group in the TCGA pan-cancer cohort. Within each group, the scattered dots represent gene values, and the thick line represents the median value. The bottom and top of the boxes are the 25th and 75th percentiles. Differences between the two groups were determined by unpaired t-tests.
Since TGF-β (encoded by TGFB1), hypoxia-inducible factor (HIF)1A (encoded by HIF1A), vascular endothelial growth factors (VEGFs) [encoded by VEGFA-C, placental growth factor (PIGF), VEGF receptor (VEGFR)1-3], angiopoietin growth factors (encoded by ANGPT1-2), MET (encoded by MET), hepatocyte growth factor (HGF) (encoded by HGF), platelet-derived growth factors (PDGFs) (encoded by PDGFA-D, PDGFRA-B, PDGFRL), fibroblast growth factor (FGF)2 (encoded by FGF2), FGFR2 (encoded by FGFR2), and adhesion molecules [encoded by intercellular adhesion molecule (ICAM)1, vascular cell adhesion molecule (VCAM)1, CD34] might modify the cancer-related immune microenvironment and decrease the efficacy of immunotherapies (25), we analyzed the RNA-Seq data in TCGA focusing on single genes including TGFB1, HIF1A, MET, HGF, adhesion molecules, angiopoietin growth factors, PDGF family, and VEGFs family (Table S5). In the TME of TCGA pan-cancer cohort, CCND1 amplification showed a statistically significant correlation with high expression of TGFB1 (5.293 vs. 5.108, P < 0.0001), VEGFA (5.992 vs. 5.854, P = 0.0073), VEGFB (6.458 vs. 6.483, P = 0.1283), ICAM1 (4.721 vs. 4.896, P = 0.2596), and HIF1A (6.028 vs. 5.761, P < 0.0001) in the TME (Figure 4B and Figure S6). Previous studies had revealed that VEGFA has direct or indirect effects on components of the immune system, including suppressing DC maturation and CD8+ T cell proliferation (25) and affecting ICAM1 to suppress NK cell and T cell trafficking (25), resulting in immunosuppressive outcomes. Another study showed that cyclin D1 (encoded by CCND1) may play a key role in the maintenance of VEGFs, and antisense to cyclin D1 could be useful for targeting both cancer cells and blood vessels in tumors (26). Above all, we deduced that anti-VEGFs/VEGFRs may potentially reverse the CCND1 amplification that is associated with resistance to ICIs.
Discussion
In this study, we comprehensively described the CCND1 amplification profile in the TCGA and MSKCC databases and in a Chinese population in the Geneplus cohort. We found that CCND1 amplification can hinder not only the natural host immune response but also the efficacy of ICIs. A CCND1 amplification may potentially identify a patient population that will not benefit from ICIs irrespective of TMB status.
The CCND1 located on human chromosome 11q13.3 is considered an oncogene, and it increases cell proliferation, growth, angiogenesis, and resistance to chemotherapy and radiotherapy (3, 4). To our knowledge, our results are the first to reveal that a CCND1 amplification may significantly correlate with tumorigenesis and attenuation of various types of effector immune cells in the TME, including cytotoxic cells, T cells, CD8+ T cells, DC cells, and B cells, and upregulation of Treg cells and MDSCs. Oncogenes such as PDGFA-D, FGF2, HGF, and MET are significantly overexpressed in the CCND1 amplification group, promoting the development and progression of tumors. Previous studies have shown the role of the cytokine TGF-β, promoting immunosuppression in the TME (2, 20, 27, 28). In our analysis of the TCGA pan-cancer cohort, CCND1 amplification showed a statistically significant correlation with high mRNA expression of TGFB1. More importantly, further study showed significant upregulation of mRNA expression of VEGFA, another known factor inducing tumor immune escape and immunotherapy resistance (25), associated with the CCND1 amplification phenotype.
From the survival analysis in TCGA and MSKCC public databases, we found no significant correlation between CCND1 amplification with prognosis in the pan-cancer group. There are some reasons to interpret this result. Firstly, the source of samples enrolled in the TCGA and MSKCC databases were diverse, and the clinical pathological characters of patients were complicated. Hence, the differences between cancer types must be taken into account. Secondly, in previous studies, methods such as Fluorescence in situ Hybridization (FISH), Chromogenic in situ Hybridization (CISH) or Reverse Transcription-Polymerase Chain Reaction (RT-PCR) were used to detect amplification of genes. Some studies used immunohistochemistry to stain cyclin D1. But there was no consistency on the definition of amplification of genes or the high- or low-expression level of cyclin D1 in various cancer types or within the same cancer type. Here, in our study, we used sequencing of genes by a CNV technique to detect amplification of genes. Meanwhile, the analysis of the transcriptome showed that the amplification of CCND1 was strongly correlated with higher expression level of mRNA. This also increases the credibility of the results and unifies the consistency of the detection. Thirdly, according to our investigation, activations of a variety of oncogenes and deactivations of tumor suppressor genes were observed along with the amplification of CCND1 in different cancer types. Therefore, when the sample is enlarged and after balancing different tumor types, the value of CCND1's impact on prognosis may be weakened.
Nevertheless, the CCND1 amplification is a potential predictive biomarker for the use of ICIs in patients with solid tumors. In the melanoma pooled cohort, the median OS was shorter in the CCND1 amplification subgroup. The survival analysis in the MSKCC-IO cohort further verified the negative impact of CCND1 amplification on the efficacy of ICIs. Strikingly, by comparing CCND1 amplification with TMB in patients with solid tumors from the MSKCC-IO cohort, we found that the association between CCND1 amplification and a worse clinical outcome was more distinct in TMB-high patients. This indicates that ICIs may not be useful, and even harmful, to patients with CCND1 amplification. We propose three hypotheses to explain the impairment for ICI efficacy. First, various types of effector immune cell exclusion and immunosuppression in the TME were found in tumors with CCND1 amplification. Second, CCND1 amplification results in high mRNA expression of TGFB1, VEGFA, and HIF1A; these molecules have direct or indirect negative effects on components of the immune system. Finally, some oncogene pathways are activated in CCND1 amplification tumor that may lead to acceleration of tumor growth. Recently, a study reported on five patients experiencing hyper-progression who had NGS performed on pretreatment tumor tissue, and it confirmed CNAs in MDM2/MDM4, epidermal growth factor receptor (EGFR), and several genes located on 11q13 associated with hyper-progression (29). So, these results will establish an important foundation for screening patients who might not benefit from ICI therapy.
Considering the immunosuppression in the TME and overexpression of various oncogenes caused by CCND1 amplification, patients with such features should avoid ICI monotherapy. Multi-combination strategies including anti-angiogenesis agents or anti-TGF-β agents may eliminate the latent immunosuppressive factors in the TME and reverse the resistance to ICIs.
Our study has some limitations. When CCND1 amplification is included in the interpretation of cancer prognosis, issues such as tumor type, standardization of detection, and accompanying gene mutation status should be fully considered. The small number of CCND1 amplification tumors and the rarity of the event suggest that further additional data are warranted. The analysis of additional trials and cohorts will improve the precision of our estimates and the robustness of our findings. Our study is a preliminary investigation mainly focused on the predictive function of CCND1 amplification in the tumor microenvironment in the aspect of genome and transcriptome. The full implication of CCND1 amplification remains elusive and requires in-depth studies. Experiments to investigate the direct mechanism of CCND1 amplification and primary immune resistance should be performed.
These findings indicate that CCND1 amplification may be a key point related to immunosuppression in the TME and multiple malignancy hallmark; it may be a common mechanism of resistance to ICIs.
Data Availability Statement
The raw data supporting the conclusions of this article will be made available by the authors, without undue reservation, to any qualified researcher.
Ethics Statement
The studies involving human participants were reviewed and approved by Ethics Committee of Fujian Provincial Cancer Hospital. Written informed consent to participate in this study was provided by the participants' legal guardian/next of kin. Written informed consent was obtained from the individual(s) for the publication of any potentially identifiable images or data included in this article.
Author Contributions
YC, YH, XG, and YL were responsible for conducting the study, under the supervision of CC and XY, and contributed to the study design. YC, YH, XG, YL, JL, LChe, YX, GC, YG, LP, XX, ZG, JP, XY, LCha, and CC acquired the data. YC, YH, XG, YL, YX, YG, XX, ZG, JP, XY, and CC performed the data analysis and interpretation. YC, YH, XG, YL, and CC wrote and revised the manuscript. All authors contributed to the article and approved the submitted version.
Funding
This work was supported by the Fujian Provincial Health and Family Planning Research Talent Training Program under Grant (numbers 2018-ZQN-13 and 2018-CX-11) and Joint Funds for the Innovation of Science and Technology, Fujian Province under Grant (numbers 2017Y9077 and 2018Y9107).
Conflict of Interest
XG, LC, YG, XX, YX, and XY are current employees of Geneplus-Beijing. YG, XX, and XY hold leadership positions and stocks of Geneplus-Beijing.
The remaining authors declare that the research was conducted in the absence of any commercial or financial relationships that could be construed as a potential conflict of interest.
Acknowledgments
We appreciate all subjects who participated in this study and wish to thank Dr. Jianping Lu and Dr. Weifeng Zhu (Department of Pathology, Fujian Medical University Cancer Hospital & Fujian Cancer Hospital, Fuzhou, Fujian Province, China) and all colleagues (Cancer Bio-immunotherapy Center, Fujian Medical University Cancer Hospital) for IHC.
Supplementary Material
The Supplementary Material for this article can be found online at: https://www.frontiersin.org/articles/10.3389/fimmu.2020.01620/full#supplementary-material
Abbreviations
CCND1, cyclin D1; ICIs, immune checkpoint inhibitors; NGS, next-generation sequencing; TCGA, The Cancer Genome Atlas; MSKCC, Memorial Sloan Kettering Cancer Center; OS, overall survival; TMB, tumor mutational burden; TME, tumor microenvironment; PD-1, programmed cell death 1; PD-L1, programmed cell death ligand 1; HNSCC, head and neck squamous cell carcinoma; CNA, copy number alteration; BLCA, bladder urothelial carcinoma; BRCA, breast invasive carcinoma; CHOL, cholangiocarcinoma; ESCA, esophageal carcinoma; LIHC, liver hepatocellular carcinoma; LUSC, lung squamous cell carcinoma; OV, ovarian serous cystadenocarcinoma; SKCM, skin cutaneous melanoma; STAD, stomach adenocarcinoma; MDSCs, myeloid-derived suppressor cells; GSEA, gene set enrichment analysis; CTLA4, cytotoxic T lymphocyte-associated protein 4; DFS, disease-free survival; DCs, dendritic cells.
References
1. Chen DS, Mellman I. Elements of cancer immunity and the cancer-immune set point. Nature. (2017) 541:321–30. doi: 10.1038/nature21349
2. Sharma P, Hulieskovan S, Wargo JA, Ribas A. Primary, adaptive, and acquired resistance to cancer immunotherapy. Cell. (2017) 168:707–23. doi: 10.1016/j.cell.2017.01.017
3. Malumbres M, Barbacid M. To cycle or not to cycle: a critical decision in cancer. Nat Rev Cancer. (2001) 1:222–31. doi: 10.1038/35106065
4. Musgrove EA, Caldon CE, Barraclough J, Stone A, Sutherland RL. Cyclin D as a therapeutic target in cancer. Nat Rev Cancer. (2011) 11.8:558–72. doi: 10.1038/nrc3090
5. Saada-Bouzid E, Defaucheux C, Karabajakian A, Coloma VP, Servois V, Paoletti X, et al. Hyperprogression during anti-PD-1/PD-L1 therapy in patients with recurrent and/or metastatic head and neck squamous cell carcinoma. Ann Oncol. (2017) 28:1605–11. doi: 10.1093/annonc/mdx178
6. Yu J, Yan J, Guo Q, Chi Z, Tang B, Zheng B, et al. Genetic aberrations in the CDK4 pathway are associated with Innate resistance to PD-1 blockade in Chinese patients with non-cutaneous melanoma. Clin Cancer Res. (2019) 25:6511–23. doi: 10.1158/1078-0432.CCR-19-0475
7. Association WM. Declaration of Helsinki. Ethical principles for medical research involving human subjects. J Indian Med Assoc. (2009) 14:233–8. doi: 10.1515/9783110208856.233
8. Kristian C, Lawrence MS, Carter SL, Andrey S, David J, Carrie S, et al. Sensitive detection of somatic point mutations in impure and heterogeneous cancer samples. Nat Biotechnol. (2013) 31:213–9. doi: 10.1038/nbt.2514
9. Li J, Lupat R, Amarasinghe KC, Thompson ER, Doyle MA, Ryland GL, et al. CONTRA: copy number analysis for targeted resequencing. Bioinformatics. (2012) 28:1307–13. doi: 10.1093/bioinformatics/bts146
10. Shen R, Seshan VE. FACETS: allele-specific copy number and clonal heterogeneity analysis tool for high-throughput DNA sequencing. Nucleic Acids Res. (2016) 44:e131. doi: 10.1093/nar/gkw520
11. Caesar-Johnson SJ, Demchok JA, Felau I, Kasapi M, Ferguson ML, Hutter CM, et al. An integrated TCGA pan-cancer clinical data resource to drive high-quality survival outcome analytics. Cell. (2018) 173:400–16. doi: 10.1016/j.cell.2018.02.052
12. Zehir A, Benayed R, Shah RH, Syed A, Middha S. Mutational landscape of metastatic cancer revealed from prospective clinical sequencing of 10,000 patients. Nat Med. (2017) 23:703−13. doi: 10.1038/nm.4333
13. Samstein RM, Lee CH, Shoushtari AN, Hellmann MD, Shen R, Janjigian YY, et al. Tumor mutational load predicts survival after immunotherapy across multiple cancer types. Nat Genet. (2019) 51:202–6. doi: 10.1038/s41588-018-0312-8
14. Van Allen EM, Miao D, Schilling B, Shukla SA, Blank C, Zimmer L, et al. Genomic correlates of response to CTLA-4 blockade in metastatic melanoma. Science. (2015) 350:207–11. doi: 10.1126/science.aad0095
15. Snyder A, Makarov V, Merghoub T, Yuan J, Zaretsky JM, Desrichard A, et al. Genetic basis for clinical response to CTLA-4 blockade in melanoma. N Engl J Med. (2014) 371:2189–99. doi: 10.1056/NEJMoa1406498
16. Liu D, Schilling B. Integrative molecular and clinical modeling of clinical outcomes to PD1 blockade in patients with metastatic melanoma. Nat Med. (2019) 25:1916–27. doi: 10.1038/s41591-019-0654-5
17. Mermel CH, Schumacher SE, Hill B, Meyerson ML, Beroukhim R, Getz G. GISTIC2.0 facilitates sensitive and confident localization of the targets of focal somatic copy-number alteration in human cancers. Genome Biol. (2011) 12:R41. doi: 10.1186/gb-2011-12-4-r41
18. Yoshihara K, Shahmoradgoli M, Martinez E, Vegesna R, Kim H, Torres-Garcia W, et al. Inferring tumour purity and stromal and immune cell admixture from expression data. Nat Commun. (2013) 4:2612. doi: 10.1038/ncomms3612
19. Senbabaoglu Y, Gejman RS, Winer AG, Liu M, Van Allen EM, de Velasco G, et al. Tumor immune microenvironment characterization in clear cell renal cell carcinoma identifies prognostic and immunotherapeutically relevant messenger RNA signatures. Genome Biol. (2016) 17:231. doi: 10.1186/s13059-016-1092-z
20. Jiang P, Gu S, Pan D, Fu J, Sahu A, Hu X, et al. Signatures of T cell dysfunction and exclusion predict cancer immunotherapy response. Nat Med. (2018) 24:1550–8. doi: 10.1038/s41591-018-0136-1
21. Liberzon A, Birger C, Thorvaldsdã Ttir H, Ghandi M, Mesirov JP, Tamayo P. The Molecular Signatures Database (MSigDB) hallmark gene set collection. Cell Syst. (2015) 1:417–25. doi: 10.1016/j.cels.2015.12.004
22. Subramanian A, Tamayo P, Mootha VK, Mukherjee S, Ebert BL, Gillette MA, et al. Gene set enrichment analysis: a knowledge-based approach for interpreting genome-wide expression profiles. Proc Natl Acad Sci USA. (2005) 102:15545–50. doi: 10.1073/pnas.0506580102
23. Cristescu R, Mogg R, Ayers M, Albright A, Murphy E, Yearley J, et al. Pan-tumor genomic biomarkers for PD-1 checkpoint blockade-based immunotherapy. Science. (2018) 362:eaar3593. doi: 10.1126/science.aar3593
24. Sade-Feldman M, Jiao YJ, Chen JH, Rooney MS, Barzily-Rokni M, Eliane JP, et al. Resistance to checkpoint blockade therapy through inactivation of antigen presentation. Nat Commun. (2017) 8:1136. doi: 10.1038/s41467-017-01062-w
25. Khan KA, Kerbel SR. Improving immunotherapy outcomes with anti-angiogenic treatments and vice versa. Nat Rev Clin Oncol. (2018) 15:310–24. doi: 10.1038/nrclinonc.2018.9
26. Yasui M, Yamamoto H, Ngan CY, Damdinsuren B, Sugita Y, Fukunaga H, et al. Antisense to cyclin D1 inhibits vascular endothelial growth factor-stimulated growth of vascular endothelial cells: implication of tumor vascularization. Clin Cancer Res. (2006) 12:4720–9. doi: 10.1158/1078-0432.CCR-05-1213
27. Mariathasan S, Turley SJ, Nickles D, Castiglioni A, Yuen K, Wang Y, et al. TGFβ attenuates tumour response to PD-L1 blockade by contributing to exclusion of T cells. Nature. (2018) 554:544–8. doi: 10.1093/annonc/mdx760.001
28. Tauriello D, Batlle E. TGFβ drives immune evasion in genetically reconstituted colon cancer metastasis. Nature. (2018) 554:538. doi: 10.1038/nature25492
Keywords: cyclin D1 (CCND1), immune checkpoint inhibitors, prognosis, tumor microenvironment, biomarker
Citation: Chen Y, Huang Y, Gao X, Li Y, Lin J, Chen L, Chang L, Chen G, Guan Y, Pan LK, Xia X, Guo Z, Pan J, Xu Y, Yi X and Chen C (2020) CCND1 Amplification Contributes to Immunosuppression and Is Associated With a Poor Prognosis to Immune Checkpoint Inhibitors in Solid Tumors. Front. Immunol. 11:1620. doi: 10.3389/fimmu.2020.01620
Received: 15 January 2020; Accepted: 17 June 2020;
Published: 10 August 2020.
Edited by:
Said Dermime, National Center for Cancer Care and Research, QatarReviewed by:
Aparna Rao, University of Pittsburgh, United StatesAndreas Pircher, Innsbruck Medical University, Austria
Nabil Elhadi Omar, Hamad Medical Corporation, Qatar
Copyright © 2020 Chen, Huang, Gao, Li, Lin, Chen, Chang, Chen, Guan, Pan, Xia, Guo, Pan, Xu, Yi and Chen. This is an open-access article distributed under the terms of the Creative Commons Attribution License (CC BY). The use, distribution or reproduction in other forums is permitted, provided the original author(s) and the copyright owner(s) are credited and that the original publication in this journal is cited, in accordance with accepted academic practice. No use, distribution or reproduction is permitted which does not comply with these terms.
*Correspondence: Chuanben Chen, ccb@fjmu.edu.cn
†These authors have contributed equally to this work