 Sânzio Silva Santana1,2
 Thassila Nogueira Pitanga1,2
 Jeanne Machado de Santana1
 Dalila Lucíola Zanette1
 Jamile de Jesus Vieira1
 Sètondji Cocou Modeste Alexandre Yahouédéhou1
 Corynne Stéphanie Ahouefa Adanho1
 Sayonara de Melo Viana1
 Nivea Farias Luz1
 Valeria Matos Borges1
 Marilda Souza Goncalves1,3*
- 1Instituto Gonçalo Moniz, Fundação Oswaldo Cruz (IGM/FIOCRUZ-BA), Salvador, Brazil
- 2Faculdade de Biomedicina, Universidade Católica do Salvador (UCSal), Salvador, Brazil
- 3Faculdade de Farmácia, Universidade Federal da Bahia (UFBA), Salvador, Brazil
The excessive release of heme during hemolysis contributes to the severity of sickle cell anemia (SCA) by exacerbating hemoglobin S (HbS) autoxidation, inflammation and systemic tissue damage. The present study investigated the effect of hydroxyurea (HU) on free radical neutralization and its stimulation of antioxidant genes in human peripheral blood mononuclear cells (PBMC) and human umbilical vein endothelial cells (HUVEC) in the presence or absence of hemin. HU (100 and 200 μM) significantly reduced the production of intracellular reactive oxygen species (ROS) induced by hemin at 70 μM in HUVEC. HUVECs treated with HU+hemin presented significant increases in nitric oxide (NO) production in culture supernatants. HU alone or in combination with hemin promoted the induction of superoxide dismutase-1 (SOD1) and glutathione disulfide-reductase (GSR) in HUVECs and PBMCs, and glutathione peroxidase (GPX1) in PBMCs. Microarray analysis performed in HUVECs indicated that HU induces increased expression of genes involved in the antioxidant response system: SOD2, GSR, microsomal glutathione S-transferase (MGST1), glutathione S-transferase mu 2 (GSTM2), carbonyl reductase 1 (CBR1) and klotho B (KLB). Significant increases in expression were observed in genes with kinase activity: protein kinase C beta (PRKCB), zeta (PRKCZ) and phosphatidylinositol-4-phosphate 3-kinase catalytic subunit type 2 beta (PIK3C2B). HU also induced a significant increase in expression of the gene p62/sequestosome (p62/SQSTM1) and a significant decrease in the expression of the transcriptional factor BACH1 in HUVECs. Upstream analysis predicted the activation of Jun, miR-155-5p and mir-141-3p. These results suggest that HU directly scavenges free radicals and induces the expression of antioxidant genes via induction of the Nrf2 signaling pathway.
Introduction
Hydroxyurea (HU) is a hydroxylated analog of urea, which was initially identified as a myelosuppressive drug that acts by inhibiting ribonucleotide reductase. After determining its antisickling effect, HU was approved in 1998 by the U.S. Food and Drug Administration (FDA) for the treatment of sickle cell anemia (SCA). SCA is a hereditary autosomal recessive disease, characterized by the homozygosity of the beta S (βS) allele (HbSS), which is derived from the GAG>GTG mutation in the sixth position of the β globin gene (HBB) (1). The pathophysiological condition of SCA is recurrent and characterized by a large production of reactive oxygen species (ROS) and reactive nitrogen species (RNS), which play a crucial role in the maintenance of inflammation (2–6).
The imbalance caused by increased oxidation-reduction (redox) reactions in the vascular microenvironment in SCA provokes important deleterious effects (4). Indeed, patients with SCA can present (i) intravascular and extravascular hemolysis with free heme release; (ii) autoxidation of HbS (3, 7); (iii) nitric oxide (NO) depletion and endothelial dysfunction (8, 9); (iv) ischemia-reperfusion events (10); (v) marked leukocyte dysfunction, conferring a non-effector response against pathogens, and the dysregulation of inflammatory equilibrium that increases susceptibility to secondary infections (11–13).
Despite the recent approval of L-arginine by the FDA, HU remains the drug most indicated for SCA patients who present a severe clinical profile (14, 15). Experimental studies have demonstrated that after oral administration, HU is absorbed, converted into a nitroxide radical and transported to the active site of the M2 subunit of the ribonucleotide reductase protein, inactivating the enzyme and generating cytotoxic suppression, most likely via the induction of an antioxidant response (16). Ware (17) pointed out the main benefits of HU therapy in patients with SCA: HU induces fetal hemoglobin (HbF) production through the activation of guanylate cyclase and reduces neutrophil and reticulocyte counts by inhibiting ribonucleotide reductase activity and bone marrow toxicity. Moreover, it decreases adhesiveness and improves the rheology of circulating neutrophils and reticulocytes, reduces hemolysis and improves erythrocyte hydration, promotes macrocytosis, reduces intracellular sickling and stimulates the release of NO as a potential local vasodilator. Despite these benefits, relatively few studies have specifically focused on the action of HU in alternative mechanisms that broaden the field of knowledge regarding its action and systemic effects.
We hypothesized that HU can act by decreasing ROS/RNS and stimulating antioxidant defense systems in endothelial cells and leukocytes. To this end, we investigated the effects of HU in human peripheral blood mononuclear cells (PBMC) and umbilical cord vein endothelial cells (HUVEC) pre-treated or not with hemin, an important pro-oxidant molecule released during hemolysis (3, 18, 19). We then specifically investigated the antioxidant effect of HU, as well as the expression of antioxidant genes, such as heme oxygenase-1 (HMOX1), superoxide dismutase-1 (SOD1), glutathione disulfide-reductase (GSR) and glutathione peroxidase (GPX1).
Methods
Drugs
HU, butylated hydroxytoluene (BHT) and L-ascorbate were purchased from Sigma Aldrich (St. Louis, MO, USA) and prepared following the manufacturer's instructions. After complete solubilization, drugs were sterilized by filtration using a 0.22 μm polyethersulfone membrane (PES) (Jet Biofil, Guangzhou, China) for use in culturing assays.
Preparation of Hemin
Hemin (Sigma Aldrich, St. Louis, MO, USA), a ferric chloride hemin, was prepared from a 5 mM stock solution solubilized in 0.1 M NaOH using non-pyrogenic water under dark conditions. The hemin solution was then diluted in RPMI 1640 medium (Gibco, New York, NY, USA) to obtain optimal concentrations. Finally, a non-pyrogenic hemin solution was obtained following 0.22 μm PES-membrane filtration (Jet Biofil, Guangzhou, China) for use in cell culture assays.
Scavenging Activity Assay of 2,2-Diphenyl-1-Picrylhydrazyl (DPPH)
DPPH free scavenging activity was assessed by a modified microplate assay method previously described by Li et al. (20). Initially, 200 μM of DPPH stock solution (Sigma Aldrich, St. Louis, MO, USA) was prepared in methanol p.a. (Synth, Diadema, SP, Brazil) 10–15 min before experimentation, stored in a sealed bottle, and kept away from light. For this assay, stock drug solutions were prepared, using methanol, at concentrations ranging from 3.13 to 800 μM/well. HU, as well as the antioxidant external controls BHT and L-ascorbate, were incubated for 30 or 60 min at a volume of 0.1 mL on 96-well flat-bottom microtiter plates (Greiner Bio-one, Monroe, North Carolina, USA) at a ratio of 1:1 (v/v), with the addition of DPPH (100 μM/well). All plates were covered and kept in the dark to minimize evaporation and to avoid the photosensitization of DPPH radicals. Finally, the plated solutions were homogenized for 5 sec, and absorbance was measured on a microplate reader (SpectraMax 190, Molecular Devices Corporation, Sunnyvale, CA) using Softmax software v. 5.0 (Molecular Devices, Sunnyvale, CA, USA) at a wavelength of 517 nm. DPPH radical scavenging activity was determined using the following equation: Scavenging activity of DPPH (%) = [(Absdpph-Absdrug) × 100]/Absdpph.
Cell Cultures
HUVECs were cultured in 25 cm2 cell culture flasks (Costar, Corning, NY, USA) containing 5 mL RPMI 1640 medium (Gibco, New York, NY, USA) supplemented with 10% heat-inactivated fetal bovine serum (FBS) (Gibco, New York, NY, USA), 20 mM glutamine (Sigma Aldrich, St. Louis, MO, USA), 10 mM HEPES, 5 mM NaOH and the following antibiotics: 100 U/mL penicillin and 10 mg/mL streptomycin (Sigma Aldrich, St. Louis, MO, USA). For all assays, HUVECs were used in passages 1–5 and phenotypically characterized by the evaluation of typical cobblestone morphology and surface tissue factor (CD142) (Supplementary Figure 1).
Human peripheral venous blood samples were collected from healthy volunteers (HbAA genotype) to obtain PBMCs. Written informed consent was obtained from all study participants, and the present protocol was conducted in compliance with the 1975 Helsinki Declaration and its amendments, as well as the Brazilian ethical guidelines (466-CNS-2012). PBMCs were obtained by Ficoll-Paque Plus (GE Healthcare, Uppsala, Sweden) density gradient centrifugation following the manufacturer's instructions. Both HUVEC and PBMC were cultivated in a humidified atmosphere at 37°C under 5% CO2.
Cytotoxicity Assays
The cytotoxic effects of the drugs and hemin on HUVEC were assessed using a resazurin sodium salt reduction colorimetric assay. For this, 2 × 10⁴ cells/well (0.2 mL) were plated on 96-well plates (Costar, Corning, NY, USA) and cultivated for 20–24 h under the culture conditions described above, until reaching a confluency of 70–80%. Cells were then treated with HU in combination or not with hemin for 24 h. After incubation, the medium was collected and the wells were gently washed once with preheated (37°C) 0.85% saline solution to avoid cell damage and detachment. Finally, 0.1 mL of 12.5 μM resazurin sodium salt solution (Sigma Aldrich, St. Louis, MO, USA) diluted in RPMI 1640 with 10% FBS was added to each well, followed by incubation at 37°C under 5% CO2 in a humidified atmosphere for 3 h according to standardization protocols (Supplementary Figure 2A). Absorbance was simultaneously read at wavelengths of 570 and 600 nm on a microplate reader. Cell viability was determined by measuring the percentage of sodium salt (deep blue fluorescent compound) that was reduced to resorufin (pink fluorescent product). For PBMC cytotoxicity assays, 3 × 10⁵ cells were incubated for 24 h with HU in combination or not with hemin. Cytotoxicity was assessed using propidium iodide (BD, Pharmigen, USA) following the manufacturer's specifications. For each sample, 20,000 events were acquired on a BD LSRFortessa™ cytometer (Biosciences, San Jose, CA, USA).
Determination of Intracellular ROS
The detection of reactive oxygen species was determined in HUVECs using a 2′, 7′-dichlorodihydrofluorescein diacetate (DCFH-DA) probe (Sigma Aldrich, St. Louis, MO, USA). Initially, 3.3 × 10⁵ cells (0.5 mL) were seeded on 24-well plates for 20 h in the presence of 70 μM hemin to induce the intracellular production of ROS. Cells were then subjected to different concentrations of HU (100 and 200 μM) in the presence or absence of 70 μM hemin for 2 h. Next, the supernatants were discarded, the cell monolayers were gently washed twice with pre-heated (37°C) sterile saline (0.85% NaCl), followed by reincubation for 30 min with 10 μM of DCFH-DA probe in SFB-depleted medium without phenol red (Gibco, New York, NY, USA) to avoid probe degradation. Finally, the monolayers were washed twice with saline and trypsinized with 0.3 mL of trypsin-EDTA (0.25%) for 4 min at 37°C. Trypsin was neutralized with RPMI medium without phenol red supplemented with 10% SFB, and cells were transferred to sterile 1.5 mL microtubes, washed twice with saline solution and then placed in specific tubes for flow cytometry acquisition using Ex/Em: ~492–495/517–527 nm on a BD LSRFortessa™ cytometer (Biosciences, San Jose, CA, USA). ROS measurements are expressed by mean fluorescence intensity (MFI) and replicate values are expressed as means (10,000 events for each condition).
Nitrite Accumulation in Supernatants
NO production was indirectly quantified in PBMC and HUVEC supernatants using the Griess method (21) after treatment with HU (100 and 200 μM) alone or in combination with 70 μM hemin for 24 h. First, 1.2 × 10⁶ PBMC/well (0.3 mL) and 8 × 10⁴ HUVEC/well (0.5 mL) were seeded on 48-well and 24 well-plates, respectively, in the presence of stimuli. Next, 50 μL (1:1, v/v) of the supernatant was added to Griess reagent [1% sulfanilamide and 0.1% naphthyl ethylenediamine dihydrochloride (Sigma Aldrich, St. Louis, MO, USA) in 2.5% H3PO4 solution] for 5 min. Absorbance was measured on a microplate reader at a wavelength of 550 nm. The conversion of absorbance into micromolar concentrations of NO was deduced from a standard curve using a known concentration of NaNO2 diluted in RPMI medium. The standard curves used to determine molar concentrations assumed a coefficient of determination (R2) value ≥ 0.999.
Gene Expression and RNA Extraction Assays
HUVEC and PBMC were challenged with different HU concentrations in the presence and absence of 70 μM hemin for 4 h. Gene expression assays were performed by real-time quantitative reverse-transcription polymerase chain reaction (RT-qPCR). Total RNA was extracted from HUVEC and PBMC samples using TRIzol Reagent (Invitrogen, Carlsbad, CA, USA) according to the manufacturer's specifications. The concentration and purity of the extracted RNA were determined at the optical densities of 260 and 280 nm using a NanoDrop 2000 spectrophotometer (ThermoFisher Scientific, Rockford, IL, USA) at an absorbance ratio A260/280 of 1.90–2.02. Reverse cDNA synthesis by reverse transcription of RNA (RT-PCR) was performed using 250 ng of the RNA transcript in a High-Capacity cDNA Reverse Transcription Kit (ThermoFisher Scientific, Rockford, IL, USA) following the manufacturer's specifications. Real-time PCR was performed on an ABI PRISM 7500 Fast Real-Time PCR System (Applied Biosystems, Foster City, CA, USA) under the following cycling conditions: 95°C for 20 s, 95°C for 1 s, 60°C for 20 s for 40 cycles. For the RT-qPCR reactions, mixtures containing SYBR® Green PCR Master Mix (SYBR® Green I dye, AmpliTaq Gold® DNA Polymerase, dNTPs with dUTP, passive reference 1–ROX) (Applied Biosystems, Foster City, CA, USA), the primers specific to the target genes and 2 μL of the cDNA sample product were added to the optical plates. The primers used for quantitative PCR were as follows: [HMOX1: 5′-ATG GCC TCC CTG TAC CAC ATC-3′ (forward); 5′-TGT TGC GCT CAA TCT CCT CCT-3′ (reverse); SOD1: 5′-TGG CCG ATG TGT CTA TTG AA-3′ (forward); 5′-CAC CTT TGC CCA AGT CAT CT-3′ (reverse); GSR: 5′-ACT TGC CCA TCG ACT TTT TG-3′ (forward); 5′-GGT GGC TGA AGA CCA CAG TT-3′ (reverse); GPX1: 5′-CCA AGC TCA TCA CCT GGT CT-3′ (forward); 5′-TCG ATG TCA ATG GTC TGG AA-3′ (reverse); β-actin: 5′-CCT GGC ACC CAG CAC AAT-3′ (forward); 5′-GCC GAT CCA CAC GGA GTA CT-3′ (reverse); tubulin isotype a1C: 5′-TCA ACA CCT TCT TCA GTG AAA GG-3′ (forward); 5′-AGT GCC AGT GCG AAC TTC ATC (reverse). After determining the threshold cycle (CT), gene expression was measured by relative quantification using the following expression: fold-change = 2−Δ(ΔCT), where ΔCT = CTtarget – CThousekeeping and Δ(ΔCT) = ΔCTtreated – ΔCTcontrol(medium). Beta-actin and tubulin isotype a1C were used as housekeeping genes.
Microarray Assays with HUVEC
Microarray analyses were performed using a HumanHT-12 v.4 Expression BeadChip Kit (Illumina Inc., San Diego, CA, USA) and a TargetAmp™ Nano Labeling Kit for Illumina® Expression BeadChip® (Epicenter Technologies, Madison, Wisconsin, USA), in accordance with the manufacturers' specifications. Fluorescence values were acquired on an Illumina HiScan system using iScan Control software (Illumina Inc., San Diego, CA, USA). After quality control assessments, the generated data were exported for analysis using Genome Studio software (Illumina Inc., San Diego, CA, USA). Results with a detected p > 0.05 and a differential score <0.05 were discarded. After validation, the transcripts were selected and analyzed using Ingenuity Pathway Analysis (IPA) software (QIAGEN). Experiments were performed in triplicate and results reflect relative expression (log fold-change > 1.5), determined by comparing HUVECs treated with 200 μM HU to untreated cells.
Statistical Analysis
Data are expressed as means ± standard deviation of at least one representative experiment. All experiments were performed in triplicate. One-way ANOVA followed by Tukey's post-hoc test was applied to test variance between multiple groups. Significance was considered when p < 0.05. GraphPad Prism software version v.6.0 was used for statistical analyses (GraphPad, San Diego, CA, USA).
Results
HU Scavenges Free Radicals
To investigate the possible antioxidant effects of HU, we performed assays evaluating radical scavenging activity using 100 μM DPPH, a stable free radical. Initially, we found that HU presents significantly superior scavenging activity at 60 min of incubation after standardization (Supplementary Figure 3). Next, radical scavenging assays involving DPPH demonstrated a concentration-dependent activity for HU. Our global analysis found that HU (IC50 = 38.68 ± 0.47 μM) presents lower DPPH radical scavenging activity than the reference antioxidant compounds BHT (IC50 = 23.07 ± 2.64 μM, p < 0.05) and L-ascorbate (IC50 = 18.22 ± 5.93 μM, p < 0.001) (Table 1). However, scavenging activity equivalent or superior to BHT was observed at concentrations ≥200 μM (Figure 1). Based on these findings, HU was used in all further assays at concentrations of 100 and 200 μM.
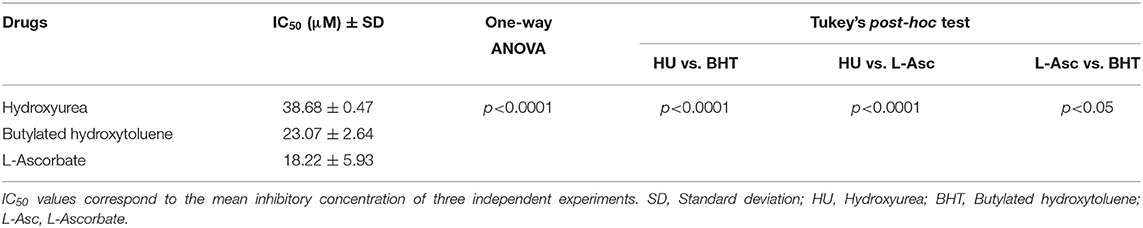
Table 1. Scavenging activity (corresponding to 50% of 100 μM DPPH) of hydroxyurea, L-ascorbate and butylated hydroxytoluene.
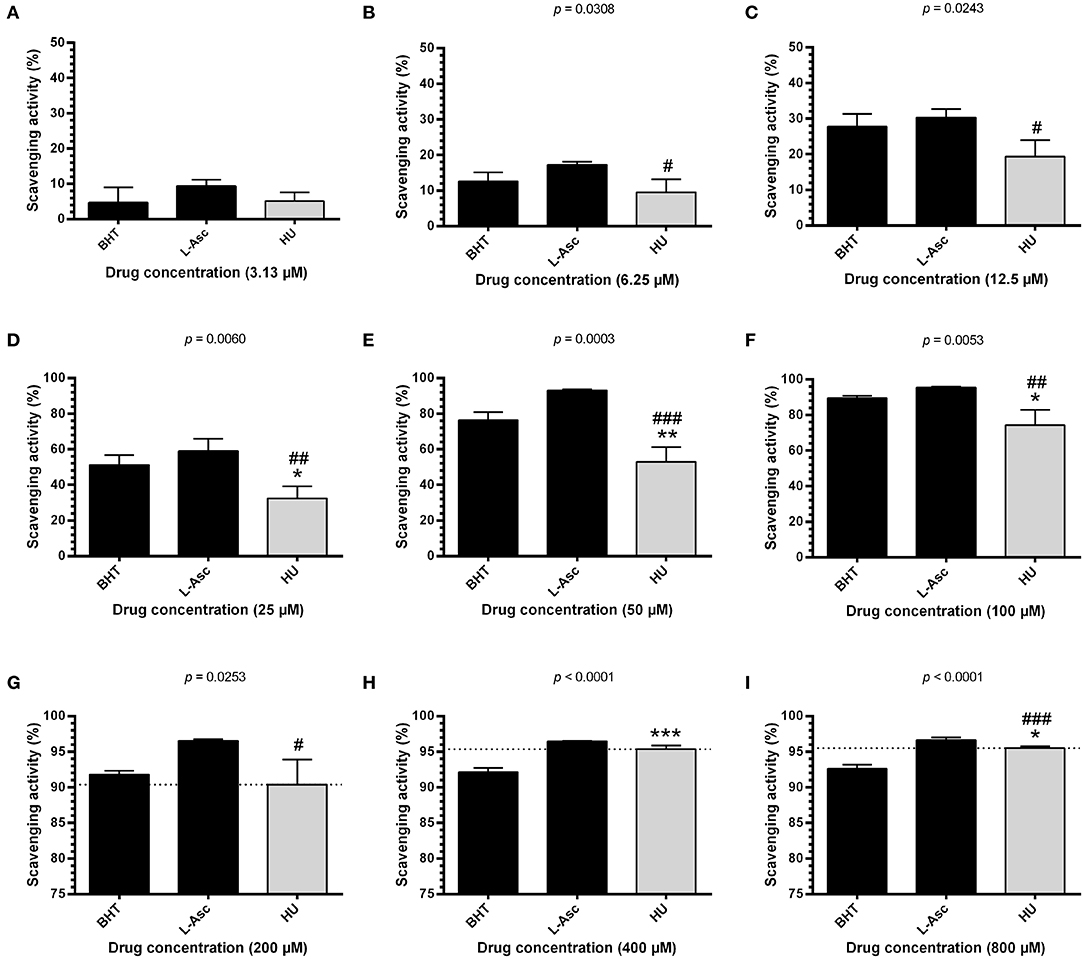
Figure 1. DPPH scavenging activity of different concentrations of hydroxyurea after 60 min of incubation. Antioxidant activity was measured by scavenging of the DPPH free radical using the HU concentrations 3.13 μM (A), 6.25 μM (B), 12.5 μM (C), 25 μM (D), 50 μM (E), 100 μM (F), 200 μM (G), 400 μM (H) and 800 μM (I). Results correspond to the mean ± standard deviation of four independent experiments. BHT and L-ascorbate were used as reference antioxidant compounds. HU, hydroxyurea; L-Asc, L-ascorbate; BHT, butylated hydroxytoluene. Statistical significance determined by one-way ANOVA, p < 0.0001, followed by Tukey's post-hoc test: HU vs. BHT: *p < 0.05, **p < 0.01, ***p < 0.001; HU vs. L-Asc, #p < 0.05, ##p < 0.01, ###p < 0.001.
HU and Hemin Present Non-Toxic Effects in HUVEC and PBMC
Cytotoxicity evaluations in HUVECs and PBMCs were carried out using resazurin sodium salt and propidium iodide methods, respectively. For toxicity testing in HUVECs, we initially standardized the time required to reduce resazurin sodium salt to a level equivalent to the same percentage of cell viability found in unstimulated cell cultures (Supplementary Figure 2A). No decreases in HUVEC viability were seen at the concentrations evaluated, ranging from 6.25 to 100 μM of hemin (Supplementary Figure 2B). Considering these findings, all following assays employed a hemin concentration of 70 μM, which corresponds to the plasmatic concentrations of free hemin observed in a previous study by our group involving steady-state SCA patients. No toxicity was observed in the HUVEC and PBMC samples at any of the HU or hemin concentrations evaluated (Supplementary Figures 2C,D).
HU Increases NO Production and Decreases the Formation of Cytosolic ROS in HUVEC Treated with HU plus Hemin
Hemin alone was shown to induce NO production in PBMCs and HUVECs. PBMCs and HUVECs treated with HU at 100 μM and 200 μM did not show any significant increases in NO (Figures 2A,B). However, when we evaluated the combined treatment of HU plus hemin vs. negative controls or hemin alone, significantly increased NO production was seen only in HUVECs. HU plus 70 μM hemin was found to markedly reduce ROS in HUVECs in a concentration dependent-manner (Figure 2C).
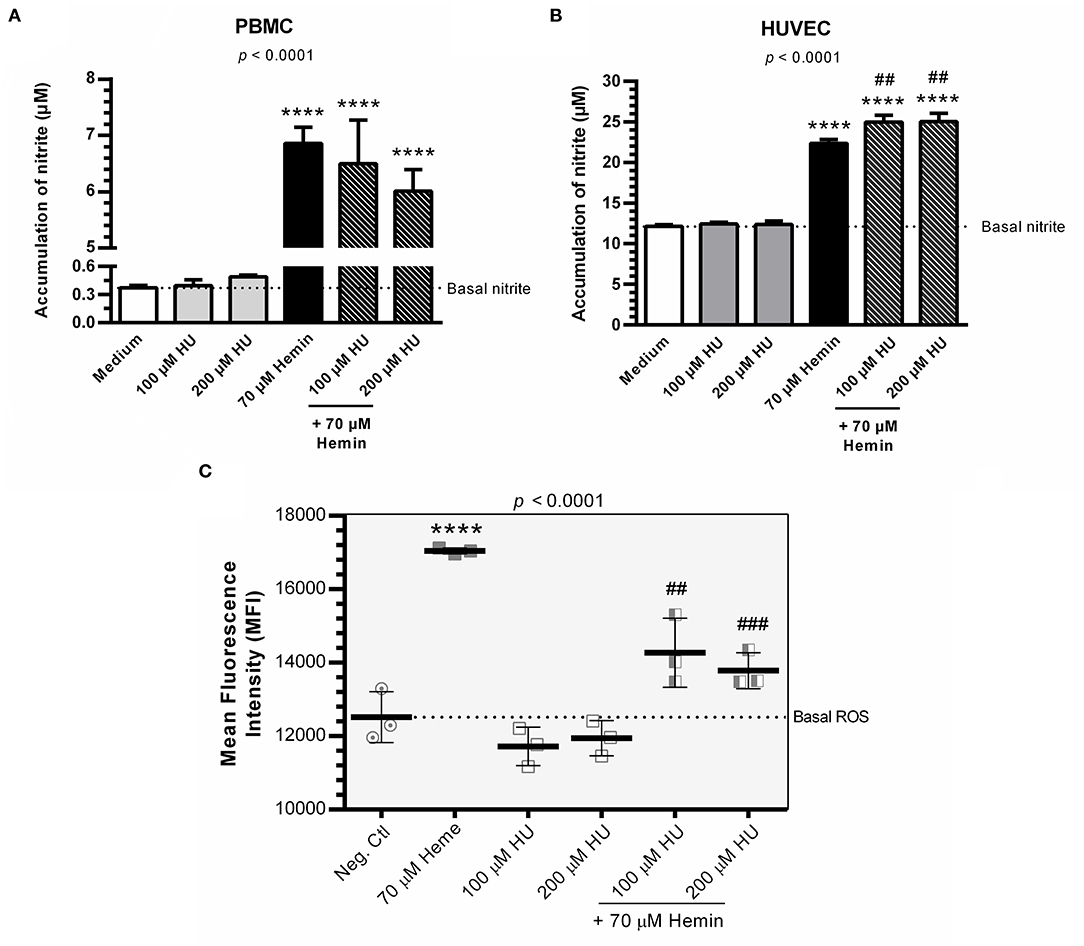
Figure 2. NO production and formation of intracellular ROS in the presence of Hydroxyurea and/or hemin. (A) Production of NO in supernatants of PBMCs in response to various treatment protocols. Results correspond to means ± SD of three independent experiments. Statistical significance determined by one-way ANOVA, p < 0.0004, followed by Tukey's post-hoc test: HU alone or in combination with hemin vs medium, or hemin vs medium, **p < 0.01; HU + hemin vs hemin, ##p < 0.01. (B) Production of NO in supernatants of HUVECs in response to various treatment protocols. Results correspond to the mean ± SD of three independent experiments. Statistical significance determined by one-way ANOVA, p < 0.0001, followed Tukey's post-hoc test: HU alone or HU + hemin vs. medium, or hemin vs. medium, ****p < 0.0001; HU + hemin vs. hemin, ##p < 0.01. (C) Decreased ROS formation in HUVECs using the oxidant-sensing fluorescent probe 10 μM 2', 7'-dichlorodihydrofluorescein diacetate (DCFH-DA). Statistical significance determined by mean fluorescence intensity (MFI) values representative of the mean ± SD of three experimental replicates. One-way ANOVA, p < 0.0001, followed by Tukey's post-hoc test: HU alone or associated with hemin vs. medium, or hemin vs. medium, ****p < 0.0001; HU + hemin vs. hemin, ##p < 0.01; ###p < 0.001.
Treatments with HU Alone or Combined with Hemin Induce Antioxidant Enzyme Gene Expression in HUVEC and PBMC
Treatment with 200 μM HU increased the expression of SOD1 in PBMCs and HUVECs by 2.57 ± 0.86-fold (p < 0.05) and 1.84 ± 0.36-fold, (p < 0.01), respectively, compared to negative controls (Figure 3A). Combined treatments using 100 and 200 μM of HU plus 70 μM hemin promoted a statistically significant increase of 3.37 ± 0.42-fold (p < 0.01) and 3.39 ± 0.37-fold (p < 0.01) in SOD1 expression in PMBCs, vs. 1.53 ± 0.07-fold (p < 0.05) in HUVECs (100 μM HU plus hemin).
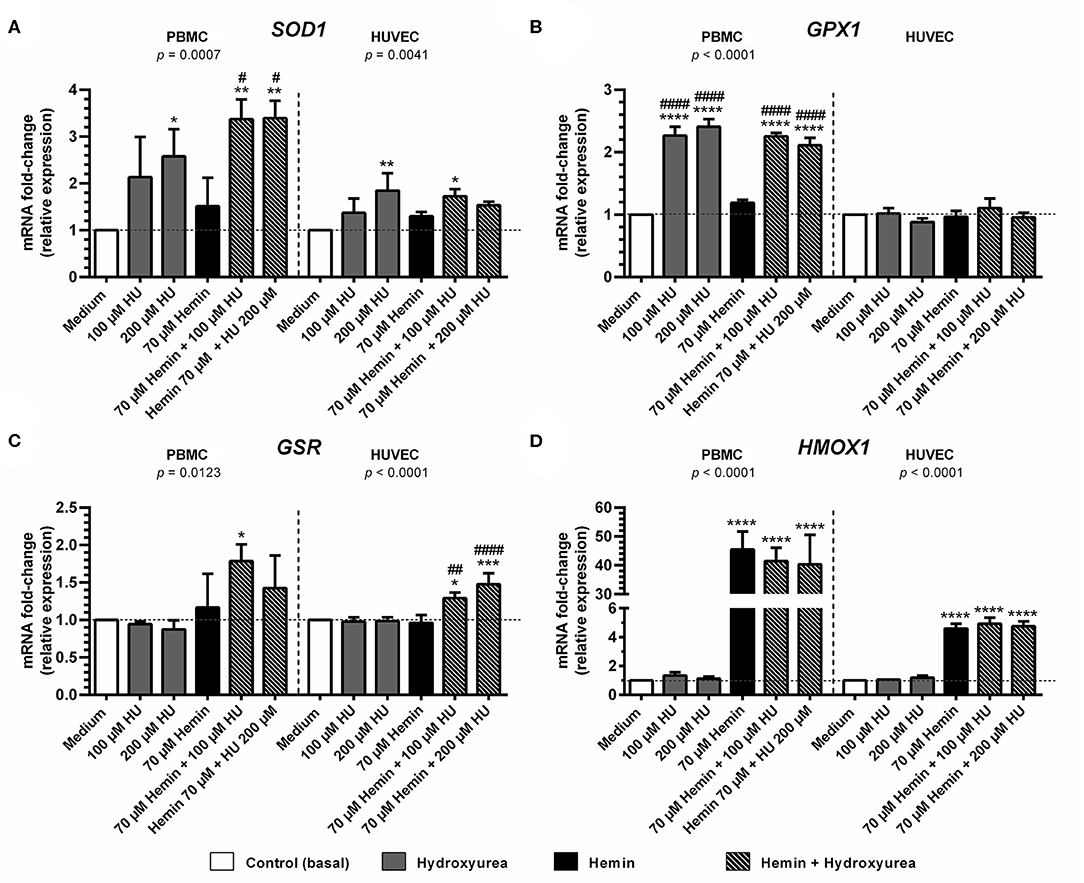
Figure 3. Effect of Hydroxyurea on induction of antioxidant response gene expression in PBMC and HUVEC treated with different concentrations of hydroxyurea (100 and 200 μM) in the presence or absence of 70 μM hemin for 4 h. (A) superoxide dismutase-1 (SOD1); (B) glutathione peroxidase (GPX1); (C) glutathione-disulfide reductase (GSR); (D) Heme-oxygenase 1 (HMOX1). Results correspond to the mean ± standard deviation of three independent experiments. Expression values determined by relative quantification using the following expression: fold-change = 2−Δ(ΔCT), where ΔCT = CTtarget-CThousekeeping and Δ(ΔCT) = ΔCTtreated−ΔCTcontrol (medium). Data were normalized to represent fold expression above controls for each gene. Statistical significance determined by one-way ANOVA, p < 0.05, followed by Tukey's post-hoc test: HU alone or HU + hemin vs. medium, or hemin vs. medium, *p < 0.05; **p < 0.01, ***p < 0.001, ****p < 0.0001; hemin + HU vs. hemin, #p < 0.05; ##p < 0.01; ####p < 0.0001.
Considerable GPX expression was observed in PBMCs treated with 100 μM (2.27 ± 0.14-fold, p < 0.0001) and 200 μM HU (2.40 ± 0.12-fold; p < 0.0001) (Figure 3B). Similar expression values were observed in hemin-treated PBMCs at both HU concentrations (2.25 ± 0.05-fold, p < 0.001 and 2.11 ± 0.11-fold, respectively). In contrast, GPX expression levels in HUVECS did not vary in response to the treatments.
Treatment with HU alone did not provoke increased GSR expression at any of the concentrations evaluated in either cell type evaluated (Figure 3C). However, an increase in GSR expression was observed in PBMCs and HUVECs submitted to combined HU plus hemin treatment. PBMCs treated with 100 μM or 200 μM of HU and 70 μM of hemin presented 1.79 ± 0.22-fold (p < 0.05) and 1.42 ± 0.43-fold increases in GSR expression, respectively, while HUVECs presented 1.30 ± 0.07 (p < 0.05) and 1.48 ± 0.15-fold (p < 0.001) higher expression in comparison to the negative control.
Significantly higher levels of HMOX1 were observed in hemin-treated PBMCs and HUVECs, regardless of HU concentration (Figure 3D). In PBMCs, increased HMOX1 expression was 45.5 ± 6.2-fold (p < 0.0001) vs. controls. HUVECs exhibited modest increases in HMOX1 expression (4.6 ± 0.32-fold; p < 0.0001) compared to PBMCs, despite high statistical significance. Despite a slight decrease in HMOX1 expression in PBMCs treated with 100 μM (41.5 ± 4.6-fold) and 200 μM HU (40.31 ± 10.2-fold) compared to hemin alone, combined HU plus hemin treatment did not significantly reduce this expression.
Microarray Analysis in HUVEC Suggests that HU Induces the Nrf2-Antioxidant Response Element/Electrophile Signaling Pathway Regulated by p62/SQSTM1
Preliminary canonical pathway analysis identified 39 genes related to Nrf2-mediated oxidative stress response in HUVECs (Table 2). HU treatment induced increased expression levels of SOD2 (1.852 Expr Log Ratio), GSR (2.882 Expr Log Ratio), GSTM2 (2.210 Expr Log Ratio), microsomal glutathione S-transferase 1 (MGST1) (1.733 Expr Log Ratio) and carbonyl reductase 1 (CR1) (1.727 Expr Log Ratio). We also found increased expression of phosphatidylinositol-4-phosphate 3-kinase catalytic subunit type 2 beta (PIK3C2B) (1.892 Expr Log Ratio), phosphoinositide-3-kinase regulatory subunit 3 (PIK3R) (1.597 Expr Log Ratio), protein kinases C beta (PRKCB) (4.026 Expr Log Ratio) and zeta (PRKCZ) (1.902 Expr Log Ratio), and glycogen synthase kinase 3 beta (GSK3B) (1.607 Expr Log Ratio). Moreover, HU induced increased p62/sequestosome (p62/SQSTM1) (1.639 Expr Log Ratio) expression and decreased expression of BTB domain and CNC homolog 1 (BACH1) (-1.721 Expr Log Ratio), as well as ubiquitin-conjugating enzyme E2 K (UBE2K) (−1.830 Expr Log Ratio). Table 3 presents the results of our upstream analyses, which predicted the activation of mature microRNAs, such as miR-155-5p (activation z-score = 2.840) and miR-141-3p (activation z-score = 2.801), as well as the activation of the Jun transcription regulator (activation z-score = 2.560).
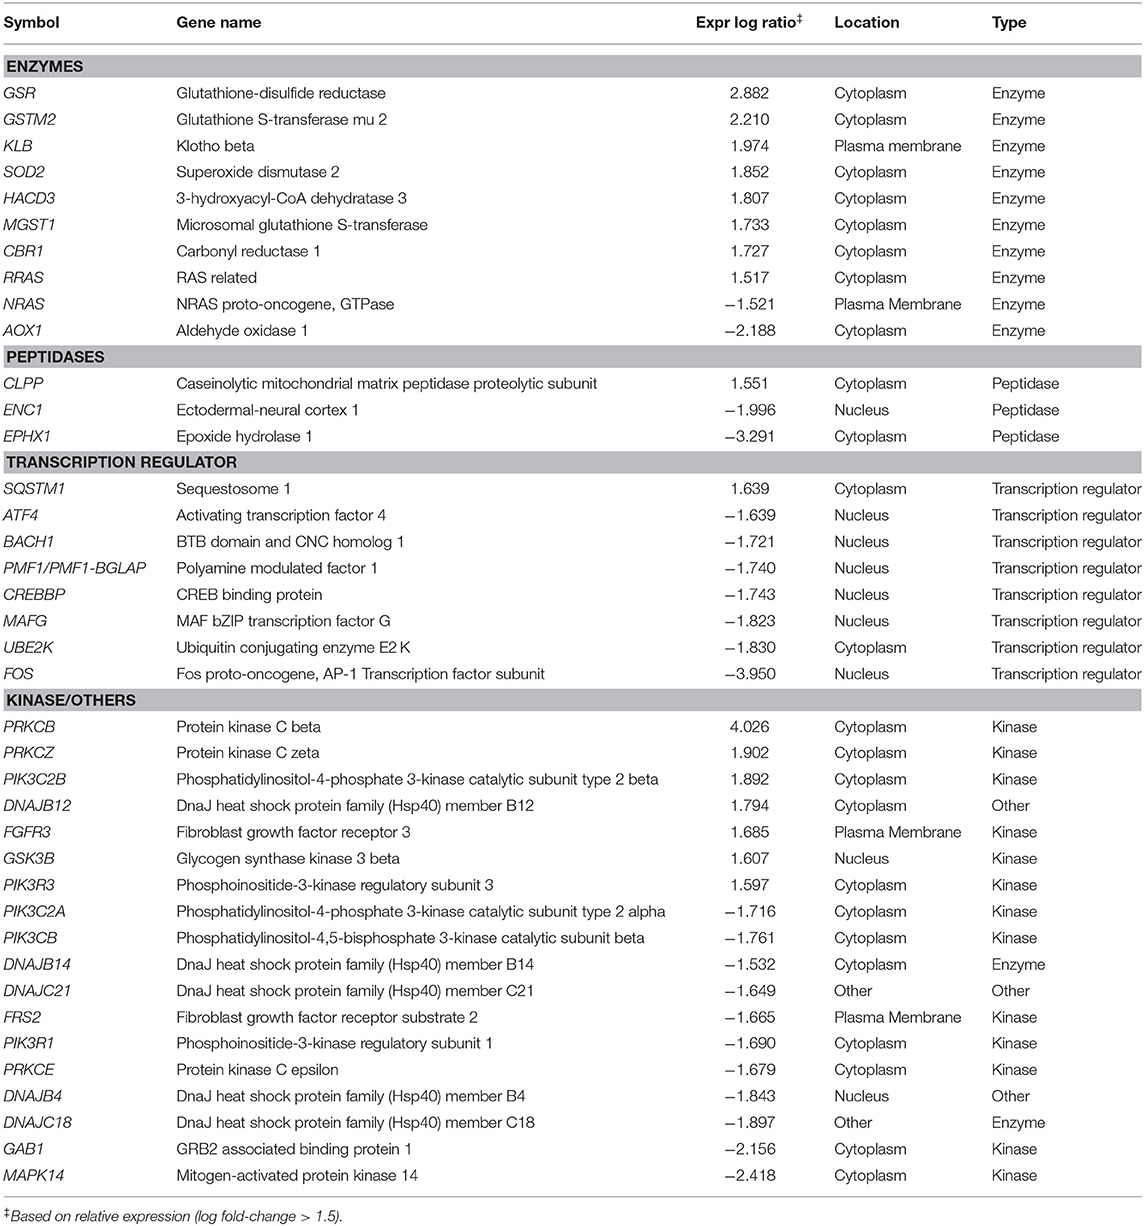
Table 2. Differential expression of genes involved in Nrf2-antioxidant/electrophile response element signaling pathway, identified through microarray analysis of HUVEC treated with hydroxyurea.
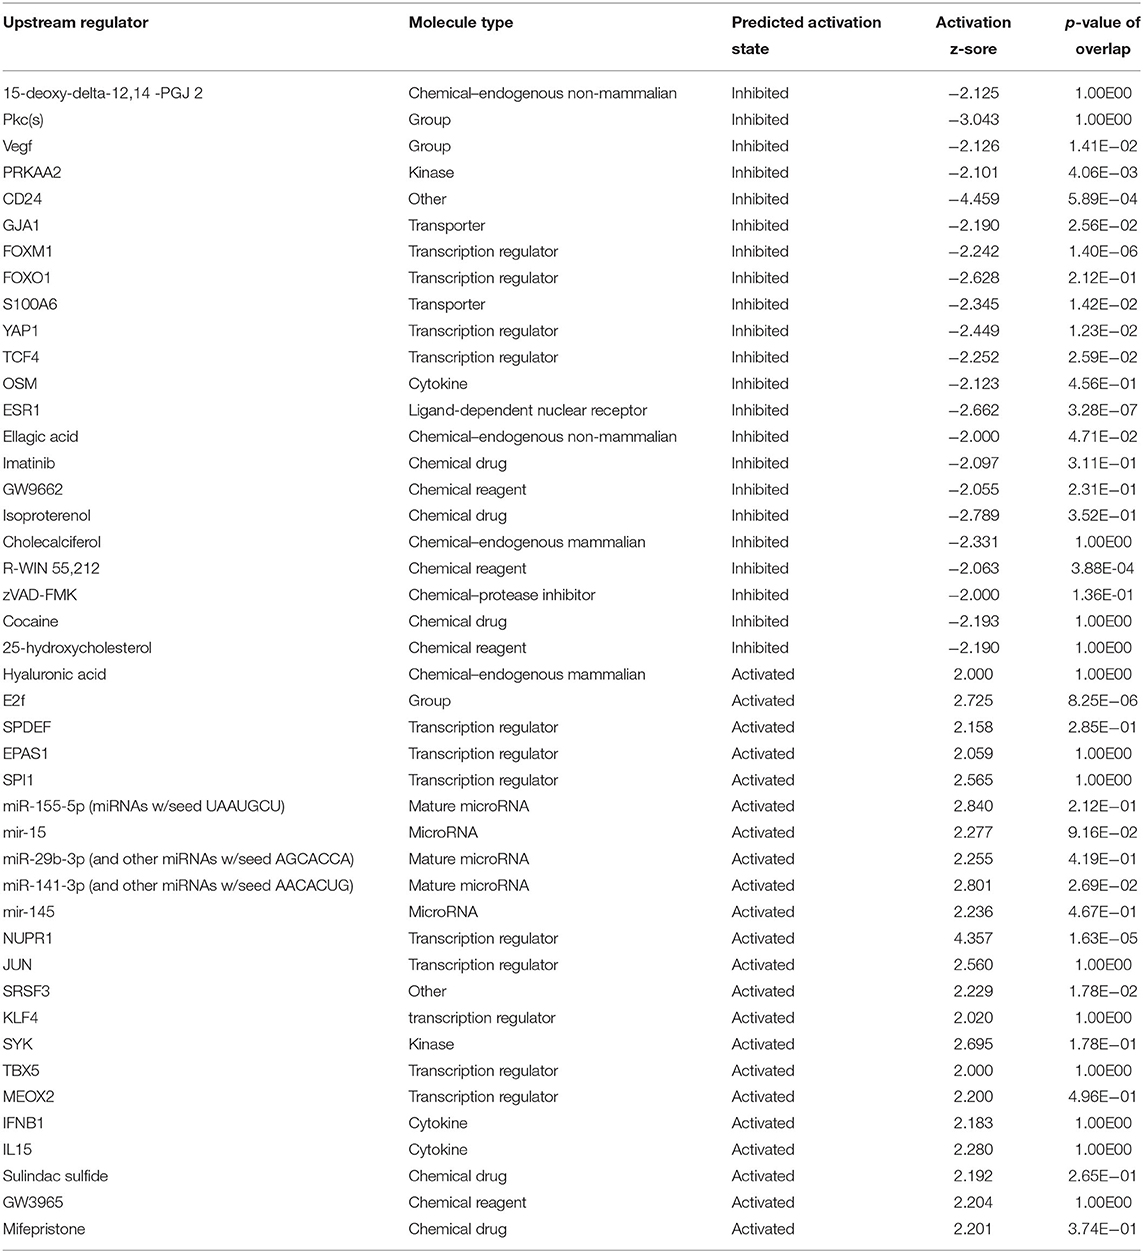
Table 3. Upstream analysis of genes identified through microarray analysis of HUVEC treated with hydroxyurea.
Discussion
The present study aimed to confirm the antioxidant potential of HU and investigate its effects on the modulation of the antioxidant cellular response. DPPH scavenging activity assays revealed that, despite higher IC50 values determined for HU at 100 and 200 μM, HU demonstrated considerable scavenging activity compared to controls. This finding suggests that HU may be able to directly neutralize free radicals in the extracellular microenvironment, which could be explained by its ability to donate a hydrogen atom electron in the neutralization of the radical compound DPPH (22). Moreover, our results also indicate that HU may scavenge ROS/RNS by inducing the antioxidant enzyme system. This finding is of great importance, as HU could potentially confer an important protective effect against direct oxidative attacks on membrane phospholipids, as well as prevent/minimize the triggering of activation responses involved in the initiation of the oxidative cascade and establishment of inflammation (23–26).
Both concentrations mentioned above are consistent with the plasma levels of HU generally observed in patients with SCA, which have been extensively used in in vitro studies (27–30). Accordingly, we chose these concentrations for our additional assays, in addition to combined therapy with hemin at 70 μM based on the findings from Carvalho et al. (31). Cytotoxicity assays involving hemin did not reveal any significant effects on cell viability in either PBMCs or HUVECs. This may be explained by the degree of resilience both cell types present in the pro-oxidative microenvironment promoted by hemin. It was previously shown that hemin can induce HO-1 production in monocytes, which promotes a cytoprotective effect through the inhibition of apoptosis (32). Our results corroborate this finding, as we observed higher levels of HMOX1 expression in PBMCs and HUVECs following treatment with hemin. HUVECs treated with HUs plus hemin presented significant increases in NO production, which corroborates previously published results. Other studies have suggested that treatment with HU in the presence of heme resulted in the production of iron nitrosyl-heme (Fe2+-NO), nitrite, and nitrate in SCA individuals (33–37).
Our investigation of antioxidant gene expression indicated differential expression profiles for each cell type after 4 h of incubation with HU in combination or not with hemin. Higher gene expression was seen in PBMCs than in HUVECs, which can be explained by the substantial capacity of recognition and effector responses in leukocytes, especially monocytes, present in PBMCs (38, 39). Our results show that treatment with HU in combination or not with hemin significantly provoked increases in SOD1 and GSR expression in both cell types, similarly to the higher GPX expression found in PBMCs. Previous studies have demonstrated that HU activates the GPX-mediated NO-cGMP pathway in patients with SCA (40, 41). This activation may be due to the induction of transcriptional factors and/or H2O2 production controlled by the production of GPX, which is dependent on the reduced glutathione (GSH) synthesized by GSR (33, 42–45). This would seem to corroborate the higher levels of SOD1, GPX and GSR expression found herein in response to HU treatment. Interestingly, no association between HU and HMOX1 expression was found, suggesting that the mechanism by which the antioxidant response system becomes activated does not involve the activation of HMOX1.
Microarray analyses were performed in HUVECs treated with HU to investigate the possible pathways involved in the antioxidant response system. HU induced significant increases in the expression of genes encoding antioxidant enzymes, such as SOD2, GSR, GSTM2, CBR1, MGST1, and KLB, as well as p62/SQSTM1. This antisickling agent was also associated with decreases in BACH1 and UBE2K expression. Studies have demonstrated a positive correlation between p62/SQSTM1 expression and Nrf2 induction (46–48), leading to the activation of antioxidant systems (49–51). BACH1 acts as a negative regulator of Nrf2, preventing the induction of an antioxidant response, while UBE2K is involved in Nrf2 degradation via the ubiquitin-proteasome system (49, 52, 53). Accordingly, the negative correlations observed between p62/SQSTM1 and BACH1, as well as between p62/SQSTM1 and UBE2K, suggest that HU may be capable of inducing an antioxidant response via the Nrf2 signaling pathway.
HUVECs treated with HU also presented increased expression of genes encoding PIK3C2B, PIK3R3, PRKCB, PRKCZ and GSK3B. Previous results have demonstrated that the activation of these genes is associated with the induction of the antioxidant response, mediated by the Nrf2 signaling pathway (54–57).
In addition, our upstream analyses performed in HUVECs treated with HU indicate the activation of miR-155-5p and miR-141-3p, which are involved in the inhibition of BACH1 and Keap1, respectively, in addition to the activation of Jun, which is involved in the activation of the Nrf2-mediated antioxidant pathway (55, 58–60).
Our results suggest that HU directly scavenges free radicals and can induce the expression of antioxidant genes via induction of the Nrf2 signaling pathway. In addition, the findings herein preliminarily expand on the previously described primary mechanisms of HU, i.e., the induction of HbF production and NO release. However, further in vitro and in vivo studies will be necessary to validate the role of the Nrf2-mediated antioxidant pathway proposed by the present study.
Data Availability Statement
All datasets generated for this study are included in the article/Supplementary Material.
Ethics Statement
The present study received approval from the Institutional Review Board of the Gonçalo Moniz Institute of the Oswaldo Cruz Foundation (IGM-FIOCRUZ). The patients/participants provided their written informed consent to participate in this study.
Author Contributions
SS, TP, and MG conceived and designed the study, performed statistical analyses, and wrote the manuscript. SS performed all experiments. JS, DZ, JV, SY, CA, SV, NL, and VB assisted in some experimentation and provided technical support and discussed the results and participated in manuscript elaboration. MG, TP, and SY critically revised the manuscript. All authors revised and approved the final version of the manuscript.
Funding
This work was supported by grants from the Brazilian National Council of Research (CNPq) (311888/2013-5) (MG); MCD/CNPq/MS-SCTIE-DECIT (409800/2006-6) (MG); the Foundation for the Support of Research in the State of Bahia (FAPESB) (3626/2013, 1431040053063, and 9073/2007) (MG); PPSUS/FAPESB (020/2013 EFP00007295) (MG); and the Coordination for the Improvement of Higher Education Personnel (CAPES) agency–Finance Code 001 (SY). The sponsors of this study are public or nonprofit organizations that support science in general.
Conflict of Interest
The authors declare that the research was conducted in the absence of any commercial or financial relationships that could be construed as a potential conflict of interest.
Acknowledgments
The authors would like to thank Dr. Ana Moretti, Ph.D. and Dr. Heraldo Possolo de Souza, M.D., both from the São Paulo State University Medical School (FMUSP-Brazil), for generously donating the HUVEC cells used in this study. We would also like to thank Andris K. Walter for his critical analysis and English revision of the final manuscript.
Supplementary Material
The Supplementary Material for this article can be found online at: https://www.frontiersin.org/articles/10.3389/fimmu.2020.01488/full#supplementary-material
Abbreviations
BACH1, BTB (Broad-Complex, Tramtrack and Bric-a-brac) Domain and CNC Homolog 1 Basic Leucine Zipper Transcription Factor 1; CBR1, Carbonyl reductase 1; DPPH, 2, 2-Diphenyl-1-picrylhydrazyl; GPX, Glutathione peroxidase; GSH, Reduced glutathione; GSR, Glutathione-disulfide reductase; GST, Glutathione S-transferase; GSTM2, Glutathione S-transferase mu 2; H2O2, Hydrogen peroxide; HbF, Fetal hemoglobin; HbS, Hemoglobin S; HMOX1, Heme oxigenase-1 gene; HU, Hydroxyurea; HUVEC, Human umbilical vein endothelial cells; Keap1, Kelch-like ECH-associated protein1; KLB, Klotho beta; MAPK, Mitogen-activated protein kinase; MGST1, Microsomal glutathione S-transferase; , Nitrate; Nrf2, Nuclear factor erythroid 2 (NF-E2) p45-related factor 2; NO, Nitric oxide; PBMC, Peripheral blood mononuclear cells; p62/SQSTM1, Sequestosome1; RNS, Reactive nitrogen species; ROS, Reactive oxygen stress; SCA, Sickle cell anemia; SOD-1, Superoxide dismutase-1.
References
1. Steinberg MH, Rodgers GP. Pathophysiology of sickle cell disease: role of cellular and genetic modifiers. Semin Hematol. (2001) 38:299–306. doi: 10.1016/S0037-1963(01)90023-X
2. Steinberg MH. Sickle cell anemia, the first molecular disease: overview of molecular etiology, pathophysiology, and therapeutic approaches. TheScientificWorldJournal. (2008) 8:1295–324. doi: 10.1100/tsw.2008.157
3. Belcher JD, Beckman JD, Balla G, Balla J, Vercellotti G. Heme degradation and vascular injury. Antioxid Redox Signal. (2010) 12:233–48. doi: 10.1089/ars.2009.2822
4. Nur E, Biemond BJ, Otten HM, Brandjes DP, Schnog JJ. Oxidative stress in sickle cell disease; pathophysiology and potential implications for disease management. Am J Hematol. (2011) 86:484–9. doi: 10.1002/ajh.22012
5. Chirico EN, Pialoux V. Role of oxidative stress in the pathogenesis of sickle cell disease. IUBMB Life. (2012) 64:72–80. doi: 10.1002/iub.584
6. Kato GJ, Piel FB, Reid CD, Gaston MH, Ohene-Frempong K, Krishnamurti L, et al. Sickle cell disease. Nat Rev Dis Primers. (2018) 4:18010. doi: 10.1038/nrdp.2018.10
7. Hebbel RP, Morgan WT, Eaton JW, Hedlund BE. Accelerated autoxidation and heme loss due to instability of sickle hemoglobin. Proc Natl Acad Sci USA. (1988) 85:237–41. doi: 10.1073/pnas.85.1.237
8. Bonaventura C, Taboy CH, Low PS, Stevens RD, Lafon C, Crumbliss AL. Heme redox properties of S-nitrosated hemoglobin A0 and hemoglobin S: implications for interactions of nitric oxide with normal and sickle red blood cells. J Biol Chem. (2002) 277:14557–63. doi: 10.1074/jbc.M107658200
9. Reiter CD, Wang X, Tanus-Santos JE, Hogg N, Cannon RO III, Schechter AN, et al. Cell-free hemoglobin limits nitric oxide bioavailability in sickle-cell disease. Nat Med. (2002) 8:1383–9. doi: 10.1038/nm1202-799
10. Kaul DK, Hebbel RP. Hypoxia/reoxygenation causes inflammatory response in transgenic sickle mice but not in normal mice. J Clin Invest. (2000) 106:411–20. doi: 10.1172/JCI9225
11. Schimmel M, Nur E, Biemond BJ, van Mierlo GJ, Solati S, Brandjes DP, et al. Nucleosomes and neutrophil activation in sickle cell disease painful crisis. Haematologica. (2013) 98:1797–803. doi: 10.3324/haematol.2013.088021
12. Chen G, Zhang D, Fuchs TA, Manwani D, Wagner DD, Frenette PS. Heme-induced neutrophil extracellular traps contribute to the pathogenesis of sickle cell disease. Blood. (2014) 123:3818–27. doi: 10.1182/blood-2013-10-529982
13. Balandya E, Reynolds T, Obaro S, Makani J. Alteration of lymphocyte phenotype and function in sickle cell anemia: implications for vaccine responses. Am J Hematol. (2016) 91:938–46. doi: 10.1002/ajh.24438
14. Charache S. Mechanism of action of hydroxyurea in the management of sickle cell anemia in adults. Semin Hematol. (1997) 34(3 Suppl. 3):15–21.
15. Agrawal RK, Patel RK, Shah V, Nainiwal L, Trivedi B. Hydroxyurea in sickle cell disease: drug review. Indian J Hematol Blood Transfusion. (2014) 30:91–6. doi: 10.1007/s12288-013-0261-4
16. Zhou B, Mo X, Liu X, Qiu W, Yen Y. Human ribonucleotide reductase M2 subunit gene amplification and transcriptional regulation in a homogeneous staining chromosome region responsible for the mechanism of drug resistance. Cytogenet Cell Genet. (2001) 95:34–42. doi: 10.1159/000057014
17. Ware RE. How i use hydroxyurea to treat young patients with sickle cell anemia. Blood. (2010) 115:5300–11. doi: 10.1182/blood-2009-04-146852
18. Martin D, Rojo AI, Salinas M, Diaz R, Gallardo G, Alam J, et al. Regulation of heme oxygenase-1 expression through the phosphatidylinositol 3-kinase/Akt pathway and the Nrf2 transcription factor in response to the antioxidant phytochemical carnosol. J Biol Chem. (2004) 279:8919–29. doi: 10.1074/jbc.M309660200
19. Bean CJ, Boulet SL, Ellingsen D, Pyle ME, Barron-Casella EA, Casella JF, et al. Heme oxygenase-1 gene promoter polymorphism is associated with reduced incidence of acute chest syndrome among children with sickle cell disease. Blood. (2012) 120:3822–8. doi: 10.1182/blood-2011-06-361642
20. Li WJ, Cheng XL, Liu J, Lin RC, Wang GL, Du SS, et al. Phenolic compounds and antioxidant activities of Liriope muscari. Molecules. (2012) 17:1797–808. doi: 10.3390/molecules17021797
21. Bryan NS, Grisham MB. Methods to detect nitric oxide and its metabolites in biological samples. Free Radic Biol Med. (2007) 43:645–57. doi: 10.1016/j.freeradbiomed.2007.04.026
22. Blois MS. Antioxidant determinations by the use of a stable free radical. Nature. (1958) 181:1199–200. doi: 10.1038/1811199a0
23. Halliwell B, Gutteridge JM. Lipid peroxidation, oxygen radicals, cell damage, and antioxidant therapy. Lancet. (1984) 1:1396–7. doi: 10.1016/S0140-6736(84)91886-5
24. Grijalba MT, Andrade PB, Meinicke AR, Castilho RF, Vercesi AE, Schreier S. Inhibition of membrane lipid peroxidation by a radical scavenging mechanism: a novel function for hydroxyl-containing ionophores. Free Radic Res. (1998) 28:301–18. doi: 10.3109/10715769809069282
25. Noor JI, Ikeda T, Ueda Y, Ikenoue T. A free radical scavenger, edaravone, inhibits lipid peroxidation and the production of nitric oxide in hypoxic-ischemic brain damage of neonatal rats. Am J Obstet Gynecol. (2005) 193:1703–8. doi: 10.1016/j.ajog.2005.03.069
26. Mittal M, Siddiqui MR, Tran K, Reddy SP, Malik AB. Reactive oxygen species in inflammation and tissue injury. Antioxid Redox Signal. (2014) 20:1126–67. doi: 10.1089/ars.2012.5149
27. Elias DBD, Carvalho TMDJP, Soares JEDS, Gonçalves RP. Standardization method for measurement of hydroxyurea by ultra high efficiency liquid chromatography in plasma of patients with sickle cell disease. Braz J Pharm Sci. (2014) 50:621–8. doi: 10.1590/S1984-82502014000300022
28. Lopes FCM, Ferreira R, Albuquerque DM, Silveira AAA, Costa R, Soares R, et al. In vitro and in vivo anti-angiogenic effects of hydroxyurea. Microvasc Res. (2014) 94:106–13. doi: 10.1016/j.mvr.2014.05.009
29. Almeida CB, Souza LE. Acute hemolytic vascular inflammatory processes are prevented by nitric oxide replacement or a single dose of hydroxyurea. Blood. (2015) 126:711–20. doi: 10.1182/blood-2014-12-616250
30. da Guarda CC, Santiago RP, Pitanga TN, Santana SS, Zanette DL, Borges VM, et al. Heme changes HIF-alpha, eNOS and nitrite production in HUVECs after simvastatin, HU, and ascorbic acid therapies. Microvasc Res. (2016) 106:128–36. doi: 10.1016/j.mvr.2016.04.002
31. Carvalho MOS, Araujo-Santos T, Reis JHO, Rocha LC, Cerqueira BAV, Luz NF, et al. Inflammatory mediators in sickle cell anaemia highlight the difference between steady state and crisis in paediatric patients. Br J Hametol. (2017) 182:933–6. doi: 10.1111/bjh.14896
32. Lang D, Reuter S, Buzescu T, August C, Heidenreich S. Heme-induced heme oxygenase-1 (HO-1) in human monocytes inhibits apoptosis despite caspase-3 up-regulation. Int Immunol. (2005) 17:155–65. doi: 10.1093/intimm/dxh196
33. Huang J, Kim-Shapiro DB, King SB. Catalase-mediated nitric oxide formation from hydroxyurea. J Med Chem. (2004) 47:3495–501. doi: 10.1021/jm030547z
34. King SB. Nitric oxide production from hydroxyurea. Free Radic Biol Med. (2004) 37:737–44. doi: 10.1016/j.freeradbiomed.2004.02.073
35. Lockamy VL, Shields H, Kim-Shapiro DB, King SB. Iron nitrosyl hemoglobin formation from the reaction of hydroxylamine and hemoglobin under physiological conditions. Biochim Biophys Acta. (2004) 1674:260–7. doi: 10.1016/j.bbagen.2004.07.003
36. King SB. N-hydroxyurea and acyl nitroso compounds as nitroxyl (HNO) and nitric oxide (NO) donors. Curr Top Med Chem. (2005) 5:665–73. doi: 10.2174/1568026054679362
37. Fotiou S, Fotiou D, Deliconstantinos G. Formation of heme-iron complexes with nitric oxide (NO) and peroxynitrite (ONOO-) after ultraviolet radiation as a protective mechanism in rat skin. In Vivo. (2009) 23:281–6.
38. Chaplin DD. Overview of the immune response. J Allergy Clin Immunol. (2010) 125(2 Suppl. 2):S3–23. doi: 10.1016/j.jaci.2009.12.980
39. Gladwin MT, Ofori-Acquah SF. Erythroid DAMPs drive inflammation in SCD. Blood. (2014) 123:3689–90. doi: 10.1182/blood-2014-03-563874
40. Cho C-S, Kato GJ, Yang SH, Bae SW, Lee JS, Gladwin MT, et al. Hydroxyurea-induced expression of glutathione peroxidase 1 in red blood cells of individuals with sickle cell anemia. Antioxid Redox Signal. (2010) 13:1–11. doi: 10.1089/ars.2009.2978
41. Itokua EK, Ngiyulu R, Makulo JR, Lepira FB, Aloni M, Sadiki H. GPx and Cu-Zn SOD activities in homozygous sickle cell anemia: the primary role of hydroxyurea. J. innov. res. health sci. biotechnol. (2016) 1:85–91. doi: 10.18644/jiresh-biotech.0000014
42. Malec J, Przybyszewski WM, Grabarczyk M, Sitarska E. Hydroxyurea has the capacity to induce damage to human erythrocytes which can be modified by radical scavengers. Biochem Biophys Res Commun. (1984) 120:566–73. doi: 10.1016/0006-291X(84)91292-0
43. Iyamu EW, Fasold H, Roa D, del Pilar Aguinaga M, Asakura T, Turner EA. Hydroxyurea-induced oxidative damage of normal and sickle cell hemoglobins in vitro: amelioration by radical scavengers. J Clin Lab Anal. (2001) 15:1–7. doi: 10.1002/1098-2825(2001)15:1<1::AID-JCLA1>3.0.CO;2-I
44. Sakano K, Oikawa S, Hasegawa K, Kawanishi S. Hydroxyurea induces site-specific DNA damage via formation of hydrogen peroxide and nitric oxide. Jpn J Cancer Res. (2001) 92:1166–74. doi: 10.1111/j.1349-7006.2001.tb02136.x
45. Nagai T, Tarumoto T, Miyoshi T, Ohmine K, Muroi K, Komatsu N, et al. Oxidative stress is involved in hydroxyurea-induced erythroid differentiation. Br J Haematol. (2003) 121:657–61. doi: 10.1046/j.1365-2141.2003.04309.x
46. Ishii T, Itoh K, Takahashi S, Sato H, Yanagawa T, Katoh Y, et al. Transcription factor Nrf2 coordinately regulates a group of oxidative stress-inducible genes in macrophages. J Biol Chem. (2000) 275:16023–9. doi: 10.1074/jbc.275.21.16023
47. Warabi E, Takabe W, Minami T, Inoue K, Itoh K, Yamamoto M, et al. Shear stress stabilizes NF-E2-related factor 2 and induces antioxidant genes in endothelial cells: role of reactive oxygen/nitrogen species. Free Radic Biol Med. (2007) 42:260–9. doi: 10.1016/j.freeradbiomed.2006.10.043
48. Maltese G, Psefteli P-M, Rizzo B, Srivastava S, Gnudi L, Mann GE, et al. The anti-ageing hormone klotho induces Nrf2-mediated antioxidant defences in human aortic smooth muscle cells. J Cell Mol Med. (2017) 21:621–7. doi: 10.1111/jcmm.12996
49. Copple IM, Lister A, Obeng AD, Kitteringham NR, Jenkins RE, Layfield R, et al. Physical and functional interaction of sequestosome 1 with Keap1 regulates the Keap1-Nrf2 cell defense pathway. J Biol Chem. (2010) 285:16782–8. doi: 10.1074/jbc.M109.096545
50. Furfaro AL, Traverso N, Domenicotti C, Piras S, Moretta L, Marinari UM, et al. The Nrf2/HO-1 axis in cancer cell growth and chemoresistance. Oxid Med Cell Longev. (2016) 2016:14. doi: 10.1155/2016/1958174
51. Taniguchi K, Yamachika S, He F, Karin M. p62/SQSTM1-Dr. Jekyll and Mr Hyde that prevents oxidative stress but promotes liver cancer. FEBS Lett. (2016) 590:2375–97. doi: 10.1002/1873-3468.12301
52. Cullinan SB, Gordan JD, Jin J, Harper JW, Diehl JA. The Keap1-BTB protein is an adaptor that bridges Nrf2 to a Cul3-based E3 ligase: oxidative stress sensing by a Cul3-Keap1 ligase. Mol Cell Biol. (2004) 24:8477–86. doi: 10.1128/MCB.24.19.8477-8486.2004
53. He X, Chen MG, Lin GX, Ma Q. Arsenic induces NAD(P)H-quinone oxidoreductase I by disrupting the Nrf2 x Keap1 x Cul3 complex and recruiting Nrf2 x Maf to the antioxidant response element enhancer. J Biol Chem. (2006) 281:23620–31. doi: 10.1074/jbc.M604120200
54. Nakaso K, Yano H, Fukuhara Y, Takeshima T, Wada-Isoe K, Nakashima K. PI3K is a key molecule in the Nrf2-mediated regulation of antioxidative proteins by hemin in human neuroblastoma cells. FEBS Lett. (2003) 546:181–4. doi: 10.1016/S0014-5793(03)00517-9
55. Niture SK, Khatri R, Jaiswal AK. Regulation of Nrf2-an update. Free Radic Biol Med. (2014) 66:36–44. doi: 10.1016/j.freeradbiomed.2013.02.008
56. Jain AK, Jaiswal AK. Phosphorylation of tyrosine 568 controls nuclear export of Nrf2. J Biol Chem. (2006) 281:12132–42. doi: 10.1074/jbc.M511198200
57. Niture SK, Jain AK, Shelton PM, Jaiswal AK. Src subfamily kinases regulate nuclear export and degradation of transcription factor Nrf2 to switch off Nrf2-mediated antioxidant activation of cytoprotective gene expression. J Biol Chem. (2017) 292:2048. doi: 10.1074/jbc.A117.255042
58. Pullarkat V, Meng Z, Tahara SM, Johnson CS, Kalra VK. Proteasome inhibition induces both antioxidant and hb f responses in sickle cell disease via the nrf2 pathway. Hemoglobin. (2014) 38:188–95. doi: 10.3109/03630269.2014.898651
59. Cheng LB, Li KR, Yi N, Li XM, Wang F, Xue B, et al. miRNA-141 attenuates UV-induced oxidative stress via activating Keap1-Nrf2 signaling in human retinal pigment epithelium cells and retinal ganglion cells. Oncotarget. (2017) 8:13186–94. doi: 10.18632/oncotarget.14489
Keywords: sickle cell anemia, hydroxyurea, hemin, antioxidant response, Nrf2
Citation: Santana SS, Pitanga TN, de Santana JM, Zanette DL, Vieira JJ, Yahouédéhou SCMA, Adanho CSA, Viana SM, Luz NF, Borges VM and Goncalves MS (2020) Hydroxyurea Scavenges Free Radicals and Induces the Expression of Antioxidant Genes in Human Cell Cultures Treated With Hemin. Front. Immunol. 11:1488. doi: 10.3389/fimmu.2020.01488
Received: 16 February 2020; Accepted: 08 June 2020;
Published: 17 July 2020.
Edited by:
Caroline Le Van Kim, Université Paris Diderot, FranceReviewed by:
Nicola Conran, Campinas State University, BrazilMarc Romana, INSERM U1134 Biologie Intégrée du Globule Rouge, France
Copyright © 2020 Santana, Pitanga, de Santana, Zanette, Vieira, Yahouédéhou, Adanho, Viana, Luz, Borges and Goncalves. This is an open-access article distributed under the terms of the Creative Commons Attribution License (CC BY). The use, distribution or reproduction in other forums is permitted, provided the original author(s) and the copyright owner(s) are credited and that the original publication in this journal is cited, in accordance with accepted academic practice. No use, distribution or reproduction is permitted which does not comply with these terms.
*Correspondence: Marilda Souza Goncalves, mari@bahia.fiocruz.br