 Gerjan J. Dekkema1*
 Theo Bijma1,2
 Pytrick G. Jellema1Anke Van Den Berg1
 Bart-Jan Kroesen3
 Coen A. Stegeman2
 Peter Heeringa1
 Wayel H. Abdulahad1,4
 Jan-Stephan Sanders2
- 1Department of Pathology and Medical Biology, University Medical Center Groningen, University of Groningen, Groningen, Netherlands
- 2Department of Internal Medicine, Division of Nephrology, University Medical Center Groningen, Groningen, Netherlands
- 3Medical Immunology Laboratory, Department of Laboratory Medicine, University Medical Center Groningen, Groningen, Netherlands
- 4Department of Rheumatology and Clinical Immunology, University Medical Center Groningen, University of Groningen, Groningen, Netherlands
Objectives: Regulatory T cells (Tregs) are frequently functionally impaired in patients with granulomatosis with polyangiitis (GPA). However, the mechanism underlying their impaired function is unknown. Here, we hypothesized that Treg dysfunction in GPA is due to altered microRNA (miRNA) expression.
Methods: RNA isolated from FACS-sorted memory (M) Tregs (CD4+CD45RO+CD25+CD127−) of 8 healthy controls (HCs) and 8 GPA patients without treatment was subjected to miRNA microarray analysis. Five differentially expressed miRNAs were validated in a larger cohort by reverse transcriptase quantitative polymerase chain reaction (RT-qPCR). An miRNA target gene database search revealed targets that were tested with RT-qPCR in MTregs from patients and HCs. cAMP levels were measured using flow cytometry.
Results: Microarray analysis revealed 19 differentially expressed miRNAs, of which miR-142-3p was confirmed to be significantly upregulated in MTregs from GPA patients compared to those from HCs (1.9-fold, p = 0.03). In vitro overexpression of miR-142-3p lowered the suppressive capacity of MTregs (2.1-fold, p = 0.03), and miR-142-3p expression correlated negatively with the suppressive capacity (rho = −0.446, p = 0.04). Overexpression of miR-142-3p significantly decreased cAMP levels (p = 0.02) and tended to decrease the mRNA levels of a predicted target gene, adenylate cyclase 9 (ADCY9; p = 0.06). In comparison to those from HCs, MTregs from GPA patients had lower ADCY9 mRNA levels (2-fold, p = 0.008) and produced significantly less cAMP after stimulation. Importantly, induction of cAMP production in miR-142-3p overexpressed MTregs by forskolin restored their suppressive function in vitro.
Conclusion: Overexpression of miR-142-3p in MTregs from GPA patients might cause functional impairment by targeting ADCY9, which leads to the suppression of cAMP production.
Introduction
Antineutrophil cytoplasmic autoantibody (ANCA)-associated vasculitides (AAV) constitute a heterogeneous group of autoimmune syndromes characterized by pauci-immune necrotizing inflammation of small- to medium-sized blood vessels (1). These vasculitides of unknown etiology are predominantly associated with the presence of ANCAs directed against either proteinase-3 (PR3) or myeloperoxidase (MPO) (2). Based on the presence of specific ANCAs and clinical symptoms, AAV can be subdivided into microscopic polyangiitis (MPA), eosinophilic granulomatosis with polyangiitis (EGPA) and granulomatosis with polyangiitis (GPA), which is predominantly associated with the presence of PR3-ANCAs (1).
Although current immunotherapeutic strategies underscore the crucial role of B cells in GPA pathogenesis, several observations support the involvement of T cells in this disease. The presence of abundant T cell infiltrates in GPA lesions, persistent T cell activation with imbalances in circulating CD4+T cell subsets and the induction of remission by T cell-targeted therapies highlight the important role of T cell-mediated responses in GPA (3–9). Similar to those with various other autoimmune diseases, patients with GPA have impaired regulatory T cell (Treg) function (10–13). In vitro experiments have shown that circulating Tregs from GPA patients have a reduced ability to suppress the proliferation of activated effector cells (14–16). However, the exact mechanisms that contribute to the functional impairment of Tregs in GPA are currently unknown.
microRNAs (miRNAs) are single-stranded, noncoding RNA molecules of 19–22 nucleotides that regulate gene expression at the posttranscriptional level by binding complementary regions in the 3′ UTR of target messenger RNA (mRNA), leading to the degradation or translational inhibition of target mRNA (17). In recent years, many studies have identified a large number of miRNAs involved in the regulation of various T cell functions (17–19) and differential expression in T cells and Tregs is associated with T cell-mediated autoimmune diseases such as systemic lupus erythematosus (SLE), rheumatoid arthritis (RA), psoriasis and ulcerative colitis (20–24). For example, reduced upregulation of miRNA-146a after T cell activation, was observed in patients with RA compared to healthy controls. This diminished upregulation of miR-146a facilitated a proinflammatory phenotype of Tregs by increased levels of STAT1, a direct target of miR-146a (23). To date, it is unknown whether miRNAs are differentially expressed in Tregs of GPA patients and whether specific miRNAs are linked to the observed impaired suppressive function of these Tregs. In the current study, we hypothesized that differentially expressed miRNAs underlie the diminished suppressive function of Tregs in GPA.
Since the expanded Treg population in the peripheral blood of GPA patients is confined to memory cells (7), we examined the differential miRNA expression profile in sorted MTregs, effector memory and naïve T cells from GPA patients.
Subjects and Methods
Subjects
Patients diagnosed with GPA based on the Chapel Hill Consensus classification and were PR3-ANCA positive were recruited (25). All included patients were in clinical remission with a Birmingham Vasculitis Activity Score (BVAS) of zero (26).
The inception cohort, containing eight patients with GPA and eight age- and sex-matched healthy controls, was selected for microarray-based miRNA expression profiling. Twenty-three patients and 23 healthy controls, including the patients selected for microarray analysis, were included in the validation cohort. Patient characteristics are shown in Table 1. This study was approved by the local Medical Ethics Committee (METC2010/057), and informed consent was obtained from all participants. The study was performed in accordance with the declaration of Helsinki.
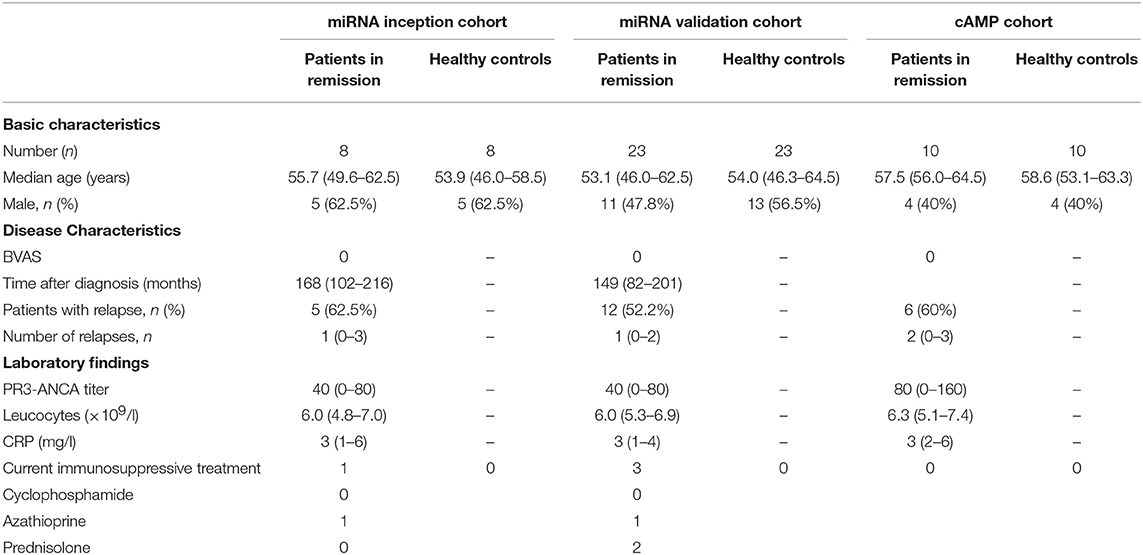
Table 1. Patient characteristics.
Sample Preparation and Treg Cell Sorting
Peripheral blood was collected, and peripheral blood mononuclear cells (PBMCs) were isolated using density-gradient centrifugation on Lymphoprep (Axis-Shield, Oslo, Norway). Isolated PBMCs were stained with anti-CD8-AF700 (Affymetrix, San Diego, CA, USA); anti-CD4-eF450 (Thermo Fisher Scientific, Breda, The Netherlands); and anti-CD45RO-FITC, anti-CD127-AF647, anti-CD25-PE, and anti-CCR7-PE-CY7 (BD Biosciences, Breda, The Netherlands) and sorted using FACS (MoFlo Astrios, Beckman Coulter, Woerden, The Netherlands). Memory Tregs (MTregs) (CD4+CD8−CD45RO+CD127−CD25high), naïve T (TNAÏVE) cells (CD4+CD8−CD45RO−CCR7+), and effector memory T (TEM) cells (CD4+CD8−CD45RO+CCR7−) were sorted (Figure 1A).
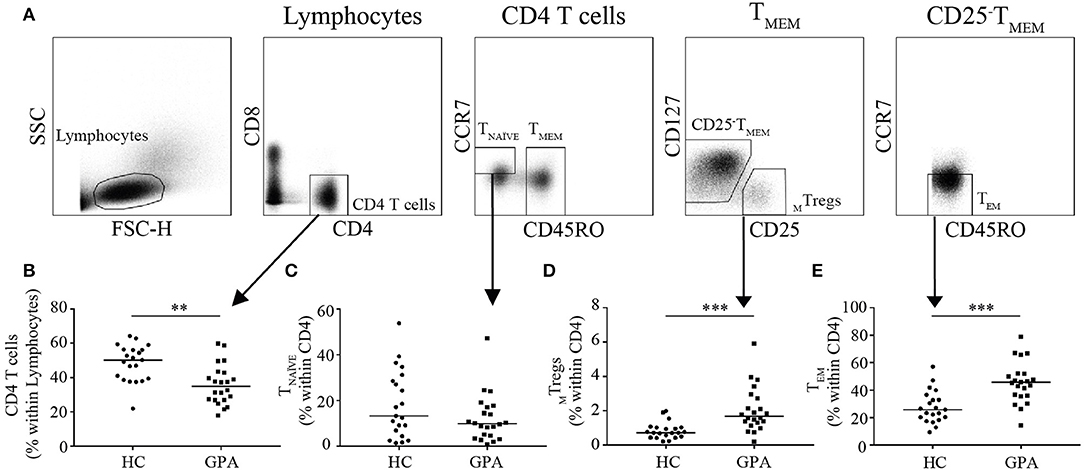
Figure 1. Frequencies of CD4+T cells and CD4+T cell subsets in healthy controls (HC) and GPA patients in remission (GPA). Representative FACS plots of sorted CD4+T cell subsets (A). CD4+T cell frequencies were lower in GPA than in HC (B). Within the CD4+T cell population, no differences were observed in naïve T (TNAVE) cells (CD4+CD45RO−CCR7−) (C), whereas the MTreg (CD4+CD127−CD25HighCD45RO+) frequency was higher in GPA than in HC (D). A significantly higher frequency of CD4+T effector memory (TEM) cells (CD4+CD45RO+CCR7−) was observed in GPA than in HC (E). **P = 0.01–0.001, ***P ≤ 0.001.
The purity of the sorted populations, was >95% for all samples. Samples were subsequently lysed using QIAzol lysis reagent (Qiagen, Venlo, The Netherlands) and stored at −80°C.
RNA Isolation
Total RNA was extracted using the miRNeasy Micro Kit (Qiagen) according to the manufacturer's instructions. After isolation, RNA samples were further purified using Micro Bio-Spin columns (Bio-Rad, Veenendaal, The Netherlands).
miRNA Microarray
Total RNA was hybridized to an Agilent G3 unrestricted miRNA microarray with an 8 × 60 K format (G4872-070156, based on miRBase Release 21.0) and scanned using an Agilent scanner according to the manufacturer's instructions (Agilent Technologies, Santa Clara, CA, USA). Array image data were extracted using Agilent Feature Extraction software (version 10.7). Data analysis was performed using GeneSpring software version 14.8. Raw data were normalized using the 95-percentile shift method. Control probes were excluded from the analysis. miRNAs with a signal intensity that reached >40% of the maximum signal in all samples of at least 1 cell type were considered for statistical analysis (two-way ANOVA with multiple sampling correction). A total of 19 miRNAs were differentially expressed, of which five miRNAs were selected for validation. This selection of the miRNAs for validation was based on availability of commercial assays (miR-6068, miR-4516 were not available at time of validation) and expression levels above detection limits of qPCR (miR-148a-3p, miR-27b-3p, miR-361-3p were expressed at low levels). The remaining 14 miRNAs were ranked based on both expression level and fold change between patients and healthy controls, and five miRNAs were selected for further validation.
RT-qPCR
miRNA and gene expression levels were determined by RT-qPCR. For miRNA assays, total RNA was reverse transcribed using the TaqMan MicroRNA Reverse Transcription kit in a multiplex RT approach in combination with TaqMan MicroRNA Assays (both Thermo Fisher Scientific) for hsa-Let-7g-5p (#002282), hsa-miR-20a-5p (#000580), hsa-miR-26a-5p (#000405), hsa-miR-142-3p (#000464), hsa-miR-146b-5p (#001097), and RNU48 (#001006).
For gene expression assays, random hexamer reverse transcription of total RNA was performed using the High-Capacity cDNA Reverse Transcription Kit (Thermo Fisher Scientific) according to the manufacturer's instructions.
qPCR was performed on a ViiA7 Real-Time PCR System (Thermo Fisher Scientific) using qPCR MasterMix Plus (Eurogentec, Liege, Belgium) and TaqMan MicroRNA Assays for the miRs and TaqMan Gene Assays for human adenylate cyclase 9 (ADCY9) (Hs00181599_m1) and GAPDH (Hs02786624_g1) (Thermo Fisher Scientific). Mean threshold cycle (Ct) values for all genes were quantified using QuantStudio Real-Time PCR software (Thermo Fisher Scientific). The expression levels of miRs relative to RNU48 and of ADCY9 relative to GAPDH were calculated using the 2−ΔCt method.
miRNA Transfection and Suppression Assay
For the suppression assay, healthy control MTregs and T responder (TRESP) cells (CD4+CD127+CD25−) were sorted. Sorted MTregs were expanded using anti-CD3/CD28 Dynabeads and 200 International Units (IU)/ml IL-2 (Peprotech, Rocky Hill, USA) according to the manufacturer's protocol (Thermo Fisher Scientific) in RPMI1640 (Lonza, Breda, The Netherlands) supplemented with 10% human pooled serum (HPS) and 60 μg/ml gentamycin sulfate (Lonza).
Expanded MTregs were transiently transfected with miRNA mimic scrambled control (SCR) or miRNA mimic hsa-miR-142-3p (MIM-142-3p) (Thermo Fisher Scientific) using the Nucleofector I system and the Human T cell Nucleofector kit (Lonza) according to the manufacturers' instructions. The Nucleofector program T-23 was used to transfect 50 nM mimic per 1.106 cells. Transfected MTregs were incubated overnight. MTregs were harvested and live cells were sorted on a MoFlo XDP cell sorter (Beckman Coulter).
For the suppression assay, TRESP (CD4+CD25−) cells were labeled with proliferation dye eFluor670 (1 μM; Thermo Fisher Scientific). TRESP cells and MTregs were cocultured at a 2:1 ratio and stimulated using anti-CD3/CD28 Dynabeads. After 3 days, the cells were stained with a viability dye, and TRESP cell proliferation was analyzed on a BD LSRII flow cytometer. For cyclic adenosine monophosphate (cAMP) measurements (see below), transfected MTregs were stimulated for 2 days with anti-CD3/CD28 Dynabeads.
Stability of miRNA-142-3p Expression
To assess miR-142-3p expression levels in MTregs after activation, sorted cells were stimulated for 24, 48, or 72 h with anti-CD3/CD28 Dynabeads and harvested for RNA isolation. Moreover, miR-142-3p expression levels in sorted unstimulated MTregs and naïve (N)Tregs (CD4+CD8−CD45RO−CD127−CD25+) were determined.
cAMP Production and FoxP3 Expression
PBMCs from 10 PR3-positive GPA patients and 10 matched HCs (cAMP cohort, Table 1) were stimulated with anti-CD3/anti-CD28 Dynabeads. Intracellular cAMP levels in MTregs were assessed by flow cytometry. First, cells were fixed and permeabilized using a FoxP3 Fixation and Permeabilization kit (eBioscience) according to the manufacturer's protocol. Next, cells were stained with an unconjugated mouse-anti-cAMP antibody followed by a secondary goat-anti-mouse-PE antibody (Abcam, Cambridge, UK). MTregs were stained using anti-CD3-PerCP, anti-CD4-eFluor450, anti-CD45RO-FITC, and anti-FoxP3-APC (eBioscience) and analyzed on a BD LSRII flow cytometer (Becton-Dickinson). Data were analyzed using Kaluza software (V1.5a, Beckman Coulter), and MTregs were defined as CD3+CD4+CD45RO+FoxP3high.
Forskolin Treatment of miR-142-3p Overexpressed MTregs
In order to assess if cAMP elevating agent could restore Treg function, miR-142-3p overexpressed MTregs were cultured in the presence and absence of 0.1 μM Forskolin (Sigma Aldrich, Saint Louis, Missouri, USA). Next, intracellular cAMP levels and suppressive capacity were assessed at 48 and 72 h, respectively.
Statistical Analysis
Statistical analyses were performed using GraphPad Prism version 7 for Windows (GraphPad Software, San Diego, California, USA). Data were tested for normality using the D'Agostino-Pearson normality test; normally distributed data were analyzed for significant differences by Student's T-test. A p-value <0.05 was considered significant. As miRNA levels, cAMP levels and the cAMP total area under the curve (AUC) were not normally distributed, differences between the groups were analyzed using the Mann–Whitney test.
Results
GPA Patients Have a Higher Percentage of Circulating MTregs
To explore differences in the distribution of circulating CD4+T cell subsets, we determined the frequency of MTregs (CD4+CD25HighCD45RO+), TEM (CD4+CD45RO+CCR7−), and TNAÏVE (CD4+CD45RO−CCR7+) in GPA patients and healthy controls. Patients had a significantly lower percentage of circulating CD4+T cells than did healthy controls (35.0 vs. 50.2%; Figure 1B). Additionally, the percentage of circulating MTregs was significantly increased in patients compared to healthy controls (1.7 vs. 0.7%; Figure 1D). The percentage of circulating TEM was significantly higher in patients than in healthy controls (45.6 vs. 25.7%; Figure 1E). No significant differences were found in the relative frequency of TNAÏVE (13.3 vs. 9.9%; Figure 1C).
Increased miR-142-3p Levels in GPA MTregs
We compared the miRNA expression profiles of MTregs, TEM, and TNAÏVE from healthy controls and GPA patients. Nineteen miRNAs were found to be differentially expressed, of which 17 were significantly upregulated and two were significantly downregulated in GPA patients (Table 2, Supplemental Table 1). Based on a combination of expression levels, fold change and the commercial availability of assays, the top-5 miRs were selected for validation (hsa-let-7g-5p, hsa-miR-20a-5p, hsa-miR-26a-5p, hsa-miR-142-3p, and hsa-miR-146b-5p).
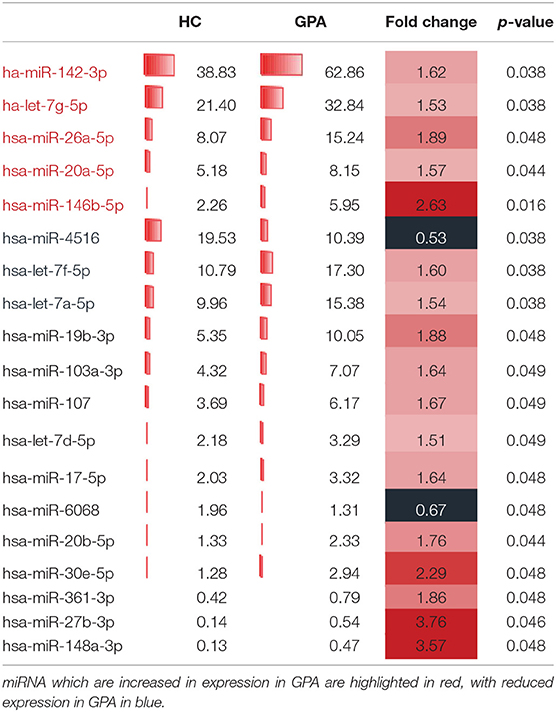
Table 2. Differentially expressed miRNAs in MTregs.
miR-142-3p expression levels were significantly higher in MTregs from patients than in those from healthy controls (1.9-fold; Figure 2A). No differences were found in the expression of the other selected miRs in MTregs or in the expression of all five miRs in TNAÏVE and TEM in the validation cohort (Supplemental Figure 1).
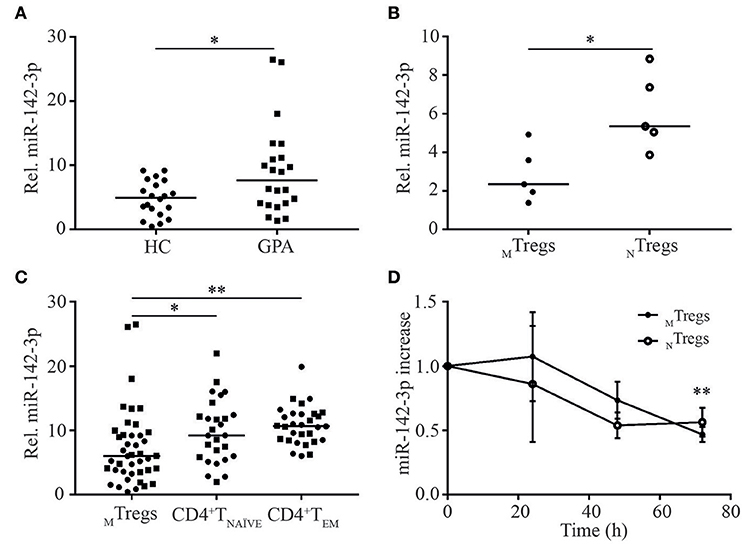
Figure 2. miR-142-3p is overexpressed in MTregs from GPA patients in remission and is differentially regulated in CD4+T cell subsets. miR-142-3p levels were significantly higher in MTregs from GPA patients (GPA) than in those from healthy controls (HC) (A). miR-142-3p levels were significantly lower in MTregs than in NTregs (B) and in CD4+TNAVE and CD4+TEM cells from HC (circles) and GPA patients (squares) (C). Stimulation of MTregs and NTregs with anti-CD3-CD28 Dynabeads led to significantly lower miR-142-3p levels over time (n = 5) (D). *P = 0.05–0.01, **P = 0.01–0.001.
Interestingly, miR-142-3p expression was significantly lower in freshly isolated MTregs than in naïve (N)Tregs (CD4+CD45RO−CD25+) from healthy controls (2.3-fold; Figure 2B) than in TNAÏVE and TEM cells from both healthy controls and patients (Figure 2C). The relatively low miR-142-3p expression levels in MTregs might indicate that this miRNA is tightly regulated and low levels are necessary for efficient Treg function. Moreover, miR-142-3p levels in MTregs and NTregs from healthy controls tended to be lower after 48 h of activation (p = 0.11) and were significantly downregulated after 72 h of stimulation (2-fold, p = 0.006; Figure 2D).
Patient-related variables, such as age (p = 0.37), sex (p = 0.19), ANCA titer (p = 0.67), or immunosuppressive treatment, were not associated with miR-142-3p levels.
Overexpression of miR-142-3p Reduces the Suppressive Capacity of MTregs, Potentially via ADCY9
To determine whether increased levels of miR-142-3p influence Treg function, MTregs from healthy controls were transfected with miR-142-3p mimic (MIM-142-3p) or scrambled control (SCR), and their ability to suppress TRESP cell proliferation was measured in vitro.
miR-142-3p levels were significantly increased in MTregs transfected with MIM-142-3p compared to those transfected with SCR (2.4-fold, p = 0.03; Figure 3C). Both SCR- and MIM-142-3p-transfected Tregs were able to suppress TRESP cell proliferation (Figures 3A,B). However, the suppressive capacity was significantly reduced in MIM-142-3p-transfected Tregs (2.1-fold, p = 0.03; Figure 3D). Importantly, we observed that miR-142-3p levels correlated negatively with the degree of suppression (rho = −0.446, p = 0.04; Figure 3E).
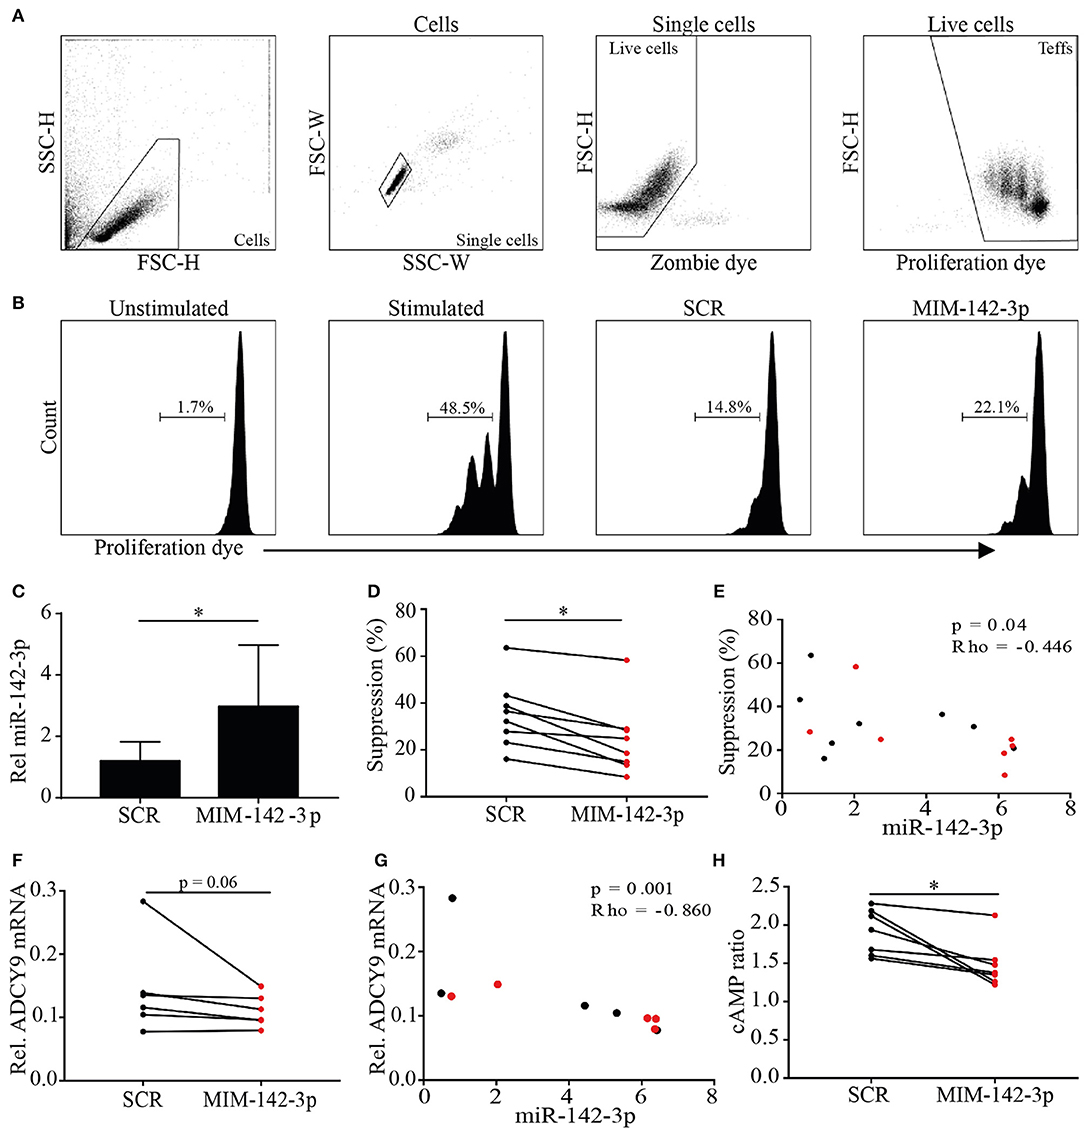
Figure 3. Overexpression of miR-142-3p reduces the suppressive capacity of MTregs in vitro. MTregs were transfected with scrambled (SCR) or miR-142-3p mimic (MIM-142-3p). Live MTregs were sorted and cocultured with responder T (TRESP) cells; after 48 h of stimulation, TRESP cell proliferation was determined (A,B). Transfection with MIM-142-3p significantly increased miR-142-3p levels (C) and reduced the suppressive capacity of MTregs (D). miR-142-3p levels correlated negatively with the suppressive capacity (E). Transfection with MIM-142-3p further decreased ADCY9 mRNA levels (F) and correlated negatively with miR-142-3p levels (G). Additionally, cAMP levels were significantly lower in MIM-142-3p-transfected MTregs (red) than in SCR-transfected MTregs (black) (H). *p = 0.05–0.01.
To explain the observed reduced suppressive capacity caused by miR-142-3p overexpression in Tregs, we searched for targets of miR-142-3p. Huang et al. reported that miR-142-3p overexpression in mouse Tregs reduces their suppressive capacity by targeting adenylate cyclase 9 (ADCY9). TargetScan version 7.1 predicted that ADCY9 is a highly conserved target of miR-142-3p, and human ADCY9 was confirmed as potential target (miRMap, TargetMiner). ADCY9 is a membrane-bound enzyme that catalyzes the conversion of adenosine triphosphate (ATP) into cAMP, which initiates suppression after delivery into effector T cells. Here, we hypothesized that miR-142-3p overexpression diminishes the Treg-mediated downregulation of ADCY9-induced cAMP production.
To assess whether miR-142-3p expression in Tregs influences ADCY9 and cAMP levels, ADCY9 and cAMP levels were measured after MIM-142-3p or SCR transfection. The overexpression of miR-142-3p was associated with decreased ADCY9 mRNA levels (1.3-fold, p = 0.06; Figure 3F). Importantly, miR-142-3p levels were significantly negatively correlated with ADCY9 mRNA levels (rho = −0.890, p = 0.001; Figure 3G). Additionally, after 48 h of stimulation, miR-142-3p overexpression led to significantly lower cAMP levels (1.4-fold, p = 0.02; Figure 3H).
Decreased ADCY9 mRNA and cAMP Levels in MTregs From GPA Patients
To provide further support for the role of ADCY9 in GPA, we assessed ADCY9 mRNA levels in MTregs from GPA patients and healthy controls. ADCY9 mRNA levels were significantly lower in patients than in healthy controls (3.3 vs. 1.8, p = 0.008; Figure 4A). However, no correlation between miR-142-3p expression and ADCY9 mRNA levels was found (Figure 4B).
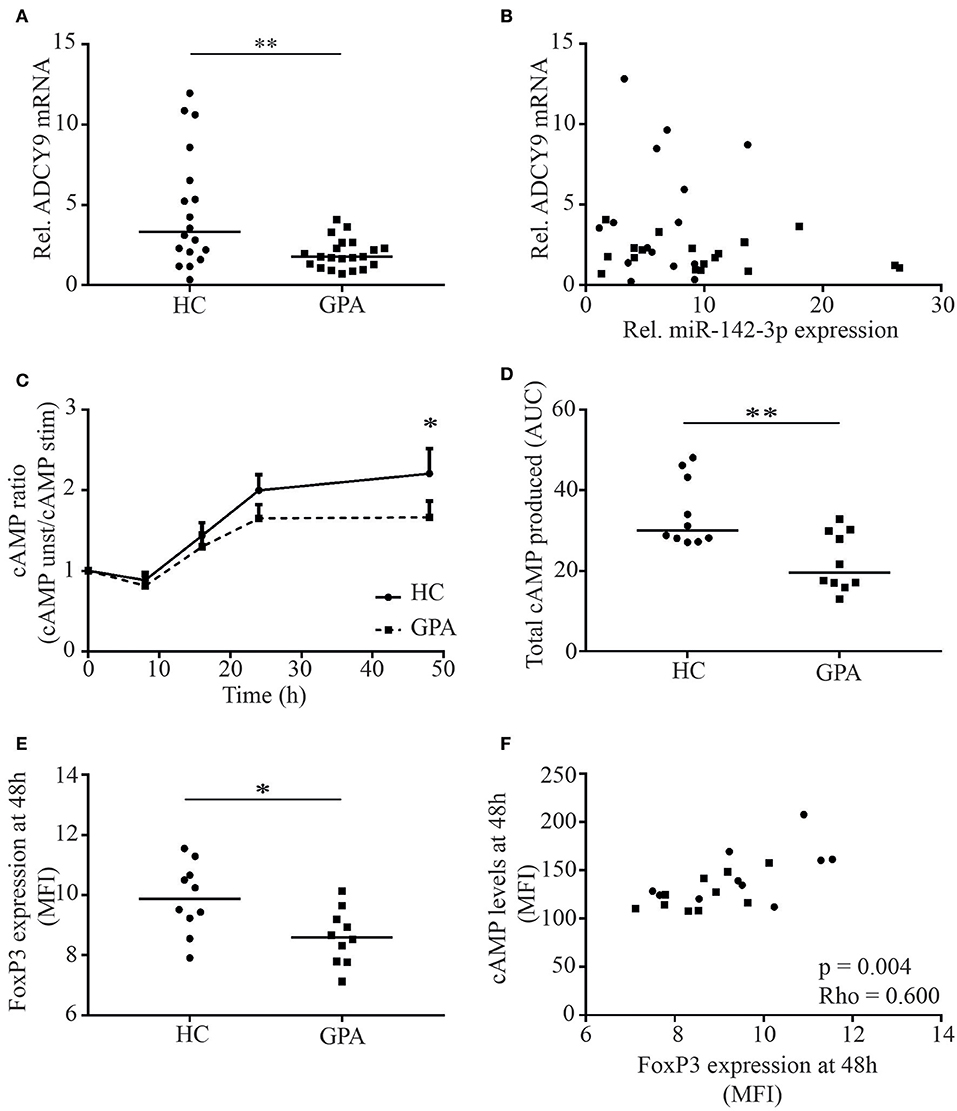
Figure 4. MTreg ADCY9 mRNA and cAMP levels are reduced in patients with GPA. ADCY9 mRNA levels were significantly lower in patients in remission (GPA) (A), but mRNA levels of ADCY9 did not correlate with miR-142-3p expression (B). In the cAMP cohort, cAMP levels were measured in MTregs upon stimulation. cAMP levels in MTregs were higher in healthy controls (HC) after 48 h stimulation (n = 10) than in GPA (n = 10) (C), and total cAMP production was significantly higher in HC than in GPA (D). Besides cAMP, FoxP3 expression was also higher in HC after stimulation (E) and FoxP3 levels correlated with cAMP (F). *p = 0.05–0.01, **p = 0.01–0.001.
As ADCY9 mRNA levels were reduced in GPA, we next investigated whether this affected cAMP levels in stimulated MTregs from GPA patients. cAMP levels were comparable at baseline but were significantly higher in MTregs from healthy controls after 48 h of stimulation (MFI: 149 vs. 121, p = 0.042; data not shown). Moreover, total cAMP at 48 h after stimulation was significantly higher in MTregs from healthy controls than in those from GPA patients (ratio: 2.4 vs. 1.9, p = 0.03; Figure 4C). In addition, the total amount of cAMP produced over 48 h of stimulation, as determined by the AUC, was significantly higher in MTregs of healthy controls (34.2 vs. 22.3, p = 0.003; Figure 4D). In line with cAMP, FoxP3 levels were significantly higher in MTregs from healthy controls than in those from patients (MFI: 9.6 vs. 8.5, p = 0.05; Figure 4E) and correlated strongly with cAMP levels (p = 0.003, rho = 0.600; Figure 4F) and total cAMP produced (p = 0.003, rho = 0.577).
cAMP Elevating Therapy Restores MTreg Function in vitro
We next aimed to restore the suppressive function of miR-142-3p overexpressed MTreg derived from healthy controls, by enhancing their intracellular cAMP levels in vitro. To this end, miR-142-3p overexpressed MTregs were treated with cAMP elevating agent, Forskolin. Indeed, upon treatment with Forskolin, intracellular cAMP levels was significantly increased in miR-142-3p transfected MTregs (Figure 5B).
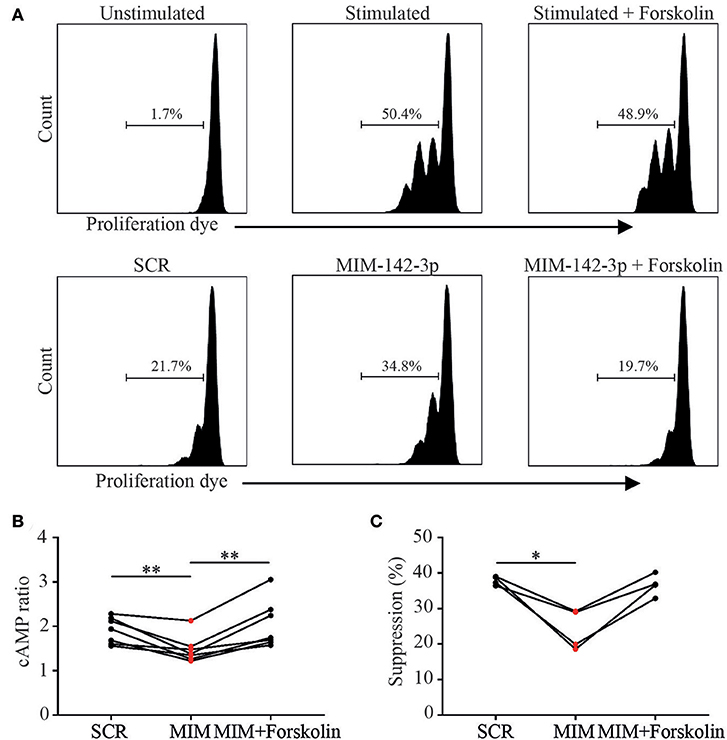
Figure 5. cAMP elevating agent Forskolin increases Treg function via the increase of cAMP. As proof of principle we tried to restore Treg function after miR-142-3p overexpression using cAMP elevating agent Forskolin. MTregs were transfected with scrambled (SCR) or miR-142-3p mimic (MIM-142-3p). Live MTregs were sorted and cocultured with responder T (TRESP) cells; after 48 h of stimulation, TRESP cell proliferation was determined (A). Upon treatment with Forskolin, cAMP levels increased significantly (B). Moreover, forskolin treatment tended to restore suppressive function in miR-142-3p overexpressed MTregs (C).*p = 0.05–0.01, **p = 0.01–0.001.
Importantly, Forskolin treatment tended to restore the suppressive function of miR-142-3p overexpressed MTregs in comparison to the non-transfected control cells (p = 0.06). In addition, no direct effect of Forskolin on TRESP proliferation was seen (Figures 5A,C). These results offer further proof that miR-142-3p overexpression inhibits cAMP/ADCY9 suppression and that the reduced Treg suppression, induced by miR-142-3p overexpression, could be restored by Forskolin.
Discussion
In the present study, we hypothesized that miRNA dysregulation could underlie the reduced MTreg function in patients with GPA. We found a significant increase in the miR-142-3p expression level in MTregs from GPA patients. In vitro overexpression of miR-142-3p in healthy control MTregs was associated with lower ADCY9 mRNA levels, reduced cAMP levels and a reduction in the suppressive capacity of Tregs. In addition, we found lower ADCY9 mRNA and cAMP levels in MTregs from GPA patients than in those from healthy controls. Based on these findings, we conclude that miR-142-3p overexpression can decrease Treg function and may underlie the functional impairment seen in Tregs of patients with GPA. This impaired Treg function could be explained by the ADCY9-dependent downregulation of cAMP, a crucial axis that is prominently involved in the suppressive function of Tregs (Figure 6).
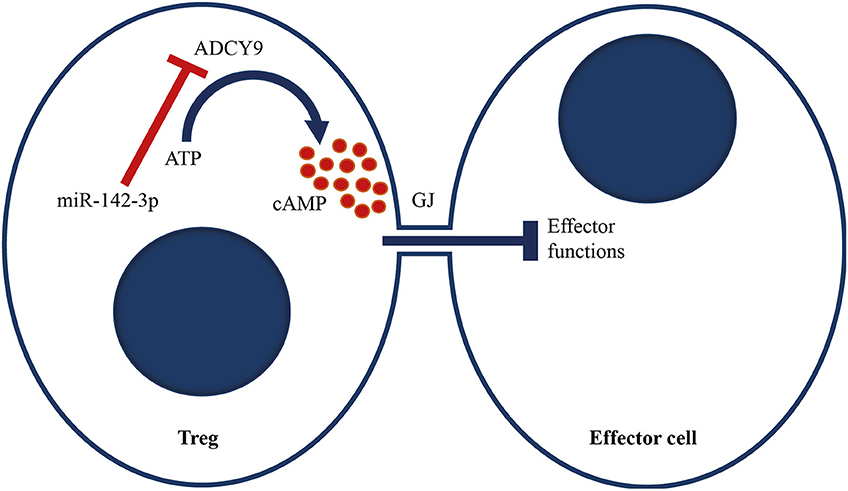
Figure 6. Proposed model of miR-142-3p, which targets the adenylyl cyclase 9/cAMP-mediated suppression of Tregs. We propose that miR-142-3p overexpression in GPA patients reduces ADCY9 levels, which leads to less conversion of ATP to cAMP upon stimulation. cAMP can be transferred to effector cells via a Gap junction (GJ). Upon transfection, cAMP levels in effector cells increase, which induces metabolic disruption and inhibits IL-2 production and cell proliferation. Increased miR-142-3p levels therefore decrease Treg function.
Numerous studies in autoimmune diseases, such as SLE, RA and psoriasis, have reported impaired Treg function (10–13). Additionally, the functional impairment of Tregs is well-established in GPA (14–16). However, the exact mechanisms underlying this reduced Treg suppressive capacity are not fully understood.
Tregs can suppress immune responses in several distinct manners, of which metabolic disruption via the transfer of cAMP to effector cells or the production of extracellular adenosine is considered a highly potent mechanism of suppression by Tregs (27–29). Klein et al. showed that blocking adenylyl cyclase (AC) activity reduced intracellular cAMP levels and the suppressive capacity of Tregs in vitro (30). This finding was supported by blocking AC activity in Tregs in vivo, which led to the inability to suppress graft-vs.-host disease in mice (30). Further evidence was provided by Bopp and coworkers, who demonstrated that blocking phosphodiesterase 4 (PDE4), a cAMP-degrading enzyme, in an allergic asthma mouse model led to increased cAMP levels and reduced airway hyperresponsiveness and inflammation (31).
Recent studies have shown that miR-142-3p can directly target ADCY9 mRNA and that its overexpression significantly reduces ADCY9 protein levels in mouse CD4+CD25+ Tregs (32, 33). In line with these results, we found that miR-142-3p overexpression in Tregs significantly reduced cAMP levels, which, in turn, led to a reduction in Treg-mediated suppression. Additionally, we found a significant trend toward a negative correlation between miR-142-3p levels and the suppressive capacity of Tregs, indicating that miR-142-3p influences Treg function via ADCY9 and cAMP.
Additionally, as proof of principle, cAMP elevating agent Forskolin was used to treat miR-142-3p overexpressed MTregs. We showed that Forskolin was able to restore cAMP levels of miR-142-3p overexpressed MTregs. Not only were cAMP levels restored, Forskolin also improved Treg mediated suppression. Our results are in line with a previous study which showed a significant increase in Treg function after treatment with cholera toxin, another cAMP elevating agent (34). Low dose Forskolin did not affect TRESP alone. All in all, these data further supports the functional impact of miR-142-3p overexpression on ADCY9/cAMP mediated suppression and the ability to restore this functional deficit.
To date, the exact mechanism of miR-142-3p regulation is not fully understood and could be linked to intrinsic or extrinsic factors. Previously, a link between FoxP3 and miR-142-3p expression was identified. Overexpression of FoxP3 in CD4+CD25−T cells led to a substantial decrease in miR-142-3p levels (33). In accordance with this finding, we found that miR-142-3p expression was lower in MTregs than in other FoxP3-negative CD4+T cell subsets. Moreover, we showed that upon activation of MTregs, FoxP3 expression and cAMP levels increased, whereas miR-142-3p levels decreased significantly. Collectively, these data indicate that FoxP3 is an important factor in the regulation of miR-142-3p expression in MTregs.
Previous studies have shown that Tregs can express different FoxP3 isoforms, of which the most common are FoxP3 full length, FoxP3 lacking exon 2 (FoxP3ΔE2), and FoxP3 lacking exons 2 and 7 (FoxP3ΔE2ΔE7) (35). The expression of FoxP3 isoforms other than the full-length form is associated with diminished Treg function (36). It has been reported that the proportion of FoxP3ΔE2-expressing Tregs is increased in AAV, including GPA, and correlates negatively with the degree of suppression (14). Since we demonstrate here that the suppressive capacity of Tregs is associated with miR-142-3p expression, one could speculate that FoxP3ΔE2-expressing Tregs have reduced suppressive capacity because of their diminished ability to suppress miR-142-3p expression. Clearly, further studies are required to investigate the potential links among FoxP3 isoform expression, miR-142-3p, and Treg function.
In addition to FoxP3 expression, immunosuppressive medication could also influence miR expression levels. A recent study showed that in vitro treatment of CD4+T cells with mycophenolate mofetil induced miR-142-3p expression (37). We did not detect a pronounced effect of treatment on miR-142-3p expression levels in our study samples. However, most of the included patients had not received immunosuppressive treatment at the time of sampling, so it would be difficult for us to detect such effects.
This study was cross-sectional; it would be interesting to study miR-142-3p levels in T cells from GPA patients in a longitudinal manner. Moreover, a previous study showed that some patients have normal Treg function in vitro (15). We also found that miR-142-3p levels were not higher in all patients than in healthy controls. Previous studies have also reported that not in all GPA patients Treg function is diminished. In our cohorts, we previously found that ~60–70% of GPA patients have Tregs with diminished suppressive function (15). This is in line with our finding that miR-142-3p is only increased in a subset of GPA patients. Additionally, it is conceivable that Tregs have additional defects not mediated by the miR-142-3p-ADCY9-cAMP axis.
In conclusion, increased expression of miR-142-3p in MTregs from patients with GPA might underlie their functional impairment by modulating ADCY9-mediated cAMP production. Our results suggest that therapeutic interventions aiming to restore miR-142-3p and cAMP levels in Tregs present a novel approach to restore Treg function in GPA patients and potentially in those with other autoimmune diseases in which there is a functional defect in the Treg subset.
Data Availability
The gene expression data was deposited in ArrayExpress - E-MTAB8282. All other data supporting the conclusions of this manuscript will be made available by the authors, without undue reservation, to any qualified researcher.
Ethics Statement
Peripheral blood samples from patients and healthy controls were used for this study. This study was approved by the local Medical Ethics Committee of the university of Groningen/University medical center Groningen (METC number: METC2010/057), and informed consent was obtained from all participants. The study was performed in accordance with the declaration of Helsinki.
Author Contributions
GD designed, performed experiments, did the data analysis, and wrote the manuscript. TB designed, performed experiments, and did the data analysis. PJ performed experiments. AV and B-JK assisted in the data analysis and designed the study. CS collected patient and control samples. PH and WA designed the study and contributed to the manuscript. J-SS had the initial idea and contributed to the manuscript.
Funding
This study was supported by personal grants of J-SS grants from the Dutch Kidney Foundation (grant no. 13OKJ39) and the Dutch Organization for Scientific Research (Clinical Fellow grant no. 907-14-542). WA and PH are supported by the European-Union's Horizon-2020 research and innovation program project RELENT (grant no. 668036).
Conflict of Interest Statement
The authors declare that the research was conducted in the absence of any commercial or financial relationships that could be construed as a potential conflict of interest.
Supplementary Material
The Supplementary Material for this article can be found online at: https://www.frontiersin.org/articles/10.3389/fimmu.2019.02170/full#supplementary-material
Supplemental Figure 1. Validation of five differentially expressed miRs in the validation cohort. Relative expression of the microRNAs hsa-let-7g-5p (A–C), hsa-miR-20a-5p (D–F), hsa-miR-26a-5p (G–I), hsa-miR-146b-5p (J,L), and hsa-miR-142-3p (M,N) relative to RNU48. miRNAs were validated using RT-qPCR analysis of total RNA from FACS-sorted MTregs (A,D,G,J), TNAÏVE cells (B,E,H,K,M), and TEM cells (C,F,I,L,N) from healthy controls (HC) and GPA patients in remission (REM). The relative expression of miR-142-3p compared to RNU48 in Tregs is depicted in Figure 1A.
Supplemental Table 1. Differentially expressed miRNAs in TNAÏVE and TEM.
References
1. Jennette JC, Falk RJ. Small-vessel vasculitis. N Engl J Med. (1997) 337:1512–23. doi: 10.1056/NEJM199711203372106
2. Kallenberg CG. Pathogenesis and treatment of ANCA-associated vasculitides. Clin Exp Rheumatol. (2015) 33(4 Suppl. 92):S11–4.
3. Sanders JS, Huitma MG, Kallenberg CG, Stegeman CA. Plasma levels of soluble interleukin 2 receptor, soluble CD30, interleukin 10 and B cell activator of the tumour necrosis factor family during follow-up in vasculitis associated with proteinase 3-antineutrophil cytoplasmic antibodies: associations with disease activity and relapse. Ann Rheum Dis. (2006) 65:1484–9. doi: 10.1136/ard.2005.046219
4. Dekkema GJ, Abdulahad WH, Bijma T, Moran SM, Ryan L, Little MA, et al. Urinary and serum soluble CD25 complements urinary soluble CD163 to detect active renal anti-neutrophil cytoplasmic autoantibody-associated vasculitis: a cohort study. Nephrol Dial Transplant. (2018) 34:234–42. doi: 10.1093/ndt/gfy018
5. Gephardt GN, Ahmad M, Tubbs RR. Pulmonary vasculitis (Wegener's granulomatosis). Immunohistochemical study of T and B cell markers. Am J Med. (1983) 74:700–4. doi: 10.1016/0002-9343(83)91030-6
6. Nogueira E, Hamour S, Sawant D, Henderson S, Mansfield N, Chavele KM, et al. Serum IL-17 and IL-23 levels and autoantigen-specific Th17 cells are elevated in patients with ANCA-associated vasculitis. Nephrol Dial Transplant. (2010) 25:2209–17. doi: 10.1093/ndt/gfp783
7. Abdulahad WH, van der Geld, Y M, Stegeman CA, Kallenberg CG. Persistent expansion of CD4+ effector memory T cells in Wegener's granulomatosis. Kidney Int. (2006) 70:938–47. doi: 10.1038/sj.ki.5001670
8. Abdulahad WH, Stegeman CA, Limburg PC, Kallenberg CG. Skewed distribution of Th17 lymphocytes in patients with Wegener's granulomatosis in remission. Arthritis Rheum. (2008) 58:2196–205. doi: 10.1002/art.23557
9. Langford CA, Monach PA, Specks U, Seo P, Cuthbertson D, McAlear CA, et al. An open-label trial of abatacept (CTLA4-IG) in non-severe relapsing granulomatosis with polyangiitis (Wegener's). Ann Rheum Dis. (2014) 73:1376–9. doi: 10.1136/annrheumdis-2013-204164
10. Bonelli M, Savitskaya A, von Dalwigk K, Steiner CW, Aletaha D, Smolen JS, et al. Quantitative and qualitative deficiencies of regulatory T cells in patients with systemic lupus erythematosus (SLE). Int Immunol. (2008) 20:861–8. doi: 10.1093/intimm/dxn044
11. Miyabe C, Miyabe Y, Strle K, Kim ND, Stone JH, Luster AD, et al. An expanded population of pathogenic regulatory T cells in giant cell arteritis is abrogated by IL-6 blockade therapy. Ann Rheum Dis. (2017) 76:898–905. doi: 10.1136/annrheumdis-2016-210070
12. Sugiyama H, Gyulai R, Toichi E, Garaczi E, Shimada S, Stevens SR, et al. Dysfunctional blood and target tissue CD4+CD25high regulatory T cells in psoriasis: mechanism underlying unrestrained pathogenic effector T cell proliferation. J Immunol. (2005) 174:164–73. doi: 10.4049/jimmunol.174.1.164
13. Chavele KM, Ehrenstein MR. Regulatory T-cells in systemic lupus erythematosus and rheumatoid arthritis. FEBS Lett. (2011) 585:3603–10. doi: 10.1016/j.febslet.2011.07.043
14. Free ME, Bunch DO, McGregor JA, Jones BE, Berg EA, Hogan SL, et al. Patients with antineutrophil cytoplasmic antibody-associated vasculitis have defective Treg cell function exacerbated by the presence of a suppression-resistant effector cell population. Arthritis Rheum. (2013) 65:1922–33. doi: 10.1002/art.37959
15. Abdulahad WH, Stegeman CA, van der Geld, Y M, Doornbos-van der Meer B, Limburg PC, Kallenberg CG. Functional defect of circulating regulatory CD4+ T cells in patients with Wegener's granulomatosis in remission. Arthritis Rheum. (2007) 56:2080–91. doi: 10.1002/art.22692
16. Morgan MD, Day CJ, Piper KP, Khan N, Harper L, Moss PA, et al. Patients with Wegener's granulomatosis demonstrate a relative deficiency and functional impairment of T-regulatory cells. Immunology. (2010) 130:64–73. doi: 10.1111/j.1365-2567.2009.03213.x
17. Monticelli S. MicroRNAs in T helper cell differentiation and plasticity. Semin Immunol. (2013) 25:291–8. doi: 10.1016/j.smim.2013.10.015
18. Kroesen BJ, Teteloshvili N, Smigielska-Czepiel K, Brouwer E, Boots AM, van den Berg A, et al. Immuno-miRs: critical regulators of T-cell development, function and ageing. Immunology. (2015) 144:1–10. doi: 10.1111/imm.12367
19. Soltanzadeh-Yamchi M, Shahbazi M, Aslani S, Mohammadnia-Afrouzi M. MicroRNA signature of regulatory T cells in health and autoimmunity. Biomed Pharmacother. (2018) 100:316–23. doi: 10.1016/j.biopha.2018.02.030
20. Ding S, Liang Y, Zhao M, Liang G, Long H, Zhao S, et al. Decreased microRNA-142-3p/5p expression causes CD4+ T cell activation and B cell hyperstimulation in systemic lupus erythematosus. Arthritis Rheum. (2012) 64:2953–63. doi: 10.1002/art.34505
21. Stagakis E, Bertsias G, Verginis P, Nakou M, Hatziapostolou M, Kritikos H, et al. Identification of novel microRNA signatures linked to human lupus disease activity and pathogenesis: miR-21 regulates aberrant T cell responses through regulation of PDCD4 expression. Ann Rheum Dis. (2011) 70:1496–506. doi: 10.1136/ard.2010.139857
22. Smigielska-Czepiel K, van den Berg A, Jellema P, van der Lei, R J, Bijzet J, Kluiver J, et al. Comprehensive analysis of miRNA expression in T-cell subsets of rheumatoid arthritis patients reveals defined signatures of naive and memory Tregs. Genes Immun. (2014) 15:115–25. doi: 10.1038/gene.2013.69
23. Zhou Q, Haupt S, Kreuzer JT, Hammitzsch A, Proft F, Neumann C, et al. Decreased expression of miR-146a and miR-155 contributes to an abnormal Treg phenotype in patients with rheumatoid arthritis. Ann Rheum Dis. (2015) 74:1265–74. doi: 10.1136/annrheumdis-2013-204377
24. Yang X, He Q, Guo Z, Xiong F, Li Y, Pan Y, et al. MicroRNA-425 facilitates pathogenic Th17 cell differentiation by targeting forkhead box O1 (Foxo1) and is associated with inflammatory bowel disease. Biochem Biophys Res Commun. (2018) 496:352–8. doi: 10.1016/j.bbrc.2018.01.055
25. Jennette JC, Falk RJ, Bacon PA, Basu N, Cid MC, Ferrario F, et al. 2012 revised International Chapel Hill Consensus Conference Nomenclature of Vasculitides. Arthritis Rheum. (2013) 65:1–11. doi: 10.1002/art.37715
26. Mukhtyar C, Lee R, Brown D, Carruthers D, Dasgupta B, Dubey S, et al. Modification and validation of the Birmingham Vasculitis Activity Score (version 3). Ann Rheum Dis. (2009) 68:1827–32. doi: 10.1136/ard.2008.101279
27. Bodor J, Bopp T, Vaeth M, Klein M, Serfling E, Hunig T, et al. Cyclic AMP underpins suppression by regulatory T cells. Eur J Immunol. (2012) 42:1375–84. doi: 10.1002/eji.201141578
28. Bopp T, Becker C, Klein M, Klein-Hessling S, Palmetshofer A, Serfling E, et al. Cyclic adenosine monophosphate is a key component of regulatory T cell-mediated suppression. J Exp Med. (2007) 204:1303–10. doi: 10.1084/jem.20062129
29. Klein M, Bopp T. Cyclic AMP represents a crucial component of Treg cell-mediated immune regulation. Front Immunol. (2016) 7:315. doi: 10.3389/fimmu.2016.00315
30. Klein M, Vaeth M, Scheel T, Grabbe S, Baumgrass R, Berberich-Siebelt F, et al. Repression of cyclic adenosine monophosphate upregulation disarms and expands human regulatory T cells. J Immunol. (2012) 188:1091–7. doi: 10.4049/jimmunol.1102045
31. Bopp T, Dehzad N, Reuter S, Klein M, Ullrich N, Stassen M, et al. Inhibition of cAMP degradation improves regulatory T cell-mediated suppression. J Immunol. (2009) 182:4017–24. doi: 10.4049/jimmunol.0803310
32. Talebi F, Ghorbani S, Chan WF, Boghozian R, Masoumi F, Ghasemi S, et al. MicroRNA-142 regulates inflammation and T cell differentiation in an animal model of multiple sclerosis. J Neuroinflammation. (2017) 14:55. doi: 10.1186/s12974-017-0832-7
33. Huang B, Zhao J, Lei Z, Shen S, Li D, Shen GX, et al. miR-142-3p restricts cAMP production in CD4+CD25- T cells and CD4+CD25+ TREG cells by targeting AC9 mRNA. EMBO Rep. (2009) 10:180–5. doi: 10.1038/embor.2008.224
34. Riccomi A, Gesa V, Sacchi A, De Magistris MT, Vendetti S. Modulation of phenotype and function of human CD4(+)CD25(+) T regulatory lymphocytes mediated by cAMP-elevating agents. Front Immunol. (2016) 7:358. doi: 10.3389/fimmu.2016.00358
35. Ryder LR, Bartels EM, Woetmann A, Madsen HO, Odum N, Bliddal H, et al. FoxP3 mRNA splice forms in synovial CD4+ T cells in rheumatoid arthritis and psoriatic arthritis. APMIS. (2012) 120:387–96. doi: 10.1111/j.1600-0463.2011.02848.x
36. Joly AL, Liu S, Dahlberg CI, Mailer RK, Westerberg LS, Andersson J. Foxp3 lacking exons 2 and 7 is unable to confer suppressive ability to regulatory T cells in vivo. J Autoimmun. (2015) 63:23–30. doi: 10.1016/j.jaut.2015.06.009
Keywords: ANCA—associated vasculitis, Treg—regulatory T cell, auto immune, microRNA, suppressive function
Citation: Dekkema GJ, Bijma T, Jellema PG, Van Den Berg A, Kroesen B-J, Stegeman CA, Heeringa P, Abdulahad WH and Sanders J-S (2019) Increased miR-142-3p Expression Might Explain Reduced Regulatory T Cell Function in Granulomatosis With Polyangiitis. Front. Immunol. 10:2170. doi: 10.3389/fimmu.2019.02170
Received: 28 April 2019; Accepted: 28 August 2019;
Published: 12 September 2019.
Edited by:
Attila Mócsai, Semmelweis University, HungaryReviewed by:
Giuseppe Nocentini, University of Perugia, ItalyMaria Grazia Petrillo, National Institute of Environmental Health Sciences (NIEHS), United States
Copyright © 2019 Dekkema, Bijma, Jellema, Van Den Berg, Kroesen, Stegeman, Heeringa, Abdulahad and Sanders. This is an open-access article distributed under the terms of the Creative Commons Attribution License (CC BY). The use, distribution or reproduction in other forums is permitted, provided the original author(s) and the copyright owner(s) are credited and that the original publication in this journal is cited, in accordance with accepted academic practice. No use, distribution or reproduction is permitted which does not comply with these terms.
*Correspondence: Gerjan J. Dekkema, Zy5qLmRla2tlbWEmI3gwMDA0MDt1bWNnLm5s