 S. John Calise
 Georges Abboud
 Hideko Kasahara
 Laurence Morel
 Edward K. L. Chan
94% of researchers rate our articles as excellent or good
Learn more about the work of our research integrity team to safeguard the quality of each article we publish.
Find out more
ORIGINAL RESEARCH article
Front. Immunol. , 29 November 2018
Sec. T Cell Biology
Volume 9 - 2018 | https://doi.org/10.3389/fimmu.2018.02789
Inosine monophosphate dehydrogenase (IMPDH) catalyzes the conversion of IMP to xanthosine monophosphate, the rate-limiting step in de novo guanosine monophosphate (GMP) synthesis. In cultured cells, IMPDH polymerizes into micron-scale filamentous structures when GMP synthesis is inhibited by depletion of purine precursors or by various drugs, including mycophenolic acid, ribavirin, and methotrexate. IMPDH filaments also spontaneously form in undifferentiated mouse embryonic stem cells and induced pluripotent stem cells, hinting they might function in various highly proliferative cell types. Therefore, we investigated IMPDH filament formation in human and murine T cells, which rely heavily on de novo guanine nucleotide synthesis to rapidly proliferate in response to antigenic challenge. We discovered extensive in vivo IMPDH filament formation in mature T cells, B cells, and other proliferating splenocytes of normal, adult B6 mice. Both cortical and medullary thymocytes in young and old mice also showed considerable assembly of IMPDH filaments. We then stimulated primary human peripheral blood mononuclear cells ex vivo with T cell mitogens phytohemagglutinin (PHA), concanavalin A (ConA), or antibodies to CD3 and CD28 for 72 h. We detected IMPDH filaments in 40–60% of T cells after activation compared to 0–10% of unstimulated T cells. Staining of activated T cells for the proliferation marker Ki-67 also showed an association between IMPDH filament formation and proliferation. Additionally, we transferred ovalbumin-specific CD4+ T cells from B6.OT-II mice into B6.Ly5a recipient mice, challenged these mice with ovalbumin, and harvested spleens 6 days later. In these spleens, we identified abundant IMPDH filaments in transferred T cells by immunofluorescence, indicating that IMPDH also polymerizes during in vivo antigen-specific T cell activation. Overall, our data indicate that IMPDH filament formation is a novel aspect of T cell activation and proliferation, and that filaments might be useful morphological markers for T cell activation. The data also suggest that in vivo IMPDH filament formation could be occurring in a variety of proliferating cell types throughout the body. We propose that T cell activation will be a valuable model for future experiments probing the molecular mechanisms that drive IMPDH polymerization, as well as how IMPDH filament formation affects cell function.
The ability of various enzymes to polymerize into higher-order structures has been demonstrated over the last few decades (1). Classic examples include acetyl-CoA carboxylase (2), glutamate dehydrogenase (3), and glutamine synthetase (4). More recently, unbiased screens have established that formation of reversible polymers or other assemblies by metabolic enzymes is more common than previously thought (5–7). The polymerization of two enzymes in de novo nucleotide biosynthesis, cytidine triphosphate synthase (CTPS) and inosine monophosphate dehydrogenase (IMPDH), has been of increasing interest, in particular. CTPS catalyzes the rate-limiting step in de novo CTP biosynthesis and polymerizes into micron-scale filaments in species of bacteria, budding yeast, fruit flies, and mammalian cells (5, 8, 9). Polymerization regulates the catalytic activity of CTPS (10–12), acetyl-CoA carboxylase (13), and glutamine synthetase (14), but its function is less clear for many enzymes, including IMPDH.
IMPDH catalyzes the rate-limiting step in de novo guanosine monophosphate (GMP) synthesis, the NAD+-dependent oxidation of IMP into xanthosine monophosphate, which is then converted into GMP by GMP synthase. In humans, two genes encode IMPDH1 and IMPDH2, which have similar catalytic activity and share 84% amino acid sequence identity (15, 16). In general, IMPDH1 is constitutively expressed at low levels in most tissues, but is high in retina, spleen, and resting peripheral blood mononuclear cells (PBMCs), while IMPDH2 is upregulated during proliferation and transformation (17–19). Like the two CTPS isoforms, both IMPDH isoforms can assemble into micron-scale filaments, also referred to as “rods and rings” structures, in mammalian cells (20–22). These filaments appear to be bundles of interacting apolar, helical polymers composed of stacked IMPDH octamers (23–25). Allosteric binding of adenine and guanine nucleotides at the regulatory Bateman domain of IMPDH can induce fluctuations between an expanded, active octamer and a collapsed, inactive octamer, both of which can be incorporated into filaments (26, 27). Previous studies demonstrated an association between deficiency in GMP synthesis and IMPDH filament formation. Early studies showed that IMPDH inhibitors, such as mycophenolic acid or ribavirin, cause rapid formation of IMPDH filaments in cultured cells (20, 22, 28). Depriving cells of essential purine precursors by limiting glutamine (29) or folate derivatives supplied by the thymidylate cycle (30) likewise cause IMPDH to polymerize. Glutamine deprivation and glutamine analogs have similar effects on the formation of CTPS filaments (31, 32). Remarkably, CTPS and IMPDH filaments can interact with each other in cells treated with 6-diazo-5-oxo-L-norleucine or 3′-deazauridine, suggesting the possibility of coordination between the two enzymes, but the implications of this observation remain unexplored (22, 33–35).
A few recent reports have provided new insights into how filament formation might regulate IMPDH activity. In the first study, 3′-deazauridine promoted IMPDH filament formation and led to an increased cellular GTP pool size, suggesting that IMPDH polymerization correlates with an increase in catalytic activity (34). Later, another study using novel IMPDH2 point mutants that block or promote polymerization concluded that polymerization itself does not affect enzyme activity, and that both active and inactive conformations of IMPDH2 can assemble into filaments (27). The most recent study demonstrated a correlation between IMPDH filament formation and rapid cell proliferation in mouse induced pluripotent stem cells (iPSCs) (36). Experiments using IMPDH2-mutant HeLa cell lines incapable of forming filaments also showed that when IMPDH levels are suppressed, formation of IMPDH filaments helps maintain normal cell proliferation, suggesting that polymerization acts to boost IMPDH activity (36). Despite these important studies, there remains a clear lack of consensus on the function of IMPDH filaments in cultured cells. Even more elusive is the role of IMPDH filaments in vivo. To date, observation of spontaneous IMPDH filament formation in vivo remains limited to mouse pancreatic β cells (34). Both ideas motivated us to search for a physiologic process in which IMPDH filaments might form.
Several years ago, our laboratory reported that IMPDH forms filaments in a high percentage of untreated, undifferentiated mouse embryonic stem cells (ESCs) cultured in rich medium (22). We hypothesized that, aside from ESCs, IMPDH filaments might assemble in other highly proliferative cell types. It is well-established that IMPDH is essential for proliferation (37) and that lymphocytes rely heavily upon de novo purine synthesis and IMPDH activity to undergo massive proliferation in response to antigenic challenge (38, 39). Recently, increasing interest has been placed on elucidating the metabolic reprogramming that occurs during T cell activation (40, 41). One essential aspect of proliferation is the upregulation of nucleotide synthesis, which is controlled by many transcription factors, namely Myc and Rb/E2F (42). Myc, which directly regulates the expression of IMPDH (43, 44), has also been identified as a master regulator of metabolic reprogramming during T cell activation (45), highlighting the importance of IMPDH in T cell metabolism. In this study, we demonstrate widespread in vivo IMPDH filament formation in splenic T and B cells, proliferating splenocytes, and thymocytes of normal, healthy mice. We then use both ex vivo primary human polyclonal T cell activation and in vivo mouse antigen-specific T cell activation experiments to show that IMPDH forms filaments during T cell activation. This is the first report of IMPDH polymerization as a novel aspect of T cell activation and the first to show extensive in vivo IMPDH filament formation in a variety of cell types. We propose that lymphocyte activation will be a useful model for further in-depth molecular studies of IMPDH filament function.
Spleens and thymuses were harvested fresh from C57BL/6J (B6) mice of various ages from 10 days to 12 months old (indicated in each experiment) or B6.Ly5a mice (described below), then fixed immediately by immersion in 4% paraformaldehyde in PBS overnight at 4°C. Tissues were then washed in PBS 3 times for 10 min each, and submerged in 70% ethanol prior to standard processing and paraffin-embedding protocols. All animal experiments were performed using protocols reviewed and approved by the University of Florida Institutional Animal Care and Use Committee.
Formalin/paraformaldehyde-fixed, paraffin-embedded (FFPE) tissue sections of 4 μm thickness were incubated in a drying oven at 58°C for 2 h, and allowed to cool for 3 min at room temperature (RT). Sections were then deparaffinized and rehydrated using sequential incubations in the following solutions: xylenes for 20 min (2 × 10 min), 100% ethanol for 10 min (2 × 5 min), 95% ethanol for 10 min (2 × 5 min), 70% ethanol for 10 min, 50% ethanol for 5 min, H2O for 5 min. Heat-induced epitope retrieval was performed at 95°C for 20 min in IHC Select Citrate Buffer pH 6.0 (21545, Millipore Sigma, Burlington, MA). Slides were allowed to cool to RT in citrate buffer for 35 min, then washed once in H2O for 5 min and twice in PBS for 5 min each. Sections were blocked with Background Sniper blocking reagent (BS966, Biocare Medical, Pacheco, CA) for 15 min at RT. After washing in PBS once for 5 min, sections were incubated with primary antibody diluted in PBS with 0.05% Tween 20 (PBS-Tween) overnight at 4°C. Slides were then washed in PBS-Tween 3 times for 5 min each, and sections were incubated with secondary antibody in PBS-Tween for 1 h at RT. After washing again in PBS-Tween, slides were mounted and counterstained with 4′,6-diamidino-2-phenylindole (DAPI).
PBMCs were isolated from fresh whole blood of healthy human donors (LifeSouth, Gainesville, FL) by density gradient centrifugation using Ficoll-Paque Plus (GE Healthcare, Marlborough, MA). Aliquots of cells were stored in liquid nitrogen until use. Cells were thawed and cultured at 37°C in a 5% CO2 incubator for 2 h in RPMI 1640 (Corning Inc., Corning, NY) supplemented with 5% heat-inactivated human AB serum (HP1022HI, Valley Biomedical, Winchester, VA), 2 mM L-glutamine (Corning), and 100 IU penicillin and 100 μg/ml streptomycin (Corning). After 2 h, cells in suspension were collected and passed through a 70 μm cell strainer (Corning). Cells were centrifuged, counted using trypan blue staining, and then seeded at a density of 1 × 10⁶ cells/ml in a 24-well plate in RPMI 1640 supplemented with 2 or 16 mM L-glutamine. PBMCs were left untreated or treated with 5 μg/ml PHA or ConA, or with 75 μl Human T-Activator CD3/CD28 Dynabeads per 1 ml medium. Cells were then incubated at 37°C in 5% CO2 for 72 h. After 72 h, cells were collected and centrifuged in a Shandon Cytospin 2 Centrifuge onto glass slides coated with poly-L-lysine (Sigma-Aldrich, St. Louis, MO). For cells treated with Dynabeads, beads were removed using a magnet prior to centrifugation. In certain experiments, fresh medium was also added 1 h prior to collecting cells for centrifugation. After centrifugation, cells were fixed using 4% paraformaldehyde in PBS for 15 min at RT and permeabilized with 0.1% Triton X-100 in PBS for 4 min. Cells were then incubated with primary antibody for 1 h at RT and secondary antibody for 45 min at RT, prior to mounting and counterstaining with DAPI. PHA (00-4977-03), ConA (00-4978-03), and Dynabeads (11131D) were purchased from Thermo Fisher (Waltham, MA).
CD4+ T cells specific to ovalbumin (OVA) were purified from the spleens of B6.Cg-Tg(TcraTcrb)425Cbn/J (B6.OT-II.CD90.1) mice (graciously provided by Dr. Stephen Schoenberger, La Jolla Institute for Allergy and Immunology, La Jolla, CA). 2 × 10⁵ CD4+ T cells were then adoptively transferred to B6.SJL-PtprcaPep3b/BoyJ (B6.Ly5a) recipients that were intraperitoneally immunized 24 h later with 50 ug of NP16-OVA in alum. Spleens were collected 6 days post-immunization. Half of each spleen was used for flow cytometry, while the other half was fixed, paraffin-embedded, and analyzed by immunofluorescence.
For flow cytometry, single cell suspensions from individual spleens were stained in 40 μl volume of PBS with 2% fetal bovine serum, using the following monoclonal antibodies purchased from BioLegend (San Diego, CA), BD Biosciences (San Jose, CA), or Thermo Fisher: anti-CD4 (1 μg/ml, BV711 conjugate, clone GK1.5), anti-CD44 (1.3 μg/ml, V500 conjugate, clone IM7), anti-CD90.1 (0.2 μg/ml, PE/Dazzle 594 conjugate, clone OX-7), anti-TCR Vβ 5.1, 5.2 (10 μg/ml, FITC conjugate, clone MR9-4), and anti-TCR Vα2 (1 μg/ml, PerCP/Cy5.5 conjugate, clone B20.1). Antigen-specific OT-II cells were gated as CD4+ TCR Vβ 5.1, 5.2+ TCR Vα2+ CD90.1+.
Primary antibodies used for immunofluorescence in this study include: rabbit polyclonal anti-IMPDH2 (primary cells: 1:500 dilution, FFPE tissues: 1:200 dilution, 12948-1-AP, Proteintech, Chicago, IL), rat monoclonal anti-CD3 (primary cells and FFPE tissues: 1:100 dilution, clone CD3-12, Bio-Rad, Hercules, CA), rat monoclonal anti-CD19 (FFPE tissues: 1:50 dilution, clone 6OMP31, Thermo Fisher), mouse monoclonal anti-Ki-67 (primary cells: 1:400 dilution, clone B56, BD Biosciences), rat monoclonal anti-Ki-67 (FFPE tissues: 1:200 dilution, clone SolA15, Thermo Fisher), rat monoclonal anti-GL7 (FFPE tissues: 1:50 dilution, clone GL7, BioLegend), PE/Dazzle 594-conjugated mouse monoclonal anti-CD90.1 (1:20 dilution, clone OX-7, BioLegend), and PE/Dazzle 594-conjugated mouse IgG1 κ isotype control (1:20 dilution, clone MOPC-21, BioLegend). All secondary antibodies were purchased from Thermo Fisher and used at 1:400 dilution: Alexa Fluor 488-conjugated goat anti-rabbit IgG (A11034), Alexa Fluor 568-conjugated goat anti-rat IgG (A11077), and Alexa Fluor 568-conjugated goat anti-mouse IgG (A11004). All tissue staining was performed in parallel with staining of control sections with secondary antibody only (see examples in Supplementary Figure 1). All slides were mounted and counterstained with DAPI simultaneously using Vectashield HardSet Antifade Mounting Medium (H-1500, Vector Laboratories, Burlingame, CA). Images were captured with a Zeiss Axiovert 200M microscope equipped with a Zeiss AxioCam MRm camera using 10 × (0.50 NA), 20 × (0.75 NA), or 40 × (0.75 NA) objectives (Carl Zeiss Microscopy, Jena, Germany).
Cell counting, quantification of cells with IMPDH filaments, and quantification of Ki-67-positive cells were performed manually (by S.J.C.) using the Cell Counter plugin included in the Fiji distribution of ImageJ (46). Data are presented as mean values plus or minus the standard error of the mean (S.E.M.). Results from independent groups were compared using two-way analysis of variance (ANOVA) or two-tailed Student's t-test where appropriate. Figures 4E,F show proportions of cells within a treated group and do not represent data from independent groups. Common statistical tests used to compare independent groups are not appropriate to analyze the outcome of these experiments. Further information on statistical tests used is included within figure legends where appropriate. P-values < 0.05 were considered significant. All statistical analyses were performed using GraphPad Prism version 7.03 for Windows (GraphPad Software, La Jolla, CA).
To investigate the in vivo assembly of IMPDH filaments in highly proliferative cells, we first examined the spleens of normal, untreated mice for lymphocytes. We performed immunofluorescence on FFPE spleen sections from six adult B6 mice (three male, three female) of various ages, ranging from ~5 to 12 months old. Initially, we stained these spleens for IMPDH and T cell marker CD3. Remarkably, we consistently detected widespread IMPDH filament formation in many cells throughout the spleen, including CD3+ and CD3− cells in both the white pulp and red pulp. However, due to high autofluorescence in the red pulp, we largely focused on lymphoid follicles (Figure 1A, representative image, red pulp marked “R”). We detected an abundance of IMPDH filaments throughout the T cell zone (“T” in Figure 1A) and germinal centers (GCs, determined by morphology and marked “GC” in Figure 1A). The T cell zone consists largely of T cells, a majority of which showed IMPDH filament formation (Figure 1B). GCs contain some follicular helper T cells (CD3+) but predominantly consist of activated and rapidly dividing B cells called centroblasts (CD3−). These cells give rise to centrocytes, which divide slowly and make up a small subset of germinal center cells. We were able to clearly detect IMPDH filaments in CD3− cells (Figure 1C, yellow circles) next to CD3+ cells. As one may ascertain from images in Figures 1B,C, filaments within GCs consistently stained brighter and were more obvious, although not necessarily more numerous, than filaments in other areas of the tissue. However, the significance of this observation remains unclear and we were not able to quantify any difference in brightness or frequency of filaments between particular parts of the sections. Magnified images show that these filaments are relatively similar in size to many previous reports of IMPDH filaments (Figure 1D). We were also able to detect ring structures in vivo, which are a hallmark of IMPDH filaments (“rods and rings” structures) (Figure 1D, white arrow). Although it is unknown if there are any functional differences between rods and rings, the presence of rings indicated we were observing bona fide IMPDH filaments. Note that while we refer to these structures as IMPDH “filaments” in this study, we did not perform any high-resolution imaging capable of resolving individual filaments. Though they are likely the same, future experiments are required to confirm that IMPDH filaments reported in T cells are the same as filaments reported in other cell types (21, 23).
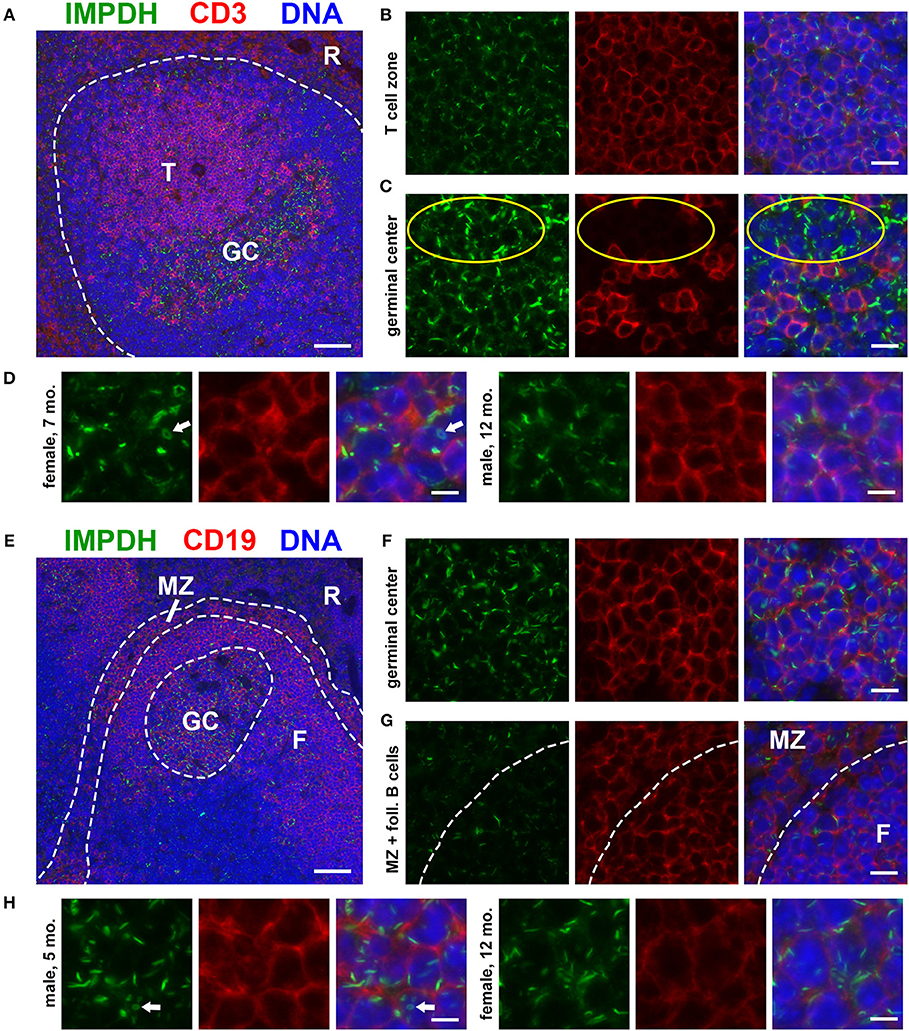
Figure 1. Splenic T and B cells form IMPDH filaments in vivo. (A) Representative image of a lymphoid follicle in an FFPE spleen section from an adult healthy B6 mouse stained for IMPDH (green) and T cell marker CD3 (red). Widespread IMPDH filament formation was detected throughout the spleen, including within the T cell zone (“T”), germinal centers (“GC”), other cells within the follicle, and even in the red pulp (“R”). (B) Representative image of the T cell zone showing many IMPDH filaments within T cells. (C) Representative image of a germinal center showing prominent IMPDH filaments in both CD3+ and CD3− cells (highlighted by yellow circles). (D) Representative images of two different mice, a 7-months-old female and a 12-months-old male. Images were captured using the same objective as (B,C) but were enlarged 2× to more clearly show IMPDH filaments within T cells. White arrows: ring structure. (E) Lymphoid follicle from an adult healthy B6 mouse spleen stained for IMPDH (green) and B cell marker CD19 (red). IMPDH filaments were detected in GC B cells, follicular (“F”) B cells, and marginal zone (“MZ”) B cells. (F) Representative image of a germinal center depicting numerous IMPDH filaments within B cells. (G) Representative image illustrating IMPDH filament formation in follicular (“F”) and marginal zone (“MZ”) B cells. (H) Representative images of two different mice, a 5-months-old male and a 12-months-old female. Images were captured using the same objective as (F,G) but were enlarged 2× to more clearly show IMPDH filaments within B cells. White arrows: ring structure. Counterstain for all panels: DAPI (blue). Scale bars: 50 μm (A,E), 10 μm (B,C,F,G), 5 μm (D,H).
Having detected IMPDH filaments in CD3− cells, we then stained these spleens for IMPDH and B cell marker CD19. Again, we identified abundant IMPDH filaments in B cells throughout the follicle (Figure 1E, representative image), including GC B cells (Figure 1F), follicular B cells (marked “F” in Figures 1E,G), and marginal zone B cells (“MZ” in Figures 1E,G). Magnified images clearly show rod- and ring-shaped structures in B cells (Figure 1H).
As our original hypothesis was that IMPDH filaments form in highly proliferative cells, we then stained the same spleen tissues for proliferation marker Ki-67, which is expressed in active stages of the cell cycle but not in resting cells (47). While sporadic Ki-67-positive cells with IMPDH filaments could be found throughout the spleen, the most obvious areas of Ki-67 expression were in GCs (Figure 2A). We detected IMPDH filaments in both Ki-67-positive (Figure 2B, magnified in Figure 2D) and Ki-67-negative cells (Figure 2C, yellow circles) within or near GCs. Finally, to confirm our morphological assessment of GCs, we stained more spleen sections for GL7, a commonly used marker for mouse GCs expressed on both B and T cells. Staining of serial sections demonstrated that Ki-67 staining matched up with GL7 staining (Figure 2E, same GC as shown in Figure 2A). Similar to previous experiments, we detected IMPDH filaments in both GL7+ cells (Figure 2F, magnified in Figure 2H) and GL7− cells nearby (Figure 2G). Together, these data suggest that IMPDH filaments form in both T cells and B cells, especially proliferating GC cells likely to be centroblasts.
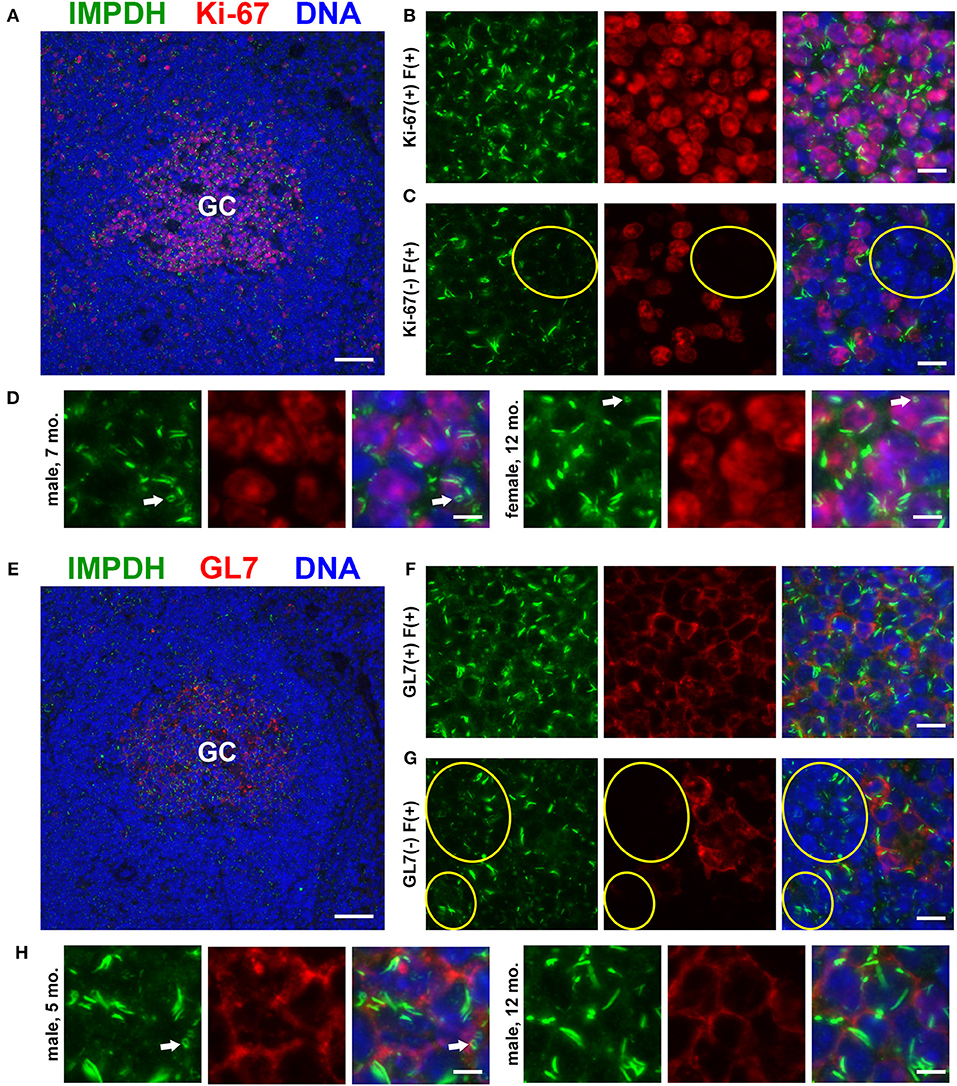
Figure 2. Proliferating cells in germinal centers form IMPDH filaments in vivo. (A) Representative image of a germinal center in an FFPE spleen section from an adult healthy B6 mouse stained for IMPDH (green) and proliferation marker Ki-67 (red). (B) Representative image of Ki-67-positive cells in GCs forming abundant IMPDH filaments. (C) Representative image showing that IMPDH filament formation was also commonly observed in Ki-67-negative cells (highlighted by yellow circles). (D) Representative images of two different mice, a 7-months-old male and a 12-months-old female. Images were captured using the same objective as (B,C) but were enlarged 2× to more clearly show IMPDH filaments within proliferating cells. White arrows: ring structures. (E) Serial section depicting the same GC as in (A), but stained instead for IMPDH (green) and GC marker GL7 (red). (F) Representative image of extensive IMPDH filament formation by GL7+ cells. (G) Representative image showing that IMPDH filaments also form in GL7− cells (marked by yellow circles). (H) Representative images of two different mice, a 5-months-old male and a 12-months-old male. Images were captured using the same objective as (F,G) but were enlarged 2× to more clearly show IMPDH filaments within GC cells. White arrows: ring structure. Counterstain for all panels: DAPI (blue). Scale bars: 50 μm (A,E), 10 μm (B,C,F,G), 5 μm (D,H).
After discovering the ability of mature T cells in the spleen to form IMPDH filaments, we turned to the thymus, the site of T cell maturation and large-scale proliferation of thymocytes (T cell precursors). Mechanisms controlling thymus development are generally conserved between humans and mice (48). Thymus volume increases relative to body size throughout the neonatal period, plateauing in post-natal life around 1 year in humans and within the first few weeks in mice (49). Thymus volume also directly correlates with the proliferation of thymocytes to produce a steady supply of naïve T cells (50). Accordingly, we started by examining 10-days-old (n = 2) and 4-weeks-old (n = 6) normal, untreated B6 mice in attempt to capture IMPDH filament formation during periods of the highest predicted thymocyte proliferation. We also examined the thymuses of the 6 mice in which we examined the spleen (Figures 1, 2), ranging from 5 to 12 months old. To our surprise, we consistently found an abundance of IMPDH filaments throughout the thymuses of mice from all age groups (Figure 3A, representative images). Although the bulk of thymocyte proliferation occurs in the thymic cortex, we were able to visualize large-scale filament formation in both the cortex and medulla. We turned again to Ki-67 staining to visualize proliferation and filament formation simultaneously. Surprisingly, a majority of cells within the thymus were positive for IMPDH filaments. However, there were clearly areas of tissue with differential filament formation. Figure 3B shows one such example, where neighboring areas of cortex and medulla both exhibited filament formation in >90% of cells. This dropped to < 20% in other areas of the medulla and even approached 0% in some areas of the cortex, despite widespread Ki-67 expression indicating that these cortical thymocytes were proliferating. Overall, we clearly detected 4 different cell populations in the thymus: (1) Ki-67-positive, filament-positive, (2) Ki-67-positive, filament-negative, (3) Ki-67-negative, filament-positive, and (4) Ki-67-negative, filament-negative (Figures 3C–F, representative images that correspond to dotted squares in panel B). As expected, the thymic cortex was overwhelmingly positive for Ki-67 expression and it was easy to find proliferating cortical thymocytes with IMPDH filaments (Figure 3C). Also as expected, far fewer proliferating cells were observed in the thymic medulla. However, across all age groups, we consistently detected areas of the medulla with an abundance of IMPDH filaments (Figures 3B,E). These data provide additional evidence that IMPDH filaments function in a variety of physiological processes involving rapidly proliferating cell types. That widespread IMPDH filament formation can be detected in non-proliferating cells also hints that the polymerization of IMPDH might be playing other important roles yet to be determined.
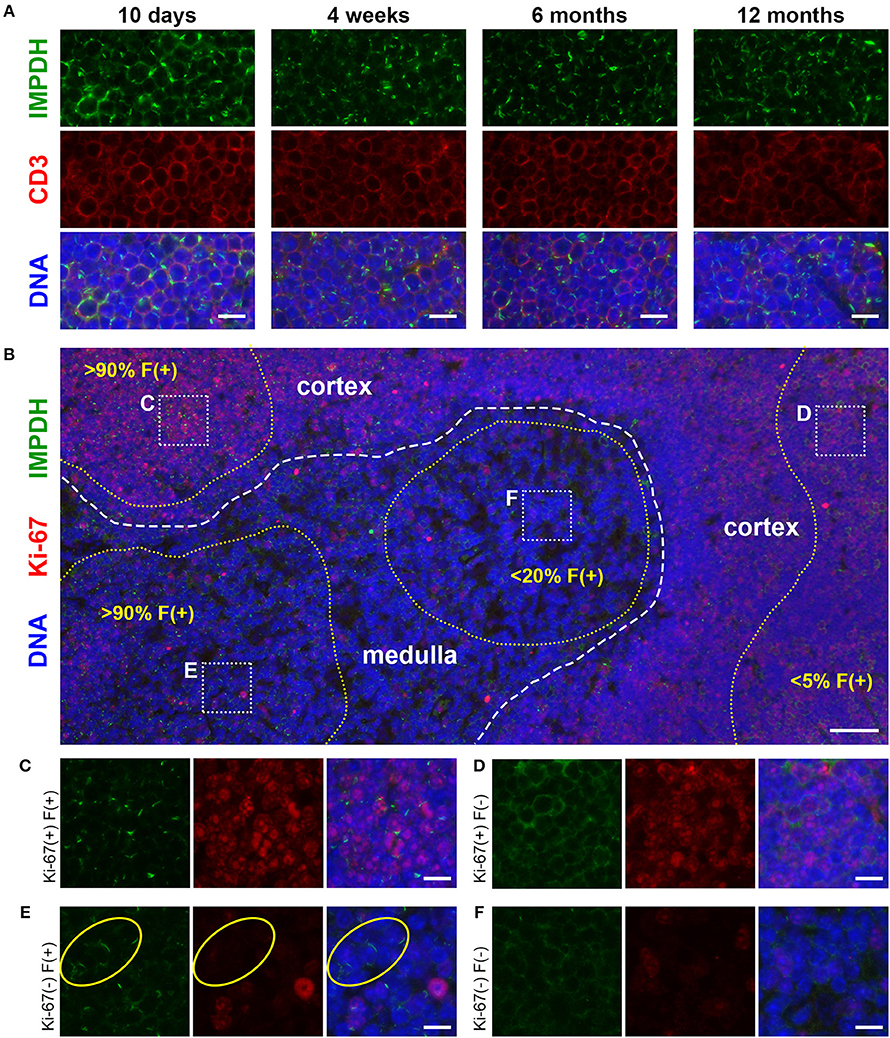
Figure 3. Cortical and medullary thymocytes of young and old mice form IMPDH filaments in vivo. (A) Representative images of FFPE thymuses from 10-days-old, 4-weeks-old, 6-months-old, and 12-months-old healthy B6 mice stained for IMPDH (green) and T cell marker CD3 (red). Widespread consistent IMPDH filament formation was observed in a majority of cells throughout the thymuses of mice at all ages. (B) Representative image demonstrating areas of the thymus with varying levels of IMPDH (green) filament formation and Ki-67 (red) expression. The dashed white line approximates the boundary between the cortex and medulla. As examples, percentage of cells with IMPDH filaments is written within areas outlined by yellow dotted lines. Ki-67 expression is clearly more prevalent in the cortex compared to medulla, as expected. Dotted white boxes labeled (C–F) correspond to C-F below. (C–F) Higher magnification images taken of the areas outlined in (B). These representative images demonstrate four different cell populations in the thymus: (C) Ki-67-positive, filament-positive, (D) Ki-67-positive, filament-negative, (E) Ki-67-negative, filament-positive, and (F) Ki-67-negative, filament-negative. Yellow circles in (E) highlight the filament formation in Ki-67-negative cells. Counterstain for all panels: DAPI (blue). Scale bars: 10 μm (A,C–F), 50 μm (B).
To further probe and better quantify the IMPDH filament formation we observed in lymphocytes and thymocytes in vivo, we then examined ex vivo mitogenic stimulation of primary human T cells. We treated human PBMCs with the well-known mitogens PHA or ConA, or with monoclonal antibodies against CD3 and CD28 (anti-CD3/CD28) immobilized on the surface of microbeads. These microbeads mimic the interaction of an antigen-presenting cell with the T cell receptor-CD3 complex and co-stimulatory receptor CD28. In a preliminary experiment, PBMCs were cultured in RPMI 1640 medium with 2 mM glutamine and left untreated or incubated with PHA, ConA, or anti-CD3/CD28 for 72 h. Cells were then centrifuged onto glass slides, fixed, and stained with anti-IMPDH and anti-CD3 antibody to detect IMPDH filament formation in T cells. Our initial observation was that mitogen-stimulated T cells had a clear increase in IMPDH filament formation compared to untreated cells, which had almost no detectable filaments (Figure 4A). IMPDH signal was visibly lower in untreated compared to treated T cells, correlating with the significant increase in IMPDH expression post-stimulation reported in previous studies (39, 51, 52). However, we knew from previous studies that glutamine or serine deprivation can drive the formation of IMPDH filaments, which readily disassemble (in < 15 min) upon replenishment of glutamine or serine (29, 30). We also considered the substantial increase in glutamine uptake known to occur during T cell activation (45, 53, 54). Thus, our initial explanation was that these T cells might have formed IMPDH filaments because they depleted the culture medium of glutamine, serine, or another possibly unrelated metabolite over 3 days of stimulation. We then repeated our first experiment, except this time we also tested whether excess glutamine or adding fresh medium to the culture 1 h prior to harvesting the cells could disassemble the filaments. PBMCs were stimulated with PHA, ConA, or anti-CD3/CD28 and harvested after culture in RPMI 1640 for 72 h under 4 different conditions: (1) 2 mM glutamine, (2) 2 mM glutamine + 1 h fresh medium, (3) 16 mM glutamine, and (4) 16 mM glutamine + 1 h fresh medium. We observed a significant increase in the percentage of cells forming filaments in mitogen-stimulated compared to untreated T cells (Figure 4A, representative images; Figure 4B, quantification). Surprisingly, there were no significant differences among the four different culture conditions. Neither the addition of fresh medium nor the supply of excess glutamine had any impact on IMPDH filament formation. These data suggested to us that IMPDH filament formation is a genuine aspect of T cell activation that is not due to a nutrient deficiency in the culture medium.
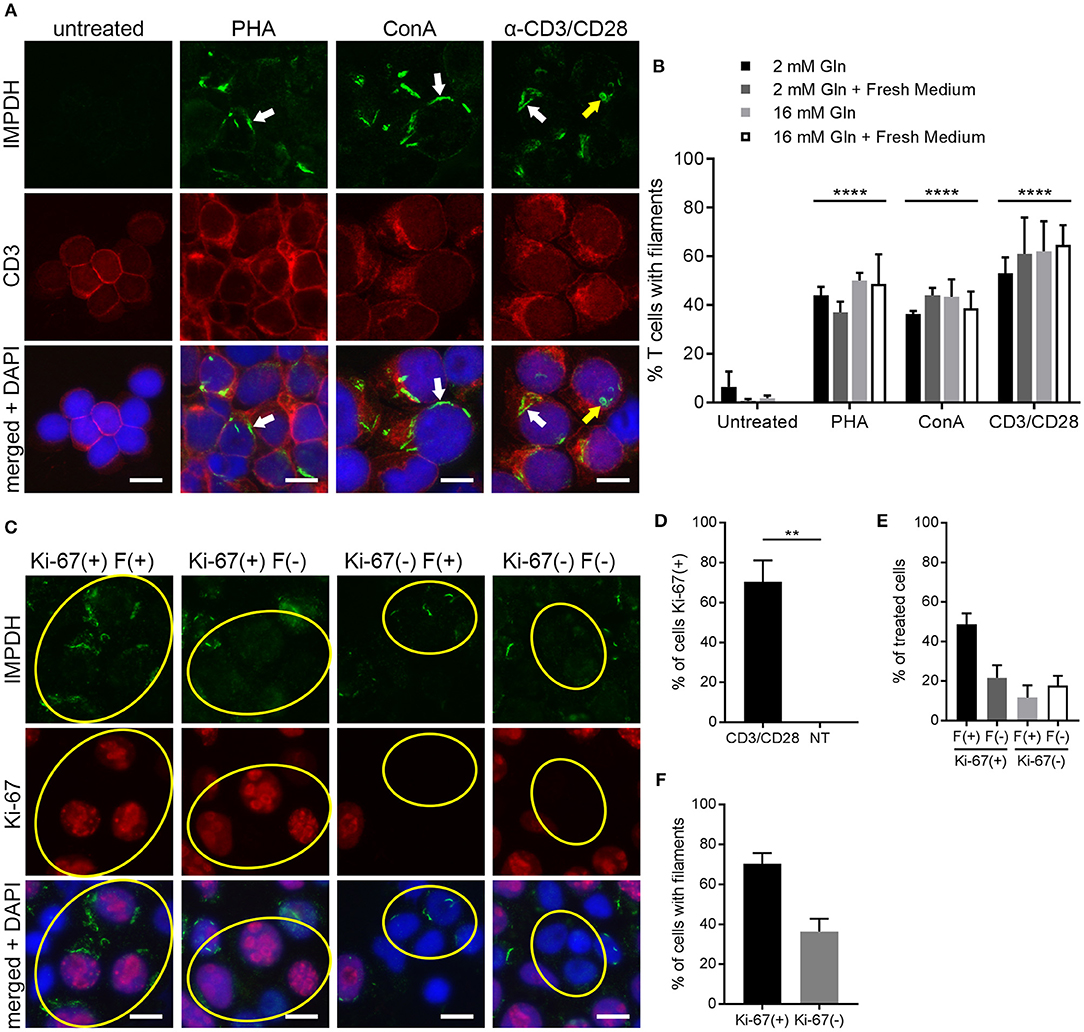
Figure 4. IMPDH forms filaments during ex vivo primary human T cell activation. (A) Representative images of T cells left untreated or stimulated by mitogens PHA, ConA, or anti-CD3/CD28 for 72 h, then fixed and stained for IMPDH (green) and T cell marker CD3 (red). White arrows: examples of IMPDH filaments. Yellow arrows: example of a ring-shaped filament. Images were captured using identical microscope settings for all treatment groups. (B) Quantification of the percentage of T cells that form filaments when untreated or treated with mitogens PHA, ConA, or anti-CD3/CD28. Cells were cultured in RPMI 1640 under four different conditions: 2 mM glutamine (Gln), 2 mM Gln + 1 h fresh medium, 16 mM Gln, or 16 mM Gln + 1 h fresh medium (represented by differently shaded bars). Different culture conditions were grouped together according to mitogenic treatment and compared to untreated cells (e.g., all PHA-treated conditions grouped vs. all untreated conditions grouped) and statistical significance displayed above each group. No significant differences were observed within these treatment groups due to culture conditions (e.g., PHA 2 mM Gln vs. PHA 16 mM Gln, no difference). Statistical test used: two-way ANOVA followed by Tukey's multiple comparisons test; ****p < 0.0001. Data are shown as mean ± S.E.M. and represent three independent experiments using 3 different human donors. (C) Representative images of PBMCs stimulated by anti-CD3/CD28 and stained for IMPDH (green) and proliferation marker Ki-67 (red). Yellow circles show examples of 4 different cell populations quantified in subsequent panels: Ki-67(+) filament(+), Ki-67(+) filament(–), Ki-67(–) filament(+), Ki-67(–) filament(–). (D) Quantification of the percentage of Ki-67-positive cells in anti-CD3/CD28-treated cells compared to untreated (NT) cells. Statistical test used: two-tailed Student's t-test; **p < 0.01. (E) Graph showing the proportion of anti-CD3/CD28-treated cells made up by the four different cell populations shown in (C) (all four groups add up to 100%). (F) Comparison of the percentage of treated cells with filaments between Ki-67-positive and Ki-67-negative cell populations from the experiment in (C). (E,F) show proportions calculated from within the treated group only (anti-CD3/CD28-treated) and do not represent data from independent groups. Common statistical tests used to compare independent groups are not appropriate to analyze the outcome of these experiments, so no statistical significance is indicated. Data from (D–F) are shown as mean ± S.E.M. and represent 3 independent experiments. Counterstain for all panels: DAPI (blue). Scale bars: 10 μm.
The data from the previous experiments indicated that after 72 h of stimulation, only roughly 40–60% of T cells were forming filaments. We also noted that IMPDH filaments formed in a very low percentage of untreated T cells. Clearly, there was not an absolute correlation between cell activation and filament formation. We then stimulated PBMCs again with anti-CD3/CD28 and stained them for the proliferation marker Ki-67. Within this population of stimulated cells, we observed 4 different subgroups: (1) Ki-67-positive cells with and (2) without filaments, and (3) Ki-67-negative cells with and (4) without filaments (Figure 4C, representative images, yellow circles highlight cells of each subgroup). Approximately 70% of anti-CD3/CD28-treated cells were Ki-67-positive compared to 0% of untreated cells (Figure 4D). We then quantitated what proportion of these treated cells belonged to each of the 4 different subgroups. On average, 49% were Ki-67-positive, filament-positive, 22% were Ki-67-positive, filament-negative, 12% were Ki-67-negative, filament-positive, and 18% were Ki-67-negative, filament-negative (Figure 4E). From these data, we also calculated that a higher percentage of proliferating cells formed filaments than non-proliferating cells. An average of 70% of Ki-67-positive cells contained filaments compared to just 36% of Ki-67-negative cells (Figure 4F). Overall, the data show a trend suggesting an association between IMPDH filament formation and cell proliferation.
After demonstrating IMPDH filament formation in ex vivo polyclonal T cell activation, we wondered if the same process also occurs during antigen-specific T cell activation in vivo. To do this, we employed a well-established experimental model of antigen-specific T cell activation using B6.OT-II.CD90.1 mice, which carry CD4+ T cells with an MHC class II-restricted T cell receptor specific for ovalbumin (OVA) (55, 56). OVA-specific CD4+ T cells that express the CD90.1 allele were purified from the spleens of B6.OT-II.CD90.1 mice and adoptively transferred into B6.Ly5a recipient mice (expressing the CD90.2 allele), which were then immunized 24 h later with NP16-OVA in alum (n = 3). These adoptively transferred T cells can be identified by their cell surface expression of CD90.1, which is not expressed in the recipient mice. Spleens were collected 6 days post-immunization, then cut in half. One half was fixed in 4% paraformaldehyde prior to processing and embedding, while the other half was used for flow cytometry.
By immunofluorescence, we were able to detect IMPDH filament formation in the transferred OVA-specific (CD90.1+) cells in spleens from all 3 mice (Figure 5A, representative images). In parallel, we used flow cytometry to confirm that these transferred T cells were properly activated upon OVA challenge. In all cases, a clear majority of OVA-specific T cells were positive for CD44, a marker for T cell activation (Figure 5B, representative plot). In addition, the weak staining of the CD90.1 antibody in immunofluorescence prompted us to use serial sections to compare CD90.1 staining to that of no antibody (Supplementary Figure 2A). We also compared CD90.1 staining to that of an isotype control antibody (Supplementary Figure 2B), concluding that we were observing a true positive signal for CD90.1. Importantly, this experiment demonstrates that, in addition to ex vivo human T cell activation, IMPDH filaments form during in vivo antigen-specific T cell activation.
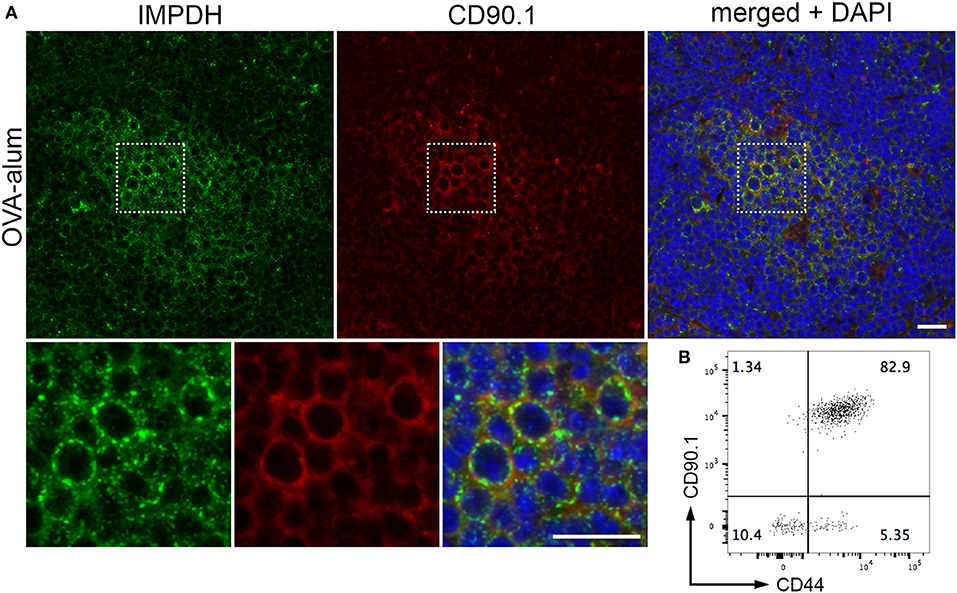
Figure 5. IMPDH forms filaments during in vivo antigen-specific T cell activation. (A) Representative images of OVA-specific adoptively transferred CD90.1+ (red) T cells with IMPDH (green) filaments in the spleen from a mouse immunized with OVA-alum. Areas marked by dotted squares are enlarged 3× and shown below to more clearly demonstrate IMPDH filaments in antigen-specific T cells. Counterstain: DAPI (blue). Scale bars: 20 μm. (B) Representative flow cytometry plot showing that a majority of adoptively transferred OVA-specific T cells (CD90.1+) are activated (CD44+) after immunization with OVA. Numbers indicate percentage of cells belonging to each quadrant.
Since the discovery that IMPDH is amplified in tumors and rapidly proliferating tissues (37), IMPDH has been an important target for the development of anticancer, antiviral, antibacterial, and immunosuppressive therapies (17, 57). IMPDH inhibitors have been used in clinics around the world for many years now, including azathioprine, mycophenolic acid, and mizoribine for immunosuppression and autoimmune diseases, and ribavirin for viral infections. Despite the long-term and widespread use of these drugs, it was not reported until around 10 years ago that treatment with IMPDH inhibitors causes a striking rearrangement of IMPDH protein into micron-scale filaments within cultured cells (20, 28). A few years later, our laboratory and others determined that a subset of hepatitis C patients, once exposed to ribavirin and interferon-α therapy, produce autoantibodies recognizing these IMPDH filaments, also referred to as “rods and rings” structures (22, 58, 59). These anti-rods/rings autoantibodies were not detected in the same patients prior to therapy, suggesting the possibility that ribavirin exposure alters the immunogenicity of IMPDH and leads to drug-induced autoantibody generation (60, 61). Pharmacological doses of several other widely-used drugs that do not directly target IMPDH have been shown to cause IMPDH filament formation in cultured cells, including pemetrexed (non-small cell lung cancer, mesothelioma), methotrexate (various cancers, autoimmune diseases), and acyclovir (herpes, shingles) (30, 62, 63). These data suggest the likelihood of widespread IMPDH filament assembly in the tissues of patients taking these drugs. Indeed, IMPDH filaments have been observed in the PBMCs of patients treated with mycophenolic acid, ribavirin, azathioprine, and methotrexate (62). The clinical implications of both IMPDH filament formation and the autoantibody response to these structures remain largely unexplained, highlighting the need to better understand all aspects of IMPDH regulation.
Until recently, much of the work on IMPDH filaments focused on elucidating the subcellular conditions that drive polymerization of IMPDH. Aside from IMPDH inhibitors, it was shown early on that the GMP synthase inhibitor decoyinine (20) and glutamine analogs 6-diazo-5-oxo-L-norleucine and acivicin also lead to IMPDH filament formation (22). We then showed that cells cultured in glutamine-deficient medium gradually form IMPDH filaments over a few days, an effect that is exacerbated by addition of methionine sulfoximine, a glutamine synthetase inhibitor (29). Later, we also found that serine deprivation leads to IMPDH filament assembly with similar kinetics (30). In that same study, we demonstrated that inhibition or transient knockdown of serine hydroxymethyltransferase or dihydrofolate reductase, key enzymes in the thymidylate cycle of one-carbon metabolism, also promote IMPDH polymerization. In most of these subcellular conditions, IMPDH filaments readily disassemble upon addition of guanosine, implying a correlation between filament formation and deficiency in GMP synthesis. However, IMPDH filaments are not always clearly associated with inhibition of GMP synthesis. Our laboratory also discovered IMPDH filament formation in a high percentage of untreated, undifferentiated mouse ESCs cultured in rich medium (22). We later discovered IMPDH filaments also form in a low percentage of Ptk2, NIH/3T3, NRK, and RAW264.7 cells in rich media with no obvious manipulation (63). Similar observations have been made in CHO cells (64). Overall, these data comprise much of what was known about IMPDH filaments until just a couple years ago.
A few more recent studies from other laboratories have explored the effects of polymerization on the activity of IMPDH, using experimental models where IMPDH filaments form in the absence of any inhibitors that might alter IMPDH activity. In 2015, the Liu and Sung laboratories showed that the CTPS inhibitor 3′-deazauridine promotes IMPDH filament formation and leads to an increased cellular GTP pool size, suggesting that IMPDH polymerization correlates with an increase in catalytic activity (34). In the same study, IMPDH filaments formed in vivo in untreated mouse pancreatic β cells and polymerization decreased in mice fasted overnight, possibly correlating with nutrient uptake. In 2017, the Peterson and Kollman laboratories generated IMPDH2 point mutants that block or promote polymerization without affecting enzyme activity (27). They also demonstrated that both active and inactive conformations of IMPDH2 can be incorporated into filaments, concluding that polymerization itself does not affect IMPDH activity. Most recently, the Liu and Sung laboratories explored the function of IMPDH filaments in mouse iPSCs and CRISPR/Cas9-edited IMPDH2-mutant HeLa cell lines with no filament-forming capability (36). Their data suggest that the polymerization of IMPDH is modulated by the ratio of its substrate IMP to guanine nucleotides, and that filament formation acts to increase IMPDH activity during periods of high demand for guanine nucleotides. These studies demonstrate that although significant progress has been made, there is still no consensus on the function of IMPDH filaments. These recent data also call to mind other reports that enzymes in de novo purine synthesis can assemble into a dynamic metabolic complex termed the purinosome (65). Purine depletion drives purinosome assembly, which acts to increase de novo synthesis rates of IMP, GMP, and AMP (66). Remarkably, GFP-tagged adenylosuccinate synthase and IMPDH co-localized with OFP-tagged formylglycinamidine ribonucleotide synthase (purinosome marker) in purine-depleted media, suggesting that IMPDH is also incorporated into purinosomes (66). Although they appear to be distinct structures, the relationship between purinosomes and IMPDH filaments and their potentially synergistic functions in proliferation warrant further investigation.
In the present study, we were motivated by the different (yet not necessarily conflicting) data regarding the function of IMPDH filaments, as well as the lack of in vivo data on IMPDH filament formation. We thought it prudent to seek a physiological process in which IMPDH filaments might play a role. Considering our previous data showing extensive IMPDH polymerization in stem cells (22), we wondered if other highly proliferative cell types might form filaments “naturally” (i.e., without inhibitors or nutrient deprivation). Since de novo purine synthesis and IMPDH activity are critical for the rapid proliferation of T cells in the immune response (18, 38, 39), we thought this cell type an obvious choice for further investigation. As the data show, IMPDH filament formation correlates with the proliferation of T cells stimulated by classic mitogens, PHA and ConA, as well as anti-CD3 and anti-CD28 antibodies that mimic physiological antigen presentation by antigen-presenting cells. These observations also extend beyond ex vivo mitogenic stimulation to in vivo antigen-specific T cell activation. These data agree with previous data from our laboratory that show undifferentiated mouse ESCs form abundant IMPDH filaments, which disassemble once cells are differentiated and stop proliferating (22). Our present data also agree with recently published data showing that spontaneous (natural) formation of IMPDH filaments in iPSCs correlates with rapid cell proliferation (36). In recent years, there has been increasing interest in understanding the dramatic shifts in cellular metabolism between resting cells and proliferating cells, referred to as metabolic reprogramming. It has been known for some time that tumor cells carry out glycolysis despite the presence of oxygen, also known as the Warburg effect (67). The same metabolic phenotype has been observed in lymphocytes (68–71) and stem cells (72, 73), suggesting that these changes might represent a general metabolic program of proliferating cells. A very recent study also demonstrated that distinct metabolic signatures can be detected in different subsets of developing thymocytes (74). Although our data are limited in that we do not know if IMPDH filament formation differs between thymocyte subsets, it may explain why we observed varying levels of IMPDH filaments throughout the thymus. The significant increase in biomass accumulation and cell division rate during lymphocyte proliferation relies heavily on de novo synthesis to generate sufficient nucleotide levels (45, 75). IMPDH filament formation might represent a novel aspect of lymphocyte activation that helps meet the heightened demand for guanine nucleotides. Further experiments will elucidate where IMPDH filament formation fits into the chronology of metabolic reprogramming that occurs during T cell activation and stem cell proliferation.
What was perhaps even more striking to us than discovering IMPDH filaments in T cell activation was the widespread IMPDH filament formation in different cell types of healthy mouse spleen and thymus. Because a previous study demonstrated IMPDH filament formation specifically in mouse pancreatic β cells, and no other cell types (34), we speculated that spontaneous in vivo IMPDH filament formation might be restricted to specific cell types or tissues and could be hard to detect. While our data generally support the notion of a correlation between IMPDH polymerization and cell proliferation, this might not tell the whole story. Both ex vivo human and in vivo mouse data indicate that, in general, expression of the proliferation marker Ki-67 correlates with IMPDH filament formation. The expression of Ki-67 protein is strictly associated with active phases of the cell cycle (G1, S, G2, mitosis) and is absent in resting cells (G0) (47). However, in both human primary cells and mouse tissues, we clearly observed Ki-67-positive cells both with or without IMPDH filaments, as well as Ki-67-negative cells both with or without IMPDH filaments. One possible explanation for Ki-67-negative, filament-positive cells could be the stability of IMPDH filaments. Perhaps IMPDH that polymerizes during an active proliferation cycle might remain polymerized when a cell exits the cell cycle into a resting state. For Ki-67-positive, filament-negative cells, it is possible that IMPDH filaments are not formed as early as Ki-67 expression begins. For example, if a cell exits G0 and enters G1, Ki-67 expression might begin earlier in G1 prior to a high demand for guanine nucleotides (when IMPDH filaments would form) that occurs in late G1 (42). Both explanations are supported by recently published data from a thymidine block experiment where mouse iPSCs were analyzed for EdU incorporation and IMPDH filament formation at different time-points post-block (36). At 4 h post-thymidine, 0% of cells were EdU-positive, yet IMPDH filaments were still present in ~35% of cells. At 12 h, once 0% of cells were EdU-positive or filament-positive, thymidine was removed and dCTP added to restore proliferation. After 3 h, ~64% of cells were EdU-positive, yet only ~21% of cells contained filaments. IMPDH filament formation did not recover to normal levels (~82% of cells) until 15 h after dCTP addition. These data support the hypothesis that IMPDH filaments might remain stable in cells no longer proliferating, and that their formation might lag behind other markers once proliferation is restored.
It is counterintuitive that IMPDH filaments naturally form in highly proliferative cells, yet IMPDH inhibitors that arrest proliferation cause similar filament formation. Many IMPDH inhibitors, like azathioprine, mycophenolic acid, and mizoribine, are used clinically as immunosuppressants, limiting lymphocyte proliferation. This complicates the observation that IMPDH filaments are found in rapidly proliferating cells, like lymphocytes. An alternative hypothesis is that IMPDH filaments are not exclusively linked to proliferation and that other factors contribute to their assembly and disassembly. For years, we considered that since IMPDH filament formation is associated with deficiency in GMP synthesis, perhaps the filaments are composed of largely inactive enzyme. Several studies have revealed that inhibiting essentially any enzyme upstream or downstream of IMPDH in de novo purine/GMP synthesis or the thymidylate cycle of one-carbon metabolism leads to polymerization of IMPDH (20, 22, 28–30, 62, 63). When treating cells with IMPDH inhibitors, which cause G1 arrest as well as very rapid (5–10 min) and extensive IMPDH polymerization, the majority of cellular IMPDH is expected to be inactive. When inhibiting upstream of IMPDH, as with methotrexate treatment, the situation is not as clear. While substrate depletion caused by inhibition of de novo IMP synthesis would render IMPDH mostly inactive, salvage of hypoxanthine by hypoxanthine-guanine phosphoribosyltransferase can replenish IMP to some degree, depending on the cell type. However, it is known that methotrexate treatment causes an irreversible G1/S arrest that is mediated, at least partially, through depletion of purines that is not overcome by salvage (76–80). IMPDH filaments also persist in >90% of HeLa cells treated with pharmacological doses of methotrexate for at least 24 h (30), which should be well after cell cycle arrest occurs. Thus, IMPDH filaments formed after treatment with IMPDH inhibitors or methotrexate should not be considered the same as filaments in proliferating cells. It might be that, once these inhibitors are added to cells, an immediate need for more GTP stimulates the rapid formation of filaments. However, the continued presence of inhibitor will likely maintain a predominantly inactive pool of IMPDH within the filaments. As mentioned, it was shown recently that both active and inactive IMPDH octamer conformations can form filaments in vitro (27). In living cells, it remains unclear what molecular mechanism drives the polymerization of IMPDH. This mechanism might be common to both active and inactive octamers.
We are encouraged that future experiments using T cell activation as a model for IMPDH filament formation will help answer some of the many questions still surrounding the polymerization of IMPDH. Despite the progress in developing IMPDH inhibitors for immunosuppressive and antiviral therapies, less success has been found in specific targeting of IMPDH in cancers. Several recent studies have demonstrated increased expression of IMPDH in bladder, kidney, nasopharyngeal, prostate, and small cell lung cancers (81–84), highlighting the necessity to better understand all aspects of IMPDH regulation, including polymerization. Based on the data presented here and other recently published work, it is conceivable that manipulating the ability of IMPDH to polymerize could be exploited in the design of novel therapies. We have already recognized that widely-used drugs, like methotrexate, mycophenolic acid, and ribavirin, profoundly alter the subcellular distribution of IMPDH in the cells of patients, with unknown consequences. From the present study, we now also know that extensive IMPDH filament formation occurs in the spleen and thymus (and perhaps other proliferative tissues) of healthy mice. Importantly, our data suggest that IMPDH filament formation is a novel and largely uncharacterized aspect of T cell activation. Better understanding of IMPDH filament function in this process could have widespread impacts on a variety of treatment regimens, especially the many emerging T cell-based immunotherapies. These ideas should inspire intense interest in this enzyme.
This study was carried out in strict accordance with the recommendations in the Guide for the Care and Use of Laboratory Animals of the Animal Welfare Act and the National Institutes of Health guidelines for the care and use of animals in biomedical research. All animal protocols were approved by the Institutional Animal Care and Use Committee (IACUC) of the University of Florida, Gainesville (OLAW Assurance # A3377-01).
While this manuscript was under review, Duong-Ly et al. published an elegant study demonstrating IMPDH filament formation in ex vivo activation of healthy murine splenic T cells, as well as in T cells isolated from mice infected with lymphocytic choriomeningitis virus. They showed that filament assembly was diminished by mTOR inhibitors or knockout of the Ca2+ influx regulator STIM1 (85).
SC conceived the study, designed and performed experiments, analyzed the data, and wrote the original draft of the manuscript. GA designed and performed experiments. HK performed experiments. LM designed experiments. EC conceived the study, analyzed the data, and critically reviewed and edited the manuscript. All authors read and approved the final manuscript.
This material is based upon work supported by the National Science Foundation Graduate Research Fellowship under Grant No. DGE-1315138 and DGE-1842473 (awarded to SC). SC was also previously supported by the National Institute of Dental and Craniofacial Research of the National Institutes of Health (NIH) under Award No. 2T90DE021990-06 while this work was performed. GA and LM are supported by a grant from the NIH National Institute of Allergy and Infectious Diseases (R01 AI128901).
The authors declare that the research was conducted in the absence of any commercial or financial relationships that could be construed as a potential conflict of interest.
The authors would like to thank Kristianna Fredenburg, Madeline Howe, Patrick Kellish, Yuk Pheel Park, Nhi Pham, and Daniel Purich for their valuable technical assistance or advice regarding this study.
The Supplementary Material for this article can be found online at: https://www.frontiersin.org/articles/10.3389/fimmu.2018.02789/full#supplementary-material
AMP, adenosine monophosphate; ConA, concanavalin A; CTPS, cytidine triphosphate synthase; dCTP, deoxycytidine triphosphate; EdU, 5-ethynyl-2′-deoxyuridine; ESCs, embryonic stem cells; FFPE, formalin/paraformaldehyde-fixed, paraffin-embedded; GC, germinal center; GMP, guanosine monophosphate; GTP, guanosine triphosphate; IMP, inosine monophosphate; IMPDH, inosine monophosphate dehydrogenase; iPSCs, induced pluripotent stem cells; OVA, ovalbumin; PBMCs, peripheral blood mononuclear cells; PE, phycoerythrin; PHA, phytohemagglutinin
1. O'Connell JD, Zhao A, Ellington AD, Marcotte EM. Dynamic reorganization of metabolic enzymes into intracellular bodies. Annu Rev Cell Dev Biol. (2012) 28:89–111. doi: 10.1146/annurev-cellbio-101011-155841
2. Gregolin C, Ryder E, Kleinschmidt AK, Warner RC, Lane MD. Molecular characteristics of liver acetyl CoA carboxylase. Proc Natl Acad Sci USA. (1966) 56:148–55. doi: 10.1073/pnas.56.1.148
3. Josephs R, Borisy G. Self-assembly of glutamic dehydrogenase into ordered superstructures: multichain tubes formed by association of single molecules. J Mol Biol. (1972) 65:127–55. doi: 10.1016/0022-2836(72)90496-2
4. Miller RE, Shelton E, Stadtman ER. Zinc-induced paracrystalline aggregation of glutamine synthetase. Arch Biochem Biophys. (1974) 163:155–71. doi: 10.1016/0003-9861(74)90465-2
5. Noree C, Sato BK, Broyer RM, Wilhelm JE. Identification of novel filament-forming proteins in Saccharomyces cerevisiae and Drosophila melanogaster. J Cell Biol. (2010) 190:541–51. doi: 10.1083/jcb.201003001
6. Shen QJ, Kassim H, Huang Y, Li H, Zhang J, Li G, et al. Filamentation of metabolic enzymes in Saccharomyces cerevisiae. J Genet Genomics (2016) 43:393–404. doi: 10.1016/j.jgg.2016.03.008
7. Narayanaswamy R, Levy M, Tsechansky M, Stovall GM, O'Connell JD, Mirrielees J, et al. Widespread reorganization of metabolic enzymes into reversible assemblies upon nutrient starvation. Proc Natl Acad Sci USA. (2009) 106:10147–52. doi: 10.1073/pnas.0812771106
8. Liu JL. Intracellular compartmentation of CTP synthase in Drosophila. J Genet Genomics (2010) 37:281–96. doi: 10.1016/S1673-8527(09)60046-1
9. Ingerson-Mahar M, Briegel A, Werner JN, Jensen GJ, Gitai Z. The metabolic enzyme CTP synthase forms cytoskeletal filaments. Nat Cell Biol. (2010) 12:739–46. doi: 10.1038/ncb2087
10. Barry RM, Bitbol AF, Lorestani A, Charles EJ, Habrian CH, Hansen JM, et al. Large-scale filament formation inhibits the activity of CTP synthetase. Elife (2014) 3:e03638. doi: 10.7554/eLife.03638
11. Strochlic TI, Stavrides KP, Thomas SV, Nicolas E, O'Reilly AM, Peterson JR. Ack kinase regulates CTP synthase filaments during Drosophila oogenesis. EMBO Rep. (2014) 15:1184–91. doi: 10.15252/embr.201438688
12. Lynch EM, Hicks DR, Shepherd M, Endrizzi JA, Maker A, Hansen JM, et al. Human CTP synthase filament structure reveals the active enzyme conformation. Nat Struct Mol Biol. (2017) 24:507–14. doi: 10.1038/nsmb.3407
13. Beaty NB, Lane MD. Kinetics of activation of acetyl-CoA carboxylase by citrate. Relationship to the rate of polymerization of the enzyme. J Biol Chem (1983) 258:13043–50.
14. Petrovska I, Nuske E, Munder MC, Kulasegaran G, Malinovska L, Kroschwald S, et al. Filament formation by metabolic enzymes is a specific adaptation to an advanced state of cellular starvation. Elife (2014) 3:e02409. doi: 10.7554/eLife.02409
15. Carr SF, Papp E, Wu JC, Natsumeda Y. Characterization of human type I and type II IMP dehydrogenases. J Biol Chem. (1993) 268:27286–90.
16. Natsumeda Y, Ohno S, Kawasaki H, Konno Y, Weber G, Suzuki K. Two distinct cDNAs for human IMP dehydrogenase. J Biol Chem. (1990) 265:5292–5.
17. Hedstrom L. IMP dehydrogenase: structure, mechanism, and inhibition. Chem Rev. (2009) 109:2903–28. doi: 10.1021/cr900021w
18. Jain J, Almquist SJ, Ford PJ, Shlyakhter D, Wang Y, Nimmesgern E, et al. Regulation of inosine monophosphate dehydrogenase type I and type II isoforms in human lymphocytes. Biochem Pharmacol. (2004) 67:767–76. doi: 10.1016/j.bcp.2003.09.043
19. Senda M, Natsumeda Y. Tissue-differential expression of two distinct genes for human IMP dehydrogenase (E.C.1.1.1.205). Life Sci. (1994) 54:1917–26. doi: 10.1016/0024-3205(94)90150-3
20. Gunter JH, Thomas EC, Lengefeld N, Kruger SJ, Worton L, Gardiner EM, et al. Characterisation of inosine monophosphate dehydrogenase expression during retinal development: differences between variants and isoforms. Int J Biochem Cell Biol. (2008) 40:1716–28. doi: 10.1016/j.biocel.2007.12.018
21. Thomas EC, Gunter JH, Webster JA, Schieber NL, Oorschot V, Parton RG, et al. Different characteristics and nucleotide binding properties of inosine monophosphate dehydrogenase (IMPDH) isoforms. PLoS ONE (2012) 7:e51096. doi: 10.1371/journal.pone.0051096
22. Carcamo WC, Satoh M, Kasahara H, Terada N, Hamazaki T, Chan JY, et al. Induction of cytoplasmic rods and rings structures by inhibition of the CTP and GTP synthetic pathway in mammalian cells. PLoS ONE (2011) 6:e29690. doi: 10.1371/journal.pone.0029690
23. Juda P, Smigova J, Kovacik L, Bartova E, Raska I. Ultrastructure of cytoplasmic and nuclear inosine-5′-monophosphate dehydrogenase 2 “Rods and Rings” inclusions. J Histochem Cytochem. (2014) 62:739–50. doi: 10.1369/0022155414543853
24. Labesse G, Alexandre T, Vaupre L, Salard-Arnaud I, Him JL, Raynal B, et al. MgATP regulates allostery and fiber formation in IMPDHs. Structure (2013) 21:975–85. doi: 10.1016/j.str.2013.03.011
25. Buey RM, Ledesma-Amaro R, Velazquez-Campoy A, Balsera M, Chagoyen M, de Pereda JM, et al. Guanine nucleotide binding to the Bateman domain mediates the allosteric inhibition of eukaryotic IMP dehydrogenases. Nat Commun. (2015) 6:8923. doi: 10.1038/ncomms9923
26. Buey RM, Fernandez-Justel D, Marcos-Alcalde I, Winter G, Gomez-Puertas P, de Pereda JM, et al. A nucleotide-controlled conformational switch modulates the activity of eukaryotic IMP dehydrogenases. Sci Rep. (2017) 7:2648. doi: 10.1038/s41598-017-02805-x
27. Anthony SA, Burrell AL, Johnson MC, Duong-Ly KC, Kuo YM, Simonet JC, et al. Reconstituted IMPDH polymers accommodate both catalytically active and inactive conformations. Mol Biol Cell (2017) 28:2600–8. doi: 10.1091/mbc.e17-04-0263
28. Ji Y, Gu J, Makhov AM, Griffith JD, Mitchell BS. Regulation of the interaction of inosine monophosphate dehydrogenase with mycophenolic Acid by GTP. J Biol Chem. (2006) 281:206–12. doi: 10.1074/jbc.M507056200
29. Calise SJ, Carcamo WC, Krueger C, Yin JD, Purich DL, Chan EK. Glutamine deprivation initiates reversible assembly of mammalian rods and rings. Cell Mol Life Sci. (2014) 71:2963–73. doi: 10.1007/s00018-014-1567-6
30. Calise SJ, Purich DL, Nguyen T, Saleem DA, Krueger C, Yin JD, et al. ‘Rod and ring' formation from IMP dehydrogenase is regulated through the one-carbon metabolic pathway. J Cell Sci. (2016) 129:3042–52. doi: 10.1242/jcs.183400
31. Chen K, Zhang J, Tastan OY, Deussen ZA, Siswick MY, Liu JL. Glutamine analogs promote cytoophidium assembly in human and Drosophila cells. J Genet Genomics (2011) 38:391–402. doi: 10.1016/j.jgg.2011.08.004
32. Gou KM, Chang CC, Shen QJ, Sung LY, Liu JL. CTP synthase forms cytoophidia in the cytoplasm and nucleus. Exp Cell Res. (2014) 323:242–53. doi: 10.1016/j.yexcr.2014.01.029
33. Keppeke GD, Calise SJ, Chan EK, Andrade LE. Assembly of IMPDH2-based, CTPS-based, and mixed rod/ring structures is dependent on cell type and conditions of induction. J Genet Genomics (2015) 42:287–99. doi: 10.1016/j.jgg.2015.04.002
34. Chang CC, Lin WC, Pai LM, Lee HS, Wu SC, Ding ST, et al. Cytoophidium assembly reflects upregulation of IMPDH activity. J Cell Sci. (2015) 128:3550–5. doi: 10.1242/jcs.175265
35. Chang CC, Keppeke GD, Sung LY, Liu JL. Inter-filament interaction between IMPDH and CTPS cytoophidia. FEBS J. (2018) 285:3753–68. doi: 10.1111/febs.14624
36. Keppeke GD, Chang CC, Peng M, Chen LY, Lin WC, Pai LM, et al. IMP/GTP balance modulates cytoophidium assembly and IMPDH activity. Cell Div. (2018) 13:5. doi: 10.1186/s13008-018-0038-0
37. Jackson RC, Weber G, Morris HP. IMP dehydrogenase, an enzyme linked with proliferation and malignancy. Nature (1975) 256:331–3. doi: 10.1038/256331a0
38. Allison AC, Hovi T, Watts RW, Webster AD. The role of de novo purine synthesis in lymphocyte transformation. Ciba Found Symp. (1977) 48:207–24. doi: 10.1002/9780470720301.ch13
39. Dayton JS, Lindsten T, Thompson CB, Mitchell BS. Effects of human T lymphocyte activation on inosine monophosphate dehydrogenase expression. J Immunol. (1994) 152:984–91.
40. Chapman NM, Chi H. Hallmarks of T-cell Exit from Quiescence. Cancer Immunol Res. (2018) 6:502–8. doi: 10.1158/2326-6066.CIR-17-0605
41. Chi H. Regulation and function of mTOR signalling in T cell fate decisions. Nat Rev Immunol. (2012) 12:325–38. doi: 10.1038/nri3198
42. Lane AN, Fan TW. Regulation of mammalian nucleotide metabolism and biosynthesis. Nucleic Acids Res. (2015) 43:2466–85. doi: 10.1093/nar/gkv047
43. Liu YC, Li F, Handler J, Huang CR, Xiang Y, Neretti N, et al. Global regulation of nucleotide biosynthetic genes by c-Myc. PLoS ONE (2008) 3:e2722. doi: 10.1371/journal.pone.0002722
44. Barfeld SJ, Fazli L, Persson M, Marjavaara L, Urbanucci A, Kaukoniemi KM, et al. Myc-dependent purine biosynthesis affects nucleolar stress and therapy response in prostate cancer. Oncotarget (2015) 6:12587–602. doi: 10.18632/oncotarget.3494
45. Wang R, Dillon CP, Shi LZ, Milasta S, Carter R, Finkelstein D, et al. The transcription factor Myc controls metabolic reprogramming upon T lymphocyte activation. Immunity (2011) 35:871–82. doi: 10.1016/j.immuni.2011.09.021
46. Schindelin J, Arganda-Carreras I, Frise E, Kaynig V, Longair M, Pietzsch T, et al. Fiji: an open-source platform for biological-image analysis. Nat Methods (2012) 9:676–82. doi: 10.1038/nmeth.2019
47. Scholzen T, Gerdes J. The Ki-67 protein: from the known and the unknown. J Cell Physiol. (2000) 182:311–22. doi: 10.1002/(SICI)1097-4652(200003)182:3<311::AID-JCP1>3.0.CO;2-9
48. Farley AM, Morris LX, Vroegindeweij E, Depreter ML, Vaidya H, Stenhouse FH, et al. Dynamics of thymus organogenesis and colonization in early human development. Development (2013) 140:2015–26. doi: 10.1242/dev.087320
49. Cuddihy AR, Ge S, Zhu J, Jang J, Chidgey A, Thurston G, et al. VEGF-mediated cross-talk within the neonatal murine thymus. Blood (2009) 113:2723–31. doi: 10.1182/blood-2008-06-162040
50. Manley NR, Richie ER, Blackburn CC, Condie BG, Sage J. Structure and function of the thymic microenvironment. Front Biosci. (2011) 16:2461–77. doi: 10.2741/3866
51. Nagai M, Natsumeda Y, Weber G. Proliferation-linked regulation of type II IMP dehydrogenase gene in human normal lymphocytes and HL-60 leukemic cells. Cancer Res. (1992) 52:258–61.
52. Gu JJ, Stegmann S, Gathy K, Murray R, Laliberte J, Ayscue L, et al. Inhibition of T lymphocyte activation in mice heterozygous for loss of the IMPDH II gene. J Clin Invest. (2000) 106:599–606. doi: 10.1172/JCI8669
53. Carr EL, Kelman A, Wu GS, Gopaul R, Senkevitch E, Aghvanyan A, et al. Glutamine uptake and metabolism are coordinately regulated by ERK/MAPK during T lymphocyte activation. J Immunol. (2010) 185:1037–44. doi: 10.4049/jimmunol.0903586
54. Wei J, Raynor J, Nguyen TL, Chi H. Nutrient and metabolic sensing in T cell responses. Front Immunol. (2017) 8:247. doi: 10.3389/fimmu.2017.00247
55. Barnden MJ, Allison J, Heath WR, Carbone FR. Defective TCR expression in transgenic mice constructed using cDNA-based alpha- and beta-chain genes under the control of heterologous regulatory elements. Immunol Cell Biol. (1998) 76:34–40. doi: 10.1046/j.1440-1711.1998.00709.x
56. Choi SC, Hutchinson TE, Titov AA, Seay HR, Li S, Brusko TM, et al. The lupus susceptibility gene Pbx1 regulates the balance between follicular helper T cell and regulatory T cell differentiation. J Immunol. (2016) 197:458–69. doi: 10.4049/jimmunol.1502283
57. Weber G. Biochemical strategy of cancer cells and the design of chemotherapy: G. H A Clowes Memorial Lecture. Cancer Res. (1983) 43:3466–92.
58. Covini G, Carcamo WC, Bredi E, von Muhlen CA, Colombo M, Chan EKL. Cytoplasmic rods and rings autoantibodies developed during pegylated interferon and ribavirin therapy in patients with chronic hepatitis C. Antivir Ther. (2012) 17:805–11. doi: 10.3851/IMP1993
59. Keppeke GD, Nunes E, Ferraz ML, Silva EA, Granato C, Chan EK, et al. Longitudinal study of a human drug-induced model of autoantibody to cytoplasmic rods/rings following HCV therapy with ribavirin and interferon-alpha. PLoS ONE (2012) 7:e45392. doi: 10.1371/journal.pone.0045392
60. Calise SJ, Keppeke GD, Andrade LE, Chan EKL. Anti-rods/rings: a human model of drug-induced autoantibody generation. Front Immunol. (2015) 6:41. doi: 10.3389/fimmu.2015.00041
61. Keppeke GD, Calise SJ, Chan EK, Andrade LE. Anti-rods/rings autoantibody generation in hepatitis C patients during interferon-alpha/ribavirin therapy. World J Gastroenterol. (2016) 22:1966–74. doi: 10.3748/wjg.v22.i6.1966
62. Keppeke GD, Prado MS, Nunes E, Perazzio SF, Rodrigues SH, Ferraz ML, et al. Differential capacity of therapeutic drugs to induce Rods/Rings structures in vitro and in vivo and generation of anti-Rods/Rings autoantibodies. Clin Immunol. (2016) 173:149–56. doi: 10.1016/j.clim.2016.10.004
63. Carcamo WC, Calise SJ, von Muehlen CA, Satoh M, Chan EKL. Molecular cell biology and immunobiology of mammalian rod/ring structures. Int Rev Cell Mol Biol. (2014) 308:35–74. doi: 10.1016/B978-0-12-800097-7.00002-6
64. Stinton LM, Myers RP, Coffin CS, Fritzler MJ. Clinical associations and potential novel antigenic targets of autoantibodies directed against rods and rings in chronic hepatitis C infection. BMC Gastroenterol. (2013) 13:50. doi: 10.1186/1471-230X-13-50
65. An S, Kumar R, Sheets ED, Benkovic SJ. Reversible compartmentalization of de novo purine biosynthetic complexes in living cells. Science (2008) 320:103–6. doi: 10.1126/science.1152241
66. Zhao H, Chiaro CR, Zhang L, Smith PB, Chan CY, Pedley AM, et al. Quantitative analysis of purine nucleotides indicates that purinosomes increase de novo purine biosynthesis. J Biol Chem. (2015) 290:6705–13. doi: 10.1074/jbc.M114.628701
67. Warburg O. On the origin of cancer cells. Science (1956) 123:309–14. doi: 10.1126/science.123.3191.309
68. Almeida L, Lochner M, Berod L, Sparwasser T. Metabolic pathways in T cell activation and lineage differentiation. Semin Immunol. (2016) 28:514–24. doi: 10.1016/j.smim.2016.10.009
69. Fox CJ, Hammerman PS, Thompson CB. Fuel feeds function: energy metabolism and the T-cell response. Nat Rev Immunol. (2005) 5:844–52. doi: 10.1038/nri1710
70. Frauwirth KA, Riley JL, Harris MH, Parry RV, Rathmell JC, Plas DR, et al. The CD28 signaling pathway regulates glucose metabolism. Immunity (2002) 16:769–77. doi: 10.1016/S1074-7613(02)00323-0
71. Jones RG, Thompson CB. Revving the engine: signal transduction fuels T cell activation. Immunity (2007) 27:173–8. doi: 10.1016/j.immuni.2007.07.008
72. Shyh-Chang N, Ng HH. The metabolic programming of stem cells. Genes Dev. (2017) 31:336–46. doi: 10.1101/gad.293167.116
73. Vander Heiden MG, Cantley LC, Thompson CB. Understanding the Warburg effect: the metabolic requirements of cell proliferation. Science (2009) 324:1029–33. doi: 10.1126/science.1160809
74. Yang K, Blanco DB, Chen X, Dash P, Neale G, Rosencrance C, et al. Metabolic signaling directs the reciprocal lineage decisions of alphabeta and gammadelta T cells. Sci Immunol. (2018) 3:eaas9818. doi: 10.1126/sciimmunol.aas9818
75. Quemeneur L, Gerland LM, Flacher M, Ffrench M, Revillard JP, Genestier L. Differential control of cell cycle, proliferation, and survival of primary T lymphocytes by purine and pyrimidine nucleotides. J Immunol. (2003) 170:4986–95. doi: 10.4049/jimmunol.170.10.4986
76. Hryniuk WM, Brox LW, Henderson JF, Tamaoki T. Consequences of methotrexate inhibition of purine biosynthesis in L5178Y cells. Cancer Res. (1975) 35:1427–32.
77. Budzik GP, Colletti LM, Faltynek CR. Effects of methotrexate on nucleotide pools in normal human T cells and the CEM T cell line. Life Sci. (2000) 66:2297–307. doi: 10.1016/S0024-3205(00)00559-2
78. Allegra CJ, Hoang K, Yeh GC, Drake JC, Baram J. Evidence for direct inhibition of de novo purine synthesis in human MCF-7 breast cells as a principal mode of metabolic inhibition by methotrexate. J Biol Chem. (1987) 262:13520–6.
79. Dervieux T, Brenner TL, Hon YY, Zhou Y, Hancock ML, Sandlund JT, et al. De novo purine synthesis inhibition and antileukemic effects of mercaptopurine alone or in combination with methotrexate in vivo. Blood (2002) 100:1240–7. doi: 10.1182/blood-2002-02-0495
80. Bokkerink JP, De Abreu RA, Bakker MA, Hulscher TW, van Baal JM, Schretlen ED, et al. Effects of methotrexate on purine and pyrimidine metabolism and cell-kinetic parameters in human malignant lymphoblasts of different lineages. Biochem Pharmacol. (1988) 37:2329–38. doi: 10.1016/0006-2952(88)90359-0
81. Zhou L, Xia D, Zhu J, Chen Y, Chen G, Mo R, et al. Enhanced expression of IMPDH2 promotes metastasis and advanced tumor progression in patients with prostate cancer. Clin Transl Oncol. (2014) 16:906–13. doi: 10.1007/s12094-014-1167-9
82. Zou J, Han Z, Zhou L, Cai C, Luo H, Huang Y, et al. Elevated expression of IMPDH2 is associated with progression of kidney and bladder cancer. Med Oncol. (2015) 32:373. doi: 10.1007/s12032-014-0373-1
83. Xu Y, Zheng Z, Gao Y, Duan S, Chen C, Rong J, et al. High expression of IMPDH2 is associated with aggressive features and poor prognosis of primary nasopharyngeal carcinoma. Sci Rep. (2017) 7:745. doi: 10.1038/s41598-017-00887-1
84. Huang F, Ni M, Chalishazar MD, Huffman KE, Kim J, Cai L, et al. Inosine monophosphate dehydrogenase dependence in a subset of small cell Lung cancers. Cell Metab. (2018) 28:369–82.e5. doi: 10.1016/j.cmet.2018.06.005
Keywords: cell proliferation, cytoophidia, enzyme polymerization, IMPDH, lymphocytes, purine synthesis, rods and rings, T cell activation
Citation: Calise SJ, Abboud G, Kasahara H, Morel L and Chan EKL (2018) Immune Response-Dependent Assembly of IMP Dehydrogenase Filaments. Front. Immunol. 9:2789. doi: 10.3389/fimmu.2018.02789
Received: 21 August 2018; Accepted: 12 November 2018;
Published: 29 November 2018.
Edited by:
Yun-Cai Liu, Tsinghua University, ChinaReviewed by:
Guangwei Liu, Beijing Normal University, ChinaCopyright © 2018 Calise, Abboud, Kasahara, Morel and Chan. This is an open-access article distributed under the terms of the Creative Commons Attribution License (CC BY). The use, distribution or reproduction in other forums is permitted, provided the original author(s) and the copyright owner(s) are credited and that the original publication in this journal is cited, in accordance with accepted academic practice. No use, distribution or reproduction is permitted which does not comply with these terms.
*Correspondence: Edward K. L. Chan, ZWNoYW5AdWZsLmVkdQ==
Disclaimer: All claims expressed in this article are solely those of the authors and do not necessarily represent those of their affiliated organizations, or those of the publisher, the editors and the reviewers. Any product that may be evaluated in this article or claim that may be made by its manufacturer is not guaranteed or endorsed by the publisher.
Research integrity at Frontiers
Learn more about the work of our research integrity team to safeguard the quality of each article we publish.