 Robert Z. Harms1*
 Kristina M. Lorenzo-Arteaga1Katie R. Ostlund1Victoria B. Smith2
 Lynette M. Smith3Peter Gottlieb4
 Nora Sarvetnick1,5*
- 1Surgery-Transplant, University of Nebraska Medical Center, Omaha, NE, United States
- 2Office of the Vice Chancellor of Research, University of Nebraska Medical Center, Omaha, NE, United States
- 3Biostatistics, University of Nebraska Medical Center, Omaha, NE, United States
- 4Barbara Davis Center for Diabetes, University of Colorado Anschutz Medical Campus, Aurora, CO, United States
- 5Mary and Dick Holland Regenerative Medicine Program, University of Nebraska Medical Center, Omaha, NE, United States
We analyzed T cell subsets from cryopreserved PBMC obtained from the TrialNet Pathway to Prevention archives. We compared subjects who had previously seroconverted for one or more autoantibodies with non-seroconverted, autoantibody negative individuals. We observed a reduced frequency of MAIT cells among seroconverted subjects. Seroconverted subjects also possessed decreased frequencies of CCR4-expressing CD4 T cells, including a regulatory-like subset. Interestingly, we found an elevation of CD57+, CD28–, CD127–, CD27– CD8 T cells (SLEC) among seroconverted subjects that was most pronounced among those that progressed to disease. The frequency of these SLEC was strongly correlated with CMV IgG abundance among seroconverted subjects, associated with IA-2 levels, and most elevated among CMV+ seroconverted subjects who progressed to disease. Combined, our data indicate discrete, yet profound T cell alterations are associated with islet autoimmunity among at-risk subjects.
Introduction
Human type 1 diabetes (T1D) is characterized by the presence of antibodies targeting islet cell-associated antigens (i.e., autoantibodies) and the selective destruction of beta cells resulting in insulin deficiency (1). The destruction of beta cells is widely believed to be driven by autoreactive T cells (2). The evidence for this theory is generally indirect, comprising multiple reports of a variable T cell presence in and around islets [see for example (3)], including islet-antigen reactive CD8 T cells (4). Furthermore, islet-antigen reactive CD8 T cells have been isolated from the peripheral blood of type 1 diabetics and these can be induced to destroy beta cells in culture (5). In vivo, this unimpeded destruction by autoreactive CD8 T cells is considered to indicate an escape from tolerance, possibly due to dysfunctional regulatory T cells (Treg) among diabetics (6).
Defining the prodromal events which ultimately manifest in clinically-defined T1D remains a critical area of research. It is known that autoantibody presence often occurs several years prior to diagnosis (7), with functional aberrancy and reduction in the beta cell population preceding overt hyperglycemia (8, 9). While genetic factors can identify some risk, environmental variables are the ostensible drivers of T1D and its rising rate of incidence (10–12). In the absence of a well-characterized environmental trigger that may be avoided, early intervention following seroconversion is a worthy clinical goal for at-risk subjects (13). To that end, a thorough investigation of immune cells during the preclinical period is warranted. Such an investigation can reveal immune perturbations indicative of environmental exposures and/or regulatory dysfunction. These data can then be used to define biomarkers indicating risk, in the design of therapeutics, and in the unraveling of autoimmune mechanisms leading to beta cell decline.
Although a simply stated need, the identification of at-risk subjects with subsequent leukocyte isolation is a near Herculean labor. Importantly, an ongoing collaboration was established to meet this challenge. The T1D TrialNet Pathway to Prevention Study involves screening relatives of type 1 diabetics for autoantibodies to gauge risk, as well as a component for biosample acquisition (14). We utilized TrialNet PBMC samples to explore the hypothesis that peripheral T cell abundance is altered among seroconverted, at-risk subjects. We used flow cytometry to interrogate multiple T cell populations using a range of differentiation and lineage markers. Our results demonstrate profound changes in frequency of T cell subsets are associated with seroconversion, with several T cell lineages impacted including regulatory-like (Treg-like), cytotoxic (CD8), and mucosal associated invariant T (MAIT) cells. These data suggest substantial immunodeficiency underrides a likely pathogen response among seroconverted subjects.
Materials and Methods
Patient Samples
Cryopreserved PBMC were acquired as part of an ancillary study approved by TrialNet from the Pathway to Prevention study of 1st and 2nd degree relatives of individuals with type 1 diabetes. Aside from the familial association, study eligibility is limited to those 1st and 2nd degree relatives who are not on medication to control hyperglycemia, not currently using immunosuppressive or immunomodulatory agents, have no known severe active disease, and do not have diabetes or a history of diabetes. From this pool of subjects, we received 79 blinded samples comprising 3 subgroups of subjects. Twenty-five samples were from autoantibody negative (AA–) 1st and 2nd degree relatives of diagnosed type 1 diabetics or seroconverted, at-risk individuals. Having no autoantibodies, yet sharing some environmental and genetic risk, these samples constitute our control group. Importantly, these AA– subjects were not related to the seroconverted, at-risk individuals analyzed in our study. The remaining 54 subjects, labeled “seroconverted,” had previously seroconverted for one or more autoantibodies and are at increased risk of developing T1D (15, 16). Autoantibody testing was performed by TrialNet. Individuals are screened for GAD65, IA-2, and IAA. If any of these measurements were positive, they were also then screened for ZnT8 and ICA. Positivity thresholds were as follows: IAA, >0.010; GAD65, >0.032; ICA512, >0.049; GAD65H, >20; IA-2H, >5; ZnT8, >0.020; ICA, ≥10. Once an individual has tested positive for an autoantibody twice within one year, they are considered “autoantibody positive” or seroconverted to the production of autoantibodies targeting islet antigens. Among the seroconverted subset, 26 samples were from individuals who have not yet progressed to clinical disease, and for our analysis these are labeled “non-progressor.” The remaining 28 samples were from individuals who ultimately progressed to clinical disease. This subgroup is labeled as “progressor.” Our request for samples from TrialNet did not specify particular HLA-risk alleles, therefore our sample set constituted a mix of HLA types. Although we did request samples from subjects between 8 and 11 years old, upon unblinding the samples we discovered our subjects spanned a much broader age range. Patient data is presented in Table 1.
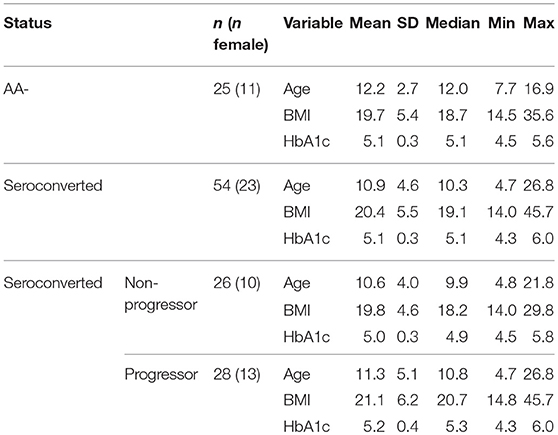
Table 1. Patient data.
Flow Cytometry
Surface panel design and analysis was performed using a BD LSR II equipped with 5 lasers: UV (355 nm) for Brilliant Ultraviolet (BUV) 395 and 737 and LiveDead UV Blue; Violet (405 nm) for Brilliant Violet (BV) 421, 510, 605, 650, 711, and 785; Blue (488 nm) for FITC and PerCP-Cy5.5; Yellow-Green (561 nm) for PE, PE-CF594, and PE-Cy7; and Red(633 nm) for APC and Alexa Fluor(AF) 700. The following antibodies and reagents were used: from Biolegend CCR7(PE, clone G043H7), CCR4(PE-Cy7, clone L291H4), CD14(BV711, clone M5E2), CD19(BV711, clone HIB19), CD27(BV785, clone O323), CD57(FITC, clone HCD57), CD45RA(PerCP-Cy5.5, clone HI100), Vα7.2(BV605, clone 3C10), CD45(AF700, clone HI30), Streptavidin-APC; from BD Biosciences CXCR5(BV421, clone RF8B2), CD3(BUV737, clone UCHT1), CD4(BUV395, clone RPA-T4), CD8(BV510, clone RPA-T8), CD28(PE-CF594, clone CD28.2), CD161(BV650, clone DX12); from eBioscience CD127(Biotin, clone eBioRDR5); from life technologies LiveDead UV Blue. Cryopreserved PBMC were thawed and rested overnight in X-VIVO 15 (Lonza) supplemented with human AB serum (MP Biomedicals) at 2% v/v at 37° C with 5% CO2. Samples were then counted and distributed to 96 well plates for labeling following methods described previously (17) with two modifications: Fc receptors were blocked using human IgG (Sigma Aldrich) and antibody cocktails were prepared using Brilliant Stain Buffer (BD Biosciences).
For FOXP3 analysis, lymphocytes from healthy human donors were acquired from the UNMC elutriation core facility, cryopreserved, thawed, rested and surface labeled as described above. We then utilized the True-Nuclear Transcription Factor Buffer set (BioLegend) according to manufacturer's recommendations. In panel validation, we compared PE-conjugated FOXP3 clones 206D (BioLegend), PCH101 (eBioscience), and 259D/C7 (BD Biosciences) and clone 206D gave the greatest signal-to-noise ratio (data not shown). The final panel included the aforementioned FOXP3, CD25 (VioBright FITC, clone 4E3, Miltenyi), and the conjugated-clones and reagents listed above for LiveDead, CD3, CD4, CXCR5, CCR4, and CD127 with streptavidin-APC.
Data analysis was conducted in a blinded fashion using FlowJo (v10.2, TreeStar). All samples were pregated to exclude doublets, debris, dead cells, and non T cells (lineage negative) and then multiple subsets were identified and gated according to known T cell differentiation pathways. A representative gating procedure for all subsets explored is shown in Supplemental Figure 1. Following analysis, raw data files and tabular results were uploaded to TrialNet, upon which we received sample identification, clinical data, and autoantibody levels in order to perform statistical analysis.
Measurement of Anti-viral Immunoglobulins
We received blinded vials of plasma from the majority of the subjects in our PBMC analysis: 25/25 AA–, 23/26 non-progressors, and 27/28 progressors. Prior to performing assays, the vials of plasma were thawed, divided into several aliquots, refrozen, and stored at −80°C in order to run several assays and limit sample degradation from multiple freeze/thaw cycles. The following anti-viral immunoglobulin ELISAs from IBL America were performed according to manufacturer's directions: CMV IgM (IB19206), CMV IgG (EG101), EBV VCA IgM (IB79231), EBV VCA IgG (IB79230), enterovirus IgM(IB05053), and enterovirus IgG(IB05052). All sample dilutions contained Heteroblock (Omega Biologicals Inc.) to eliminate potential interference resulting from the presence of heterophilic antibodies. Optical densities were measured using a Synergy H1 Hybrid Multi-Mode Reader (BioTek Instruments, Inc.). Sample positivity for viral immunoglobulins was determined following calculations defined per assay. If sample positivity was equivocal, the sample was retested. If the sample was also equivocal on the follow-up test, it was labeled as “gray” for purposes of stratification and treated as negative. Upon completion of our plasma analysis, tabular data was uploaded to TrialNet. We then received sample identification data for pairing with our PBMC results and subsequent statistical analysis.
Statistics
For mean comparisons, natural log transformation was applied to the data prior to analysis. For comparison of two groups, we used Student's T-test and for comparisons of three groups, we used analysis of variance (ANOVA). If the results of the ANOVA were significant, then pairwise comparisons were made, adjusting for multiple comparisons with Tukey's method. For correlations, data were not transformed and we used Spearman's Rank-Order correlation. In all cases, figures and descriptive data depict non-transformed data to facilitate interpretation. Figures were made using Prism (v6.03 GraphPad Software Inc.), and data was analyzed using Prism and SAS software versions 9.4 (SAS Institute Inc., Cary, NC).
Results
Reduced Frequencies of Mucosal Associated Invariant T Cells (MAIT) in Seroconverted Subjects
MAIT cells are regularly found in human blood, the liver, and the gastrointestinal mucosa (18), and respond to microbially-derived vitamin B metabolites presented through MR1 (19). MAIT cells are capable of directly lysing bacterially-sensitized and infected target cells (20, 21) and can produce the proinflammatory cytokines IFN-γ, TNF-α, and IL-17 (18). Phenotypically, in the absence of MR1-loaded multimers, MAIT cells are unambiguously identifiable in blood by the high CD161 expression, presence of Vα7.2 T cell receptor, and T cell lineage marker CD3 (18, 22). The circulating MAIT cell lineage in healthy subjects is also regularly CD28+, CD127+, CD45RAlow, and CCR7low (18, 23), but exceptions to this phenotype do exist in certain disease states [e.g., chronic HIV (24)], as well as in fetal tissue and cord blood (25, 26). MAIT cells are generally CD8+ (~85%) with the remaining being chiefly DN (CD4–, CD8–), although CD4+ and DP (CD4+, CD8+) groups are frequently observable in scant amounts in healthy donors. The functional differences among these MAIT cell subsets have not been fully clarified, although it has recently been reported that the CD8+ subset possesses somewhat greater effector potential than the DN subset (27).
We identified total MAIT cells as CD3+, Vα7.2+, CD161+, CD45RAlow, CCR7low, CD28+, CD127+ events and also divided them by CD4 and CD8 expression (Figure 1A). With this approach, we observed a sharply reduced frequency of MAIT cells among seroconverted individuals (Figures 1B,D). This reduction extended into all MAIT cell subsets as defined by CD4 and CD8 expression, and appeared most acute within the major compartments identified as CD8+ and DN (Supplemental Figures 2A,B). When evaluating the seroconverted subjects according to disease progression, we found the non-progressors harbored the fewest MAIT cells, while the reduction among the progressors was not significant (Figures 1C,D). These data indicate that a MAIT cell reduction is associated with seroconversion and this effect is slightly ameliorated among those who progress to disease.
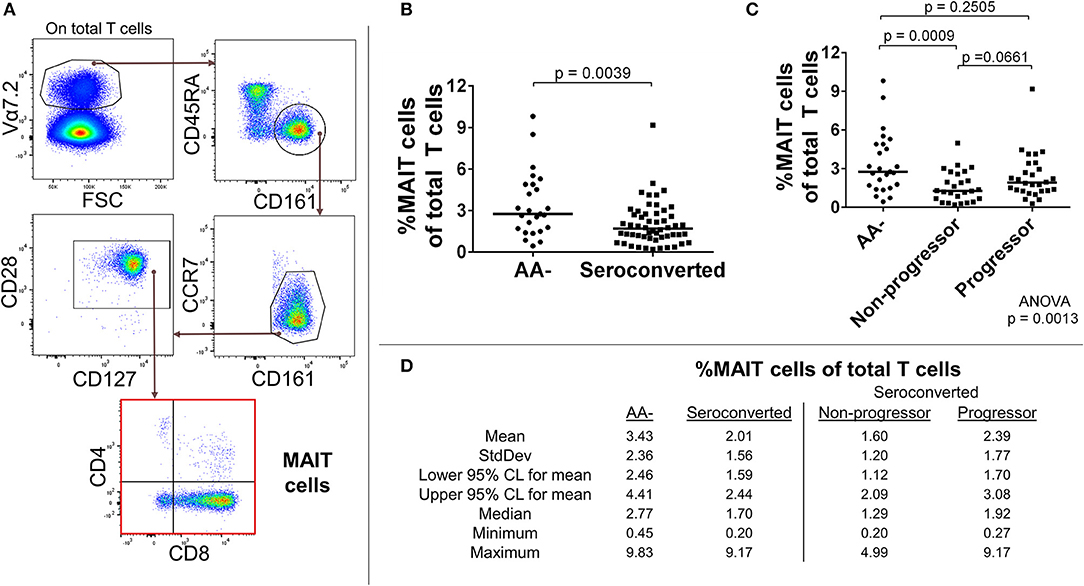
Figure 1. Seroconverted subjects have reduced frequencies of MAIT cells. (A) Starting from total T cells, MAIT cells were identified as Vα7.2+, CD45RA-, CD161+, CCR7dim/−, CD28+, CD127+ events. (B) Seroconverted subjects have reduced frequencies of MAIT cells in comparison to AA– subjects. Reduced frequencies were most acute in the CD8+, CD4– (CD8+), and CD8–, CD4– (DN) compartments (Supplemental Figure 2). (C) Upon dividing seroconverted subjects according to disease progression, we observed that reduced frequencies of MAIT cells were most prominent among non-progressors. (D) Descriptive statistics for the frequency of MAIT cells of total T cells for all groups compared. For figures (B,C), bars represent median. Statistical tests fully described in section Materials and Methods.
Short-Lived Effector-Like CD8 T Cells Are Expanded in Seroconverted Individuals and This Is Most Pronounced Among Those Who Progressed to Disease
Conventional αβ CD8 T cells are the chief cytotoxic arm of adaptive immunity. Upon licensing and activation, CD8 T cells rapidly proliferate in order to destroy microbially-infected or transformed cells (28). Following the eradication of targets, effector cells die off while memory populations remain in tissue and circulation. This memory provides a quick recall response to repeat offenders and is considered a hallmark of T cell immunity. Outside of this role as defenders, CD8 T cells have been incriminated in the pathogenesis of several autoimmune diseases (29).
In our analysis of CD8 T cells, we first divided CD8 T cells according to presence or absence of costimulatory protein CD28. Among the CD28+ CD8 T cells, we removed MAIT cells and analyzed the remaining CD8 T cells for expression levels of CCR4, CXCR5, CD45RA, CD27, CD127, CCR7, and CD57. Similar to what was observed among MAIT cells, seroconverted subjects possessed reduced proportions of CD45RA+, CCR7dim/−, CD57–, CD27+, CD127high, CXCR5–, CCR4– CD8 T cells compared to AA– subjects (Figures 2A,B,D and Supplemental Figure 3). This combination of markers can best be described as a CD45RA+ memory subset following current differentiation paradigms (30, 31). Upon dividing the seroconverted into non-progressor and progressor subsets, we found that the non-progressors were significantly reduced in proportion, while the progressors did not approach significance (Figures 2C,D and Supplemental Figure 3).
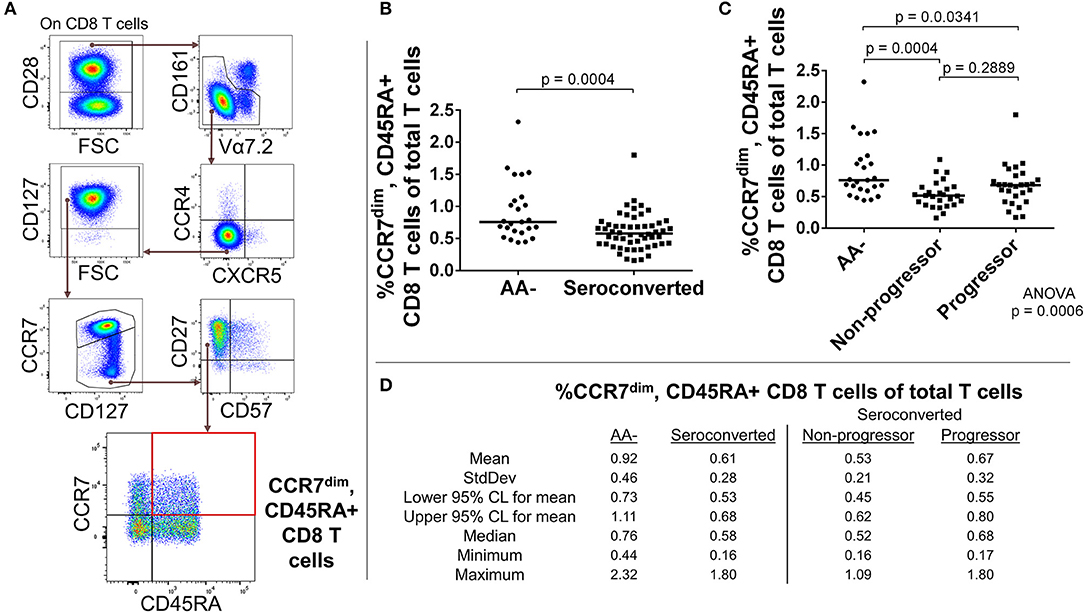
Figure 2. Seroconverted subjects have reduced frequencies of CD45RA+, CCR7dim memory-like CD8 T cells. (A) Starting from total CD8 T cells. CD45RA+, CCR7dim memory-like CD8 T cells were identified as CD28+, MAIT–, CCR4–, CXCR5–, CCR7dim, CD27+, CD57–, and CD45RA+. (B) Seroconverted subjects have reduced frequencies of CD45RA+, CCR7dim memory-like CD8 T cells in comparison to AA- subjects. Reduced frequencies of CD45RA+, CCR7– memory-like CD8 T cells were also observed (Supplemental Figure 3). (C) Upon dividing seroconverted subjects according to disease progression, we observed that reduced frequencies of CD45RA+, CCR7dim memory-like CD8 T cells were most prominent among non-progressors. (D) Descriptive statistics for the frequency of CD45RA+, CCR7dim memory-like CD8 T cells of total T cells for all groups compared. For figures (B,C), bars represent median. Statistical tests fully described in section Materials and Methods.
The absence of CD28 on human T cells is indicative of chronic stimulation (32). We divided CD28- CD8 T cells by expression of CD57, CD127, and CD27 to characterize this antigen-experienced compartment. Our analysis revealed an elevated frequency of CD127–, CD27–, CD57+, CD28– CD8 T cells among seroconverted subjects (Figures 3A,B,D). This combined phenotype indicates terminal differentiation, cytotoxic potential via perforin production, and short-lived status (33–36). Thus, we abbreviated their phenotype as SLEC for short-lived effector-like cells. Intriguingly, this expansion of SLEC was most prominent among progressors (Figures 3C,D), suggesting an acute pathogen response may be associated with disease progression.
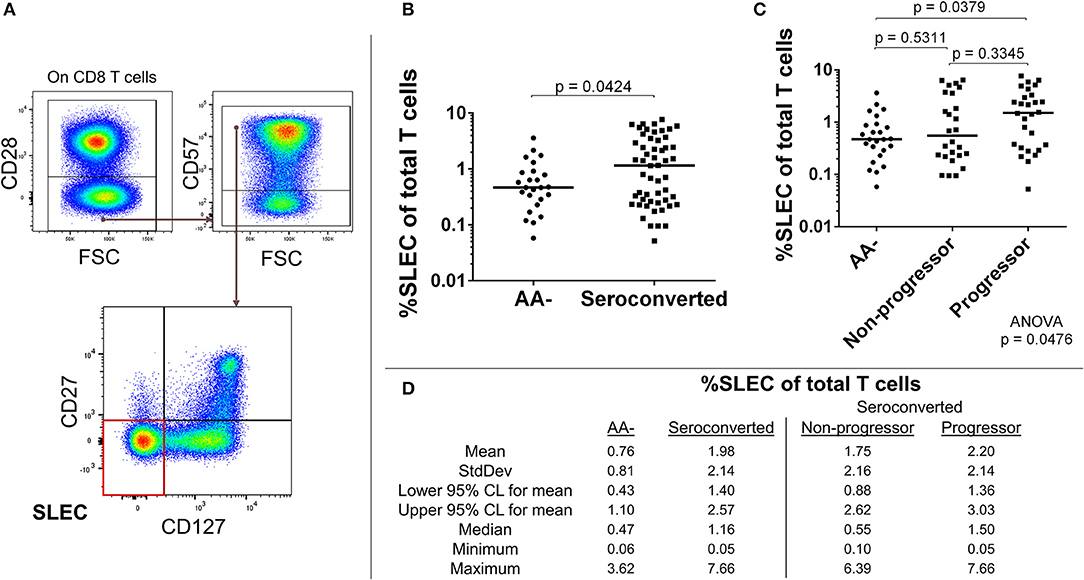
Figure 3. Seroconverted subjects have elevated frequencies of short-lived effector-like cells (SLEC) and this expansion was most prominent among those that progressed to disease. (A) Starting from total CD8 T cells, SLEC were identified as CD28–, CD57+, CD27–, and CD127–. (B) Seroconverted subjects have increased frequencies of SLEC in comparison to AA– subjects. (C) Upon dividing seroconverted subjects according to disease progression, we observed that elevated frequencies of SLEC were most prominent among progressors. (D) Descriptive statistics for frequency of SLEC of total T cells for all groups compared. For figures (B,C), bars represent median. Statistical tests fully described in section Materials and Methods.
CCR4-Expressing CD4 T Cell Subsets, Including CD127dim Treg-Like Cells, Are Reduced in Seroconverted Subjects
C-C chemokine receptor 4 (CCR4) expression among CD4 T cells suggests previous T cell receptor engagement (37, 38) as well as chemotactic responsiveness to thymus and activation-regulated chemokine (TARC), macrophage-derived chemokine (MDC), and chemokine like factor 1 (CKLF1) (39–41). Rather than solely indicating “Th2” status, CCR4– expressing CD4 T cells can be enriched for IFN-γ, IL-22, IL-17, and/or IL-4 production, as well as possess regulatory function (42–46).
Our analysis of CD4 T cells from TrialNet donors revealed reductions in frequency of three CCR4– expressing subsets among seroconverted subjects. Memory (CD127bright, CD27+, CCR7–, CCR4+, CXCR5–; Figures 4A–D), Treg-like (CD127dim, CD27+, CCR7–, CCR4+, CXCR5–; Figures 5A–D), and T follicular helper-like (CCR4+, CXCR5+, CD161–; Supplemental Figure 4) CD4 T cell subsets were all reduced among seroconverted subjects. For each compartment, the reduction in frequency was most profound among non-progressors and approached “normal” levels among progressors.
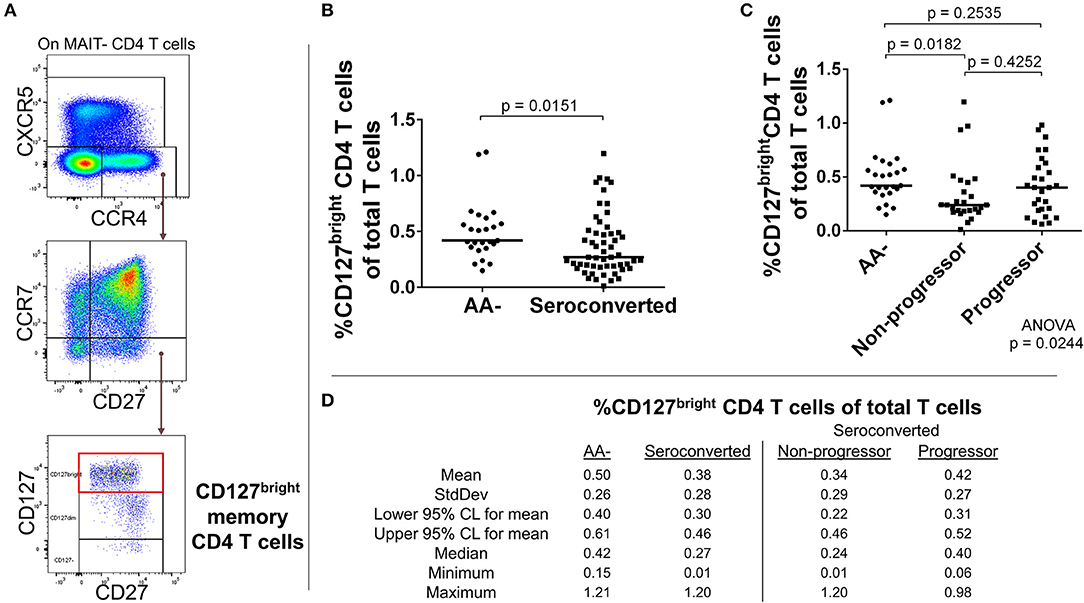
Figure 4. Seroconverted subjects have reduced frequencies of CCR4+, CD127bright memory CD4 T cells. (A) Starting from total MAIT– CD4 T cells, CD127bright memory T cells were identified as CCR4+, CXCR5–, CCR7–, CD27+, CD127bright events. (B) Seroconverted subjects have reduced frequencies of CD127bright memory CD4 T cells in comparison to AA– subjects. CCR4-expressing terminally differentiated and T follicular helper-like CD4 T cells were also reduced in frequency (Supplemental Figure 4). (C) Upon dividing seroconverted subjects according to disease progression, we observed that reduced frequencies of CD127bright memory CD4 T cells were most prominent among non-progressors. (D) Descriptive statistics for the frequency of CD127bright memory CD4 T cells of total T cells for all groups compared. For figures (B,C), bars represent median. Statistical tests fully described in section Materials and Methods.
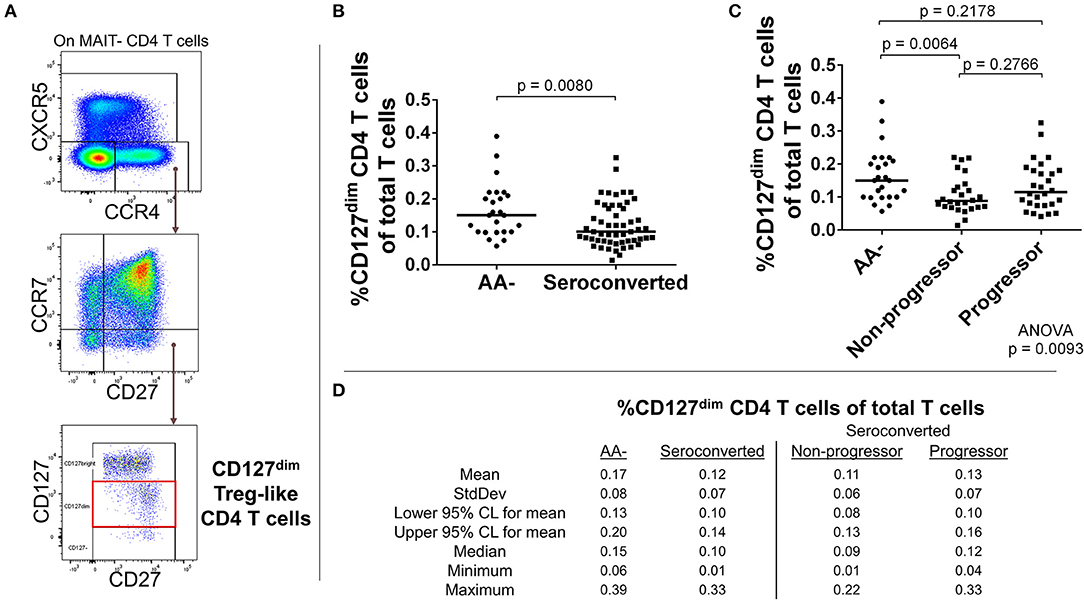
Figure 5. Seroconverted subjects have reduced frequencies of CCR4+, CD127dim Treg-like CD4 T cells. (A) Starting from total MAIT– CD4 T cells, CD127dim Treg-like cells were identified as CCR4+, CXCR5–, CCR7–, CD27+, CD127dim events. (B) Seroconverted subjects have reduced frequencies of CD127dim Treg–like cells in comparison to AA– subjects. (C) Upon dividing seroconverted subjects according to disease progression, we observed that reduced frequencies of CD127dim Treg-like CD4 T cells were most prominent among non-progressors. (D) Descriptive statistics for the frequency of CD127dimTreg-like CD4 T cells of total T cells for all groups compared. For figures (B,C), bars represent median. Statistical tests fully described in materials and methods.
As our T cell panel did not include CD25 nor FOXP3, we were unable to cross-confirm regulatory phenotype among the Treg-like, CCR4-expressing CD4 T cells that we observed contracted among TrialNet samples. However, we analyzed CD4 T cells from 3 healthy human donors and found that the CCR4+, CXCR5– compartment possesses a substantial FOXP3+, CD25+ subset, which is also CD127dim/−, a combined phenotype indicating regulatory potential (Figure 6). This is in agreement with previous studies indicating CCR4+ and CD127dim/low CD4 T cells contain Tregs (47–49). Thus, it's highly likely that the observed Treg-like CCR4+ CD4 T cells we found to be reduced among seroconverted subjects contains T cells with regulatory potential.
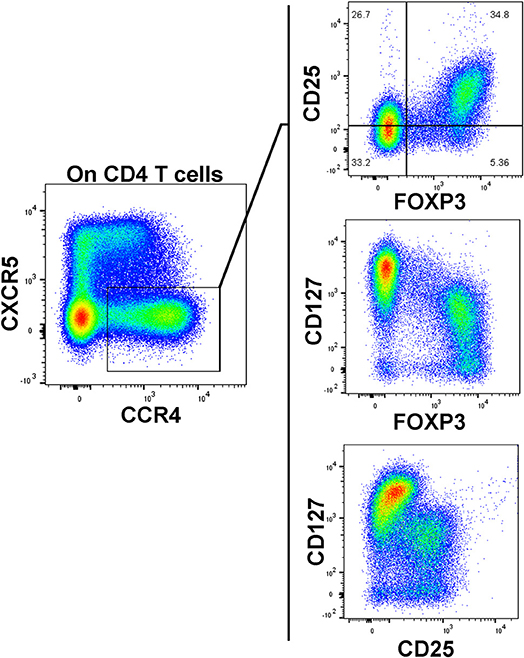
Figure 6. CCR4+, CXCR5– CD127dim CD4 T cells possess a regulatory phenotype. A substantial population of FOXP3+, CD25high events resides in the CXCR5–, CCR4+ subset. These FOXP3+ events generally exhibited low CD127 expression. Data is representative of 3 healthy subjects analyzed.
Frequencies of CD127dim Treg-Like Cells Are Positively Correlated With CD127bright Memory CD4 T Cells, While CD45RA+, CCR7dim Memory CD8 T Cells and SLEC Are Positively Correlated With Islet Autoimmunity
We observed altered frequencies of MAIT, CCR7dim/− CD45RA+ CD8 memory, SLEC, and CCR4+ CD4 T cells, including memory and Treg-like subsets. As mentioned previously, it's widely presumed that T1D is driven by autoreactive CD8 T cells which have escaped tolerance. Since Tregs can effectively suppress T cell proliferation in vitro (50), it's plausible that such subsets may impact T cell expansions and contractions in vivo. Therefore, we examined some of the CD4 and CD8 T cell subsets described above for relationships with our CD127dim Treg-like subset.
First, we compared frequencies of T cell subsets using Spearman's Rank-order correlation. We observed no significant correlations among CD127dim Treg-like CD4 T cells with either MAIT cells, SLEC CD8 T cells or CCR7dim, CD45RA+ CD8 T cells (Figures 7A,C,D). Alternatively, among seroconverted subjects CD127bright memory CD4 T cells were positively and significantly correlated with the frequency of CD127dim Treg-like CD4 T cells, while there was no significant relationship among AA– subjects (Figure 7B). Further division of the seroconverted group into non-progressor and progressor demonstrated similar strong and significant positive correlations among both groups (data not shown). In total, these correlation data suggest that the frequency dynamics of the CD127dim Treg-like cells do not negatively regulate frequencies of the noted T cell compartments in the periphery. However, they do demonstrate comparable and unique dynamics for CD127bright memory CD4 T cells and CD127dim CD4 T cells among only the seroconverted subjects. This could be due to similar effects driving the reductions observed in these two subsets.
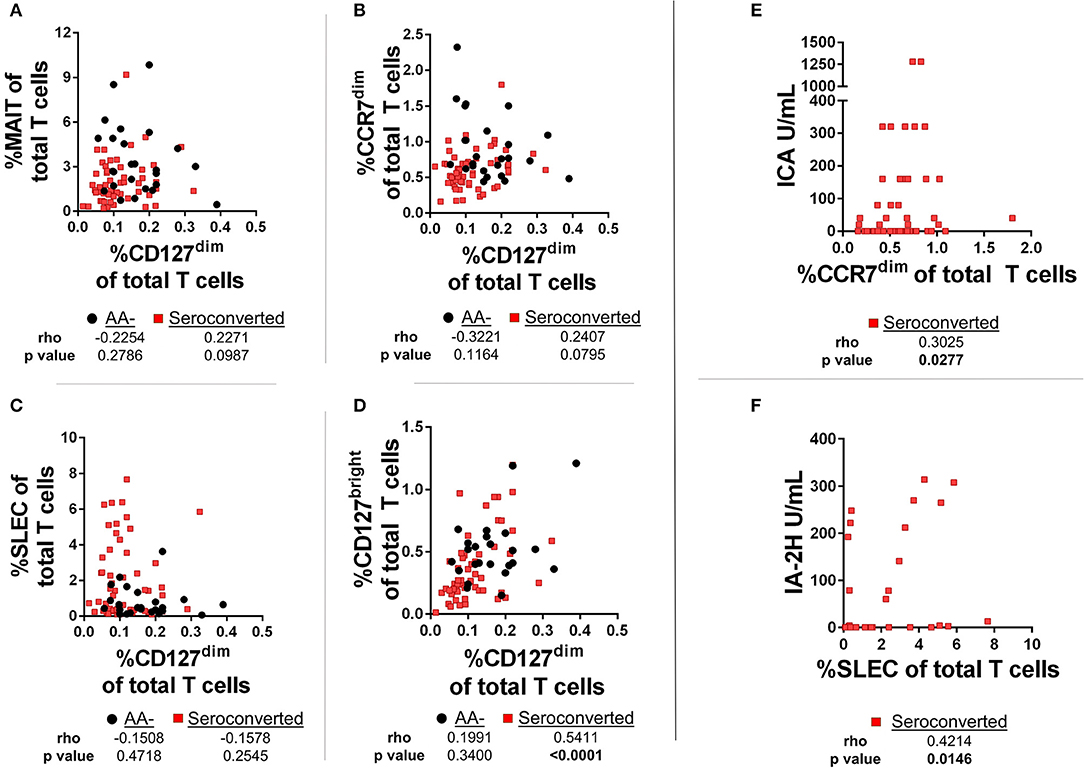
Figure 7. Frequencies of CD127dim Treg-like cells are positively correlated with CD127bright memory CD4 T cells among seroconverted subjects. (A) We observed no significant correlation among frequencies of CD127dim Treg-like cells and MAIT cells. (B) Although not correlated among AA- subjects, frequencies of CD127bright memory and CD127dim Treg-like CD4 T cells were positively and significantly correlated among seroconverted subjects. (C) Frequencies of CD45RA+, CCR7dim memory-like CD8 T cells and CD127dim Treg-like CD4 T cells were not correlated among seroconverted and AA– subjects. (D) Frequencies of SLEC were not correlated with CD127dim Treg-like CD4 T cells in AA– or seroconverted subjects. (E) Frequency of CD45RA+, CCR7dim memory-like CD8 T cells are positively correlated with islet cell antibody (ICA) levels. (F) Frequency of SLEC are positively correlated with harmonized insulinoma antigen 2 (IA-2H) levels. Statistical tests fully described in section Materials and Methods.
In addition to the correlations comparing frequency of T cell subsets, we also examined relationships between autoantibody levels and frequency of T cells. Such a correlation could reveal if any of these subsets are associated with islet immunity. Interestingly, we observed a positive and significant correlation with islet cell antibody (ICA)values and the CCR7dim CD45RA+, CD8 T cell subset (Figure 7E). Furthermore, we found that the SLEC subset was positively and significantly correlated with harmonized insulinoma antigen 2 (IA-2H) levels (Figure 7F). We observed no significant correlations among other T cell subsets with autoantibody levels (data not shown).
Seroconverted Subjects Have Significantly Elevated Ratios of SLEC to Both CD127dim Treg-Like Cells and MAIT Cells
Along with these correlations, we examined ratios of frequency of effectors to frequency of regulators. Here, MAIT cells were hypothesized to function as either effector or regulator, as a recent report has suggested MAIT cells may have a regulatory function (51). We observed that the ratios of SLEC to CD127dim or MAIT cells were significantly elevated among seroconverted, as well as when divided among non-progressors and progressors (Figures 8A,B,G,H). Alternatively, the ratio of MAIT cells to CD127dim was relatively similar when comparing AA- and seroconverted subjects, including progressors and non-progressors (Figures 8C,D). The ratio of CCR7dim CD45RA+ CD8 T cells to CD127dim CD4 T cells was also similar among AA– and seroconverted subjects, and this continued when seroconverted subjects were divided into non-progressors and progressors (Figures 8E,F).
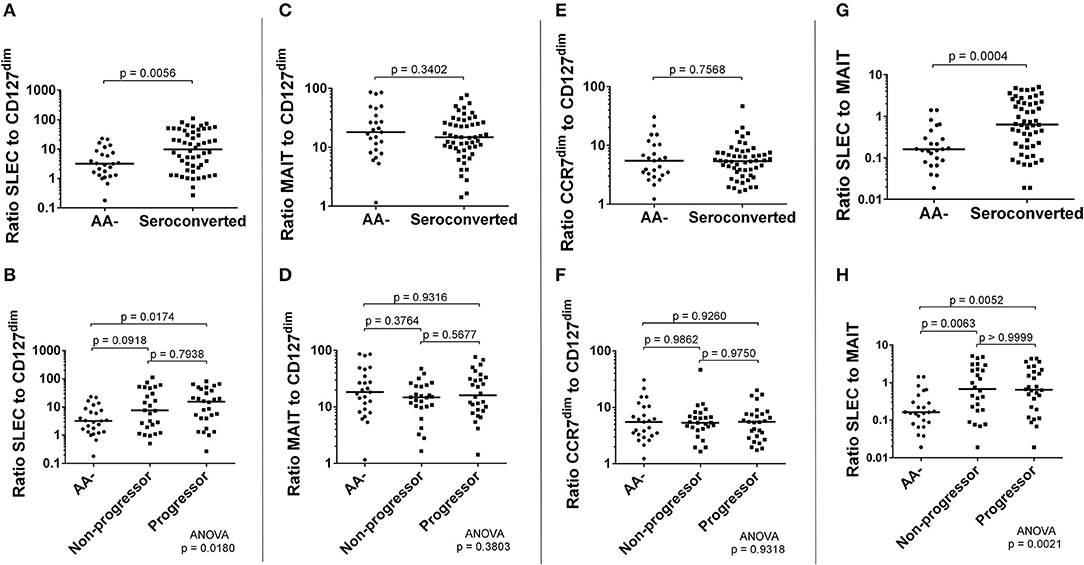
Figure 8. Seroconverted subjects possessed elevated ratios of frequency of SLEC to both frequency of CD127dim Treg-like CD4 cells and frequency of MAIT cells. The ratio of frequency of SLEC to frequency of CD127dim Treg-like cells was significantly elevated among seroconverted subjects (A) and extended into both non-progressors and progressors (B). We observed no difference in ratios of either MAIT cells (C,D) or CD45RA+, CCR7dim memory-like CD8 T cells (E,F) to CD127dim Treg-like CD4 T cells. The ratio of frequency of SLEC to frequency of MAIT cells was significantly elevated among seroconverted subjects (G) and extended into both non-progressors and progressors (H). For all figures, bars represent median. Statistical tests fully described in section Materials and Methods.
SLEC Frequencies Are Strongly Associated With CMV IgG Levels Among Seroconverted Subjects and CMV+ Progressors Harbor the Highest Frequencies of SLEC and Associated Chronically-Activated CD8 T Cells
To determine if viral exposure was influencing the T cell changes associated with seroconversion, we tested plasma for abundance of anti-viral immunoglobulins using ELISA. We then performed correlations comparing T cell frequency with relative abundance of viral immunoglobulins as gauged by optical density values. Neither MAIT cells nor CD127dim Treg-like cells were correlated with abundance of CMV, EBV VCA and enterovirus IgG (Figures 9A,D) nor IgM (data not shown). This was not the case for conventional αβ CD8 T cells. We observed a weak but significant association between EBV VCA IgG and CCR7dim CD45RA+ CD8 T cells (Figure 9B). However, there was no significant association among this subset with CMV IgG or enterovirus IgG (Figure 9B), nor any viral IgM tested (data not shown). Finally, we observed a strong and significant association among SLEC and CMV IgG, but not with EBV VCA IgG, enterovirus IgG, nor any viral IgM tested (Figure 9C and data not shown).
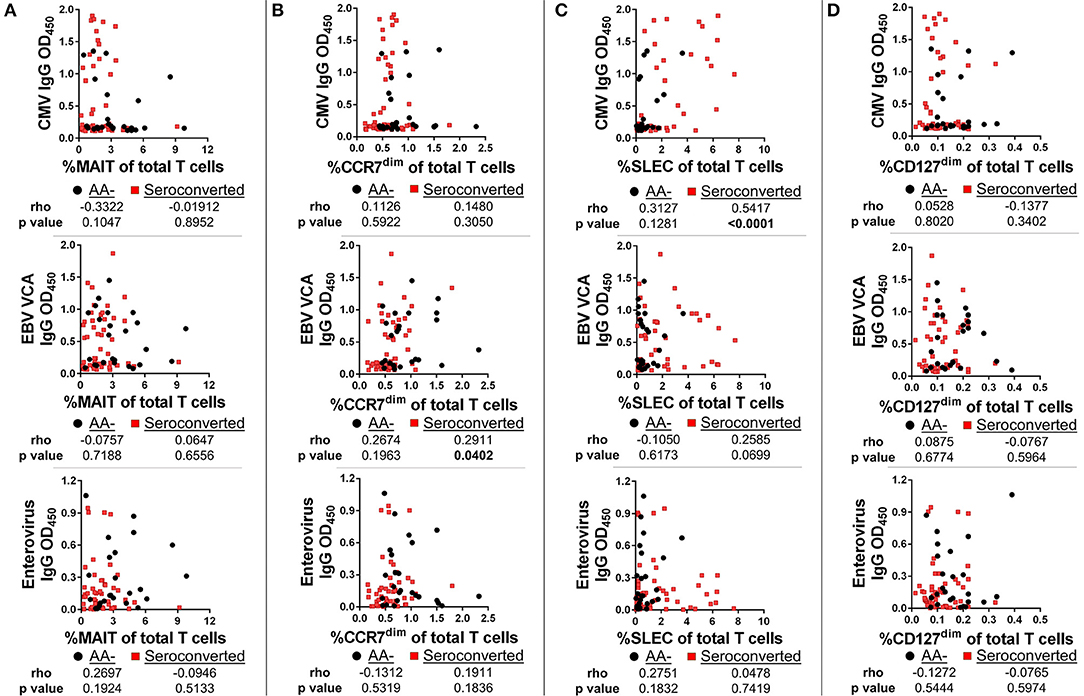
Figure 9. SLEC frequencies are strongly associated with cytomegalovirus IgG levels among seroconverted subjects, but not among controls. We gauged abundance of anti-viral immunoglobulins using ELISA. We then compared frequencies of T cell subsets with IgG abundance. (A) Frequency of MAIT cells was not significantly associated with abundance of cytomegalovirus (CMV) IgG, Epstein-Barr Virus viral capsid antigen (EBV VCA) IgG, or enterovirus IgG among seroconverted subjects and controls. (B) Frequency of CCR7dim, CD45RA+ CD8 T cells was significantly associated with EBV VCA IgG among seroconverted subjects, but not with CMV IgG or enterovirus IgG abundance. (C) Frequency of SLEC was significantly associated with CMV IgG abundance among seroconverted subjects but not among controls. We observed no significant relationship among SLEC with either EBV VCA IgG or enterovirus IgG. (D) CD127dim Treg-like CD4 T cells were not significantly associated with CMV, EBV VCA, or enterovirus IgG abundance. Statistical tests fully described in section Materials and Methods.
Since the SLEC subset appeared to be strongly influenced by CMV, we stratified our subjects according to CMV IgG positivity and then retested the entirety of the CD28– CD8 T cell compartment by ANOVA. We observed that the SLEC expansion is greatest among CMV+ progressors (Figure 10A). Furthermore, we observed that the CMV+ progressors possessed elevated frequencies of additional chronically-stimulated CD28– subsets (Figures 10B–E). While these lacked the expression of CD57, they were heterogeneous for CD127 and CD27 expression. In total, these data reveal a relationship among type 1 diabetes progression, terminally-differentiated effector-like CD8 T cells, and existing cytomegalovirus infection among at-risk, seroconverted subjects.

Figure 10. SLEC and associated chronically-stimulated CD8 T cells are significantly elevated among CMV+ progressors. Subjects were stratified as either positive or negative for CMV IgG (CMV+ or CMV–). We then reanalyzed the CD28– CD8 T cell dataset to check for differences associated with CMV among the AA–, non-progressor (Non-prog), and progressor (Prog) groups. (A) The SLEC expansion was most prominent among CMV+ progressors. We observed additional chronically-stimulated CD8 T cell subsets that were significantly expanded among the CMV+ progressor group: (B) CD127–, CD27+, CD57–, CD28–; (C) CD127–, CD27–, CD57–, CD28–; and (D) CD127+, CD27–, CD57–, CD28–. The gating for the subsets in (B–D) is shown in (E). The CMV–, non-progressor that is colored gray and indicated with an arrow was equivocal for CMV IgG after being tested twice. Bars represent median. Statistical tests fully described in section Materials and Methods.
Discussion
The etiology of type 1 diabetes remains obscure. This is due, in part, to the inaccessibility of the target tissue. Indeed, pancreatic biopsy currently comes with unwanted risk for the donor (52). Analysis of circulating white blood cells as a proxy for solid tissue interrogation allows us to apparently circumvent the problem of pancreas accessibility. Thus, our cross-sectional study was designed to screen multiple T cell subsets from at-risk subjects in order to reveal if immune perturbations are associated with seroconversion and disease progression. To that end, the answer is a clear “yes.” However, this “indirect” analysis is plagued by at least two deficiencies. First, in the absence of a defined causal factor (or set of factors), increases/decreases in frequency of circulating immune cells cannot be explained satisfactorily (53, 54). Second, without follow-up longitudinal analysis of these subjects, such changes in frequency cannot be understood in their dynamic processional roles through time from seroconversion to diagnosis. With these concerns in mind, the following discussion will focus on relevant available reports on comparable immune cell subsets as mere possibilities, as fundamental mechanistic explanations are not available.
Due to their unique function, MAIT cells have been examined in several disease states. Among T1D, the findings are not consistent. We have previously found no change in proportion or number of CD8+ MAIT cells from diabetics in relation to controls (55). Furthermore, we have recently replicated and extended these findings among a second cohort of age-matched juvenile T1Ds and controls (in preparation). Alternatively, Rouxel and colleagues reported reduced frequencies of total MAIT cells to be associated with T1D (51). In the same study, they observed no reduction in proportion of total MAIT cells in their examination of a small cohort of at-risk subjects acquired from TrialNet. Whether these discrepancies result from methodological and/or sampling differences is unclear and independent studies must be conducted for clarification.
Aside from T1D, reductions in circulating MAIT cell populations have been associated with enteric fever (56), several viral infections (57–60), and among other autoimmune diseases and inflammatory disorders such as MS, SLE, RA, and IBD (61–64). Such studies have indicated that MAIT cells are prone to apoptosis in inflammatory milieus, and that reductions in the periphery may co-occur with elevations or reductions in other tissues (57, 62–65). Importantly, type I interferons, perturbed microbiota, viral infection, and increased intestinal permeability have all been associated with the development of T1D (66–69). It remains to be determined if and how these factors impact the MAIT cell lineage and if they are contributing to the deficiencies we have observed.
Along with reduced frequencies of MAIT cells, we observed reductions in several CD4 T cell subsets, which, although phenotypically diverse, all share the expression of CCR4. This is not the first report of CCR4 alterations in T1D. A reduced frequency of CCR4+ CD3+ cells was observed among recently-diagnosed type 1 diabetics (70). Additionally, reduced CCR4 expression following Th1 or Th2 polarization was observed among cord blood T cells from individuals possessing genetic risk alleles for T1D (71). These intriguing results suggest that the CCR4 deficiencies we have observed among seroconverted subjects may have a genetic component and ultimately originate during thymic selection. While our study was neither designed nor powered to explore this question properly, follow-up investigations should be considered highly relevant.
At this point, we cannot define functional roles for the CCR4- expressing subsets we found to be diminished. As described above, there is justification to think that regulatory cells are residing in the CD127dim compartment. Nevertheless, a recent examination of TrialNet samples enquiring into FOXP3 and IL-17-producing CD4 T cells did not report reduced frequencies (72). Due to key methodological differences, it's uncertain how much to extend from this study onto ours. Yet, should we presume that seroconverted subjects are not deficient in regulatory or Th17 cells (both of which are plausible based upon phenotype), we are left with likely Th2 or Th22—type cells. Although relatively unexplored in T1D, Th22-type CD4 T cells have been found in the human gut mucosa (73, 74) and the cytokine IL-22 plays a key role in intestinal defense and integrity (75). Alternatively, the Th2 lineage is generally associated with anti-parasite and allergic responses (76). Interestingly, part of the hygiene hypothesis suggests that the absence of a manageable parasite load is a factor driving increases in the prevalence of autoimmunity (77).
While subset functional status will remain elusive for the time being, the expression of CCR4 clearly indicates responsiveness to MDC, TARC, and CKLF1. Thus, we are currently evaluating plasma from TrialNet subjects for abundance of these and other factors. Importantly, there is some evidence that MDC may play a role in T1D. Elevated MDC transcripts have been found in the duodenal mucosa among T1Ds (78) and MDC can be produced by human islets exposed to a cocktail of inflammatory cytokines (79).
Among conventional CD8 T cells, our screening for T cell aberrations revealed two distinct compartments both associated with islet autoantibody levels. At this point, little can be said regarding the reduced frequency of the CD45RA+, CCR7dim/− CD8 T cell subsets. While their precise characterization indicates central of effector memory-type CD8 T cells, discussions of ontogeny, functionality or specificity of these subsets would be purely speculative and tantamount to hand-waving. Nevertheless, some compelling observations associated with this group do stand out for comment. First, the correlation with ICA levels associates these T cells with beta cell destruction, yet the populations are not expanded among seroconverted subjects and are most reduced among non-progressors. This implies that the “normal” frequencies observed among the progressors could be cryptically pathogenic. Second, the modest association with EBV VCA IgG levels is notable, especially in light of a recent report of a causal role for EBV in autoimmunity (80). Stratification of our subjects according to EBV positivity, as we performed for CMV, did not reveal significant associations with disease progression (data not shown). Therefore, the overall impact of EBV on the development of disease at this point is uncertain.
Fortunately, we can be somewhat more definite in the discussion of the SLEC population, whose phenotype (CD28–, CD57+, CD27–, and CD127–) is indicative of effector status and cytotoxic potential. Furthermore, our data demonstrate that the SLEC subset is strongly associated with CMV IgG levels. Comparable phenotypes have been associated with CMV infection previously (81–87). From our stratifications, we observed that CMV+ progressors possess much higher frequencies of SLEC and related subsets in comparison to CMV+ AA– and non-progressor subjects. This novel observation links a cytotoxic CD8 T cell subset with disease progression and viral exposure. The critical question remaining is what is driving this cellular expansion. An obvious possibility is an acute response to an active CMV infection. To that end, we did not observe CMV IgM positivity among any of the subjects in this study. Nevertheless, we cannot rule out an active viral infection since we were unable to analyze plasma or circulating leukocytes for presence and abundance of viral nucleic acids (88). Such an analysis remains a priority.
In the absence of an active CMV infection, alternate possibilities exist. Following the initial infection, CMV establishes latency and a lifelong residence in the host (89). Over time, reactivation from latency is presumed to drive the expansion of responding CD8 T cells due to chronic antigen exposure (90, 91). In this scenario, the SLEC expansion may represent an exhausted T cell response due to elevated or uncontrolled reactivation of CMV over time. How this could impact beta cells is unknown. Importantly, we observed a positive correlation with IA-2 levels and SLEC frequencies among seroconverted subjects, thereby associating SLEC with beta cell demise and autoimmunity. Whether SLEC could be directly or indirectly responsible for beta cell death remains to be determined. There is in vitro evidence that CMV can infect beta cells (92). However, pancreatitis is not normally associated with CMV infection (93), making the direct lysis of CMV-infected beta cells less likely. Aside from direct infection, an answer could be found in the concept of molecular mimicry. It's been reported the CMV major capsid protein shares 64% identity and 73% similarity to the dominant epitope peptide of IA-2 (94). Through that lens, one could imagine the inflated population we have observed to be a polyclonal pool of effectors, some “autoreactive.” Such an expansion could explain the precipitous decline in beta cells that has been observed in the progression to diagnosed diabetes (95), as well as the negative association among CMV-specific CD8 T cells and c-peptide levels among diagnosed type 1 diabetics (96).
In summary, the combined results of our T cell analysis among seroconverted subjects demonstrate reductions of innate-like, memory and regulatory subsets, with a clear expansion of a SLEC compartment (see Supplemental Figure 5 for an interpretation of some of these phenomena). Intriguingly, while the expansion of the SLEC population is most prominent among the progressors, the remaining subsets appear to approach normal mean levels among those same subjects, albeit somewhat bimodally distributed. The causal foundations of these observations are not available. However, they do suggest that measurable and unique immunological changes occur as one moves toward clinical disease. Thus, assuming that seroconversion indicates a triggering event that led to beta cell destruction, all seroconverted subjects share a common history. Concomitantly, seroconverted subjects also have reduced frequencies of MAIT cells, CCR4+ CD4 T cells, and CD45RA+ memory CD8 T cells. For progressors, the advance of beta cell destruction, which is generally foretold by increasing number of autoantibody specificities, is then also foretold by recurrence to relatively normal abundance of these T cell compartments. If, when, and how these populations contribute to autoimmunity remains to be determined. Nevertheless, weaving through this tapestry is the expanded, CMV-associated SLEC compartment, which is clearly present in progressors as well as some non-progressors. This expansion may then be viewed as a hit-and-run or remitting-and-relapsing response to pathogen and/or autoantigen, theories which have been proposed previously (97, 98).
While the paradigm described above could be considered “counterintuitive,” we are wary of talk of intuition in the absence of data. To that end, future efforts should focus on two complementary directions. One, longitudinal analysis of these subjects must be performed to delineate these population dynamics prior to seroconversion, at seroconversion, and closer toward diagnosis. Two, the characterization of the TCR specificity of the SLEC population, elucidation of the functional status of the CCR4-expressing CD4 T cells, and exploration of the fate of the MAIT cell lineage are essential to explicate how the immune system is responding during beta cell demise. In combination, such an approach should reveal which environmental determinants are driving T1D.
Ethics Statement
The human PBMCs and plasma samples we received from TrialNet were deidentified, thus posing no risk to the donor. TrialNet is responsible for consent and IRB approval at their respective institutions. Information on the study can be found here: https://www.trialnet.org/our-research/risk-screening. The University of Nebraska Medical Center Institutional Review Board (IRB) granted approval for purchase of elutriated lymphocytes from the UNMC elutriation core facility.
Author Contributions
RH: experimental design and execution, data and statistical analysis, wrote manuscript. KL-A and KO: experiment execution. VS: data acquisition. LS: statistical analysis. PG: TrialNet liaison. NS: experimental design.
Funding
This work was supported by grants to NS from NIAD (UO1AI130841, UO1AI102012), the Leona M. and Harry B. Helmsley Charitable Trust (2018PG-T1D048), the Juvenile Diabetes Research Foundation (2-SRA-2016-288-S-B, 1-PNF-2014-165-A-V), and the J. W. Kieckhefer Foundation.
Conflict of Interest Statement
The authors declare that the research was conducted in the absence of any commercial or financial relationships that could be construed as a potential conflict of interest.
Acknowledgments
Samples were obtained from the TrialNet Biorepository through an ancillary study to the TrialNet Pathway to Prevention Study (TN-01) currently funded by NIH grants U01 DK061010, U01 DK061034, U01 DK061042, U01 DK061058, U01 DK085465, U01 DK085461, U01 DK085466, U01 DK085476, U01 DK085499, U01 DK085509, U01 DK103180, U01 DK103153, U01 DK103266, U01 DK103282, U01 DK106984, U01 DK106994, U01 DK107013, U01 DK107014, UC4 DK106993, and the Juvenile Diabetes Research Foundation International (JDRF). The UNMC Flow Cytometry Research Facility is administrated through the Office of the Vice Chancellor for Research and supported by state funds from the Nebraska Research Initiative (NRI) and The Fred and Pamela Buffett Cancer Center's National Cancer Institute Cancer Support Grant. Major instrumentation has been provided by the Office of the Vice Chancellor for Research, The University of Nebraska Foundation, the Nebraska Banker's Fund, and by the NIH-NCRR Shared Instrument Program.
Supplementary Material
The Supplementary Material for this article can be found online at: https://www.frontiersin.org/articles/10.3389/fimmu.2018.02332/full#supplementary-material
References
1. Atkinson MA, Eisenbarth GS, Michels AW. Type 1 diabetes. Lancet (2014) 383:69–82. doi: 10.1016/S0140-6736(13)60591-7
2. Pugliese A. Autoreactive T cells in type 1 diabetes. J Clin Invest. (2017) 127:2881–91. doi: 10.1172/JCI94549
3. Willcox A, Richardson S, Bone A, Foulis A, Morgan N. Analysis of islet inflammation in human type 1 diabetes. Clin Exp Immunol. (2009) 155:173–81. doi: 10.1111/j.1365-2249.2008.03860.x
4. Coppieters K, Dotta F, Amirian N, Campbell PD, Kay TW, Atkinson MA, et al. Demonstration of islet-autoreactive CD8 T cells in insulitic lesions from recent onset and long-term type 1 diabetes patients. J Exp Med. (2012) 209:51–60. doi: 10.1084/jem.20111187
5. Skowera A, Ellis RJ, Varela-Calviño R, Arif S, Huang GC, Van-Krinks C, et al. CTLs are targeted to kill β cells in patients with type 1 diabetes through recognition of a glucose-regulated preproinsulin epitope. J Clin Invest. (2008) 118:3390–402. doi: 10.1172/JCI35449
6. Hull C, Peakman M, Tree TI. Regulatory T cell dysfunction in type 1 diabetes: what's broken and how can we fix it? Diabetologia (2017) 60:1839–50. doi: 10.1007/s00125-017-4377-1
7. Steck A, Johnson K, Barriga KJ, Miao D, Yu L, Hutton JC, et al. Age of islet autoantibody appearance and mean levels of insulin, but not GAD or IA-2 autoantibodies, predict age of diagnosis of type 1 diabetes. Diabetes Care (2011) 34:1397–9. doi: 10.2337/dc10-2088
8. Chen C, Cohrs CM, Stertmann J, Bozsak R, Speier S. Human beta cell mass and function in diabetes: Recent advances in knowledge and technologies to understand disease pathogenesis. Mol Metab. (2017) 6:943–57. doi: 10.1016/j.molmet.2017.06.019
9. Wilcox N, Rui J, Hebrok M, Herold KC. Life and death of β cells in Type 1 diabetes: a comprehensive review. J Autoimmun (2016) 71:51–8. doi: 10.1016/j.jaut.2016.02.001
10. Mayer-Davis E, Lawrence JM, Dabelea D, Divers J, Isom S, Dolan L, et al. Incidence trends of type 1 and type 2 diabetes among youths, 2002–2012. N Engl J Med. (2017) 376:1419–29. doi: 10.1056/NEJMoa1610187
11. Pociot F, Lernmark A. Genetic risk factors for type 1 diabetes. Lancet (2016) 387:2331–9. doi: 10.1016/S0140-6736(16)30582-7
12. Rewers M, Ludvigsson J. Environmental risk factors for type 1 diabetes. Lancet (2016) 387:2340–8. doi: 10.1016/S0140-6736(16)30507-4
13. Rewers M, Gottlieb P. Immunotherapy for the prevention and treatment of type 1 diabetes: human trials and a look into the future. Diabetes Care (2009) 32:1769–82. doi: 10.2337/dc09-0374
14. Battaglia M, Anderson MS, Buckner JH, Geyer SM, Gottlieb PA, Kay TW, et al. (2017). Understanding and preventing type 1 diabetes through the unique working model of TrialNet. Diabetologia 60:2139–47. doi: 10.1007/s00125-017-4384-2
15. Bingley P, Boulware DC, Krischer JP, Type 1 Diabetes TrialNet Study Group. The implications of autoantibodies to a single islet antigen in relatives with normal glucose tolerance: development of other autoantibodies and progression to type 1 diabetes. Diabetologia (2016) 59:542–9. doi: 10.1007/s00125-015-3830-2
16. Vehik K, Beam CA, Mahon JL, Schatz DA, Haller MJ, Sosenko JM, et al. Development of autoantibodies in the TrialNet natural history study. Diabetes Care (2011) 34:1897–901. doi: 10.2337/dc11-0560
17. Harms R, Creer AJ, Lorenzo-Arteaga KM, Ostlund KR, Sarvetnick NE. Interleukin (IL)-18 Binding protein deficiency disrupts natural killer cell maturation and diminishes circulating IL-18. Front Immunol (2017) 8:1020. doi: 10.3389/fimmu.2017.01020
18. Dusseaux M, Martin E, Serriari N, Péguillet I, Premel V, Louis D, et al. Human MAIT cells are xenobiotic-resistant, tissue-targeted, CD161hi IL-17–secreting T cells. Blood (2011) 117:1250–9. doi: 10.1182/blood-2010-08-303339
19. Eckle S, Corbett AJ, Keller AN, Chen Z, Godfrey DI, Liu L, et al. Recognition of vitamin B precursors and byproducts by mucosal associated invariant T cells. J Biol Chem. (2015) 290:30204–11. doi: 10.1074/jbc.R115.685990
20. Kurioka A, Ussher J, Cosgrove C, Clough C, Fergusson J, Smith K, et al. MAIT cells are licensed through granzyme exchange to kill bacterially sensitized targets. Mucosal Immunol. (2015) 8:429. doi: 10.1038/mi.2014.81
21. Le Bourhis L, Dusseaux M, Bohineust A, Bessoles S, Martin E, Premel V, et al. MAIT cells detect and efficiently lyse bacterially-infected epithelial cells. PLoS Pathogens (2013) 9:e1003681. doi: 10.1371/journal.ppat.1003681
22. Reantragoon R, Corbett AJ, Sakala IG, Gherardin NA, Furness JB, Chen Z, et al. Antigen-loaded MR1 tetramers define T cell receptor heterogeneity in mucosal-associated invariant T cells. J Exp Med. (2013) 210:2305–20. doi: 10.1084/jem.20130958
23. Dias J, Leeansyah E, Sandberg JK. Multiple layers of heterogeneity and subset diversity in human MAIT cell responses to distinct microorganisms and to innate cytokines. Proc Natl Acad Sci USA. (2017) 114:E5434–43. doi: 10.1073/pnas.1705759114
24. Leeansyah E, Ganesh A, Quigley MF, Sönnerborg A, Andersson J, Hunt PW, et al. Activation, exhaustion, and persistent decline of the antimicrobial MR1-restricted MAIT-cell population in chronic HIV-1 infection. Blood (2013) 121:1124–35. doi: 10.1182/blood-2012-07-445429
25. Leeansyah E, Loh L, Nixon DF, Sandberg JK. Acquisition of innate-like microbial reactivity in mucosal tissues during human fetal MAIT-cell development. Nat Commun. (2014) 5:3143. doi: 10.1038/ncomms4143
26. Martin E, Treiner E, Duban L, Guerri L, Laude H, Toly C, et al. Stepwise development of MAIT cells in mouse and human. PLoS Biol. (2009) 7:e1000054. doi: 10.1371/journal.pbio.1000054
27. Brozova J, Karlova I, Novák J. Analysis of the phenotype and function of the subpopulations of mucosal-associated invariant T cells. Scand J Immunol. (2016) 84:245–51. doi: 10.1111/sji.12467
28. Zhang N, Bevan MJ. CD8+ T cells: foot soldiers of the immune system. Immunity (2011) 35:161–8. doi: 10.1016/j.immuni.2011.07.010
29. Walter U, Santamaria P. CD8+ T cells in autoimmunity. Curr Opin Immunol. (2005) 17:624–31. doi: 10.1016/j.coi.2005.09.014
30. Inokuma M, Maino VC, Bagwell CB. Probability state modeling of memory CD8+ T-cell differentiation. J Immunol Methods (2013) 397:8–17. doi: 10.1016/j.jim.2013.08.003
31. Mahnke Y, Brodie TM, Sallusto F, Roederer M, Lugli E. The who's who of T-cell differentiation: human memory T-cell subsets. Eur J Immunol. (2013) 43:2797–809. doi: 10.1002/eji.201343751
32. Vallejo AN. CD28 extinction in human T cells: altered functions and the program of T-cell senescence. Immunol Rev. (2005) 205:158–69. doi: 10.1111/j.0105-2896.2005.00256.x
33. Borthwick N, Lowdell M, Salmon M, Akbar AN. Loss of CD28 expression on CD8+ T cells is induced by IL-2 receptor γ chain signalling cytokines and type I IFN, and increases susceptibility to activation-induced apoptosis. Int Immunol. (2000) 12:1005–13. doi: 10.1093/intimm/12.7.1005
34. Cellerai C, Perreau M, Rozot V, Enders FB, Pantaleo G, Harari A. Proliferation capacity and cytotoxic activity are mediated by functionally and phenotypically distinct virus-specific CD8 T cells defined by interleukin-7Rα (CD127) and perforin expression. J Virol. (2010) 84:3868–78. doi: 10.1128/JVI.02565-09
35. Chattopadhyay P, Betts MR, Price DA, Gostick E, Horton H, Roederer M, et al. The cytolytic enzymes granyzme A, granzyme B, and perforin: expression patterns, cell distribution, and their relationship to cell maturity and bright CD57 expression. J Leukocyte Biol. (2009) 85:88–97. doi: 10.1189/jlb.0208107
36. Tomiyama H, Matsuda T, Takiguchi M. Differentiation of human CD8+ T cells from a memory to memory/effector phenotype. J Immunol. (2002) 168:5538–50. doi: 10.4049/jimmunol.168.11.5538
37. Singh S, de Camargo MM, Zhang HH, Foley JF, Hedrick MN, Farber JM. Changes in histone acetylation and methylation that are important for persistent but not transient expression of CCR4 in human CD4+ T cells. Eur J Immunol. (2010) 40:3183–97. doi: 10.1002/eji.201040443
38. Song K, Rabin RL, Hill BJ, De Rosa SC, Perfetto SP, Zhang HH, et al. Characterization of subsets of CD4+ memory T cells reveals early branched pathways of T cell differentiation in humans. Proc Natl Acad Sci USA. (2005) 102:7916–21. doi: 10.1073/pnas.040972010
39. Imai T, Baba M, Nishimura M, Kakizaki M, Takagi S, Yoshie O. The T cell-directed CC chemokine TARC is a highly specific biological ligand for CC chemokine receptor 4. J Biol Chem. (1997) 272:15036–42. doi: 10.1074/jbc.272.23.15036
40. Imai T, Chantry D, Raport CJ, Wood CL, Nishimura M, Godiska R, et al. Macrophage-derived chemokine is a functional ligand for the CC chemokine receptor 4. J Biol Chem. (1998) 273:1764–8. doi: 10.1074/jbc.273.3.1764
41. Wang Y, Zhang Y, Yang X, Han W, Liu Y, Xu Q, et al. Chemokine-like factor 1 is a functional ligand for CC chemokine receptor 4 (CCR4). Life Sci. (2006) 78:614–21. doi: 10.1016/j.lfs.2005.05.070
42. Acosta-Rodriguez E, Rivino L, Geginat J, Jarrossay D, Gattorno M, Lanzavecchia A, et al. Surface phenotype and antigenic specificity of human interleukin 17-producing T helper memory cells. Nat Immunol. (2007) 8:639. doi: 10.1038/ni1467
43. Baatar D, Olkhanud P, Sumitomo K, Taub D, Gress R, Biragyn A. Human peripheral blood T regulatory cells (Tregs), functionally primed CCR4+ Tregs and unprimed CCR4- Tregs, regulate effector T cells using FasL. J Immunol. (2007) 178:4891–900. doi: 10.4049/jimmunol.178.8.4891
44. Duhen T, Geiger R, Jarrossay D, Lanzavecchia A, Sallusto F. Production of interleukin 22 but not interleukin 17 by a subset of human skin-homing memory T cells. Nat Immunol. (2009) 10:857. doi: 10.1038/ni.1767
45. Kim C, Rott L, Kunkel EJ, Genovese MC, Andrew DP, Wu L, et al. Rules of chemokine receptor association with T cell polarization in vivo. J Clin Invest. (2001) 108:1331. doi: 10.1172/JCI13543
46. Nanki T, Lipsky PE. Lack of correlation between chemokine receptor and Th1/Th2 cytokine expression by individual memory T cells. Int Immunol. (2000) 12:1659–67. doi: 10.1093/intimm/12.12.1659
47. Klein S, Kretz CC, Krammer PH, Kuhn A. CD127 low/-and FoxP3+ expression levels characterize different regulatory T-cell populations in human peripheral blood. J Invest Dermatol. (2010) 130:492–9. doi: 10.1038/jid.2009.313
48. Liu W, Putnam AL, Xu-Yu Z, Szot GL, Lee MR, Zhu S, et al. CD127 expression inversely correlates with FoxP3 and suppressive function of human CD4+ T reg cells. J Exp Med. (2006) 203:1701–11. doi: 10.1084/jem.20060772
49. Sugiyama D, Nishikawa H, Maeda Y, Nishioka M, Tanemura A, Katayama I, et al. Anti-CCR4 mAb selectively depletes effector-type FoxP3+ CD4+ regulatory T cells, evoking antitumor immune responses in humans. Proc Natl. Acad Sci USA. (2013) 110:17945–50. doi: 10.1073/pnas.1316796110
50. Putnam A, Brusko TM, Lee MR, Liu W, Szot GL, Ghosh T, et al. Expansion of human regulatory T-cells from patients with type 1 diabetes. Diabetes (2009) 58:652–62. doi: 10.2337/db08-1168
51. Rouxel O, Beaudoin L, Nel I, Tard C, Cagninacci L, Kiaf B, et al. Cytotoxic and regulatory roles of mucosal-associated invariant T cells in type 1 diabetes. Nat Immunol. (2017) 18:1321. doi: 10.1038/ni.3854
52. Krogvold L, Edwin B, Buanes T, Ludvigsson J, Korsgren O, Hyöty H, Frisk G, et al. Pancreatic biopsy by minimal tail resection in live adult patients at the onset of type 1 diabetes: experiences from the DiViD study. Diabetologia (2014) 57:841–3. doi: 10.1007/s00125-013-3155-y
53. Blum K, Pabst R. Lymphocyte numbers and subsets in the human blood: do they mirror the situation in all organs? Immunol Lett. (2007) 108:45–51. doi: 10.1016/j.imlet.2006.10.009
54. Westermann J, Pabst R. Lymphocyte subsets in the blood: a diagnostic window on the lymphoid system? Immunol Today (1990) 11:406–10. doi: 10.1016/0167-5699(90)90160-B
55. Harms R, Lorenzo KM, Corley KP, Cabrera MS, Sarvetnick NE. Altered CD161bright CD8+ mucosal associated invariant T (MAIT)-like cell dynamics and increased differentiation states among juvenile type 1 diabetics. PLoS ONE (2015) 10:e0117335. doi: 10.1371/journal.pone.0117335
56. Howson L, Napolitani G, Shepherd D, Ghadbane H, Kurupati P, Preciado-Llanes L, et al. MAIT cell clonal expansion and TCR repertoire shaping in human volunteers challenged with Salmonella Paratyphi A. Nat Commun. (2018) 9:253. doi: 10.1038/s41467-017-02540-x
57. Cosgrove C, Ussher JE, Rauch A, Gärtner K, Kurioka A, Hühn MH, et al. Early and nonreversible decrease of CD161++/MAIT cells in HIV infection. Blood (2013) 121:951–61. doi: 10.1182/blood-2012-06-436436
58. Loh L, Wang Z, Sant S, Koutsakos M, Jegaskanda S, Corbett AJ, et al. Human mucosal-associated invariant T cells contribute to antiviral influenza immunity via IL-18–dependent activation. Proc Natl. Acad Sci USA. (2016) 113:10133–8. doi: 10.1073/pnas.1610750113
59. Paquin-Proulx D, Greenspun BC, Costa EA, Segurado AC, Kallas EG, Nixon DF, et al. MAIT cells are reduced in frequency and functionally impaired in human T lymphotropic virus type 1 infection: potential clinical implications. PLoS ONE (2017) 12:e0175345. doi: 10.1371/journal.pone.0175345
60. Van Wilgenburg B, Scherwitzl I, Hutchinson EC, Leng T, Kurioka A, Kulicke C, et al. MAIT cells are activated during human viral infections. Nat Commun. (2016) 7:11653. doi: 10.1038/ncomms11653
61. Cho YN, Kee SJ, Kim TJ, Jin HM, Kim MJ, Jung HJ, et al. Mucosal-associated invariant T cell deficiency in systemic lupus erythematosus. J Immunol. (2014) 193:3891–901. doi: 10.4049/jimmunol.1302701
62. Hiejima E, Kawai T, Nakase H, Tsuruyama T, Morimoto T, Yasumi T, et al. Reduced numbers and proapoptotic features of mucosal-associated invariant T cells as a characteristic finding in patients with inflammatory bowel disease. Inflamm Bowel Dis. (2015) 21:1529–40. doi: 10.1097/MIB.0000000000000397
63. Kim M, Yoo SJ, Kang SW, Kwon J, Choi I, Lee CH. TNFα and IL-1β in the synovial fluid facilitate mucosal-associated invariant T (MAIT) cell migration. Cytokine (2017) 99:91–8. doi: 10.1016/j.cyto.2017.07.007
64. Willing A, Leach OA, Ufer F, Attfield KE, Steinbach K, Kursawe N, et al. CD8+ MAIT cells infiltrate into the CNS and alterations in their blood frequencies correlate with IL-18 serum levels in multiple sclerosis. Eur J Immunol. (2014) 44:3119–28. doi: 10.1002/eji.201344160
65. Dunne M, Elliott L, Hussey S, Mahmud N, Kelly J, Doherty DG, et al. Persistent changes in circulating and intestinal γδ T cell subsets, invariant natural killer T cells and mucosal-associated invariant T cells in children and adults with coeliac disease. PLoS ONE (2013) 8:e76008. doi: 10.1371/journal.pone.0076008
66. Bosi E, Molteni L, Radaelli M, Folini L, Fermo I, Bazzigaluppi E, et al. Increased intestinal permeability precedes clinical onset of type 1 diabetes. Diabetologia (2006) 49:2824–7. doi: 10.1007/s00125-006-0465-3
67. Ferreira R, Guo H, Coulson RM, Smyth DJ, Pekalski ML, Burren OS, et al. A type I interferon transcriptional signature precedes autoimmunity in children genetically at-risk of type 1 diabetes. Diabetes (2014) 63:2538–50. doi: 10.2337/db13-1777
68. Kostic A, Gevers D, Siljander H, Vatanen T, Hyötyläinen T, Hämäläinen AM, et al. The dynamics of the human infant gut microbiome in development and in progression toward type 1 diabetes. Cell Host Microbe (2015) 17:260–73. doi: 10.1016/j.chom.2015.01.001
69. Krogvold L, Edwin B, Buanes T, Frisk G, Skog O, Anagandula M, et al. Detection of a low-grade enteroviral infection in the islets of Langerhans of living patients newly diagnosed with type 1 diabetes. Diabetes (2014) 64:1682–7. doi: 10.2337/db14-1370
70. Lohmann T, Laue S, Nietzschmann U, Kapellen T, Lehmann I, Schroeder S, et al. Reduced expression of Th1-associated chemokine receptors on peripheral blood lymphocytes at diagnosis of type 1 diabetes. Diabetes (2002) 51:2474–80. doi: 10.2337/diabetes.51.8.2474
71. Luopajärvi K, Skarsvik S, Ilonen J, Åkerblom HK, Vaarala O. Reduced CCR4, interleukin-13 and GATA-3 up-regulation in response to type 2 cytokines of cord blood T lymphocytes in infants at genetic risk of type 1 diabetes. Immunology (2007) 121:189–96. doi: 10.1111/j.1365-2567.2007.02557.x
72. Marwaha A, Panagiotopoulos C, Biggs C, Staiger S, Del Bel K, Hirschfeld A, et al. Pre-diagnostic genotyping identifies T1D subjects with impaired Treg IL-2 signaling and an elevated proportion of FOXP3+ IL-17+ cells. Genes Immun. (2017) 18:15. doi: 10.1038/gene.2016.44
73. Fernandes S, Pires AR, Ferreira C, Foxall RB, Rino J, Santos C, et al. Enteric mucosa integrity in the presence of a preserved innate interleukin 22 compartment in HIV type 1–treated individuals. J infect Dis. (2014) 210:630–40. doi: 10.1093/infdis/jiu126
74. Kim C, Nazli A, Rojas O, Chege D, Alidina Z, Huibner S, et al. A role for mucosal IL-22 production and Th22 cells in HIV-associated mucosal immunopathogenesis. Mucos Immunol. (2012) 5:670. doi: 10.1038/mi.2012.72
75. Sonnenberg G, Fouser LA, Artis D. Functional biology of the IL-22-IL-22R pathway in regulating immunity and inflammation at barrier surfaces. In: Fagarasan S, Cerutti A, editors. Advances in Immunology, Vol. 107. San Diego, CA: Elsevier (2010). p. 1–29. doi: 10.1016/B978-0-12-381300-8.00001-0
76. Harris NL, Loke P. Recent advances in type-2-cell-mediated immunity: insights from helminth infection. Immunity (2017) 47:1024–36. doi: 10.1016/j.immuni.2017.11.015
77. Rook GA. Hygiene hypothesis and autoimmune diseases. Clin Rev Allergy Immunol. (2012) 42:5–15. doi: 10.1007/s12016-011-8285-8
78. Pellegrini S, Sordi V, Bolla AM, Saita D, Ferrarese R, Canducci F, et al. Duodenal mucosa of patients with type 1 diabetes shows distinctive inflammatory profile and microbiota. J Clin Endocrinol Metab. (2017) 102:1468–77. doi: 10.1210/jc.2016-3222
79. Sarkar S, Lee CE, Victorino F, Nguyen TT, Walters JA, Burrack A, et al. Expression and regulation of chemokines in murine and human type 1 diabetes. Diabetes (2012) 61:436–46. doi: 10.2337/db11-0853
80. Harley J, Chen X, Pujato M, Miller D, Maddox A, Forney C, et al. Transcription factors operate across disease loci, with EBNA2 implicated in autoimmunity. Nat Genet. (2018) 50:699. doi: 10.1038/s41588-018-0102-3
81. Appay V, Dunbar PR, Callan M, Klenerman P, Gillespie GM, Papagno L, et al. Memory CD8+ T cells vary in differentiation phenotype in different persistent virus infections. Nat Med. (2002) 8:379. doi: 10.1038/nm0402-379
82. Boutboul F, Puthier D, Appay V, Pellé O, Ait-Mohand H, Combadière B, et al. Modulation of interleukin-7 receptor expression characterizes differentiation of CD8 T cells specific for HIV, EBV and CMV. Aids (2005) 19:1981–6. doi: 10.1097/01.aids.0000191919.24185.46
83. Hoji A, Connolly NC, Buchanan WG, Rinaldo CR. CD27 and CD57 expression reveals atypical differentiation of human immunodeficiency virus type 1-specific memory CD8+ T cells. Clin Vaccine Immunol. (2007) 14:74–80. doi: 10.1128/CVI.00250-06
84. Jensen S, Tingstedt JL, Larsen TK, Brandt L, Gerstoft J, Kronborg G, et al. HIV-specific CD8+ T cell–mediated viral suppression correlates with the expression of CD57. J Acquir Immune Def Syndromes (2016) 71:8–16. doi: 10.1097/QAI.0000000000000837
85. Paiardini M, Cervasi B, Albrecht H, Muthukumar A, Dunham R, Gordon S, et al. Loss of CD127 expression defines an expansion of effector CD8+ T cells in HIV-infected individuals. J Immunol. (2005) 174:2900–9. doi: 10.4049/jimmunol.174.5.2900
86. Raeiszadeh M, Kopycinski J, Paston S, Diss T, Lowdell M, Hardy G, et al. The T cell response to persistent herpes virus infections in common variable immunodeficiency. Clin Exp Immunol. (2006) 146:234–42. doi: 10.1111/j.1365-2249.2006.03209.x
87. Weekes M, Wills M, Mynard K, Hicks R, Sissons J, Carmichael A. Large clonal expansions of human virus-specific memory cytotoxic T lymphocytes within the CD57+ CD28–CD8+ T-cell population. Immunology (1999) 98:443–49. doi: 10.1046/j.1365-2567.1999.00901.x
88. A Ross S, Novak Z, Pati S, Boppana SB. Overview of the diagnosis of cytomegalovirus infection. Infect Disord Drug Targets (2011) 11:466–74. doi: 10.2174/187152611797636703
89. Sinclair J. Human cytomegalovirus: Latency and reactivation in the myeloid lineage. J Clin Virol. (2008) 41:180–5. doi: 10.1016/j.jcv.2007.11.014
90. Komatsu H, Inui A, Sogo T, Fujisawa T, Nagasaka H, Nonoyama S, et al. Large scale analysis of pediatric antiviral CD8+ T cell populations reveals sustained, functional and mature responses. ImmunAgeing (2006) 3:11. doi: 10.1186/1742-4933-3-11
91. Lee S, Sinclair E, Hatano H, Hsue PY, Epling L, Hecht FM, et al. Impact of HIV on CD8+ T cell CD57 expression is distinct from that of CMV and aging. PLoS ONE (2014) 9:e89444. doi: 10.1371/journal.pone.0089444
92. Smelt M, Faas MM, de Haan BJ, Draijer C, Hugenholtz GC, de Haan A, et al. Susceptibility of human pancreatic β cells for cytomegalovirus infection and the effects on cellular immunogenicity. Pancreas (2012) 41:39–49. doi: 10.1097/MPA.0b013e31821fc90c
93. Wreghitt T, Teare E, Sule O, Devi R, Rice P. Cytomegalovirus infection in immunocompetent patients. Clin Infect Dis. (2003) 37:1603–6. doi: 10.1086/379711
94. Honeyman M, Stone NL, Harrison L. T-cell epitopes in type 1 diabetes autoantigen tyrosine phosphatase IA-2: potential for mimicry with rotavirus and other environmental agents. Mol Med. (1998) 4:231. doi: 10.1007/BF03401920
95. Herold K, Usmani-Brown S, Ghazi T, Lebastchi J, Beam CA, Bellin MD, et al. β cell death and dysfunction during type 1 diabetes development in at-risk individuals. J Clin Invest. (2015) 125:1163–73. doi: 10.1172/JCI78142
96. Yeo L, Woodwyk A, Sood S, Lorenc A, Eichmann M, Pujol-Autonell I, et al. Autoreactive T effector memory differentiation mirrors β cell function in type 1 diabetes. J Clin Invest. (2018) 128:3460–74. doi: 10.1172/JCI120555
97. Oldstone MB. Molecular mimicry and immune-mediated diseases. FASEB J. (1998) 12:1255–65. doi: 10.1096/fasebj.12.13.1255
Keywords: type 1 diabetes (T1D), mucosal associated invariant T cells (MAIT), CD4 T cells, CD8 T cells, TrialNet, autoimmunity, T regulatory cells (Treg), cytomegalovirus—HCMV
Citation: Harms RZ, Lorenzo-Arteaga KM, Ostlund KR, Smith VB, Smith LM, Gottlieb P and Sarvetnick N (2018) Abnormal T Cell Frequencies, Including Cytomegalovirus-Associated Expansions, Distinguish Seroconverted Subjects at Risk for Type 1 Diabetes. Front. Immunol. 9:2332. doi: 10.3389/fimmu.2018.02332
Received: 09 August 2018; Accepted: 19 September 2018;
Published: 22 October 2018.
Edited by:
Hideki Ueno, Icahn School of Medicine at Mount Sinai, United StatesReviewed by:
Andras Perl, Upstate Medical University, United StatesShiv Pillai, Harvard Medical School, United States
Copyright © 2018 Harms, Lorenzo-Arteaga, Ostlund, Smith, Smith, Gottlieb and Sarvetnick. This is an open-access article distributed under the terms of the Creative Commons Attribution License (CC BY). The use, distribution or reproduction in other forums is permitted, provided the original author(s) and the copyright owner(s) are credited and that the original publication in this journal is cited, in accordance with accepted academic practice. No use, distribution or reproduction is permitted which does not comply with these terms.
*Correspondence: Robert Z. Harms, cmhhcm1zQHVubWMuZWR1
Nora Sarvetnick, bm9yYXNAdW5tYy5lZHU=