 Anja Strehlitz
 Oliver Goldmann
 Marina C. Pils
 Frank Pessler
 Eva Medina
- 1Infection Immunology Research Group, Helmholtz Centre for Infection Research, Braunschweig, Germany
- 2Mouse Pathology, Helmholtz Centre for Infection Research, Braunschweig, Germany
- 3Institute for Experimental Infection Research, TWINCORE Center for Experimental and Clinical Infection Research, Hannover, Germany
Streptococcus pneumoniae is the most common cause of community-acquired pneumonia (CAP). Despite the low prevalence of CAP caused by methicillin-resistant Staphylococcus aureus (MRSA), CAP patients often receive empirical antibiotic therapy providing coverage for MRSA such as vancomycin or linezolid. An early differentiation between S. pneumoniae and S. aureus pneumonia can help to reduce the use of unnecessary antibiotics. The objective of this study was to identify candidate biomarkers that can discriminate pneumococcal from staphylococcal pneumonia. A genome-wide transcriptional analysis of lung and peripheral blood performed in murine models of S. pneumoniae and S. aureus lung infection identified an interferon signature specifically associated with S. pneumoniae infection. Prediction models built using a support vector machine and Monte Carlo cross-validation, identified the combination of the interferon-induced chemokines CXCL9 and CXCL10 serum concentrations as the set of biomarkers with best sensitivity, specificity, and predictive power that enabled an accurate discrimination between S. pneumoniae and S. aureus pneumonia. The predictive performance of these biomarkers was further validated in an independent cohort of mice. This study highlights the potential of serum CXCL9 and CXCL10 biomarkers as an adjunctive diagnostic tool that could facilitate prompt and correct pathogen-targeted therapy in CAP patients.
Introduction
Community-acquired pneumonia (CAP) remains a leading cause of morbidity and mortality in both industrialized and developing countries (1). Prompt identification of the causative pathogen and accurate antimicrobial therapy are critical for a favorable outcome (2, 3). However, establishing a microbial diagnosis for patients with pneumonia is still challenging and, despite the rapid development of molecular diagnostic techniques, the causative agent remains unidentified in approximately 50% of CAP patients (4).
Although Streptococcus pneumoniae is the most common pathogen causing CAP (5), a wide array of pathogens including viruses can also cause pneumonia (6, 7). In recent years, several studies have reported the occurrence of very severe CAP cases caused by methicillin-resistant Staphylococcus aureus (MRSA) (8–10). Because the clinical symptoms of S. pneumoniae and S. aureus CAP are similar if not identical (11, 12), empiric treatment regimens providing coverage for MRSA such as vancomycin or linezolid are frequently used for CAP patients until a microbiological diagnosis is available (12). This results in the overuse of these antibiotics, which is unfortunate in the light of the current crisis in antibiotic resistance. For this reason, de-escalation of antibiotic therapy from broad-spectrum empiric coverage to narrower spectrum pathogen-targeted therapy has been proposed (13, 14). Key to the success of this approach is the prompt and correct identification of the CAP causative organism.
The gold standard in conventional microbial diagnosis in CAP patients primarily relies on the quantification of microorganisms in culture of respiratory specimens such as sputum, tracheal aspiration, or broncho-alveolar lavage (15). These conventional methods are not only time consuming (48–72 h) but also the low yield is often insufficient for etiological diagnosis and the results can be influenced by previous antibiotic uptake (16). Although new molecular methods such as detection of S. pneumoniae antigens in urine (17, 18) and PCR-based assays (19) have been developed, detection of pneumococcal proteins or DNA in CAP patients does not necessarily indicate that this pathogen is the causative organism since S. pneumoniae is often carried asymptomatically in the nasopharynx of children and adults (20). Consequently, more accurate diagnostic tools are needed to improve the management of CAP patients that can facilitate pathogen-specific antimicrobial therapy rather than empiric selection of antimicrobial agents with broader spectrum. In this regard, host biomarkers have been proposed as promising tools for diagnosis of CAP (21). The use of biomarkers comprising well-characterized sets of indicators, identified with proteomic, transcriptomic, or metabolomic methods, has been envisaged as an innovative approach to achieve a rapid diagnosis and etiology for several infections including pneumonia (22–25).
The objective of this study was to identify novel candidate host biomarkers to discriminate between S. pneumoniae and S. aureus pneumonia. We used for this purpose experimental murine models of bacterial pneumonia because they share many clinical and pathophysiological features with human disease. The results of this study have identified the combination of CXCL9 and CXCL10 serum levels as accurate biomarkers to discriminate between S. pneumoniae and S. aureus pneumonia. These biomarkers can be used in combination with molecular detection for achieving a more accurate etiologic diagnosis of CAP.
Materials and Methods
Bacterial Strains
The S. pneumoniae strain TIGR4 of the serotype 4 (26) was grown at 37°C in Todd-Hewitt broth supplemented with 1% (w/v) yeast extract and 1% of heat-inactivated fetal calf serum and the MRSA strain USA300 (27) as well as the strain 6850 (ATCC 53657) was grown overnight at 37°C in Tryptic Soy broth. Bacteria were grown to mid-log phase, washed and diluted to the required concentration.
Mice and Infection Model
Specific-pathogen-free 10- to 12-weeks-old BALB/c and C57BL/6 mice were purchased from Envigo (Horst, Netherlands). The transgenic IFN-β-luciferase reporter mice (Δβ-luc) (28) were bred at the animal facility of the Helmholtz Centre for Infection Research, Braunschweig. For intranasal infection, mice were anesthetized by intraperitoneal injection with ketamine-xylazine solution and inoculated intranasally with either 5 × 10⁷ CFU of S. pneumoniae TIGR4 or 5 × 10⁸ CFU of S. aureus both in 20 µl of PBS. Mice were euthanized by carbon dioxide asphyxiation at 24 or 48 h of infection and bacterial loads were determined in lungs and liver by preparing homogenates in 5 ml PBS and plating 10-fold serial dilutions on blood agar plates. Colonies were counted after overnight incubation at 37°C.
Animal studies were performed in strict accordance with the German animal welfare regulations and the recommendations of the Society for Laboratory Animal Science (GV-Solas). All experiments were approved by the Niedersächsisches Landesamt für Verbraucherschutz und Lebensmittelsicherheit, Oldenburg, Germany (Permit No. 33.19-42502-04-13/1260 and 33.9-42502-04-13/1195).
Histopathology
Histological slides of approximately 3 µm thickness were prepared from formalin-fixed, paraffin-embedded lung tissue obtained from infected or PBS-treated mice at 48 h of infection. Sections were stained with hematoxylin and eosin according to standard laboratory procedures and evaluated with a Zeiss Axioscope light microscope, randomized, and blinded to the experimental groups.
In Vivo Imaging
IFN-β-luciferase reporter mice were injected i.p. with 150 mg/kg of d-luciferin in PBS (Calipers), anesthetized using Isoflurane (Baxter) and monitored using an IVIS 200 imaging system (Calipers). Photon flux was quantified using the Living Image 3.0 software (Calipers).
RNA Extraction of Lung Tissue and Blood
RNA was isolated from lung tissue samples using the miRNeasy Mini Kit (QIAGEN) following the manufacturer’s instructions. Similar amounts of RNA extracted from two to three mice per experiment were pooled. RNA was isolated from the blood samples using the RNeasy Protect Animal Blood Kit (QIAGEN) according to the manufacturer’s instructions. RNA extracted from three to six mice per experiment was pooled. RNA samples were cleared from globin mRNA and rRNA before RNA sequencing (RNA-Seq) using the Globin-Zero Gold Kit (Epicentre). A total of three RNA pools (biological replicates) for each condition and time point were generated. RNA integrity and concentration were determined with Agilent 2100 Bioanalyzer and Nanodrop 1000 spectrophotometer, respectively.
Library Generation and Sequencing
Libraries from lung tissue and blood RNA were generated using the ScriptSeq v2 RNA-Seq library preparation kit (Illumina) according to the manufacturer’s instructions. Libraries were sequenced on the Illumina HiSeq 2500 platform using the TruSeq S.R. cluster kit, v3-cBot-HS (Illumina). Three to four libraries were multiplexed per lane and sequenced to 58 cycles in one direction. The quality of the raw sequence data was checked by FastQC (389). The RNA-Seq was performed by the Genome Analytics Platform at the Helmholtz Centre for Infection Research in Braunschweig, Germany.
RNA-Seq Data Processing
Sequence reads of RNA-Seq were preprocessed for quality and trimmed of adapters using fastq-mcf with the following parameters: -q 20, -max-ns 0. RNA-Seq sequence reads were mapped against the GRCm38 genome of ENSEMBLE with the RNA-Seq aligner STAR (390) allowing a maximum of two mismatches, a minimum match length of 18 bp and an intron range between 50 to 15,000. Unique mapped reads were counted using htseq-count (391).
Real-Time PCR (RT-PCR)
Total RNA was reverse transcribed and amplified using a SensiFAST SYBR No-ROX onestep kit and the Rotor-Gene Q real-time PCR system (Thermofisher). Thermal cycling conditions consisted of reverse transcription for 15 min at 45°C and activation of polymerase for 5 min at 95°C, followed by 40 cycles of 20 s at 95°C, 20 s at 60°C, and 20 s at 72°C. All Primer sequences (see Table S1 in Supplementary Material) were designed to flank a long intron to exclude genomic DNA amplification. Cycle threshold values for each gene were normalized to the housekeeping gene β-actin. The relative copy number for each gene was calculated using the Pfaffl equation (29) and expressed as relative mRNA expression in infected animals to that in PBS controls.
Determination of Cytokines and Chemokines Serum Levels
The concentration of cytokines/chemokines in serum was determined using the bead-based multiplex immunoassay Legendplex™ (BioLegend) according to the manufacturer’s protocol.
Bioinformatics and Statistical Analysis
Statistical analysis was carried out using GraphPad Prism 5.01 (GraphPad Software, San Diego, CA, USA), PRIMER (v.6.1.6, PRIMER-E; Plymouth Marine Laboratory), MetaboAnalyst 3.0 (30) and the free software R v3.1.3 (http://www.rproject.org). Comparisons between groups or time points were made using Student t-test or one-way ANOVA. Principal component analysis (PCA) was conducted using the function prcomp from the R package stats. In addition, the factor loading of each gene for the different principal components was extracted. Differentially expressed genes between conditions were determined using the Bioconductor package DESeq2 implemented in R assuming a negative binominal distribution. A gene was considered significantly different in expression if the adjusted p-value was below 0.01. Infection classification models were generated using support vector machine (SVM). To determine the performance of each generated model, a receiver operating characteristic (ROC) curves was carried out and the area under the receiver operating characteristics curve (AUC) was calculated. AUC close to 1 indicates a successful classification model. External cross-validation of the best classification models was determined by Monte Carlo cross-validation (MCCV) method.
Complete sequencing data have been deposited in ArrayExpress: http://www.ebi.ac.uk/arrayexpress/experiments/E-MTAB-5815.
Results
Experimental Models of S. pneumoniae and S. aureus Lung Infection
The experimental models of S. pneumoniae and S. aureus lung infection used in this study consisted in the intranasal inoculation of BALB/c mice with either 5 × 10⁷ S. pneumoniae TIGR4 (pneumococcal pneumonia) or with 5 × 10⁸ S. aureus USA300 (staphylococcal pneumonia) and mirrored many aspects of the human disease. Both infections induced significant morbidity as shown by the prominent and progressive body weight loss observed in infected mice (Figure 1A). Pulmonary bacterial loads were comparable between S. pneumoniae-infected (Figure 1B) and S. aureus-infected (Figure 1C) mice and extrapulmonary bacteria dissemination to systemic organs was also observed in both infection groups (Figures 1D,E). Histological evaluation of lung tissue indicated distinctive pathology. While S. pneumoniae infection caused a moderate peribronchial and perivascular invasion of predominantly neutrophils, accompanied by some lymphocytes (Figure 2, middle-left panel, black arrows) with moderate to large numbers of bacteria and phagocytic cells present in alveoli (Figure 2, middle-right panel), S. aureus induced multifocal alveolar inflammation with large numbers of bacteria visible in the alveoli (Figure 2, lower panels).
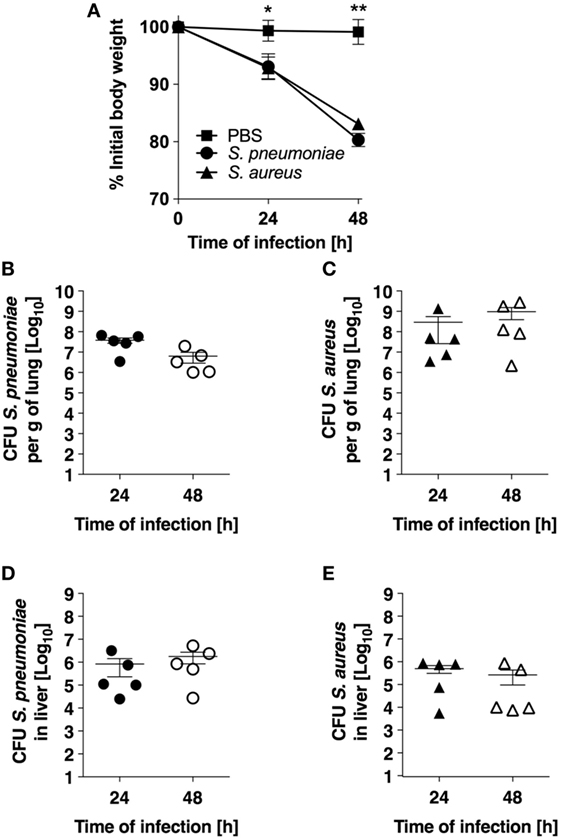
Figure 1. Infection parameters of pneumococcal and staphylococcal pneumonia in experimental murine models. (A) Body weight of BALB/c mice intranasally inoculated with either Streptococcus pneumoniae (circles) or Staphylococcus aureus (triangles). Mice intranasally treated with PBS were used as control (squares). Each symbol represents the mean value ± SD of 5–12 mice. *p < 0.05; **p < 0.01. (B) Pulmonary bacterial loads in BALB/c mice after intranasal inoculation with S. pneumoniae. (C) Pulmonary bacterial loads in BALB/c mice after intranasal inoculation with S. aureus. (D) Bacterial loads in the liver of S. pneumoniae-infected mice. (E) Bacterial loads in the liver of S. aureus-infected mice. Each symbol represents an individual animal. One representative experiment out of three performed independently is shown.

Figure 2. Histopathology (hematoxylin and eosin) of lung tissue obtained from BALB/c mice intranasally inoculated with either Streptococcus pneumoniae (middle panels) or Staphylococcus aureus (lower panels) or with only PBS (upper panels) at 24 h after treatment. Black arrows indicate peribronchial cellular infiltration. Lower magnification images are shown in the left panels and higher magnification images in the right panels. Original magnification: bar indicates 50 µm for left panels and 25 µm for right panels.
Transcriptional Response in Infected Lungs
In order to establish the proof-of-concept that S. pneumoniae and S. aureus induced specific transcriptional signature in the infected tissue despite their similar infection outcome, the transcriptional response induced by S. pneumoniae and S. aureus in the lungs was determined using RNA-Seq and the genes differentially expressed in response to these infections agents were identified using the DESeq2 algorithm. The results revealed that both S. pneumoniae and S. aureus induced a large shift in gene expression in the lungs respect to uninfected sham-treated controls (see Figure S1 in Supplementary Material). In order to identify pathogen-specific transcriptional signatures in the infected lungs, unsupervised PCA was conducted by entering gene expression data from the different samples without labeling of groups. When the data of all S. pneumoniae and S. aureus-infected samples from 24 and 48 h of infection were entered, the first principal component (PC1), which explained 50.5% of total variance, separated the 12 samples into two distinct groups that corresponded to S. aureus and S. pneumoniae infections, respectively (Figure 3A). Among the top genes identified by factor loading for PC1 with greater expression in S. aureus-infected lungs (positive values) were Arg1, Defb3, Cxcl3, Ccr3, Cycs, and Ear6 (Figure 3B), whereas mostly interferon-induced genes including Mx1, Rsad2, Cxcl10, Mx2, and Cxcl11 were more highly expressed in the S. pneumoniae-infected samples (Figure 3B). These results were validated by RT-PCR using a set of the genes identified by the factor loading for PC1 that discriminated between S. pneumoniae and S. aureus infection groups (see Figure S2 in Supplementary Material). Thus, S. pneumoniae and S. aureus induced a distinctive transcriptional response in the lungs.
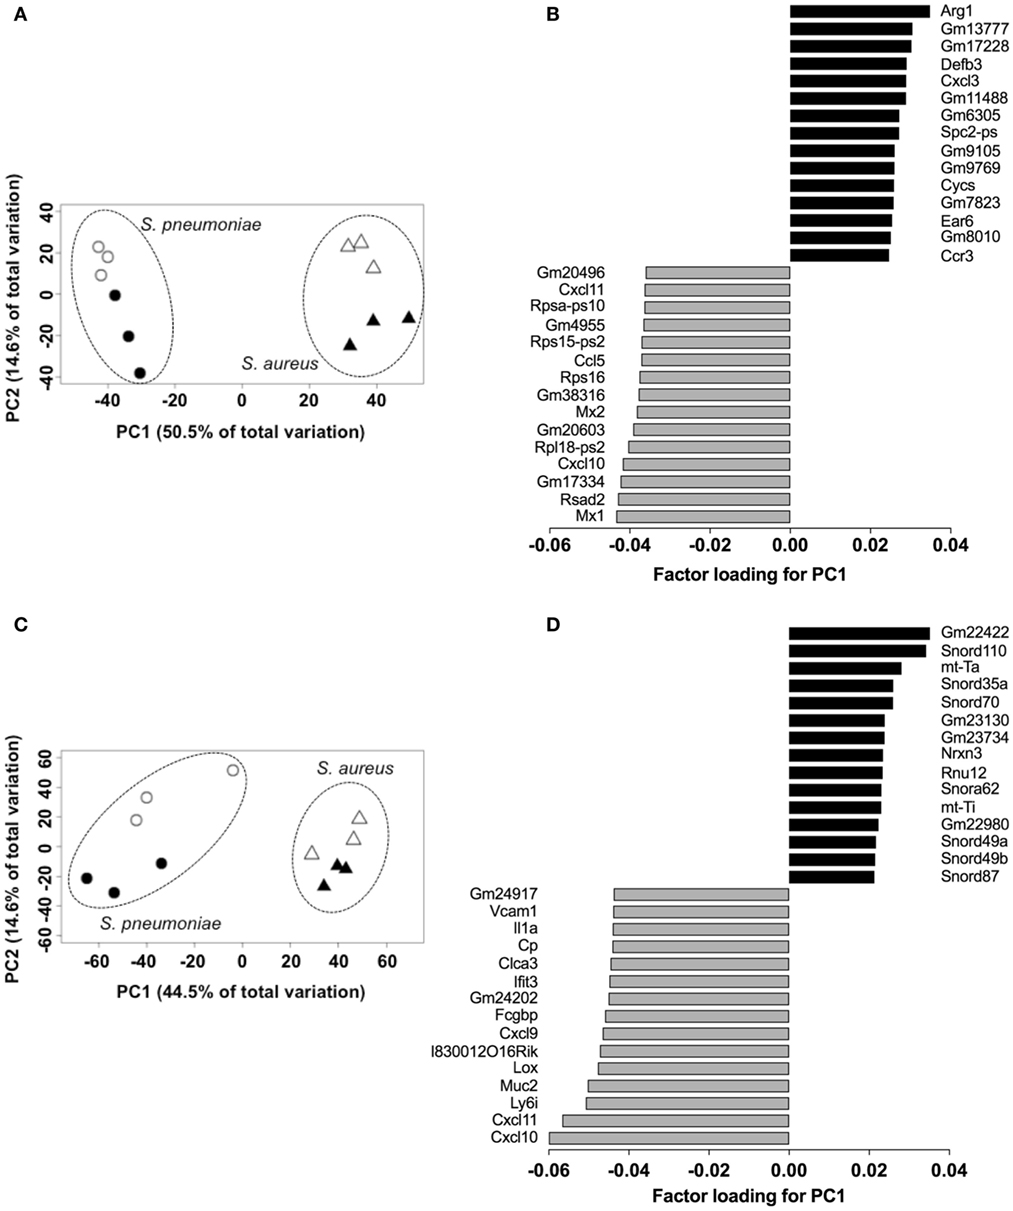
Figure 3. Pathogen-specific transcriptional signatures in lung tissue and peripheral whole blood of infected mice. Principal component analysis of the transcription data of Streptococcus pneumoniae-infected (circles) and Staphylococcus aureus-infected (triangles) lungs at 24 h (open symbols) and 48 h (solid symbols) of infection in lungs (A) and blood (C). Each symbol represents one independent experiment. Factor loading for PC1 analysis of lungs (B) and blood (D) transcription data. Black bars represent genes expressed to a greater extent in S. aureus-infected samples whereas gray bars represent genes expressed to a greater extent in S. pneumoniae-infected samples.
Transcriptional Response of Peripheral Blood
Because peripheral blood cells are more easily accessible than tissue biopsies, they are currently widely used as a surrogate tissue to monitor for disease biomarkers (31). Therefore, we evaluated if the gene expression profile of peripheral whole blood from mice infected with S. pneumoniae or S. aureus reflected the transcriptional response observed in the lungs. Differential gene expression analysis of peripheral blood from S. pneumoniae or S. aureus-infected mice taken at 24 and 48 h of infection indicated that both pathogens induced extensive alteration in gene expression compared to uninfected sham-treated controls (see Figure S3 in Supplementary Material). To determine the blood-derived transcriptional signature specific for each pathogen, the gene expression datasets were subjected to unsupervised PCA analysis. Again, PC1, which explained 44.4% of total variation, separated the 12 samples into two distinct groups that corresponded to S. aureus and S. pneumoniae infection (Figure 3C). In S. aureus-infected mice, the blood transcriptional signature did not mirror the transcriptional signature of the lungs since factor loading of PC1 showed greater expression of various small nucleolar RNAs, mitochondrially encoded RNA genes, Nrxn3 encoding a neuronal cell surface protein, and small nuclear RNA U12 (Rnu12) (Figure 3D). By contrast, the genes exhibiting greater expression in S. pneumoniae-infected mice were again mostly interferon-induced genes including Cxcl10, Cxcl11, Ifit3, and Cxcl9, which was completely consistent with the transcriptional profile of lung tissue (Figure 3D). The greater expression of interferon-induced genes in S. pneumoniae infection was also reflected at the protein level as shown by the significantly higher amounts of interferon-induced CXCL9 (Figure 4A) and CXCL10 (Figure 4B) in serum of S. pneumonia-infected mice in comparison with S. aureus-infected or PBS-treated mice. The fact that interferon-induced genes were more highly expressed in S. pneumoniae-infected than in S. aureus-infected mice suggested that the expression of interferons might also differ between the two groups of infected mice. Indeed, serum levels of IFN-β (Figure 4C) and IFN-γ (Figure 4D) were also significantly greater in S. pneumoniae-infected than in S. aureus-infected mice. The reason why the genes encoding IFN-β and IFN-γ did not appear in any of the transcriptional analysis that we performed at 24 and 48 h of infection was that these genes were induced by S. pneumoniae very early during infection, i.e., before the 24 h time point. Thus, using IFN-β Δβ-luc reporter mice (28), we found that the gene encoding IFN-β was induced by S. pneumoniae as early as 12 h post-inoculation (Figure 5A). Similarly, significant upregulation of the gene encoding IFN-γ by S. pneumoniae was evidenced by RT-PCR at 12 h of infection (Figure 5B). The failure of S. aureus to elicit an interferon response in mice after intranasal administration was independent of the S. aureus strain used for infection as demonstrated by the lack of interferon response in the circulation of mice intranasally infected with the methicillin-sensitive S. aureus strain 6850 (data not shown).
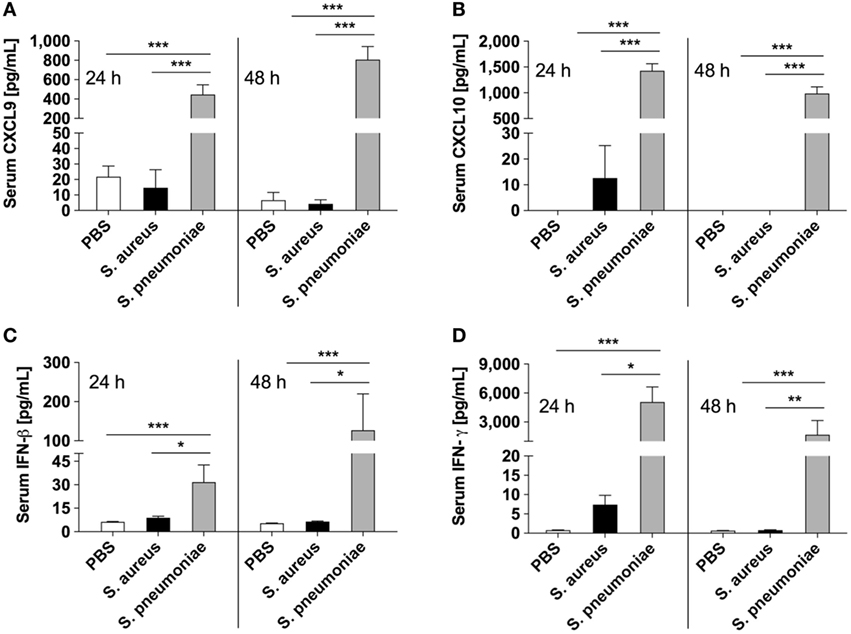
Figure 4. Circulating levels of interferons and interferon-induced mediators in infected mice. Serum levels of CXCL9 (A), CXCL10 (B), IFN-β (C), and IFN-γ (D) in Streptococcus pneumoniae-infected (gray bars), Staphylococcus aureus-infected (black bars), or PBS-treated (white bars) mice measured with bead-based multiplex immunoassay at 24 and 48 h after intranasal inoculation. Each bar represents the mean ± SD of values obtained from eight to nine mice from three independent experiments. *p < 0.05; **p < 0.01; ***p < 0.001.
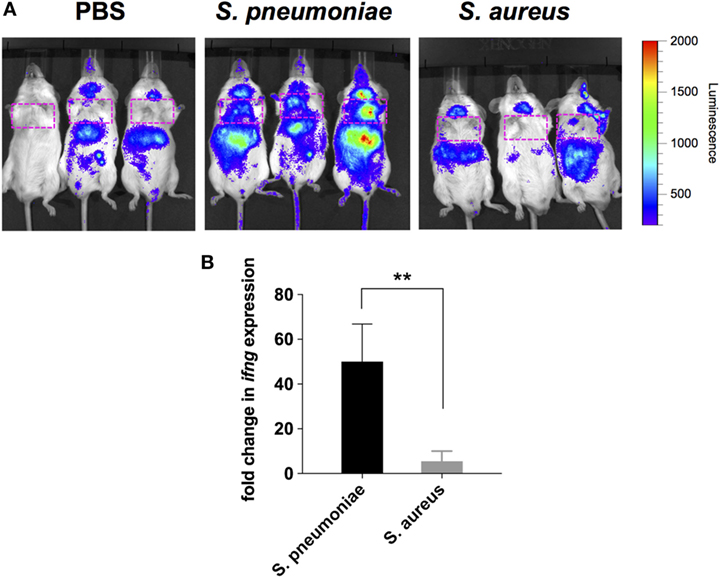
Figure 5. Induction of IFN-β and IFN-γ gene expression in infected mice. (A) Luciferase gene expression in Δβ-luc reporter mice infected with Streptococcus pneumoniae (middle panel), Staphylococcus aureus (right panel), or treated with PBS (left panel) at 12 h post-inoculation. Mice were injected with luciferin (i.p.) and luciferase activity was visualized immediately in the IVIS 200 imaging system. The intensity of emission is represented as a pseudocolor image. The red box indicates the anatomical location of the lungs. (B) Quantification of IFN-γ gene expression in the lungs of S. pneumoniae-infected (black bar) or S. aureus-infected (gray bar) mice at 12 h post-inoculation by real-time PCR. Values are expressed as the fold change between the expression of infg in infected mice and the expression of this gene in uninfected control mice. Each bar represents the mean ± SD of three independent experiments. **p < 0.01.
Together these results confirmed that S. pneumoniae induced a significantly more vigorous interferon-related response in lungs and peripheral blood than S. aureus after respiratory inoculation in mice.
Performance Evaluation of Interferon-Related Biomarkers for Discriminating Pneumococcal From Staphylococcal Pneumonia
Considering that S. pneumoniae-infected mice exhibited significantly greater serum levels of IFN-β, IFN-γ, CXCL9, and CXCL10 than S. aureus-infected mice, we explored the power of these four biomarkers to discriminate between the two infection groups. Three predictive models comprising 2, 3, or 4 features were built using an SVM. ROC curves and the estimated AUC values for the three predictive models are shown in Figure 6A. The predictive model using two features demonstrated the greater predictive accuracy (94.3%) (Figure 6B). The markers CXCL9 and CXCL10 were selected based on average importance (Figure 6C) for further validation using MCCV analysis. This analysis yielded an AUC of 0.992 (95% CI = 0.971–1) (Figure 7A) and correctly classified 100% of S. aureus infection samples and 87% of S. pneumoniae samples (Figure 7B).
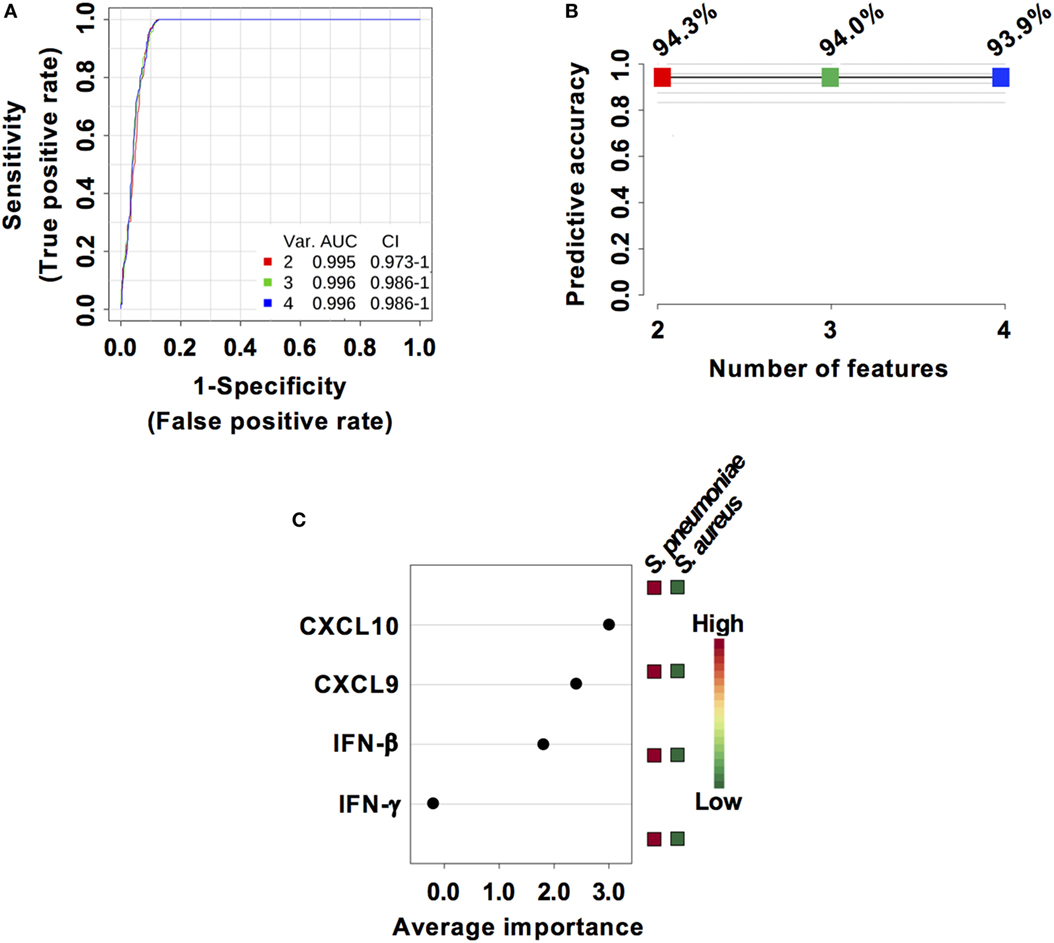
Figure 6. Predictive models based on IFN-β, IFN-γ, CXCL9, and CXCL10 serum levels built by support vector machine (SVM). (A) Receiver operating characteristic curves and area under the receiver operating characteristics curve (AUC) values of the predictive classifiers built on 2, 3, and 4 features using an SVM. (B) Predictive accuracy of the different predictive models. (C) Average importance of each of the four features included in the predictive models and abundance in Streptococcus pneumoniae and Staphylococcus aureus infection samples.
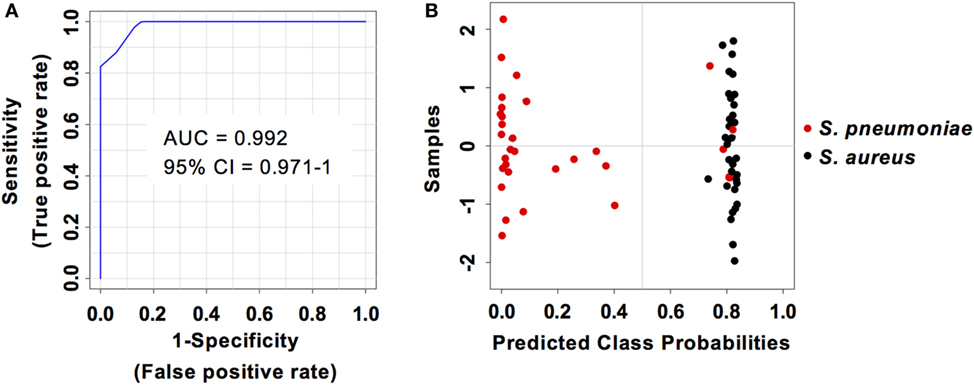
Figure 7. Predictive performance of the predictive model built on the set of the two biomarkers CXCL9 and CXCL10. (A) Receiver operating characteristic curve and area under the receiver operating characteristics curve (AUC) value of the predictive model built combining the serum levels of CXCL9 and CXCL10 calculated using Monte Carlo cross-validation. (B) Plot of posterior classification probability showing the segregation of Streptococcus pneumoniae (red symbols) and Staphylococcus aureus (black symbols) infection samples according to the CXCL9/CXCL10 predictive model. Each symbol represents the classification probability that a given infected sample belongs to the S. pneumoniae or to the S. aureus group. The classification boundary is shown by a dotted line at x = 0.5.
Validation of the Prediction Model in an Independent Cohort
The capacity of the prediction model based on serum levels of CXCL9 and CXCL10 to discriminate between pneumococcal and staphylococcal pneumonia was validated in an independent cohort of 20 mice infected with S. aureus and 16 mice infected with S. pneumoniae from a different genetic background (C57BL/6) and comprising 50% males and 50% females. The samples from this validation cohort were analyzed under the same conditions than the samples from the training group. The two markers prediction model exhibited an AUC of 1 (95% CI = 1–1) (Figure 8A) and the classification of samples according to infection etiology was very similar to that observed with the training group with 100% correct classification for S. aureus infection samples and 12 out of 16 (75%) for S. pneumoniae infection samples (Figure 8B). The cutoff serum concentration values for prediction of infection etiology with both sensitivity and specificity of 1 was 17.5 pg/ml for CXCL9 and 4.5 pg/ml for CXCL10 (Figure 8C).
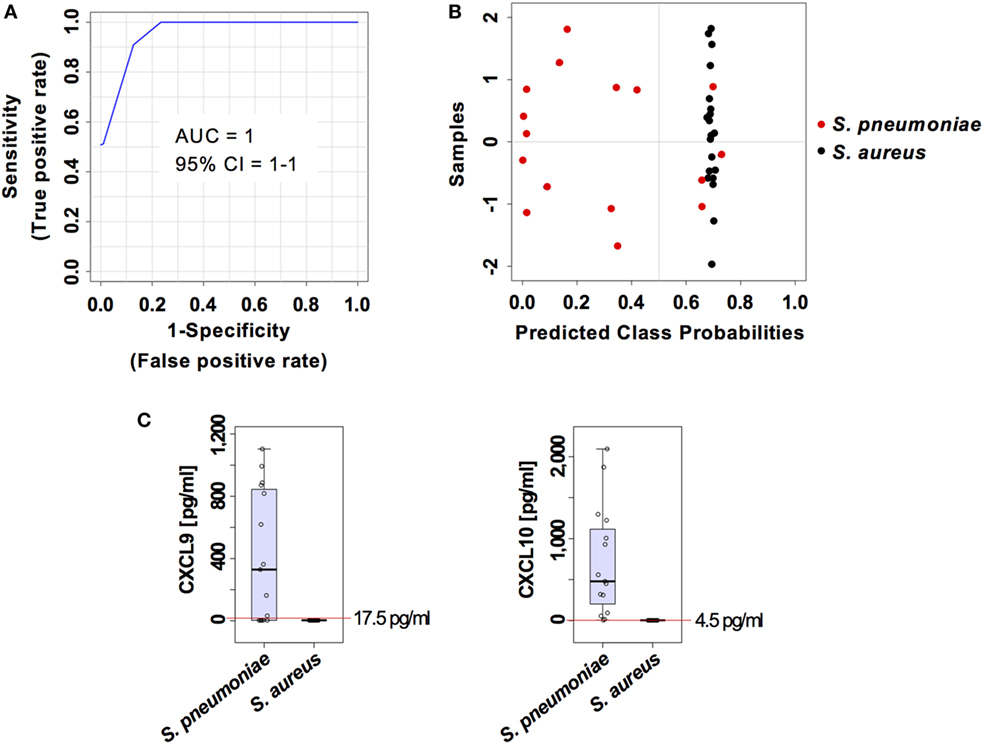
Figure 8. External validation of the predictive model built on the two set biomarkers CXCL9 and CXCL10. (A) Receiver operating characteristic curve and area under the receiver operating characteristics curve (AUC) value of the predictive model built combining the serum levels of CXCL9 and CXCL10 calculated using Monte Carlo cross-validation. (B) Plot of posterior classification probability showing the segregation of Streptococcus pneumoniae (red symbols) and Staphylococcus aureus (black symbols) infection samples according to the set of the two biomarkers CXCL9 and CXCL10, using a predictive model in an external cohort of C57BL/6 mice. Each symbol represents the classification probability that a given infected sample belongs to the S. pneumoniae or to the S. aureus group. The classification boundary is shown by a dotted line at x = 0.5. (C) Box-and-whisker plots illustrating the concentrations of CXCL9 and CXCL10 in serum of S. pneumoniae-infected or S. aureus-infection mice. The red line indicates the metabolite concentration cutoff value for sensitivity and specificity of 1 and the corresponding numeric value is included in each graph.
Discussion
In this study, we performed a genome-wide transcriptional analysis of lung tissue and blood samples of mice with S. aureus or S. pneumoniae respiratory infection and identified a robust interferon signature consistently associated with pneumococcal pneumonia that was absent in S. aureus-infected mice. This interferon signature was manifested by a marked induction of the genes encoding interferons such as IFN-β, IFN-γ, and the interferon-induced mediators such as CXCL9 and CXCL10 in lung tissue and blood cells as well as at the protein level in peripheral blood. The induction of IFN-γ in the lungs in response to S. pneumoniae infection has been previously reported (32) and high levels of CXCL9 have been observed in the lungs of mice after intranasal challenge with S. pneumoniae (33). Also induction of type I interferon has been shown to be involved in the host response to S. pneumoniae in mice (34) and in humans (35). S. pneumoniae phagocytosis and recognition of bacterial DNA by cytosolic pattern recognition receptors after translocation from the phagosome into the cytosol seems to be required for IFN-β production by phagocytic cells (36). The translocation of bacterial DNA from the phagosome into the cytosol for induction of IFN-β has been shown to be mediated by pneumolysin, which is a member of the thiol-activated cytolysin family of toxins and an important virulence factor of S. pneumoniae (34). Pneumolysin has been also reported to be involved in the induction of IFN-γ by S. pneumoniae (35). S. aureus, on the other hand, is a poor inducer of interferons (37) and although several studies have reported the capacity of S. aureus to activate type I interferon signaling in several types of cells in in vitro systems (38, 39), direct induction of interferons by S. aureus during in vivo infection has not yet been reported. The remarkable resistance of S. aureus to degradation within the phagosome due to modifications of the cell wall peptidoglycan that prevents the release of bacterial components necessary to trigger interferon production has been proposed to be responsible for this deficiency (37). This may explain why interferon and interferon-induced mediators were detectable in mice infected with S. pneumoniae but not in those infected with S. aureus and highlights the potential value of these mediators as biomarkers of pneumococcal pneumonia.
Infection classification models were then built using an SVM to evaluate the potential value of serum levels of these mediators for discriminating between pneumococcal and staphylococcal pneumonia. The infection classifier based on the combination of CXCL9 and CXCL10 serum levels was identified as the best model comprising the minimum set of biomarkers and allowing an accurate infection classification. The robustness of CXCL9 and CXCL10 serum biomarkers in discriminating S. pneumoniae from S. aureus lung infection was further demonstrated using an independent cohort of mice of a different genetic background and including a combination of males and females. These experimental data altogether identified serum levels of CXCL9 and CXCL10 as powerful diagnostic biomarkers for pneumococcal pneumonia that should advance toward clinical validation in patient cohorts.
Biomarkers are gaining increasing attention within all areas of medicine and infection diseases and have been used already for diagnostic purposes in CAP patients. For example, the levels of procalcitonin (PCT) in blood are elevated in bacterial but not in viral infections (40). Consequently, PCT serum concentration is a suitable biomarker to guide the management of CAP patients since high levels of serum PCT indicate a bacterial rather than a viral etiology (41). However, circulating PCT values cannot discriminate between different bacterial pathogens. Because the results of our study in the murine system indicate that serum levels of CXCL9 and CXCL10 can discriminate between S. pneumoniae and S. aureus pneumonia, these chemokines may be used as surrogate biomarkers to increase the diagnostic power of PCT and justify future studies to validate their utility as pathogen-specific biomarkers in humans with CAP, and perhaps other invasive infections due to S. pneumoniae such as sepsis or CNS infections.
Ethics Statement
Animal studies were performed in strict accordance with the German animal welfare regulations and the recommendations of the Society for Laboratory Animal Science (GV-Solas). All experiments were approved by the Niedersächsisches Landesamt für Verbraucherschutz und Lebensmittelsicherheit, Oldenburg, Germany (Permit No. 33.19-42502-04-13/1260 and 33.9-42502-04-13/1195).
Author Contributions
EM and FP conceived the original idea for the study. AS, OG, and EM performed the experiments and analyzed the data. MP performed histological analysis. AS and EM wrote the manuscript. FP contributed to data interpretation and intellectual content and edited the manuscript.
Conflict of Interest Statement
The authors declare that the research was conducted in the absence of any commercial or financial relationships that could be construed as a potential conflict of interest.
Acknowledgments
We thank Stefan Lienenklaus for providing the IFN-β Δβ-luc reporter mice and Sabine Lehne for excellent technical assistance.
Funding
This work was supported by the EU Innovative Medicines Initiative Project Combatting Bacterial Resistance in Europe (COMBACTE; www.combacte.com, contract no. 115523), resources of which are composed of financial contribution from the European Union’s Seventh Framework Programme (FP7/2007–2013) and EFPIA companies.
Supplementary Material
The Supplementary Material for this article can be found online at https://www.frontiersin.org/articles/10.3389/fimmu.2018.01424/full#supplementary-material.
References
1. Prina E, Ranzani OT, Torres A. Community-acquired pneumonia. Lancet (2015) 386:1097–108. doi:10.1016/S0140-6736(15)60733-4
2. Mandell LA, Wunderink RG, Anzueto A, Bartlett JG, Campbell GD, Dean NC, et al. Infectious Diseases Society of America/American Thoracic Society consensus guidelines on the management of community-acquired pneumonia in adults. Clin Infect Dis (2007) 44(Suppl 2):S27–72. doi:10.1086/511159
3. Garau J, Baquero F, Perez-Trallero E, Perez JL, Martin-Sanchez AM, Garcia-Rey C, et al. Factors impacting on length of stay and mortality of community-acquired pneumonia. Clin Microbiol Infect (2008) 14:322–9. doi:10.1111/j.1469-0691.2007.01915.x
4. Musher DM, Roig IL, Cazares G, Stager CE, Logan N, Safar H. Can an etiologic agent be identified in adults who are hospitalized for community-acquired pneumonia: results of a one-year study. J Infect (2013) 67:11–8. doi:10.1016/j.jinf.2013.03.003
5. Rozenbaum MH, Pechlivanoglou P, Van Der Werf TS, Lo-Ten-Foe JR, Postma MJ, Hak E. The role of Streptococcus pneumoniae in community-acquired pneumonia among adults in Europe: a meta-analysis. Eur J Clin Microbiol Infect Dis (2013) 32:305–16. doi:10.1007/s10096-012-1778-4
6. Ruuskanen O, Lahti E, Jennings LC, Murdoch DR. Viral pneumonia. Lancet (2011) 377:1264–75. doi:10.1016/S0140-6736(10)61459-6
7. Musher DM, Abers MS, Bartlett JG. Evolving understanding of the causes of pneumonia in adults, with special attention to the role of pneumococcus. Clin Infect Dis (2017) 65:1736–44. doi:10.1093/cid/cix549
8. Hidron AI, Low CE, Honig EG, Blumberg HM. Emergence of community-acquired meticillin-resistant Staphylococcus aureus strain USA300 as a cause of necrotising community-onset pneumonia. Lancet Infect Dis (2009) 9:384–92. doi:10.1016/S1473-3099(09)70133-1
9. David MZ, Daum RS. Community-associated methicillin-resistant Staphylococcus aureus: epidemiology and clinical consequences of an emerging epidemic. Clin Microbiol Rev (2010) 23:616–87. doi:10.1128/CMR.00081-09
10. Aliberti S, Cilloniz C, Chalmers JD, Zanaboni AM, Cosentini R, Tarsia P, et al. Multidrug-resistant pathogens in hospitalised patients coming from the community with pneumonia: a European perspective. Thorax (2013) 68:997–9. doi:10.1136/thoraxjnl-2013-203384
11. Moran GJ, Krishnadasan A, Gorwitz RJ, Fosheim GE, Albrecht V, Limbago B, et al. Prevalence of methicillin-resistant Staphylococcus aureus as an etiology of community-acquired pneumonia. Clin Infect Dis (2012) 54:1126–33. doi:10.1093/cid/cis022
12. Self WH, Wunderink RG, Williams DJ, Zhu Y, Anderson EJ, Balk RA, et al. Staphylococcus aureus community-acquired pneumonia: prevalence, clinical characteristics, and outcomes. Clin Infect Dis (2016) 63:300–9. doi:10.1093/cid/ciw300
13. Carugati M, Franzetti F, Wiemken T, Kelley RR, Peyrani P, Blasi F, et al. De-escalation therapy among bacteraemic patients with community-acquired pneumonia. Clin Microbiol Infect (2015) 21:936.e11–8. doi:10.1016/j.cmi.2015.06.015
14. Viasus D, Simonetti AF, Garcia-Vidal C, Niubo J, Dorca J, Carratala J. Impact of antibiotic de-escalation on clinical outcomes in community-acquired pneumococcal pneumonia. J Antimicrob Chemother (2017) 72:547–53. doi:10.1093/jac/dkw441
15. Bartlett JG, Mundy LM. Community-acquired pneumonia. N Engl J Med (1995) 333:1618–24. doi:10.1056/NEJM199512143332408
16. Cilloniz C, Martin-Loeches I, Garcia-Vidal C, San Jose A, Torres A. Microbial etiology of pneumonia: epidemiology, diagnosis and resistance patterns. Int J Mol Sci (2016) 17:2120. doi:10.3390/ijms17122120
17. Dominguez J, Gali N, Blanco S, Pedroso P, Prat C, Matas L, et al. Urinary antigen test for pneumococcal pneumonia. Chest (2001) 120:1748–50. doi:10.1016/S0012-3692(15)36397-2
18. Vicente D, Lopez-Olaizola M, De La Caba I, Cilla G. Evaluation of Sofia fluorescent immunoassay analyzer for pneumococcal urinary antigen detection in hospitalized patients with community-acquired pneumonia. J Microbiol Methods (2017) 141:25–7. doi:10.1016/j.mimet.2017.07.005
19. Carvalho Mda G, Tondella ML, Mccaustland K, Weidlich L, Mcgee L, Mayer LW, et al. Evaluation and improvement of real-time PCR assays targeting lytA, ply, and psaA genes for detection of pneumococcal DNA. J Clin Microbiol (2007) 45:2460–6. doi:10.1128/JCM.02498-06
20. Mehr S, Wood N. Streptococcus pneumoniae – a review of carriage, infection, serotype replacement and vaccination. Paediatr Respir Rev (2012) 13:258–64. doi:10.1016/j.prrv.2011.12.001
21. Upadhyay S, Niederman MS. Biomarkers: what is their benefit in the identification of infection, severity assessment, and management of community-acquired pneumonia? Infect Dis Clin North Am (2013) 27:19–31. doi:10.1016/j.idc.2012.11.003
22. Downes KJ. The pediatric infectious diseases society annual awards, 2012. J Pediatric Infect Dis Soc (2012) 1:171–8. doi:10.1093/jpids/pis074
23. Kapasi AJ, Dittrich S, Gonzalez IJ, Rodwell TC. Host biomarkers for distinguishing bacterial from non-bacterial causes of acute febrile illness: a comprehensive review. PLoS One (2016) 11:e0160278. doi:10.1371/journal.pone.0160278
24. Salluh JIF, Souza-Dantas VC, Povoa P. The current status of biomarkers for the diagnosis of nosocomial pneumonias. Curr Opin Crit Care (2017) 23:391–7. doi:10.1097/MCC.0000000000000442
25. Yusa T, Tateda K, Ohara A, Miyazaki S. New possible biomarkers for diagnosis of infections and diagnostic distinction between bacterial and viral infections in children. J Infect Chemother (2017) 23:96–100. doi:10.1016/j.jiac.2016.11.002
26. Tettelin H, Nelson KE, Paulsen IT, Eisen JA, Read TD, Peterson S, et al. Complete genome sequence of a virulent isolate of Streptococcus pneumoniae. Science (2001) 293:498–506. doi:10.1126/science.1061217
27. Diep BA, Gill SR, Chang RF, Phan TH, Chen JH, Davidson MG, et al. Complete genome sequence of USA300, an epidemic clone of community-acquired meticillin-resistant Staphylococcus aureus. Lancet (2006) 367:731–9. doi:10.1016/S0140-6736(06)68231-7
28. Lienenklaus S, Cornitescu M, Zietara N, Lyszkiewicz M, Gekara N, Jablonska J, et al. Novel reporter mouse reveals constitutive and inflammatory expression of IFN-beta in vivo. J Immunol (2009) 183:3229–36. doi:10.4049/jimmunol.0804277
29. Pfaffl MW. A new mathematical model for relative quantification in real-time RT-PCR. Nucleic Acids Res (2001) 29:e45. doi:10.1093/nar/29.9.e45
30. Xia J, Sinelnikov IV, Han B, Wishart DS. MetaboAnalyst 3.0 – making metabolomics more meaningful. Nucleic Acids Res (2015) 43:W251–7. doi:10.1093/nar/gkv380
31. Mohr S, Liew CC. The peripheral-blood transcriptome: new insights into disease and risk assessment. Trends Mol Med (2007) 13:422–32. doi:10.1016/j.molmed.2007.08.003
32. Gomez JC, Yamada M, Martin JR, Dang H, Brickey WJ, Bergmeier W, et al. Mechanisms of interferon-gamma production by neutrophils and its function during Streptococcus pneumoniae pneumonia. Am J Respir Cell Mol Biol (2015) 52:349–64. doi:10.1165/rcmb.2013-0316OC
33. Eliasson M, Morgelin M, Farber JM, Egesten A, Albiger B. Streptococcus pneumoniae induces expression of the antibacterial CXC chemokine MIG/CXCL9 via MyD88-dependent signaling in a murine model of airway infection. Microbes Infect (2010) 12:565–73. doi:10.1016/j.micinf.2010.03.014
34. Parker D, Martin FJ, Soong G, Harfenist BS, Aguilar JL, Ratner AJ, et al. Streptococcus pneumoniae DNA initiates type I interferon signaling in the respiratory tract. MBio (2011) 2:e00016–11. doi:10.1128/mBio.00016-11
35. Zhang Q, Bernatoniene J, Bagrade L, Paton JC, Mitchell TJ, Hammerschmidt S, et al. Regulation of production of mucosal antibody to pneumococcal protein antigens by T-cell-derived gamma interferon and interleukin-10 in children. Infect Immun (2006) 74:4735–43. doi:10.1128/IAI.00165-06
36. Koppe U, Hogner K, Doehn JM, Muller HC, Witzenrath M, Gutbier B, et al. Streptococcus pneumoniae stimulates a STING- and IFN regulatory factor 3-dependent type I IFN production in macrophages, which regulates RANTES production in macrophages, cocultured alveolar epithelial cells, and mouse lungs. J Immunol (2012) 188:811–7. doi:10.4049/jimmunol.1004143
37. Kaplan A, Ma J, Kyme P, Wolf AJ, Becker CA, Tseng CW, et al. Failure to induce IFN-beta production during Staphylococcus aureus infection contributes to pathogenicity. J Immunol (2012) 189:4537–45. doi:10.4049/jimmunol.1201111
38. Martin FJ, Gomez MI, Wetzel DM, Memmi G, O’Seaghdha M, Soong G, et al. Staphylococcus aureus activates type I IFN signaling in mice and humans through the Xr repeated sequences of protein A. J Clin Invest (2009) 119:1931–9. doi:10.1172/JCI35879
39. Parker D, Prince A. Staphylococcus aureus induces type I IFN signaling in dendritic cells via TLR9. J Immunol (2012) 189:4040–6. doi:10.4049/jimmunol.1201055
40. Muller B, Becker KL, Schachinger H, Rickenbacher PR, Huber PR, Zimmerli W, et al. Calcitonin precursors are reliable markers of sepsis in a medical intensive care unit. Crit Care Med (2000) 28:977–83. doi:10.1097/00003246-200004000-00011
Keywords: pneumonia, Streptococcus pneumoniae, Staphylococcus aureus, biomarkers, interferon, transcriptome
Citation: Strehlitz A, Goldmann O, Pils MC, Pessler F and Medina E (2018) An Interferon Signature Discriminates Pneumococcal From Staphylococcal Pneumonia. Front. Immunol. 9:1424. doi: 10.3389/fimmu.2018.01424
Received: 28 March 2018; Accepted: 08 June 2018;
Published: 25 June 2018
Edited by:
Christoph Hölscher, Forschungszentrum Borstel (LG), GermanyReviewed by:
Claudio Nicoletti, Università degli Studi di Firenze, ItalyDane Parker, Columbia University, United States
Copyright: © 2018 Strehlitz, Goldmann, Pils, Pessler and Medina. This is an open-access article distributed under the terms of the Creative Commons Attribution License (CC BY). The use, distribution or reproduction in other forums is permitted, provided the original author(s) and the copyright owner are credited and that the original publication in this journal is cited, in accordance with accepted academic practice. No use, distribution or reproduction is permitted which does not comply with these terms.
*Correspondence: Eva Medina, ZXZhLm1lZGluYSYjeDAwMDQwO2hlbG1ob2x0ei1oemkuZGU=