
95% of researchers rate our articles as excellent or good
Learn more about the work of our research integrity team to safeguard the quality of each article we publish.
Find out more
ORIGINAL RESEARCH article
Front. Immunol. , 21 June 2018
Sec. Inflammation
Volume 9 - 2018 | https://doi.org/10.3389/fimmu.2018.01416
This article is part of the Research Topic Complex Immune Mediated Pulmonary Disease: How Genetic Data can Influence Clinical Practice View all 7 articles
 Selene Baos1,2David Calzada1Lucía Cremades-Jimeno1Joaquín Sastre2,3
 César Picado2,4
 Joaquín Quiralte5Fernando Florido6Carlos Lahoz1,2
 Blanca Cárdaba1,2*
Asthma is a complex and heterogeneous respiratory disorder characterized by chronic airway inflammation. It has generally been associated with allergic mechanisms related to type 2 airway inflammation. Nevertheless, between 10 and 33% of asthmatic individuals have nonallergic asthma (NA). Several targeted treatments are in clinical development for patients with Th2 immune response, but few biomarkers are been defined for low or non-Th2-mediated inflammation asthma. We have recently defined by gene expression a set of genes as potential biomarkers of NA, mainly associated with disease severity: IL10, MSR1, PHLDA1, SERPINB2, CHI3L1, IL8, and PI3. Here, we analyzed their protein expression and specificity using sera and isolated peripheral blood mononuclear cells (PBMCs). First, protein quantification was carried out using ELISA (in sera) or Western blot (proteins extracted from PBMCs by Trizol procedure), depending on the biomarker in 30 healthy controls (C) subjects and 30 NA patients. A receiver operating characteristic curve analysis was performed by using the R program to study the specificity and sensitivity of the candidate biomarkers at a gene- and protein expression level. Four kinds of comparisons were performed: total NA group vs C group, severe NA patients vs C, moderate–mild NA patients vs C, and severe NA patients vs moderate–mild NA patients. We found that all the single genes showed good sensitivity vs specificity for some phenotypic discrimination, with CHI3L1 and PI3 exhibiting the best results for C vs NA: CHI3L1 area under the curve (AUC) (CI 95%): 0.95 (0.84–1.00) and PI3 AUC: 0.99 (0.98–1.00); C vs severe NA: PI3 AUC: 1 (0.99–1.00); and C vs moderate–mild NA: CHI3L1 AUC: 1 (0.99–1.00) and PI3 AUC: 0.99 (0.96–1.00). However, the results for discriminating asthma disease and severity with protein expression were better when two or three biomarkers were combined. In conclusion, individual genes and combinations of proteins have been evaluated as reliable biomarkers for classifying NA subjects and their severity. These new panels could be good diagnostic tests.
Asthma is a complex respiratory disorder defined in the most recent Global Initiative for Asthma (1) as “a heterogeneous disease, usually characterized by chronic airway inflammation.” Asthma diagnosis is based on a history of respiratory symptoms, such as wheezing, shortness of breath, chest tightness, and cough, which varies over time and fluctuates in intensity. The World Health Organisation defines asthma as the most common chronic disease in children and estimates that more than 300 million people are affected (2). However, one of the major problems in defining this pathology is its wide clinical spectrum. It is generally accepted that clinical differences in treatment response and disease course are related to multiple underlying variations in genetic, pharmacologic, physiologic, biologic, and/or immunologic mechanisms that produce subclasses of phenotypes termed endotypes (3).
Despite this clinical heterogeneity, allergic mechanisms have been implicated in 50–80% of asthmatic patients and in approximately 50% of severe asthma (4, 5). Thus, asthma has generally been associated with type 2 airway inflammation characterized by elevated levels of immunoglobulin E, eosinophils, and several interleukins (IL), such as IL-4, IL-5, IL-13, and IL-9. Nevertheless, 10–33% of asthmatic individuals have nonallergic asthma (NA), or allergic sensitization that cannot be demonstrated (6). The generally accepted definition of NA includes negative skin prick or in vitro-specific IgE tests to a panel of local allergens, and at a minimum, a panel of perennial allergens; total serum IgE levels are typically normal or low (<150 IU/ml) (7). The mechanisms contributing to the non-type 2 immune response in asthmatic patients are less clear. Two major mechanisms leading to neutrophilic inflammation are postulated: dysregulated neutrophil-mediated immune responses due to respiratory infections (8) or defects in resolution of inflammation (9), and the activation of the IL-17-dependent pathway (10–14).
New strategies for the discovery and validation of biomarkers such as omics have been used to reveal the mechanisms responsible for asthma endotypes in different tissues. A biomarker is an objective, quantifiable biological parameter which serves as an index for health and physiological assessment. It could be the sign of a complex underlying via or an essential molecule associated directly with a main role in one endotype of a disease. Along these lines, many biomarkers targeted treatments are in clinical development for patients with Th2 immune response: anti-IL-4/IL-13, anti-IL-4, anti-IL-5, anti-IgE antibodies, and CRTh2 (chemoattractant receptor-homologous molecule expressed on Th2 cell antagonists) (15–17), although in the latter case, two recently conducted large Phase 2 studies with CRTh2 antagonists have either failed to demonstrate significant efficacy in clinical endpoints compared to placebo (18) or showed a similar degree of improvement with the active control (19) in patients with atopic/allergic asthma.
Besides, to date, no endotype-driven interventions have been proven effective for non-type 2 immune response asthma (20). In summary, more information is needed to optimize the patient’s therapeutic responses while avoiding adverse effects (20).
Against this backdrop, our research team has recently defined a group of genes that was differentially expressed in peripheral samples from nonallergic asthmatic patients (low or non-Th2 inflammation) and mainly associated with disease severity (21, 22). The current study assessing gene and protein biomarkers is a follow up of our previous study (21, 22). Here, we explore the relevance of the gene and protein expression of these potential biomarkers according to sensitivity and specificity analysis [receiver operating characteristic (ROC) curves]. The ultimate aim is to provide useful new biomarkers for the NA disease.
The study population comprised 60 unrelated subjects: 30 healthy control subjects (C) and 30 patients with NA. The samples of the asthma group came from the asthma biobank of the CIBERES located at the IIS-Fundación Jiménez Díaz-UAM in Madrid (IIS-FJD-UAM) (21, 22). These patients were diagnosed with severe, moderate, or mild asthma according to the Spanish Guidelines for the Management of Asthma, or GEMA (23). The daily mean of inhaled corticosteroids during the last 6 months, previous the diagnosis, and while taking the sample was: 1,488 ± 541 µg in severe asthma, 1,100 ± 977.75 µg in moderate asthma, and 450 ± 463.68 µg in mild asthma. On the day of extraction of the sample, the subjects did not take any medication.
Pulmonary function tests were carried out by determining the predicted percentage of forced vital capacity (% FVC), forced expiratory volume in 1 s (% FEV1), and the post bronchodilator test (% PBD) or reversibility test.
The control subjects were healthy, with no history of respiratory diseases. They were diagnosed at the Allergy Service of two hospitals in Andalusia (Spain), Vírgen del Rocío University Hospital in Seville and San Cecilio University Hospital in Granada, and the samples were sent to the IIS-FJD-UAM to be processed.
All the subjects, controls, and NA patients, were tested by skin prick test against a panel of common allergens, including mites (Dermatophagoides pteronyssinus, Dermatophagoides farinae, and Lepidoglyphus destructor), epithelia (cat and dog), cockroaches (Blatella orientalis and Blatella germanica), pollens (Cypress, banana shadow, olive, mixture of grasses, Artemisia, Parietaria, and Salsola), and fungi (Alternaria, Cladosporium, Aspergillus, and Penicillium).
Informed consent in accordance with the Declaration of Helsinki was obtained from each subject. Ethical approval for the study was obtained from the ethical and research committees of the participating hospitals.
Peripheral blood mononuclear cells were isolated from heparin-containing peripheral blood samples by gradient centrifugation using Lymphoprep (Comercial Rafer, Zaragoza, Spain) following the manufacturer’s instructions. PBMCs were isolated in steril conditions using endotoxin-free reagents. Total proteins were isolated from PBMCs (106 cells) using the Trizol method (Invitrogen, Carlsbad, CA, USA). Protein levels were quantified by the BCA method (Thermo Fisher Scientific, Rockford, IL, USA).
CD86, IL10, MSR1, PHLDA1, SERPINB2, CHI3L1, CPA3, IL8, and PI3 were selected as candidate biomarkers of the NA group (significance established at a relative gene quantification higher than 4 or lower than 0.25 comparing the C group) (21).
CD86 and CPA3 did not meet the strict criteria (RQ>4 or <0.25) in all of the comparisons (21), so we did not examine their expression at the protein level.
Soluble biomarkers with an ELISA commercial available were quantified through this technique.
Levels of IL-10, CHI3L1, IL-8, PI3, and POSTN were measured in the subjects’ serum using the human ELISA kits manufactured by ImmunoTools (Friesoythe, Germany) for IL-10; by R&D Systems (Minneapolis, MN, USA) for CHI3L1, PI3, and POSTN; and by Diaclone (Besancon Cedex, France) for IL-8. The procedure was carried out in accordance with each manufacturer’s protocol.
POSTN or periostin was analyzed at protein level given its relevance in the literature as a protein associated with asthma (24, 25).
Protein determination of MSR1, PHLDA1, and SERPINB2 was performed by Western blot because they were not soluble proteins or no ELISA commercial kit was available for their study. MSR1 was analyzed in 9 C and 18 NA patients (8 severe NA patients and 10 with moderate–mild diagnosis), PHLDA1 was studied in 8 C and 5 NA (3 severe and 2 moderate–mild patients), and we studied SERPINB2 in 6 C and 11 NA subjects (6 with severe asthma and 5 with moderate–mild diagnosis). The Western blot procedure used was that of the Invitrogen Western Breeze® Chemiluminescent Western Blot Immunodetection Kit (Life Technologies, Carlsbad, CA, USA) previously described (21). The primary antibody used to detect MSR1 was the rabbit anti-human polyclonal CD204/macrophage scavenger receptor I antibody (dilution 1:2,500) by ThermoFisher Scientific. PHLDA1 was detected with a rabbit anti-human polyclonal PHLDA1 antibody (Thermo Fisher Scientific) at a 1:500 dilution and SERPINB2 with the rabbit anti-human polyclonal SERPINB2 antibody by R&D Systems at a dilution of 1:250. Data of specific protein results were relative to β-Actin (dilution 1:1,000; Cell Signaling Techonology, Danvers, MA, USA) expression using the ImageQuant LAS 4000 (GE Healthcare Life Science).
The ROC curve plots sensitivity vs specificity and the area under the curve (AUC) is an effective measure of accuracy for evaluating the diagnostic ability of tests to discriminate the true state of subjects, finding optimal cutoff values. A ROC curve was performed for the candidate biomarkers of the NA group, examining severity and expression at the genetic and protein level. Four kinds of comparisons were performed: total NA group vs C group, severe NA patients vs C group, moderate–mild NA patients vs C group, and severe NA patients vs moderate–mild NA patients. As a guide for interpreting the ROC curves, the following intervals have been established for AUC values: 0.50–0.60, poor test; 0.61–0.75, regular test; 0.76–0.90, good test; 0.91–0.97, very good test; 0.98–1, excellent test. Besides, only the results with a CI 95% between 0.70 and 1 were considered statistically relevant.
The levels and relative expression of the proteins studied were compared among groups by unpaired t-test, using the Graph-Pad InStat 3 program. Statistical significance was established in two-tailed P value <0.05. The ROC curve analyses were performed by using the R program.
The demographic and clinical parameters of the population studied are summarized in Table 1. The NA patients were significantly older than the C subjects. The mean levels of total IgE were similar between the two groups, 75.02 ± 128.21 IU/ml in healthy control subjects vs 82.04 ± 80.63 IU/ml in NA patients (p>0.05). However, % FEV1 and % FVC showed statistically significant differences between severe NA vs moderate–mild NA patients (66.33 ± 16.62 vs 85.38 ± 21.03, P = 0.0127 in % FEV1; 69.93 ± 19.94 vs 94 ± 19.52, P = 0.0031 in % FVC) (data not shown). Percentage and number of eosinophils in the NA group were normal (3.83 ± 2.24 vs 273.86 ± 137.13 cells/μl) (cutoff: 1–4% and 50–450 cells/μl). No significant differences were found in the presence of eosinophils between severe and moderate–mild NA subjects (percentage: 3.73 ± 2.48 vs 4.22 ± 1.25%, respectively; number: 264 ± 152.96 vs 310 ± 52.57 cells/μl, respectively) (data not shown). Skin prick test against a panel of common allergens was negative in all the participants in this study. Concomitant diseases in the NA group were: nonatopic rhinitis (80%), sinusitis (56%), polyposis (33.3%), and esophageal reflux (20%).
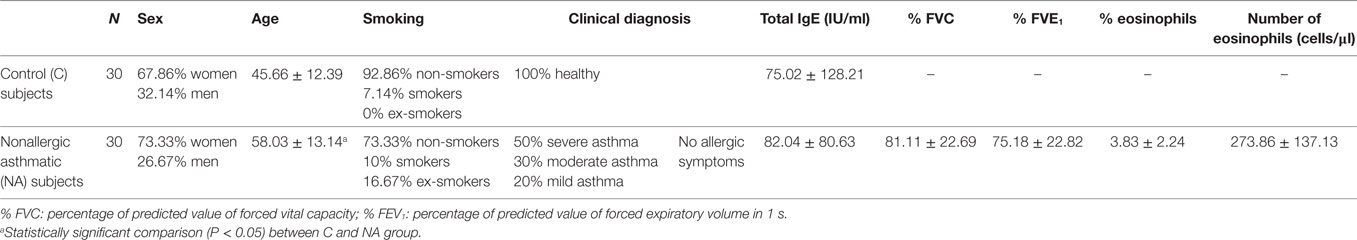
Table 1. Characteristics of the study population.
The genes studied were grouped into five categories based on the ROC curve analysis results (Table 2) (see Material and Methods).
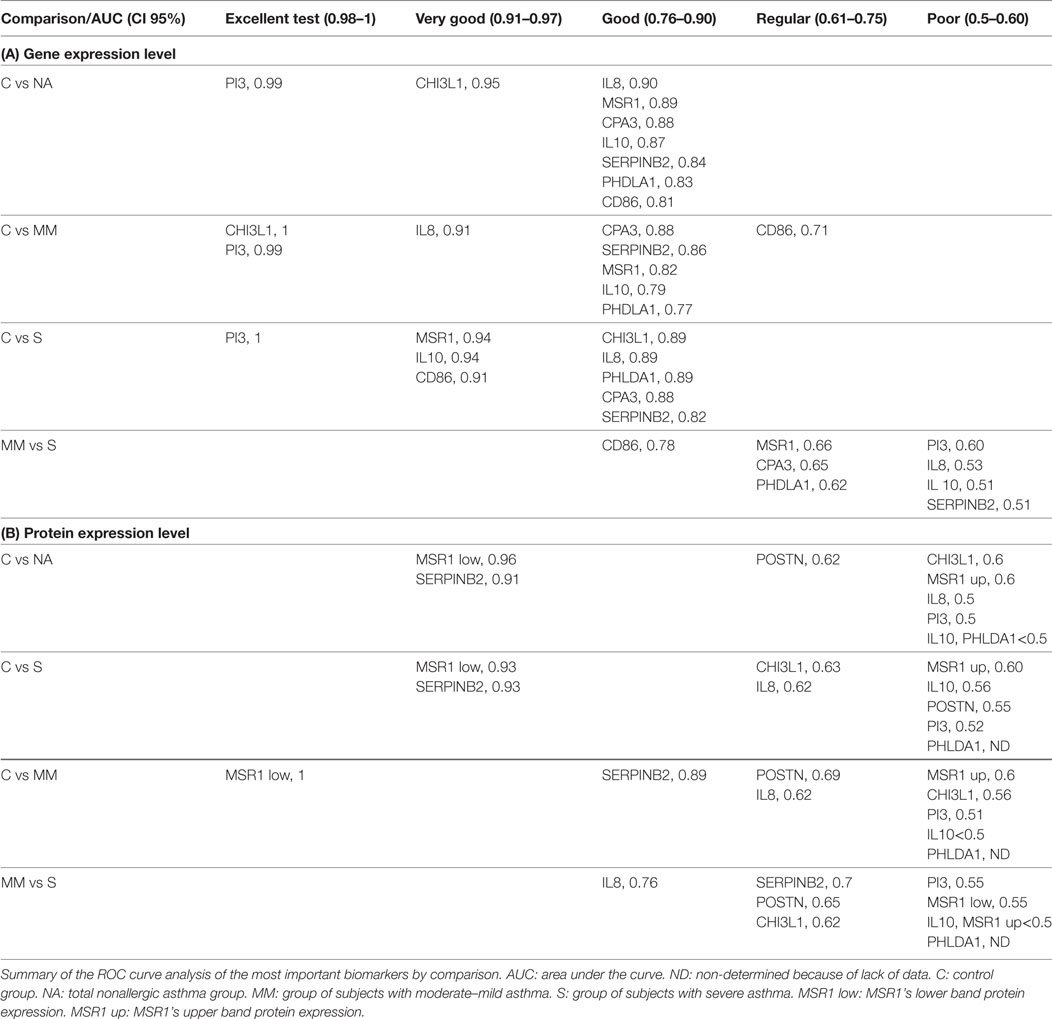
Table 2. Classification of biomarkers by the receiver operating characteristic (ROC) curves analysis.
Comparing the total subjects of the C and NA groups, we found that all genes fell into the “good” test category, except CHI3L1 and PI3 which obtained very good and excellent ratings, respectively. The results according to the severity of the NA group varied. When comparing C to moderate/mild NA subjects, MSR1, IL10, CPA3, PHLDA1, and SERPINB2 maintained their “good” status, while IL8 moved to a better ranking (very good), and CD86 lowered to “regular.” PI3 also maintained its excellent test position, joined by CHI3L1. The comparisons between C and severe NA patients differed from the overall analysis in some of the genes studied. While IL8, CPA3, PHLDA1, and SERPINB2 stayed in the good test category and PI3 continued to be excellent, MSR1, IL10, and CD86 moved up to the “very good” test position, and CHI3L1 was lowered to “good.”
CD86 was the only good biomarker for asthma-severity discrimination. The rest of the genes were found to be “regular” or “poor” for discriminating moderate–mild NA from severe NA patients.
SERPINB2 and PHLDA1 were quantified in the total protein extracted from PBMCs. Levels of IL-10, CHI3L1, PI3, and POSTN proteins were measured in the sera of the study population. Relative quantification and mean sera levels (expressed as pg/ml) are summarized in Figure 1. Only SERPINB2 and POSTN showed statistically significant differences. For SERPINB2, the control group (0.66 ± 0.31) had a higher expression than the total NA patients (0.11 ± 0.05, P < 0.0001). These differences were also shown when the C group was compared with the severe NA (0.13 ± 0.07, P = 0.0019) and moderate–mild NA (0.09 ± 0.03, P = 0.0029) groups. In contrast, the protein levels of POSTN were higher in the total NA group (18,679.59 ± 8,086.07 pg/ml), as well as in the severe (20,198.91 ± 7,859.24 pg/ml) and, in the moderate–mild NA patients (17,160.28 ± 7,930.59 pg/ml) compared to the C group (15,487.71 ± 6,532.85 pg/ml), but only in the severe asthma patients were the differences statistically significant.
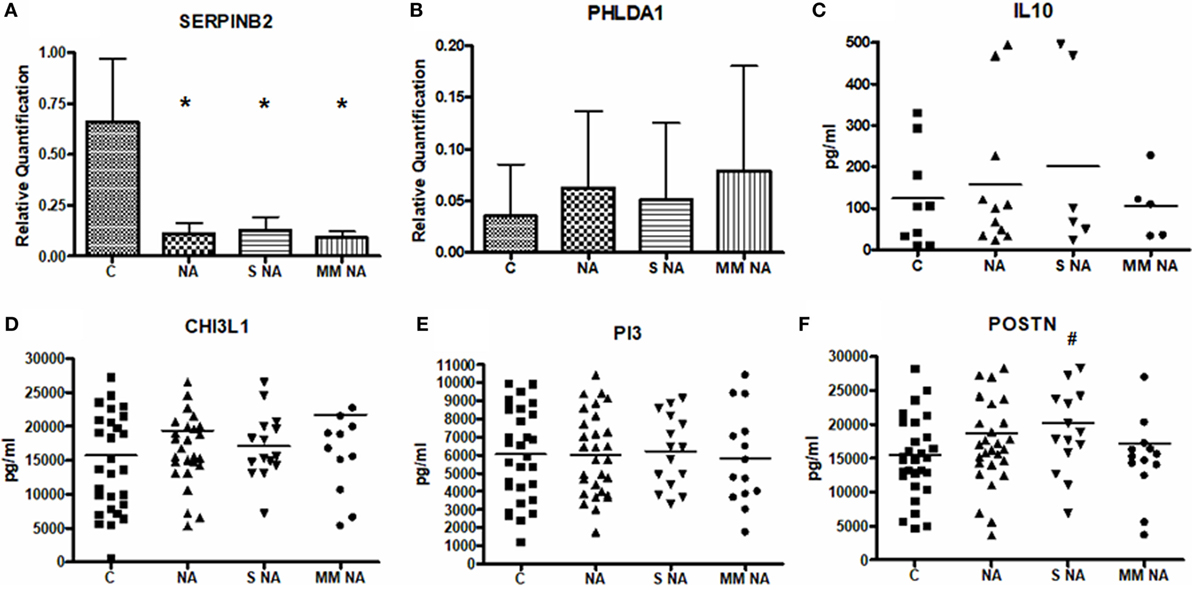
Figure 1. Mean levels of the protein expression. (A) Mean levels of SERPINB2. (B) Mean levels of PHLDA1. (C) Mean levels of IL10. (D) Mean levels of CHI3L1. (E) Mean levels of PI3. (F) Mean levels of POSTN. *Statistically significant comparison (P < 0.0001) between the C and the group selected. #Statistically significant comparison (P < 0.05) between the C and the group selected. Protein levels of SERPINB2 and PHLDA1 were measured by Western Blot in 6 C and 11 NA subjects (6 with severe asthma and 5 with moderate–mild diagnosis) and 8 C and 5 NA (3 severe and 2 moderate–mild patients), respectively. Densitometric analysis was done in individual blots (by the ImageQuant LAS 4000 software, as it is explained in Section “Materials and Methods”) using β-actin protein for normalization. IL-10, CHI3L1, PI3, and POSTN were quantified by ELISA in all the patients of the study population. Abbreviations: C, control group; NA, total nonallergic asthma group; S NA, group of subjects with severe asthma; MM NA, group of subjects with moderate–mild asthma.
Though there were no statistically significant differences in the other proteins studied, a tendency was observed when the NA patients were analyzed according to severity. The IL-10 levels were higher in severe (200.60 ± 219.85 pg/ml) diagnosed subjects compared to C subjects (123.38 ± 120.61 pg/ml) and to moderate–mild NA patients (105.27 ± 79.62 pg/ml). This same tendency was observed in PI3: severe NA group: 6,225.03 ± 1,999.11 pg/ml, moderate–mild NA group: 5,824.14 ± 2,624.29 pg/ml, and C subjects: 6,056.30 ± 2,535.83 pg/ml. In contrast, PHLDA1 and CHI3L1 showed the highest levels in moderate–mild NA patients (moderate–mild NA: 0.08 ± 0.10; severe NA: 0.05 ± 0.07; C: 0.04 ± 0.05 for PHLDA1; and moderate–mild NA: 21,702.56 ± 11,589.97 pg/ml; severe NA: 17,026.99 ± 4,845.20 pg/ml; C: 15,729.18 ± 8,576.85 pg/ml for CHI3L1). Protein expression of MSR1 and IL-8 were previously discussed (22). Briefly, IL-8 protein expression showed slight but non-significant differences between severe (505.49 ± 387.8 pg/ml) and moderate–mild (377.7 ± 338.27 pg/ml) NA patients; and for MSR1 two proteic bands were found by Western blot, with distinct behaviors. The lower molecular weight band showed statistical differences between C subjects and NA subjects.
The MSR1’s lower band and SERPINB2 were the best individual biomarkers at the protein level according to the ROC curve results (Table 2). These two biomarkers were classified as “very good” for comparing the whole group of NA and severe patients vs the control group. For discriminating the moderate–mild patients from controls, the MSR1’s lower band was “excellent” and SERPINB2 was “good.”
Overall, all other biomarkers fell into the “poor” or “regular” test category (Table 2). PI3, IL-10, and MSR1’s upper band would be considered poor biomarkers. The same was the case for CHI3L1 and IL-8, except when classifying severe NA patients and when discriminating moderate–mild from severe patients in the case of CHI3L1, and for IL-8 (when comparing moderate–mild and severe patients to healthy subjects), whose expression rose to “regular.” Additionally, IL-8 was able to discriminate moderate–mild from severe patients with a good AUC value (0.76). POSTN was classified as “regular” when comparing the total and the moderate–mild NA subjects and “poor” for the severe patients.
Given the poor results obtained in the individual ROC curve study of several biomarkers, an analysis of the AUC values combining two and three biomarkers was carried out.
The results of the analysis combining two proteins are summarized in Table 3. There was an improvement of the sensitivity and the specificity or synergy when several biomarkers were combined in the discrimination of total NA vs C groups (Table 3A): this is the case for MSR1’s upper band + MSR1’s lower band, CHI3L1 + MSR1’s upper band and POSTN + PHLDA1.
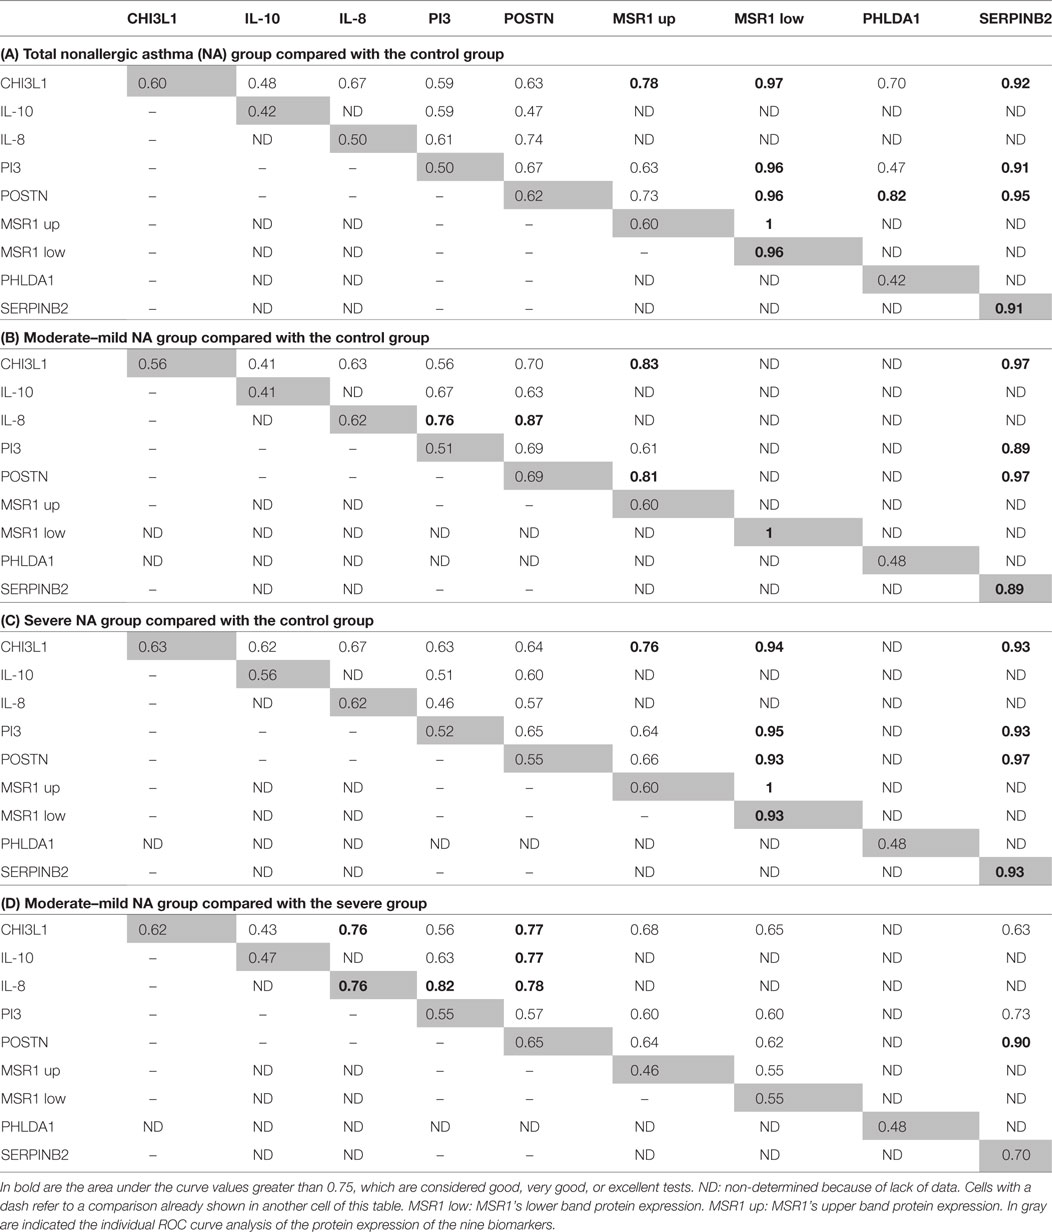
Table 3. Receiver operating characteristic (ROC) curve analyses of the protein expression combining two biomarkers.
When the analyses performed were comparing moderate–mild NA subjects and the C group (Table 3B), the results showed strong synergies between CHI3L1 + MSR1’s upper band, CHI3L1 + SERPINB2, IL-8 + PI3, IL-8 + POSTN, POSTN + MSR1’s upper band, and POSTN + SERPINB2. In the comparison of severe NA subjects (Table 3C) with C group, the improvement of the AUC values was observed in the MSR1’s upper band + MSR1’s lower band, CHI3L1 + MSR1’s lower band, and in POSTN + SERPINB2.
The combination of three biomarkers (Table 4) gave very interesting combinations, with AUC values over 0.75, meaning that good, very good, or excellent test were found for discriminating asthma and its severity from the control population. In the case of the total NA group (Table 4A), the following synergies were of great sensitivity and specificity: CHI3L1 + PI3 + MSR1’s upper band, CHI3L1 + POSTN + MSR1’s upper band, CHI3L1 + POSTN + PHLDA1, CHI3L1 + POSTN + SERPINB2, PI3 + POSTN + MSR1’s upper band, PI3 + POSTN + PHLDA1, and PI3 + POSTN + SERPINB2. The analysis of the moderate–mild NA patients compared with the C group (Table 4A) shared several combinations of biomarkers with the total NA group: CHI3L1 + PI3 + MSR1’s upper band, PI3 + POSTN + MSR1’s upper band, and PI3 + POSTN + SERPINB2, but particular of this comparison were CHI3L1 + IL-8 + PI3, CHI3L1 + IL-8 + POSTN, and IL-8 + PI3 + POSTN. The discrimination of severe patients from control subjects shared combinations of biomarkers with the other two comparisons. Important synergies were observed with PI3 + POSTN + MSR1’s upper band and PI3 + POSTN + MSR1’s lower band. As well as in the moderate–mild patients, CHI3L1 + IL-8 + PI3 was an interesting combination for discriminating severe subjects from C group.
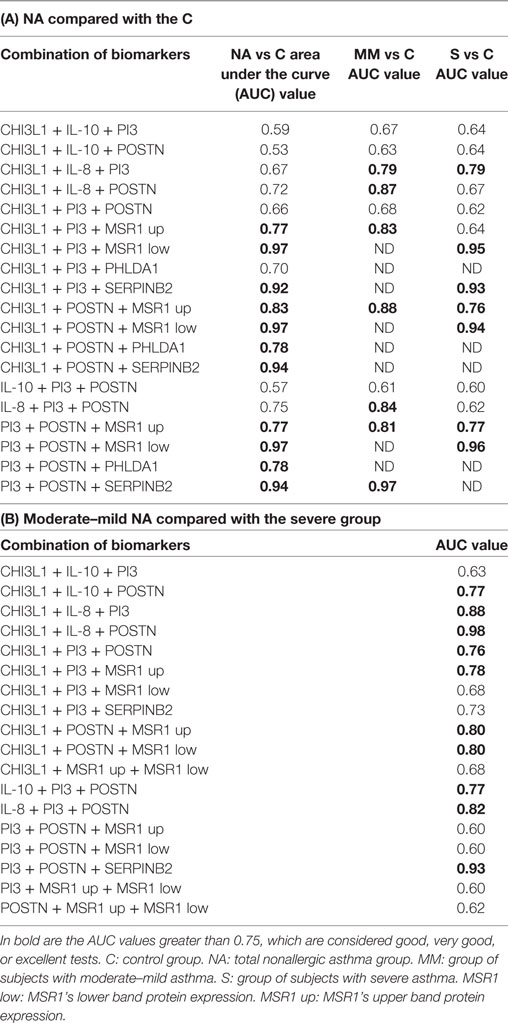
Table 4. Receiver operating characteristic (ROC) curve analysis of the protein expression combining three biomarkers.
The comparison between the moderate–mild NA and severe NA subjects was also performed (Table 2, Table 3D, and Table 4B). In the individual analysis, all the biomarkers were classified as “regular” or “poor,” except IL-8, whose AUC value was good. When two biomarkers were combined, the combinations of CHI3L1 + POSTN, IL10 + POSTN, IL-8 + PI3, and SERPINB2 + POSTN were good to discriminate severe from moderate–mild asthma, and of smaller importance was the grouping of IL-8 + POSTN. In the three-biomarker analysis, the list of important synergies is longer (Table 4B).
There was an improvement of the sensitivity and the specificity or synergy when several biomarkers were combined, obtaining very interesting combinations, with AUC values over 0.75, meaning that good, very good, or excellent test were found for discriminating phenotypic conditions. Bringing together all the results, we established a ranking of the best biomarkers or cluster of biomarkers able to discriminate each condition analyzed, with a predictive accuracy of at least very good (AUC > 0.75). These rankings are shown in Table 5. It is worth highlighting the permanent presence of POSTN in most of the combinations able to discriminate moderate–mild and severe NA patients, as well as the best combination for this discrimination, CHI3L1 + IL-8 + POSTN.
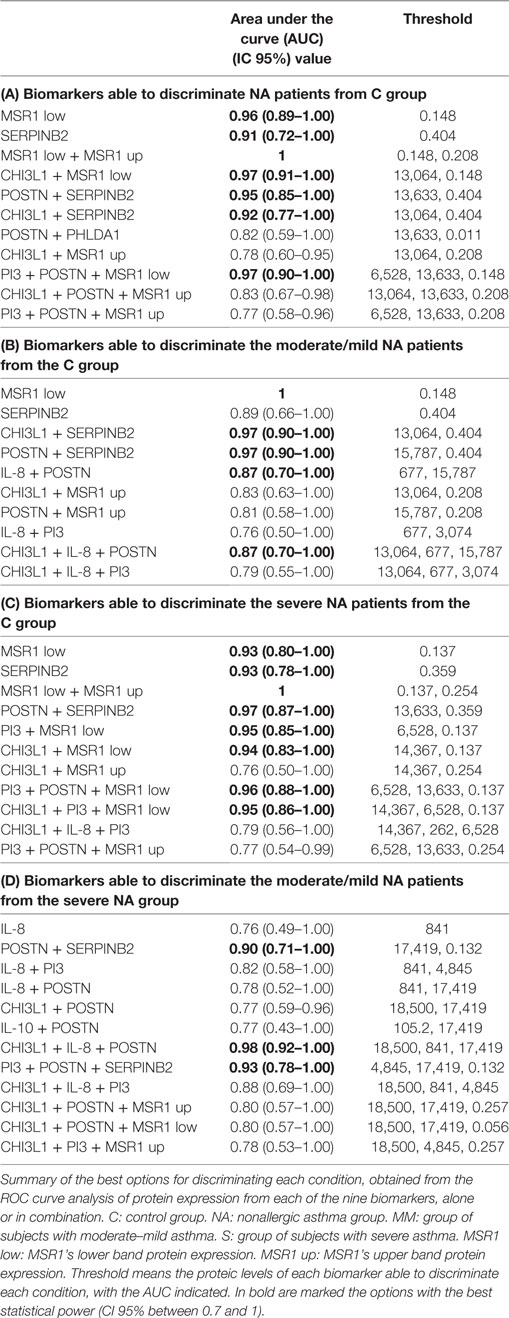
Table 5. Ranking of the best individual and combined proteic biomarkers for each discrimination.
There is a real need to improve the diagnosis and treatment of the asthmatic disease. Many efforts are being undertaken to define new biological therapies against specific targets that define asthma mediated by Th2 inflammation; however, a substantial number of asthmatic patients present low or non-Th2 inflammation. We recently defined a group of genes differentially expressed in peripheral samples from nonallergic asthmatic patients (low or non-Th2 inflammation) and some of them, mainly associated with the severity of these diseases. In this report, we further explore the relevance of the gene and protein expression of these potential biomarkers, through the analysis of their individual and/or combined expression, in order to demonstrate their ability to discriminate asthma disease and severity. This study seeks to provide different panels of biomarkers associated with NA disease that could be useful for the diagnosis and/or therapy of this phenotype of asthma.
The ideal biomarker should be sensitive, specific, simple to perform, non-invasive, and inexpensive if possible (26). In the present report, we have evaluated the potential of nine genes and proteins to serve as biomarkers using peripheral blood samples from healthy controls and nonallergic asthmatic patients. We first analyzed their ability to discriminate asthmatic patients from healthy controls; second, we examined their potential as biomarkers of the degree of severity, comparing severe and/or moderate–mild patients with healthy control subjects; and last, we studied their potential to discriminate severity from moderate–mild in nonallergic asthmatic disease. As summarized in Table 2, all the genes were able to discriminate any of the phenotypical condition (NA, severe NA, or mild/moderate NA) with AUC values from excellent to good (ranging from 1 to 0.77), with the only exception of CD86, which was the poor biomarker for discriminating moderate/mild NA patients from controls (AUC: 0.71). According to these data, PI3, CHI3L1, and IL8 are the best gene biomarkers (excellent or very good AUC) for discriminating NA from healthy control subjects, as well as for discriminating NA moderate/mild patients from control subjects. These results are in concordance with the recent description of the protective effect of PI3 against adult asthma (27). PI3 or Elafin, is a potent inhibitor of serine proteases, which plays a central role in controlling excessive activity of neutrophil elastase. It is a modulator of many parameters that are critical for inflammation, although it has pleiotropic effects (28). CHI3L1 or YKL-40 is thought to play a role in tissue inflammation and remodeling (29), and its role as a possible biomarker has been reviewed in YKL-40 regulated signaling mechanisms (30). Also, correlations between YKL-40 levels and neutrophilic inflammation have been described (31). Finally, IL8 (a member of the CXC chemokines) is considered to be one of the main mediators of the inflammatory response and very important for the survival and chemotaxis of neutrophils. It is secreted by several cell types and has been associated with several respiratory disorders (32).
These three biomarkers (PI3, CHI3L1, and IL8) are closely related to neutrophils, suggesting the relevance of this kind of cells in noneosinophilic nonallergic asthmatic disease and severity (data here cannot be demonstrated because neutrophils were not determined).
PI3, IL10, MSR1, and CD86 were the gene biomarkers that best discriminated controls from NA patients with severe clinical features. IL10 has pleiotropic effects in immunoregulation and inflammation (33). It has been extensively related with asthma and allergy diseases (34).
MSR1 or macrophage scavenger receptor type I, or CD204 has been described in many cell locations (usually in tissues), such as vascular smooth muscle cells, endothelial cells, human lung epithelial cells, etc. (35). This fact increases its pathophysiological potential, and has been described as a central pivot of health and disease (36). MSR1 was associated with asthma and was postulated by our group as a very good biomarker candidate for severity in several respiratory diseases (21).
CD86 or B7.2, encodes a type I membrane protein expressed on antigen-presenting cells (APCs) and which provides costimulatory signals necessary for the initiation, modulation, and regulation of an effective T cell response. Most APCs constitutively express low levels of CD86, but following activation they are rapidly upregulated (37). Interestingly, in this study, CD86 was the only gene biomarker capable of discriminating severe NA from moderate–mild NA patients, featuring a good AUC value (0.76). CD86 was followed by MSR1 (AUC: 0.66), CPA3 (0.65), and PHLDA1 (0.62), which were classified as regular biomarkers for this discrimination. CPA3 or carboxypeptidase A3, is a metalloexopeptidase specifically expressed by mast cells (38). CPA3 was described as the best individual discriminator for eosinophilic asthma in a study of six gene biomarkers in sputum (39). PHLDA1 is a nuclear protein that has been postulated as a biomarker in the early detection and/or therapy of gastric cancer (40), but never before has been associated with asthma disease. Overall, these gene analyses strengthen our previous results and evidence the potential of these nine gene biomarkers. For that, the next step was to determine the effectiveness of these biomarkers at the protein level using when it was available (IL-10, CHI3L1, IL-8, and PI3) the serum-ELISA as a quantitative assay that is commonly useful to analyze soluble biomarkers due to its sensitivity, specificity, and simplicity. On the other hand, although our gene expression results did not revealed POSTN as a differential gene, we decided to include the analysis of periostin levels in the serum, as it is one of the main biomarkers described as indicator of Th2-inflammation (41, 42) and the serum periostin levels have been related to the response to anti-IL-13 therapy in patients with moderate–mild asthma (43).
The individual protein biomarkers results are summarized in Table 2. MSR1’s lower band and SERPINB2 were the best individual biomarkers for discriminating the NA group and its severity from healthy control subjects. SERPINB2 is a member of the group of inhibitors of the serine protease family, enzymes that inhibit protease cathepsin G neutrophils and chymase of mast cells. SERPINB2 has been detected in different cell types, playing a role in inflammation and remodeling (44). It has been tentatively suggested that SERPINB2 represents a novel effector of the multiple airway remodeling actions provoked by IL-13 (45). It has been described, together with POSTN and chloride channel accessory 1, as a gene-signature for Th2 asthma and mainly IL-13 asthma phenotype (41), but until our knowledge, SERPINB2 protein expression has only been studied in broncoalveolar lavage (BAL) and never before at a peripheral level.
IL-8 was the only individual protein biomarker with a good predictive accuracy for discriminating clinical severity between moderate–mild vs severe patients (AUC: 0.76), although with a moderate statistical power (CI 95%, 0.49–1). These results could highlight the relevance of IL-8 and indirectly confirm the recent publication in BAL, describing that neutrophils and IL-8 are the only inflammatory components that distinguish controlled from uncontrolled asthma (46), but should be confirmed in a larger population. In this regard, novel small molecules targeting neutrophilic inflammation, such as chemokine (CXC) receptor 2 (CXCR2) antagonists have been analyzed in the noneosinophilic asthma context, showing how these antagonists reduce neutrophils, but do not improve clinical outcomes in studies to date (47). Ligands for the CXCR2 receptor include the chemokines CXCL8 (IL-8). Recent studies indicate that while selective CXCR2 antagonists were found to significantly lower airway neutrophil counts in a mechanistic 1-month pilot study in more severe asthmatics (48), a lack of efficacy was observed in a larger 6-month clinical Ph2 trial [n = 640] specifically targeting CXCR2/IL-8 pathway in this defined asthma population (49).
The next step was to analyze the change in the predictive results after combining two (Table 3A–D) or three biomarkers (Table 4A and B). Table 5 shows the global analyses, with the ranking of the best individual or combined biomarkers for each of the comparisons performed. Overall, we had very good AUC results, and here we propose four protein panels of individual biomarkers as well as different combinations of biomarkers for the diagnosis and/or prognosis of NA using peripheral samples and standard techniques. We would like to highlight the combination of CHI3L1 + IL-8 + POSTN for discriminating moderate–mild NA from severe NA (Table 5 and Table 4B), as this had the best AUC (0.98). Previously, serum concentrations of CHI3L1 were associated with the severity of asthma and were inversely correlated with lung function and FEV1 (50), indicating that serum CHI3L1 was important in the specific inflammatory phenotype of asthma. However, more recently it has been described in a large group of patients with asthma, that serum concentrations of CHI3L1 were only slightly increased in those with the most severe asthma (51). Interestingly, contrasting with those previous results, in this study CHI3L1 protein levels were higher in moderate–mild patients compared with severe asthmatic patients (Figure 1), and, together with the levels of IL-8 and periostin, could be tested in an easy and reproducible ELISA to verify predictable disease severity in nonallergic patients. Although these results are very encouraging, we believe they should be tested in larger populations, with the same age-range and by different groups in order to test their reproducibility and to validate them.
In summary, in this work we have tried to define the relevance at gene and protein level of a set of biomarkers in peripheral samples. Our ultimate objective is to provide new and useful diagnostic and therapeutic tools for NA.
SB, DC, and BC have worked in all project-steps: design of study, experimental work, results discussion, and manuscript elaboration. LC-J collaborated in the manuscript elaboration. JS, CP, JQ, and FF performed the patient’s selection and collaborated in the design of study. CL has collaborated in design of study, results discussion, and manuscript elaboration.
The authors declare that they have no conflicts of interest. The data published in this report are being evaluated for protection (Request Number: P201730947).
This work was supported in part by research grants supported in part by research grants PI13/01730 and PI17/01682, cofinanced by FEDER, CIBERES (ISCIII, 0013), and RETIC (RD09/0076/00101) from the Fondo de Investigación Sanitaria (Ministerio de Sanidad y Consumo, Spain). SB was supported by Fundación Conchita Rábago. DC was supported by a contract from Comunidad de Madrid (PEJD-2016/BMD-2682, Sistema de Garantía Juvenil), and LC-J was supported by a contract from MINECO (PEJ-2014-A-31609, Sistema de Garantía Juvenil), both cofinanced by Fondo Social Europeo (FSE) and Iniciativa de Empleo Juvenil (IEJ). We are also grateful to Oliver Shaw for revising the manuscript for English usage and style and to I. Mahillo for his statistical support.
1. GINA. Global Initiative for Asthma. Global Strategy for Asthma Management and Prevention. (2017). Available from: http://www.ginasthma.org/
2. Mukherjee AB, Zhang Z. Allergic asthma: influence of genetic and environmental factor. J Biol Chem (2011) 286:32883–9. doi:10.1074/jbc.R110.197046
3. Collins FS, Varmus H. A new initiative on precision medicine. N Engl J Med (2015) 372:793–5. doi:10.1056/NEJMp1500523
4. D’Amato G, Stanziola A, Sanduzzi A, Liccardi G, Salzillo A, Vitale C, et al. Treating severe allergic asthma with anti-IgE monoclonal antibody (omalizumab): a review. Multidiscip Respir Med (2014) 9:23. doi:10.1186/2049-6958-9-23
5. Holgate ST. Stratified approaches to the treatment of asthma. Br J Clin Pharmacol (2012) 76:277–91. doi:10.1111/bcp.12036
6. Peters SP. Asthma phenotypes: nonallergic (intrinsic) asthma. J Allergy Clin Immunol Pract (2014) 2:650–2. doi:10.1016/j.jaip.2014.09.006
7. Novak N, Bieber T. Allergic and nonallergic forms of atopic diseases. J Allergy Clin Immunol (2003) 112:252–62. doi:10.1067/mai.2003.1595
8. Green BJ, Wiriyachaiporn S, Grainge C, Rogers GB, Kehagia V, Lau L, et al. Potentially pathogenic airway bacteria and neutrophilic inflammation in treatment resistant severe asthma. PLoS One (2014) 9(6):e100645. doi:10.1371/journal.pone.0100645
9. Uddin M, Nong G, Ward J, Seumois G, Prince LR, Wilson SJ, et al. Prosurvival activity for airway neutrophils in severe asthma. Thorax (2010) 65:684–9. doi:10.1136/thx.2009.120741
10. Peters MC, Mekonnen ZK, Yuan S, Bhakta NR, Woodruff PG, Fahy JV. Measures of gene expression in sputum cells can identify TH2-high and TH2-low subtypes of asthma. J Allergy Clin Immunol (2014) 133:388–94. doi:10.1016/j.jaci.2013.07.036
11. Green RH, Brightling CE, Woltmann G, Parker D, Wardlaw AJ, Pavord ID. Analysis of induced sputum in adults with asthma: identification of subgroup with isolated sputum neutrophilia and poor response to inhaled corticosteroids. Thorax (2002) 57:875–9. doi:10.1136/thorax.57.10.875
12. Bullens DM, Truyen E, Coteur L, Dilissen E, Hellings PW, Dupont LJ, et al. IL-17 mRNA in sputum of asthmatic patients: linking T cell driven inflammation and granulocytic influx? Respir Res (2006) 7:135. doi:10.1186/1465-9921-7-135
13. Simpson JL, Gibson PG, Yang IA, Upham J, James A, Reynolds PN, et al. Impaired macrophage phagocytosis in non-eosinophilic asthma. Clin Exp Allergy (2013) 43:29–35. doi:10.1111/j.1365-2222.2012.04075.x
14. Raedler D, Ballenberger N, Klucker E, Böck A, Otto R, Prazeres da Costa O, et al. Identification of novel immune phenotypes for allergic and nonallergic childhood asthma. J Allergy Clin Immunol (2015) 135:81–91. doi:10.1016/j.jaci.2014.07.046
15. Boyman O, Kaegi C, Akdis M, Bavbek S, Bossios A, Chatzipetrou A, et al. EAACI IG biologicals task force paper on the use of biologic agents in allergic disorders. Allergy (2015) 70:727–54. doi:10.1111/all.12616
16. Radonjic-Hoesli S, Valent P, Klion AD, Wechsler ME, Simon HU. Novel targeted therapies for eosinophil-associated diseases and allergy. Annu Rev Pharmacol Toxicol (2015) 55:633–56. doi:10.1146/annurev-pharmtox-010814-124407
17. Singh D, Ravi A, Southworth T. CRTH2 antagonists in asthma: current perspectives. Clin Pharmacol (2017) 15:165–73. doi:10.2147/CPAA.S119295
18. Bateman ED, O’Brien C, Rugman P, Luke S, Ivanov S, Uddin M. Efficacy and safety of the CRTh2 antagonist AZD1981 as add-on therapy to inhaled corticosteroids and long-acting β2-agonists in patients with atopic asthma. Drug Des Devel Ther (2018) 4:1093–106. doi:10.2147/DDDT.S147389
19. Bateman ED, Guerreros AG, Brockhaus F, Holzhauer B, Pethe A, Kay RA, et al. Fevipiprant, an oral prostaglandin DP2 receptor (CRTh2) antagonist, in allergic asthma uncontrolled on low-dose inhaled corticosteroids. Eur Respir J (2017) 50(2). doi:10.1183/13993003.00670-2017
20. Muraro A, Lemanske RF, Hellings PW, Akdis CA, Bieber T, Casale TB, et al. Precision medicine in patients with allergic diseases: airway diseases and atopic dermatitis—PRACTALL document of the European Academy of Allergy and Clinical Immunology and the American Academy of Allergy, Asthma & Immunology. J Allergy Clin Immunol (2016) 137:1347–58. doi:10.1016/j.jaci.2016.03.010
21. Baos S, Calzada D, Cremades L, Sastre J, Quiralte J, Florido F, et al. Data set on a study of gene expression in peripheral samples to identify biomarkers of severity of allergic and nonallergic asthma. Data Brief (2016) 10:505–10. doi:10.1016/j.dib.2016.12.035
22. Baos S, Calzada D, Cremades L, Sastre J, Quiralte J, Florido F, et al. Biomarkers associated with disease severity in allergic and nonallergic asthma. Mol Immunol (2017) 82:34–45. doi:10.1016/j.molimm.2016.12.012
23. GEMA (Guía española del manejo del asma). Arch Bronconeumol (2009) 45:2–35. doi:10.1016/S0300-2896(09)73459-3
24. Jia G, Erickson RW, Choy DF, Mosesova S, Wu LC, Solberg OD, et al. Periostin a systemic biomarker of eosinophilic airway inflammation in asthmatic patients. J Allergy Clin Immunol (2012) 130:647–54. doi:10.1016/j.jaci.2012.06.025
25. Parulekar AD, Atik MA, Hanania NA. Periostin, a novel biomarker of Th2-driven asthma. Curr Opin Pulm Med (2014) 20:60–5. doi:10.1097/MCP.0000000000000005
26. Gao J, Garulacan LA, Storm SM, Opiteck GJ, Dubaquie Y, Hefta SA, et al. Biomarker discovery in biological fluids. Methods (2005) 35:291–302. doi:10.1016/j.ymeth.2004.08.020
27. Tsai YS, Tseng YT, Chen PS, Lin MC, Wu CC, Huang MS, et al. Protective effects of elafin against adult asthma. Allergy Asthma Proc (2016) 37:15–24. doi:10.2500/aap.2016.37.3932
28. Verrier T, Solhonne B, Sallenave JM, García-Verdugo I. The WAP protein Trappin-2/Elafin: a handyman in the regulation of inflammatory and immune responses. Int J Biochem Cell Biol (2012) 44:1377–80. doi:10.1016/j.biocel.2012.05.007
29. Lee CG, Da Silva CA, De la Cruz CS, Ahangari F, Ma B, Kang MJ, et al. Role of chitin and chitinase/chitinase-like proteins in inflammation, tissue remodeling, and injury. Annu Rev Physiol (2011) 73:479–501. doi:10.1146/annurev-physiol-012110-142250
30. Prakash M, Bodas M, Prakash D, Nawani N, Khetmalas M, Mandal A, et al. Diverse pathological implications of YKL-40: answers may lie in ‘outside-in’ signaling. Cell Signal (2013) 25:1567–73. doi:10.1016/j.cellsig.2013.03.016
31. Hinks TS, Brown T, Lau LC, Rupani H, Barber C, Elliott S, et al. Multidimensional endotyping in patients with severe asthma reveals inflammatory heterogeneity in matrix metalloproteinases and chitinase 3-like protein 1. J Allergy Clin Immunol (2016) 138:61–75. doi:10.1016/j.jaci.2015.11.020
32. Allen TC, Kurdowska A. Interleukin 8 and acute lung injury. Arch Pathol Lab Med (2014) 138:266–9. doi:10.5858/arpa.2013-0182-RA
33. Mingomataj EC, Bakiri AH. Regulator versus effector paradigm: interleukin-10 as indicator of the switching response. Clin Rev Allergy Immunol (2016) 50:97–113. doi:10.1007/s12016-015-8514-7
34. Palomares O, Martín-Fontecha M, Lauener R, Traidl-Hoffmann C, Cavkaytar O, Akdis M, et al. Regulatory T cells and immune regulation of allergic diseases: roles of IL-10 and TGF-β. Genes Immun (2014) 15:511–20. doi:10.1038/gene.2014.45
35. Tomokiyo R, Jinnouchi K, Honda M, Wada Y, Hanada N, Hiraoka T, et al. Production, characterization, and interspecies reactivities of monoclonal antibodies against human class A macrophage scavenger receptors. Atherosclerosis (2002) 161:123–32. doi:10.1016/S0021-9150(01)00624-4
36. Kelley JL, Ozment TR, Li C, Schweitzer JB, Williams DL. Scavenger receptor-A (CD204): a two-edged sword in health and disease. Crit Rev Immunol (2014) 34:241–61. doi:10.1615/CritRevImmunol.2014010267
37. Sharpe AH, Freeman GJ. The B7-CD28 superfamily. Nat Rev Immunol (2002) 2:116–26. doi:10.1038/nri727
38. Trivedi NN, Caughey GH. Mast cell peptidase: chameleons of innate immunity and host defense. Am J Respir Cell Mol Biol (2010) 42:257–67. doi:10.1165/rcmb.2009-0324RT
39. Baines KJ, Simpson JL, Wood LG, Scott RJ, Fibbens NL, Powell H, et al. Sputum gene expression signature of 6 biomarkers discriminates asthma inflammatory phenotypes. J Allergy Clin Immunol (2014) 133:997–1007. doi:10.1016/j.jaci.2013.12.1091
40. Zhao P, Lu Y, Liu L. Correlation of decreased expression of PHLDA1 protein with malignant phenotype of gastric adenocarcinoma. Int J Clin Exp Pathol (2015) 8:5230–5.
41. Woodruff PG, Modrek B, Choy DF, Jia G, Abbas AR, Ellwanger A, et al. T-helper type 2-driven inflammation defines major subphenotypes of asthma. Am J Respir Crit Care Med (2009) 180:388–95. doi:10.1164/rccm.200903-0392OC
42. Woodruff PG, Boushey HA, Dolganov GM, Barker CS, Yang YH, Donnelly S, et al. Genome-wide profiling identifies epithelial cell genes associated with asthma and with treatment response to corticosteroids. Proc Natl Acad Sci U S A (2007) 104:15858–63. doi:10.1073/pnas.0707413104
43. Corren J, Lemanske RF, Hanania NA, Korenblat PE, Parsey MV, Arron JR, et al. Lebrikizumab treatment in adults with asthma. N Engl J Med (2011) 365:1088–98. doi:10.1056/NEJMoa1106469
44. Swartz JM, Byström J, Dyer KD, Nitto T, Wynn TA, Rosenberg HF. Plasminogen activator inhibitor-2 (PAI-2) in eosinophilic leukocytes. J Leukoc Biol (2004) 76:812–9. doi:10.1189/jlb.0304182
45. Cohn L, Elias JA, Chupp GL. Asthma: mechanisms of disease persistence and progression. Annu Rev Immunol (2004) 22:789–815. doi:10.1146/annurev.immunol.22.012703.104716
46. Hosoki K, Ying S, Corrigan C, Qi H, Kurosky A, Jennings K, et al. Analysis of a panel of 48 cytokines in BAL fluids specifically identifies IL-8 levels as the only cytokine that distinguishes controlled asthma from uncontrolled asthma, and correlates inversely with FEV1. PLoS One (2015) 10(5):e0126035. doi:10.1371/journal.pone.0126035
47. Thomson NC. Novel approaches to the management of noneosinophilic asthma. Ther Adv Respir Dis (2016) 10:211–34. doi:10.1177/1753465816632638
48. Watz H, Uddin M, Pedersen F, Kirsten A, Goldmann T, Stellmacher F, et al. Effects of the CXCR2 antagonist AZD5069 on lung neutrophil recruitment in asthma. Pulm Pharmacol Ther (2017) 45:121–3. doi:10.1016/j.pupt.2017.05.012
49. O’Byrne PM, Metev H, Puu M, Richter K, Keen C, Uddin M, et al. Efficacy and safety of a CXCR2 antagonist, AZD5069, in patients with uncontrolled persistent asthma: a randomised, double-blind, placebo-controlled trial. Lancet Respir Med (2016) 4:797–806. doi:10.1016/S2213-2600(16)30227-2
50. Chupp GL, Lee CG, Jarjour N, Shim YM, Holm CT, He S, et al. A chitinase-like protein in the lung and circulation of patients with severe asthma. N Engl J Med (2007) 357:2016–27. doi:10.1056/NEJMoa073600
Keywords: biomarkers, gene expression, nonallergic asthma, protein expression, severity, receiver operating characteristic
Citation: Baos S, Calzada D, Cremades-Jimeno L, Sastre J, Picado C, Quiralte J, Florido F, Lahoz C and Cárdaba B (2018) Nonallergic Asthma and Its Severity: Biomarkers for Its Discrimination in Peripheral Samples. Front. Immunol. 9:1416. doi: 10.3389/fimmu.2018.01416
Received: 07 March 2018; Accepted: 06 June 2018;
Published: 21 June 2018
Edited by:
Natalia V. Rivera, Karolinska Institutet (KI), SwedenReviewed by:
Giuseppina Ruggiero, Università degli Studi di Napoli Federico II, ItalyCopyright: © 2018 Baos, Calzada, Cremades-Jimeno, Sastre, Picado, Quiralte, Florido, Lahoz and Cárdaba. This is an open-access article distributed under the terms of the Creative Commons Attribution License (CC BY). The use, distribution or reproduction in other forums is permitted, provided the original author(s) and the copyright owner are credited and that the original publication in this journal is cited, in accordance with accepted academic practice. No use, distribution or reproduction is permitted which does not comply with these terms.
*Correspondence: Blanca Cárdaba, YmNhcmRhYmFAZmpkLmVz
Disclaimer: All claims expressed in this article are solely those of the authors and do not necessarily represent those of their affiliated organizations, or those of the publisher, the editors and the reviewers. Any product that may be evaluated in this article or claim that may be made by its manufacturer is not guaranteed or endorsed by the publisher.
Research integrity at Frontiers
Learn more about the work of our research integrity team to safeguard the quality of each article we publish.