 Shuxian Wu1,2
 Jingru Zhang1,2
 Binghua Liu1,2
 Yajuan Huang1,2
 Siping Li1,2
 Haishen Wen1,2Meizhao Zhang1,2Jifang Li1,2
 Yun Li1,2
 Feng He1,2*
- 1The Key Laboratory of Mariculture, Ministry of Education, Ocean University of China, Qingdao, China
- 2Fisheries College, Ocean University of China, Qingdao, China
Long noncoding RNAs (lncRNAs) play an important role in many life activities, but the expression pattern and function of lncRNAs in Japanese flounder skeletal muscle are unclear. In this study, 751 lncRNAs were selected from skeletal muscle in different development stages of the Japanese flounder [stage A: larval 7 days post hatching (dph); stage B: juvenile about 90 dph; stage C (female) and stage D (male): adult about 24 months] using coding potential analysis methods. In total, 232, 211, 194, 28, 29, and 14 differentially expressed lncRNAs and 9549, 8673, 9181, 1821, 1080, and 557 differentially expressed mRNAs were identified in comparisons of A versus B, A versus C, A versus D, B versus C, B versus D, and C versus D, respectively. We identified the cis- and trans-regulatory target genes of differentially expressed lncRNAs, and lncRNA–gene interaction networks were constructed using the Cytoscape program. In total, there were 200, 200, 200, 93, 47, and 11 cis-regulation relationships, and 29, 19, 24, 38, 8, and 47 trans-regulation relationships in the comparisons between A versus B, A versus C, A versus D, B versus C, B versus D, and C versus D, respectively. These results indicate that lncRNA may participate in the development of Japanese flounder skeletal muscle through cis- or trans-acting mechanisms, thus providing a scientific basis for further study of the biological function of lncRNA in Japanese flounder skeletal muscle. Based on these relationships, functional annotation of the related lncRNAs was performed by gene ontology and Kyoto Encyclopedia of Genes and Genomes (KEGG) enrichment analysis. Differentially expressed genes associated with muscle development were enriched in multiple pairs of comparisons (e.g., differentially expressed genes LOC109640370, LOC109634180, LOC109643555, rusc1, and LOC109626999 were enriched in the actin-binding term, and differentially expressed genes LOC109640370, was, LOC109644970, LOC109643555, and itga9 were enriched in the regulation of the actin cytoskeleton pathway in the KEGG pathway analysis in the comparison of stages C and D). We predicted lncRNA–mRNA, miRNA–mRNA, and lncRNA–miRNA regulatory relationships and constructed interactive networks using Cytoscape software. Co-expression networks show that most lncRNAs interact with one or two predicted miRNAs involved in muscle growth and development. These results provide a basis for further study of the function of lncRNAs on skeletal muscle in different developmental stages of Japanese flounder.
Introduction
LncRNAs are defined as transcripts that are more than 200 nucleotides in length and are not translated into proteins (Perkel, 2013). This length limitation distinguishes long ncRNAs from small noncoding RNAs, such as microRNAs (miRNAs), small interfering RNAs (siRNAs), Piwi interacting RNAs (piRNAs), small nucleolar RNAs (snoRNAs), and other short RNAs (Lina et al., 2013). Note that only one fifth of transcriptions are associated with protein-coding genes in the human genome (Philipp et al., 2007). Large-scale cDNA library sequencing and transcriptome sequencing indicate that tens of thousands of intergenic sites are transcribed to noncoding RNAs in mammals. Approximately 78% of lncRNAs are tissue specific, and only ∼19% of mRNAs are tissue specific (Cabili et al., 2011). At present, more and more lncRNAs have been found in mammals, such as humans (Pieter-Jan et al., 2013; Iyer et al., 2015), mice (Phillip et al., 2013; Lv et al., 2015), and sheep (Bakhtiarizadeh et al., 2016) as well as in plants, such as rice (Zhang et al., 2014). It has been reported that lncRNA plays an important role in the regulation of gene transcription (Goodrich and Kugel, 2006), post-transcriptional regulation (Ming-De et al., 2005), epigenetic regulation (Mercer and Mattick, 2013; Morlando et al., 2014), and aging and disease (Lukiw et al., 1992). Although there is growing evidence that most of them may be functional (Mercer et al., 2009), only a relatively small proportion has been shown to be biologically relevant.
Skeletal muscle is a striated muscle tissue composed of muscle cells with contractile capacity. It is well known that the fetal stage is the main stage of skeletal muscle development, and there is no net increase in the number of muscle fibers after birth (Nishina et al., 2003). Muscle development is a complex process that requires interactions between multiple factors (Buckingham, 2006). At present, studies on skeletal muscle growth and development generally focus on the expression and function of related coding genes (Thomas and Mathias, 2011; Eng et al., 2013). The skeletal muscle fiber phenotype is regulated by various independent signaling pathways, including the mitogen-activated protein kinase (MAPK) pathway (Keren et al., 2006), calcineurin (Naya et al., 2000), calcium/calmodulin-dependent protein kinase IV (Takayuki et al., 2004), and the peroxisome proliferator γ coactivator 1 (PGC-1) (Handschin et al., 2003). Studies show that some miRNAs are also involved in the development of skeletal muscle (Tang et al., 2015; Jebessa et al., 2018). Several recent studies show that lncRNAs also play a crucial role in skeletal muscle development (Zhan et al., 2016; Liang et al., 2017; Zhou et al., 2018). In addition, lncRNAs can interact as a competitive endogenous RNA (ceRNA) with miRNAs involved in the regulation of target gene expression, thereby regulating muscle development (Cesana et al., 2011).
Japanese flounder is a valuable marine fish and an important economic fish for marine aquaculture in Asia. Therefore, it is important to reveal the molecular mechanisms of Japanese flounder skeletal muscle formation and development. Studies show that some coding genes play important roles during the development of Japanese flounder skeletal muscle (Huang et al., 2018; Wu et al., 2018). In addition, some studies focus on the effects of noncoding RNA on skeletal muscle development of Japanese flounder. Some micRNAs (mir-1, mir-133, mir-206) play an important role in muscle development during Japanese flounder metamorphosis (Fu et al., 2011, 2012). However, information on lncRNAs related to skeletal muscle development in the Japanese flounder is still limited.
In this study, we used the Illumina HiSeq 2500 platform to identify lncRNAs and mRNAs involved in skeletal muscle development in Japanese flounder. Our study provides useful information for further study of the function of lncRNA during skeletal muscle development in a fish species, and these results will help study skeletal muscle development from the perspective of noncoding RNAs.
Materials and Methods
Ethics Statement
The study was approved by the respective Animal Research and Ethics Committees of Ocean University of China. The field studies did not involve endangered or protected species. The fish were all euthanized by tricaine methanesulfonate (MS-222) prior to experimentation.
Experimental Animal Collection
Japanese flounder were collected from the Donggang District Institute of marine treasures in Rizhao, Shandong province. The fish were transported to the Ocean University of China and temporarily reared in a 500-L white bucket for 24 h. The Japanese flounder were collected at various stages: larval 7 days post hatching (dph) (stage A), juvenile ∼90 dph (stage B), female adult ∼24 months (stage C), and male adult ∼24 months. In our experiment and data analysis, 3 fish were used in all stages except for stage A (here fish were very small in size, so ∼50 individuals were combined and considered to be one sample). All fish were euthanized with MS-222, and tissue samples were collected. In stage A, we used a microscope to cut off redundant tissue and only retain muscle tissue. Samples were immediately frozen in liquid nitrogen and then stored at −80°C until further processing.
Illumina Deep Sequencing and Sequence Analysis
Total RNA for RNA sequencing (RNA-seq) was extracted using TRIzol Reagent (Invitrogen, Carlsbad, CA, United States) according to the manufacturer’s protocol. The concentration of RNA was quantified by the nucleic acid analyzer Biodropsis BD-1000 (OSTC, China) and the integrity by agarose gel electrophoresis examination. Ribosomal RNA (rRNA) was removed from the total RNA using the Epicenter Ribo-ZeroTM rRNA Removal Kit (Epicenter, Madison, WI, United States) following the manufacturer’s instructions. The constructed cDNA library was quality tested on an Agilent Bioanalyzer 2100 system, and then high-throughput sequencing was performed on the Illumina HiSeqTM 2500 platform. The paired-end sequencing raw reads were cleared by removing reads containing adapters, including ploy-N reads and low-quality reads to obtain clean reads. At the same time, the Phred score (Q20), Q30, and GC contents of the clean data were calculated. All the downstream analyses were based on the high-quality clean data. The clean reads were mapped to the Japanese flounder reference genome1 using the Tophat2 software.
Reconstructing transcripts for clean readings was based on probabilistic models using Cufflinks 2.0.2 software. Based on the characteristics of lncRNA, we used a rigorous three-step screening method to obtain candidate lncRNAs (Figure 1A). First, Cuffcompare software was used to screen out transcripts that were perfectly matched or similar to other ncRNAs, mRNAs, etc., while clarifying the location type of the remaining transcripts. We then retained transcripts annotated as “i” (intergenic lncRNA), “u” (intronic lncRNA), “x” (anti-sense lncRNA), and “o” (sense-overlapping lncRNA) by screening for candidate lncRNA transcripts. Second, single-exon transcripts and transcripts < 200 bp long were removed. Finally, we used four analytical tools, including CPC (encoding potential calculator) (Lei et al., 2007), CNCI (coding-non-coding-index) (Liang et al., 2013), Pfam Scan (Finn et al., 2014), and PLEK (Li et al., 2014) to predict the coding potential of the transcripts. CPC score ≤ 0, CNCI score ≤ 0, Pfam: E-value ≤ 0.001, and coding_potential_score ≤ 0 were conditions for screening lncRNA. The transcript expression levels were calculated using the fragments per kb per million (FPKM) reads method, which is the number of fragments per kilobase length from a gene per million fragments. The transcript differential expression was calculated according to the negative binomial distribution test in the DESeq (Anders and Huber, 2012) software2. Transcripts with p < 0.05 and | (fold change) | ≥ 2 were designated as differentially expressed. The sequencing data obtained from RNA-seq were released to the National Center for Biotechnology Information (NCBI) Sequence Read Archive (SRA) database under the accession numbers SRR12102079, SRR12102078, SRR12102077, SRR12102076, SRR12102075, SRR12102074, SRR12102073, SRR12102072, SRR12102071, SRR12102070, SRR12102069, and SRR12102068.
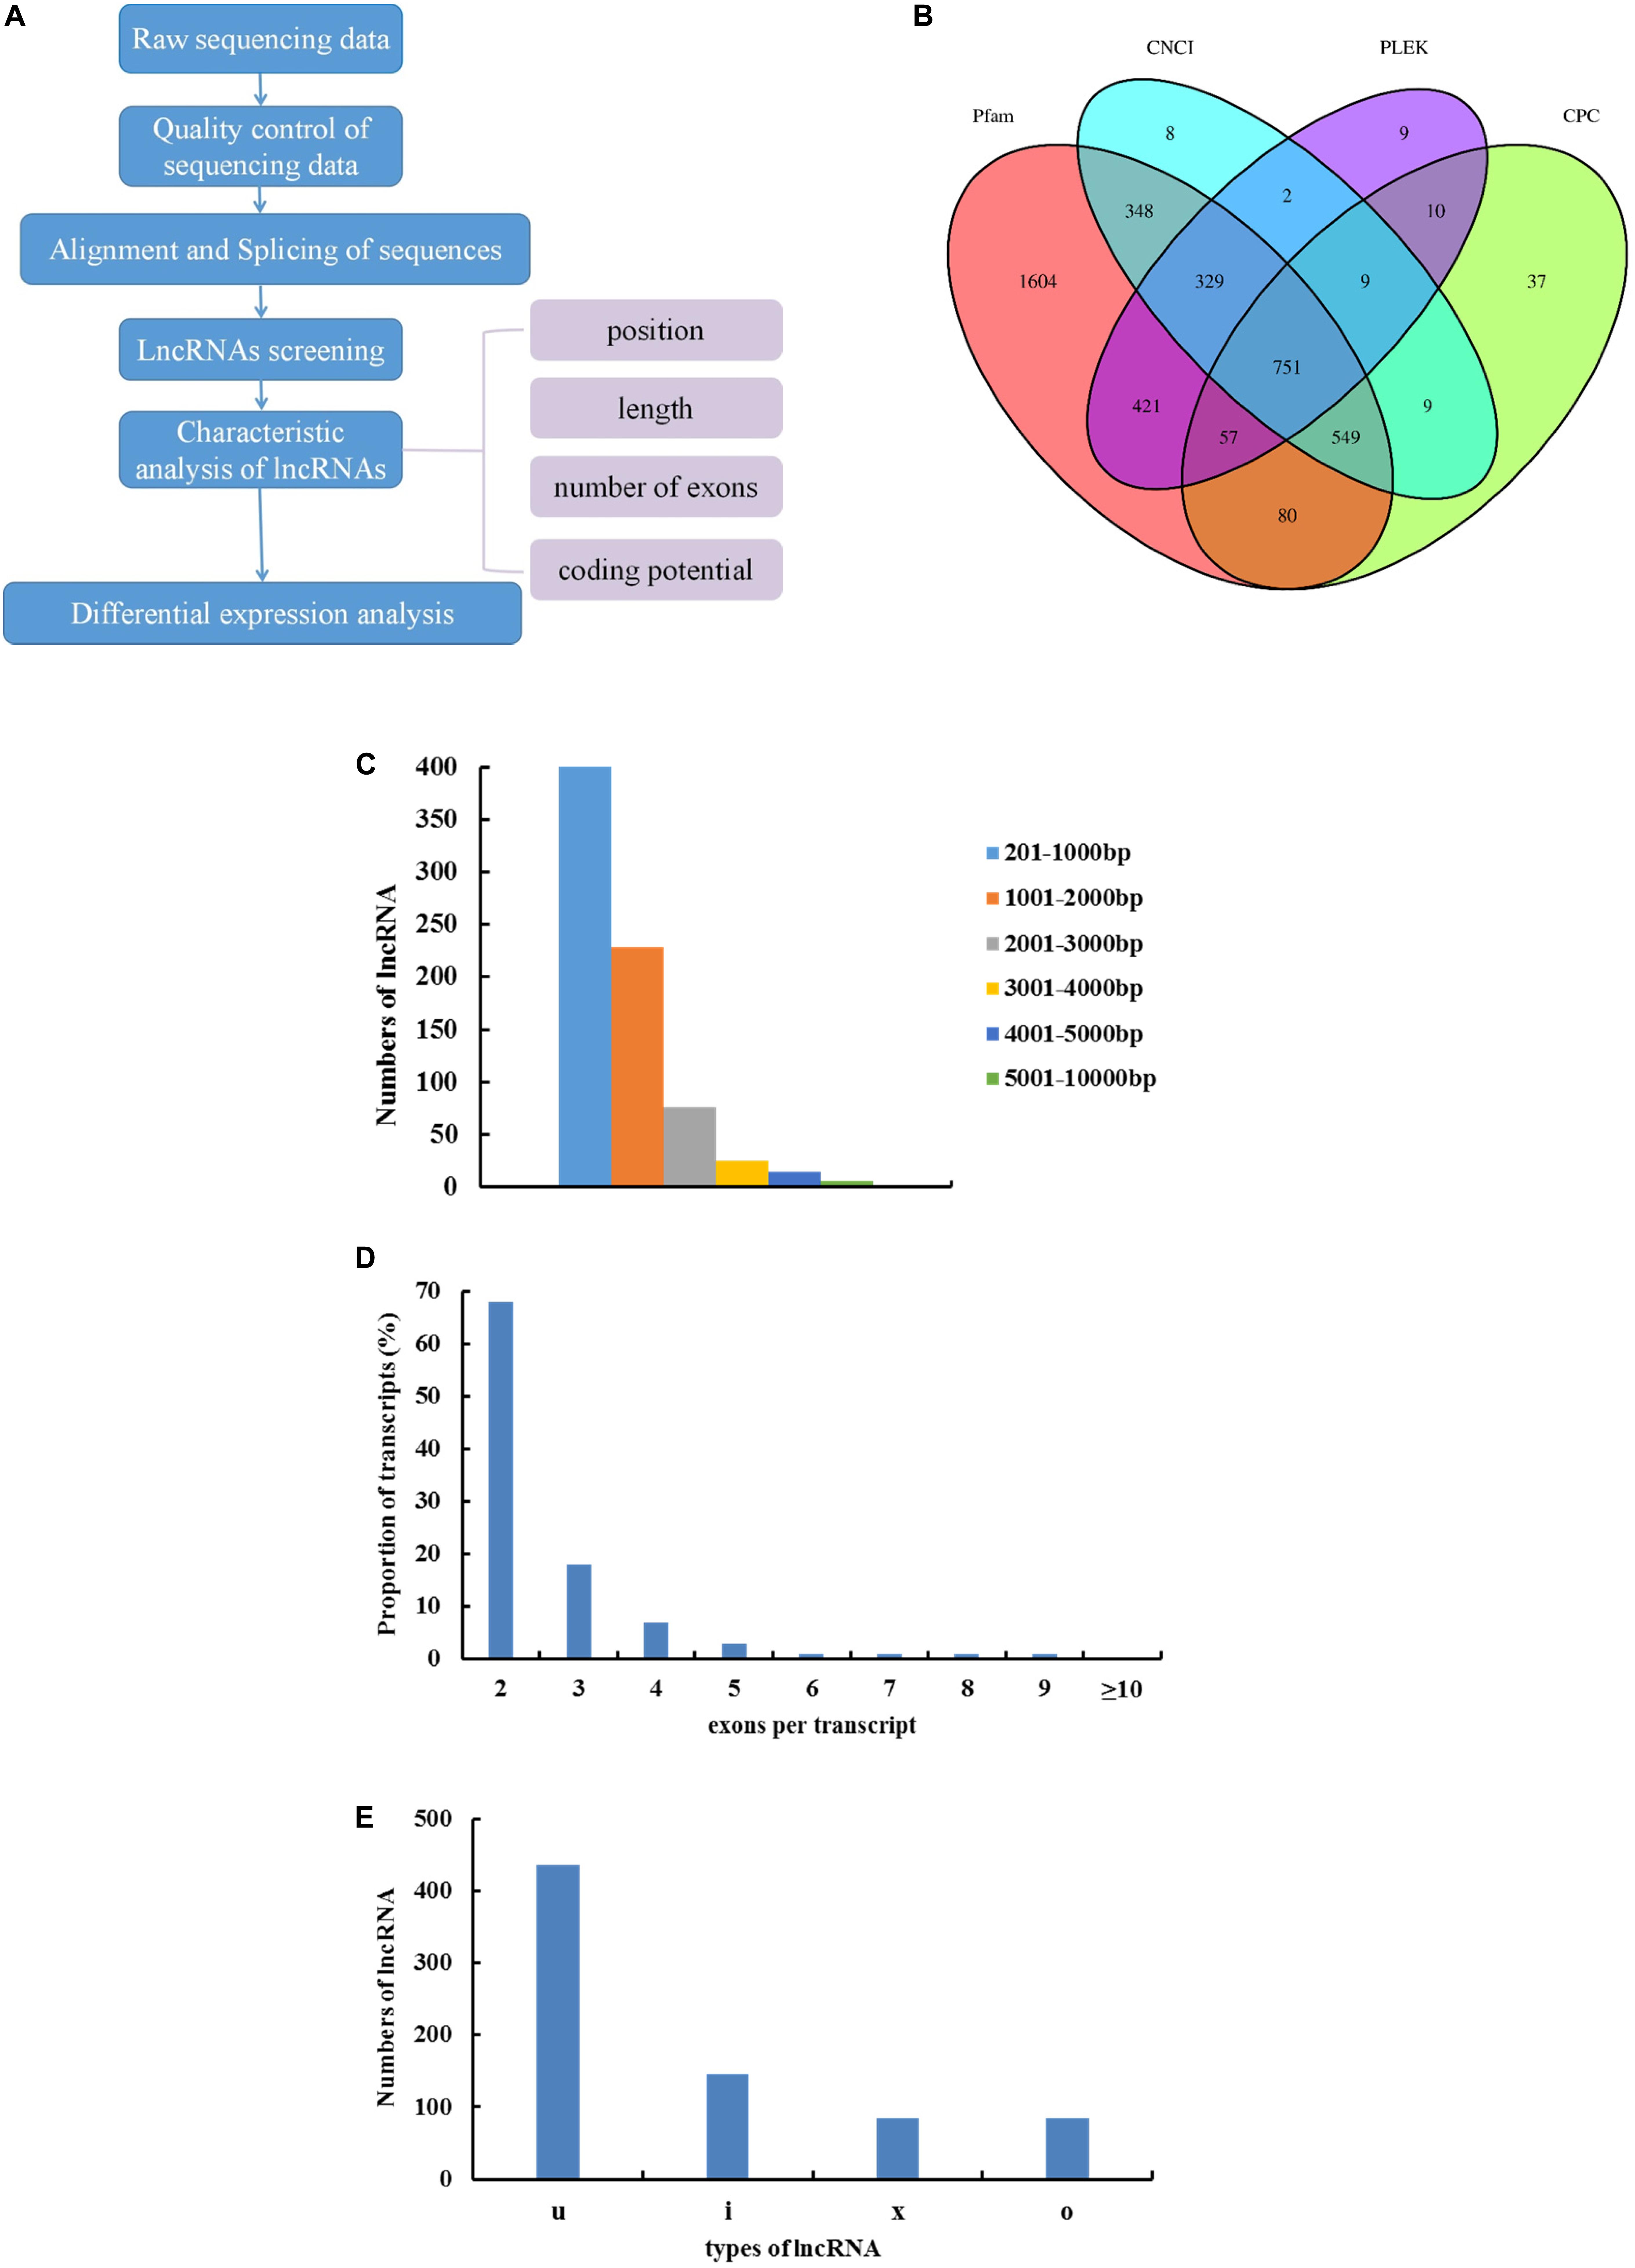
Figure 1. The features of Japanese flounder lncRNAs. (A) Identification and verification of lncRNA in skeletal muscle of Japanese Flounder. (B) Venn diagram of Candidate lncRNA coding ability prediction result. (C) Exon length distribution of Japanese flounder lncRNAs. (D) Exon numbers per transcript of Japanese flounder lncRNAs. (E) The lncRNAs types of Japanese flounder skeletal muscle, “I” (intergenic lncRNA), “u” (intronic lncRNA), “x” (anti-sense lncRNA), “o” (sense-overlapping lncRNA).
Cis- and Trans-Analyses and Enrichment Analysis
We searched for all of the coding genes 100 kb upstream and downstream of differentially expressed lncRNA that had significant co-expression (Pearson correlation calculation) with the lncRNA. These genes that are genomically adjacent and coexpressed in the expression pattern are likely to be the cis-target genes of the lncRNA. Based on the results of differential co-expression, lncRNA and mRNA not on the same chromosome were selected as candidate targets. The RNA interaction software RIsearch-2.0 was used to predict the binding of candidate lncRNA and mRNA at the nucleic acid level. The number of bases in which two nucleic acid molecules directly interact with each other is not less than 10 and the free energy of base binding is not more than −50 were used as screening conditions, and they determined the potential that the lncRNA was trans-acting. Differentially expressed lncRNAs and their corresponding differentially expressed cis- and trans-target genes were used to construct lncRNA–gene interaction networks using the Cytoscape program. Predicting the main functions of lncRNA was done by functional enrichment analysis of lncRNA target mRNA genes. We performed gene ontology (GO) enrichment analysis (Young et al., 2010). The number of differential transcripts included in each GO entry was counted, and the significance of differential transcript enrichment in each GO entry was calculated using the hypergeometric distribution test method. The Kyoto Encyclopedia of Genes and Genomes (KEGG) (Minoru et al., 2008) is the main public database of Pathway and is used to perform Pathway analysis on differential transcripts (combined with KEGG annotation results). The significance of differential transcript enrichment in each Pathway entry is calculated by a hypergeometric distribution test.
Quantitative Real-Time-PCR (qRT-PCR) Analysis
Four differentially expressed lncRNAs target genes that affect muscle development were selected for qRT-PCR verification, including calcium voltage-gated channel subunit alpha1 D (cacna1d) (Krasnyi and Ozernyuk, 2011), actin-related protein 3B-like (Tseng et al., 2002), kin of IRRE like 2 (kirrel2) (Durcan et al., 2014), myosin-7B-like (Girgenrath et al., 2005), and their corresponding lncRNA regulatory factors (TCONS_00034769, TCONS_00041871, TCONS_00089031, and TCONS_00038291). The qRT-PCR primers for these lncRNAs and genes are shown in Table 1. Quantitative real-time PCR was conducted with the Roche LightCycler480 (Germany) and SYBR Premix Ex TaqTM (TliRNaseH Plus) Kit (Takara, Japan) to determinate the relative expressions of each gene. Primers are listed in Table 1, and the Japanese flounder 18 s (GenBank accession no. EF126037.1) was used as the endogenous reference gene. The amplified system was formed from 10μL SYBR®Premix Ex Taq (TliRNaseH Plus), 0.4μL ROX reference dye, 0.4μL PCR forward primer, 0.4μL PCR reverse primer, 2μL cDNA template, and 20 μL of RNase-free water. The reaction was completed according to the following procedure: 95°C for 30 s, 40 cycles of 95°C for 5 s, and Tm for 30 s. All samples were run in triplicate. Then, we calculated the relative expression by the method of comparative threshold (2−ΔΔCt) (Livak and Schmittgen, 2001).
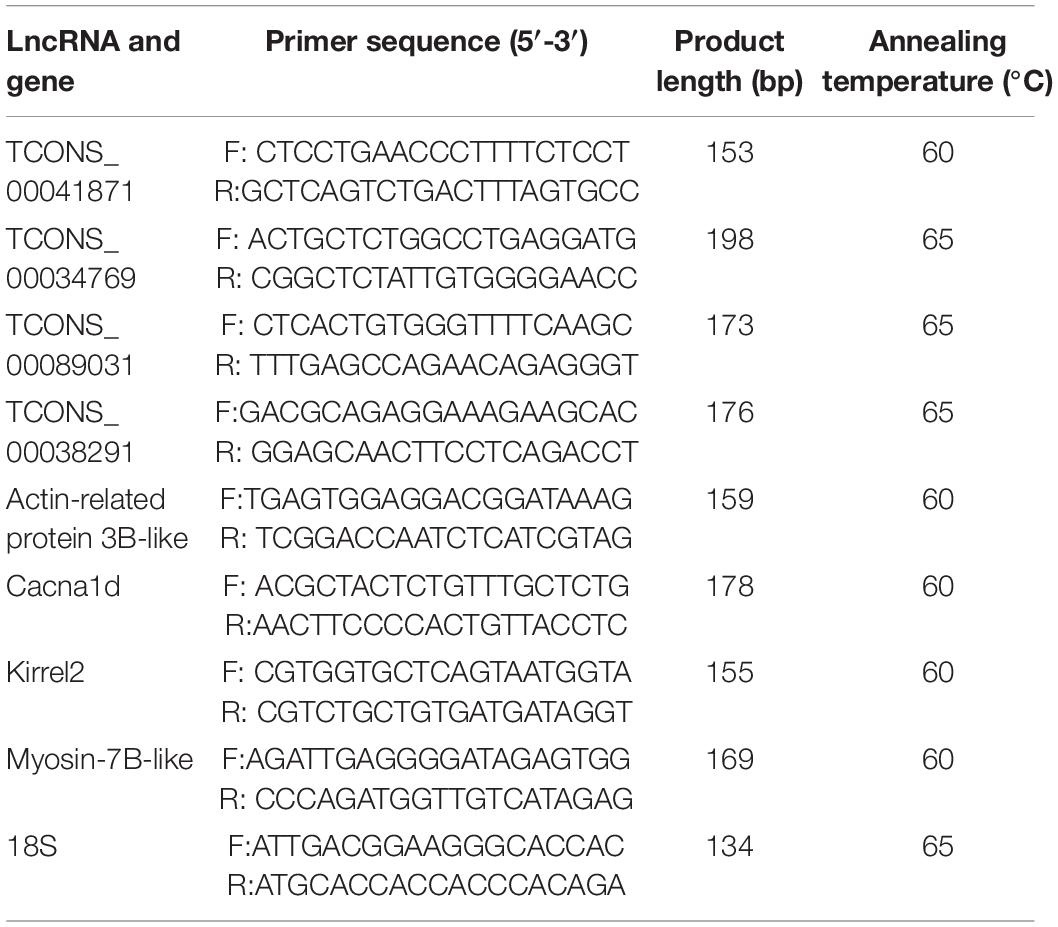
Table 1. Primers used for real time PCR.
LncRNA–miRNA–mRNA Network Construction
Cytoscape is an open source software for biological network integration, visualization, and analysis, loading molecular and genetic interaction data sets in many standard formats in the fields of molecular and systems biology, genomics, and proteomics (Saito et al., 2012). In this study, lncrRNA–mRNA, miRNA–mRNA, and lncRNA–miRNA relationship pairs with regulatory relationships were predicted, and Cytoscape software was used to construct the interaction network diagram among them. The nodes in the network diagram are the mRNAs related to muscle development in the GO enrichment and KEGG pathways; the lncRNAs that have a regulatory relationship with mRNAs; the miRNAs that have a regulatory relationship with mRNAs. The sequencing data obtained from miRNA-seq were released to the NCBI SRA database under the accession numbers SRR11968806, SRR11968805, SRR11968804, SRR11968803, SRR11968802, SRR11968801, SRR11968800, SRR11968799, SRR11968798, SRR11968797, SRR11968796, and SRR11968795.
Statistical Analysis
The data were presented as means ± SEM. The statistical differences were analyzed by one-way ANOVA and Duncan’s multiple range tests in SPSS 19.0 software. P < 0.05 was considered to be statistically significant.
Results
Overview of RNA-Sequencing
High-throughput RNA-seq was performed on the Illumina Hiseq 2500 platform. Each library produced more than 90 million raw reads. After filtering low-quality reads, clean reads still accounted for more than 93% of the raw reads. More than 67.32% of the clean reads perfectly mapped to the reference genome of the Japanese flounder. The uniquely mapped reads ranged from 62.16 to 75.55% of the clean reads (Table 2).
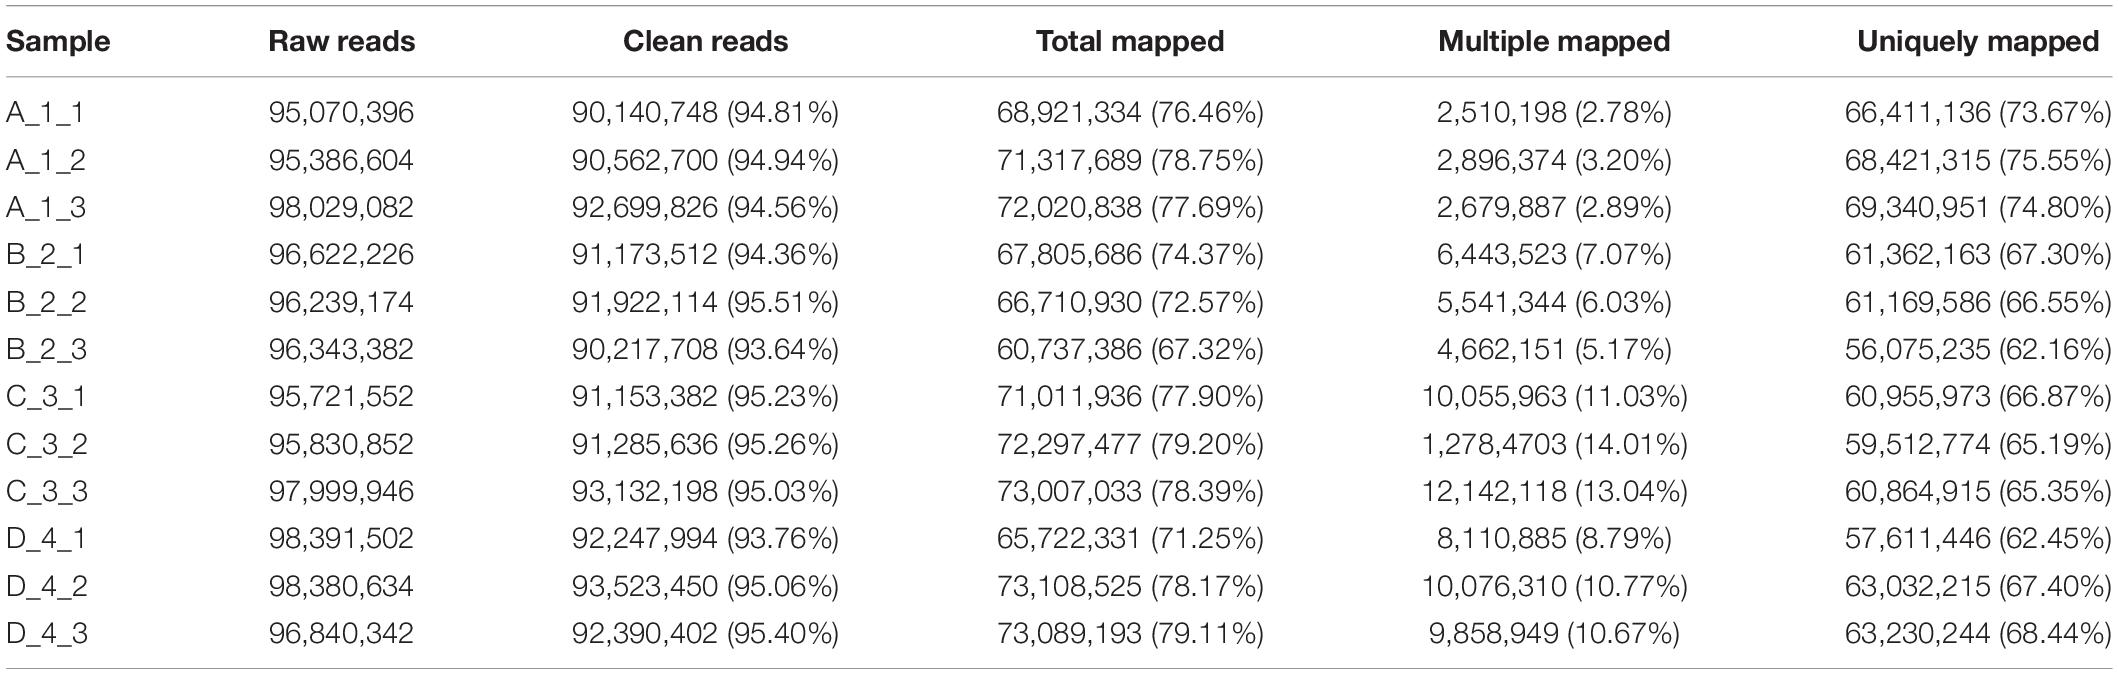
Table 2. Summary of draft reads of 12 libraries by RNA-sequencing.
Identification of lncRNAs in Japanese Flounder Skeletal Muscle
According to the characteristics of lncRNAs, RNA-seq produced 751 lncRNA transcripts after strict screening and filtering of RNAs that did not meet the requirements (Figure 1B). The length of lncRNAs ranged from 201 to 9381 bp; the length of lncRNAs between 201 and 1000 bp was 53.3%, 1000–2000 bp was 30.5%, and the average length of lncRNAs was 1243 bp (Figure 1C). The lncRNAs with 2 exons were 68% and with 3 exons were 18% (Figure 1D). The number of predicted lncRNAs types was 436 for intergenic lncRNA (u), 146 for intronic lncRNA (i), 85 for anti-sense lncRNA (x), and 84 for sense-overlapping lncRNA (o) (Figure 1E).
Differential Expression Analysis of lncRNAs and mRNAs
In order to display the information on differentially expressed lncRNAs and mRNAs more intuitively, the differential expression of lncRNAs and mRNAs in the same differential comparison group was shown by using Circos software (Figure 2 and Supplementary Figure S1). In the A versus B comparison, 232 differentially expressed lncRNAs were detected, 67 of which were upregulated and 165 were downregulated. A total of 9549 differentially expressed mRNAs were detected, 3041 of which were upregulated and 6508 were downregulated (Figure 2 and Supplementary Table S1). In the A versus C comparison, 211 differentially expressed lncRNAs were detected, 60 of which were upregulated and 151 were downregulated. A total of 8673 differentially expressed mRNAs were detected, 2665 of which were upregulated and 6008 were downregulated (Supplementary Figure S1 and Supplementary Table S2). In the A versus D comparison, 194 differentially expressed lncRNAs were detected, 63 of which were upregulated and 131 were downregulated, and 9181 differentially expressed mRNAs were detected, 2854 of which were upregulated and 6327 were downregulated (Supplementary Figure S1 and Supplementary Table S3). In the B versus C comparison, 28 differentially expressed lncRNAs were detected, 13 of which were upregulated and 15 were downregulated, and 1821 differentially expressed mRNAs were detected, 978 of which were upregulated and 843 were downregulated (Supplementary Figure S1 and Supplementary Table S4). In the B versus D comparison, 29 differentially expressed lncRNAs were detected, 12 of which were upregulated and 17 were downregulated, and 1080 differentially expressed mRNAs were detected, 532 of which were upregulated and 548 were downregulated (Supplementary Figure S1 and Supplementary Table S5). In the C versus D comparison, 14 differentially expressed lncRNAs were detected, 7 of which were upregulated and 7 were downregulated, and 557 differentially expressed mRNAs were detected, 245 of which were upregulated and 312 were downregulated (Supplementary Figure S1 and Supplementary Table S6).
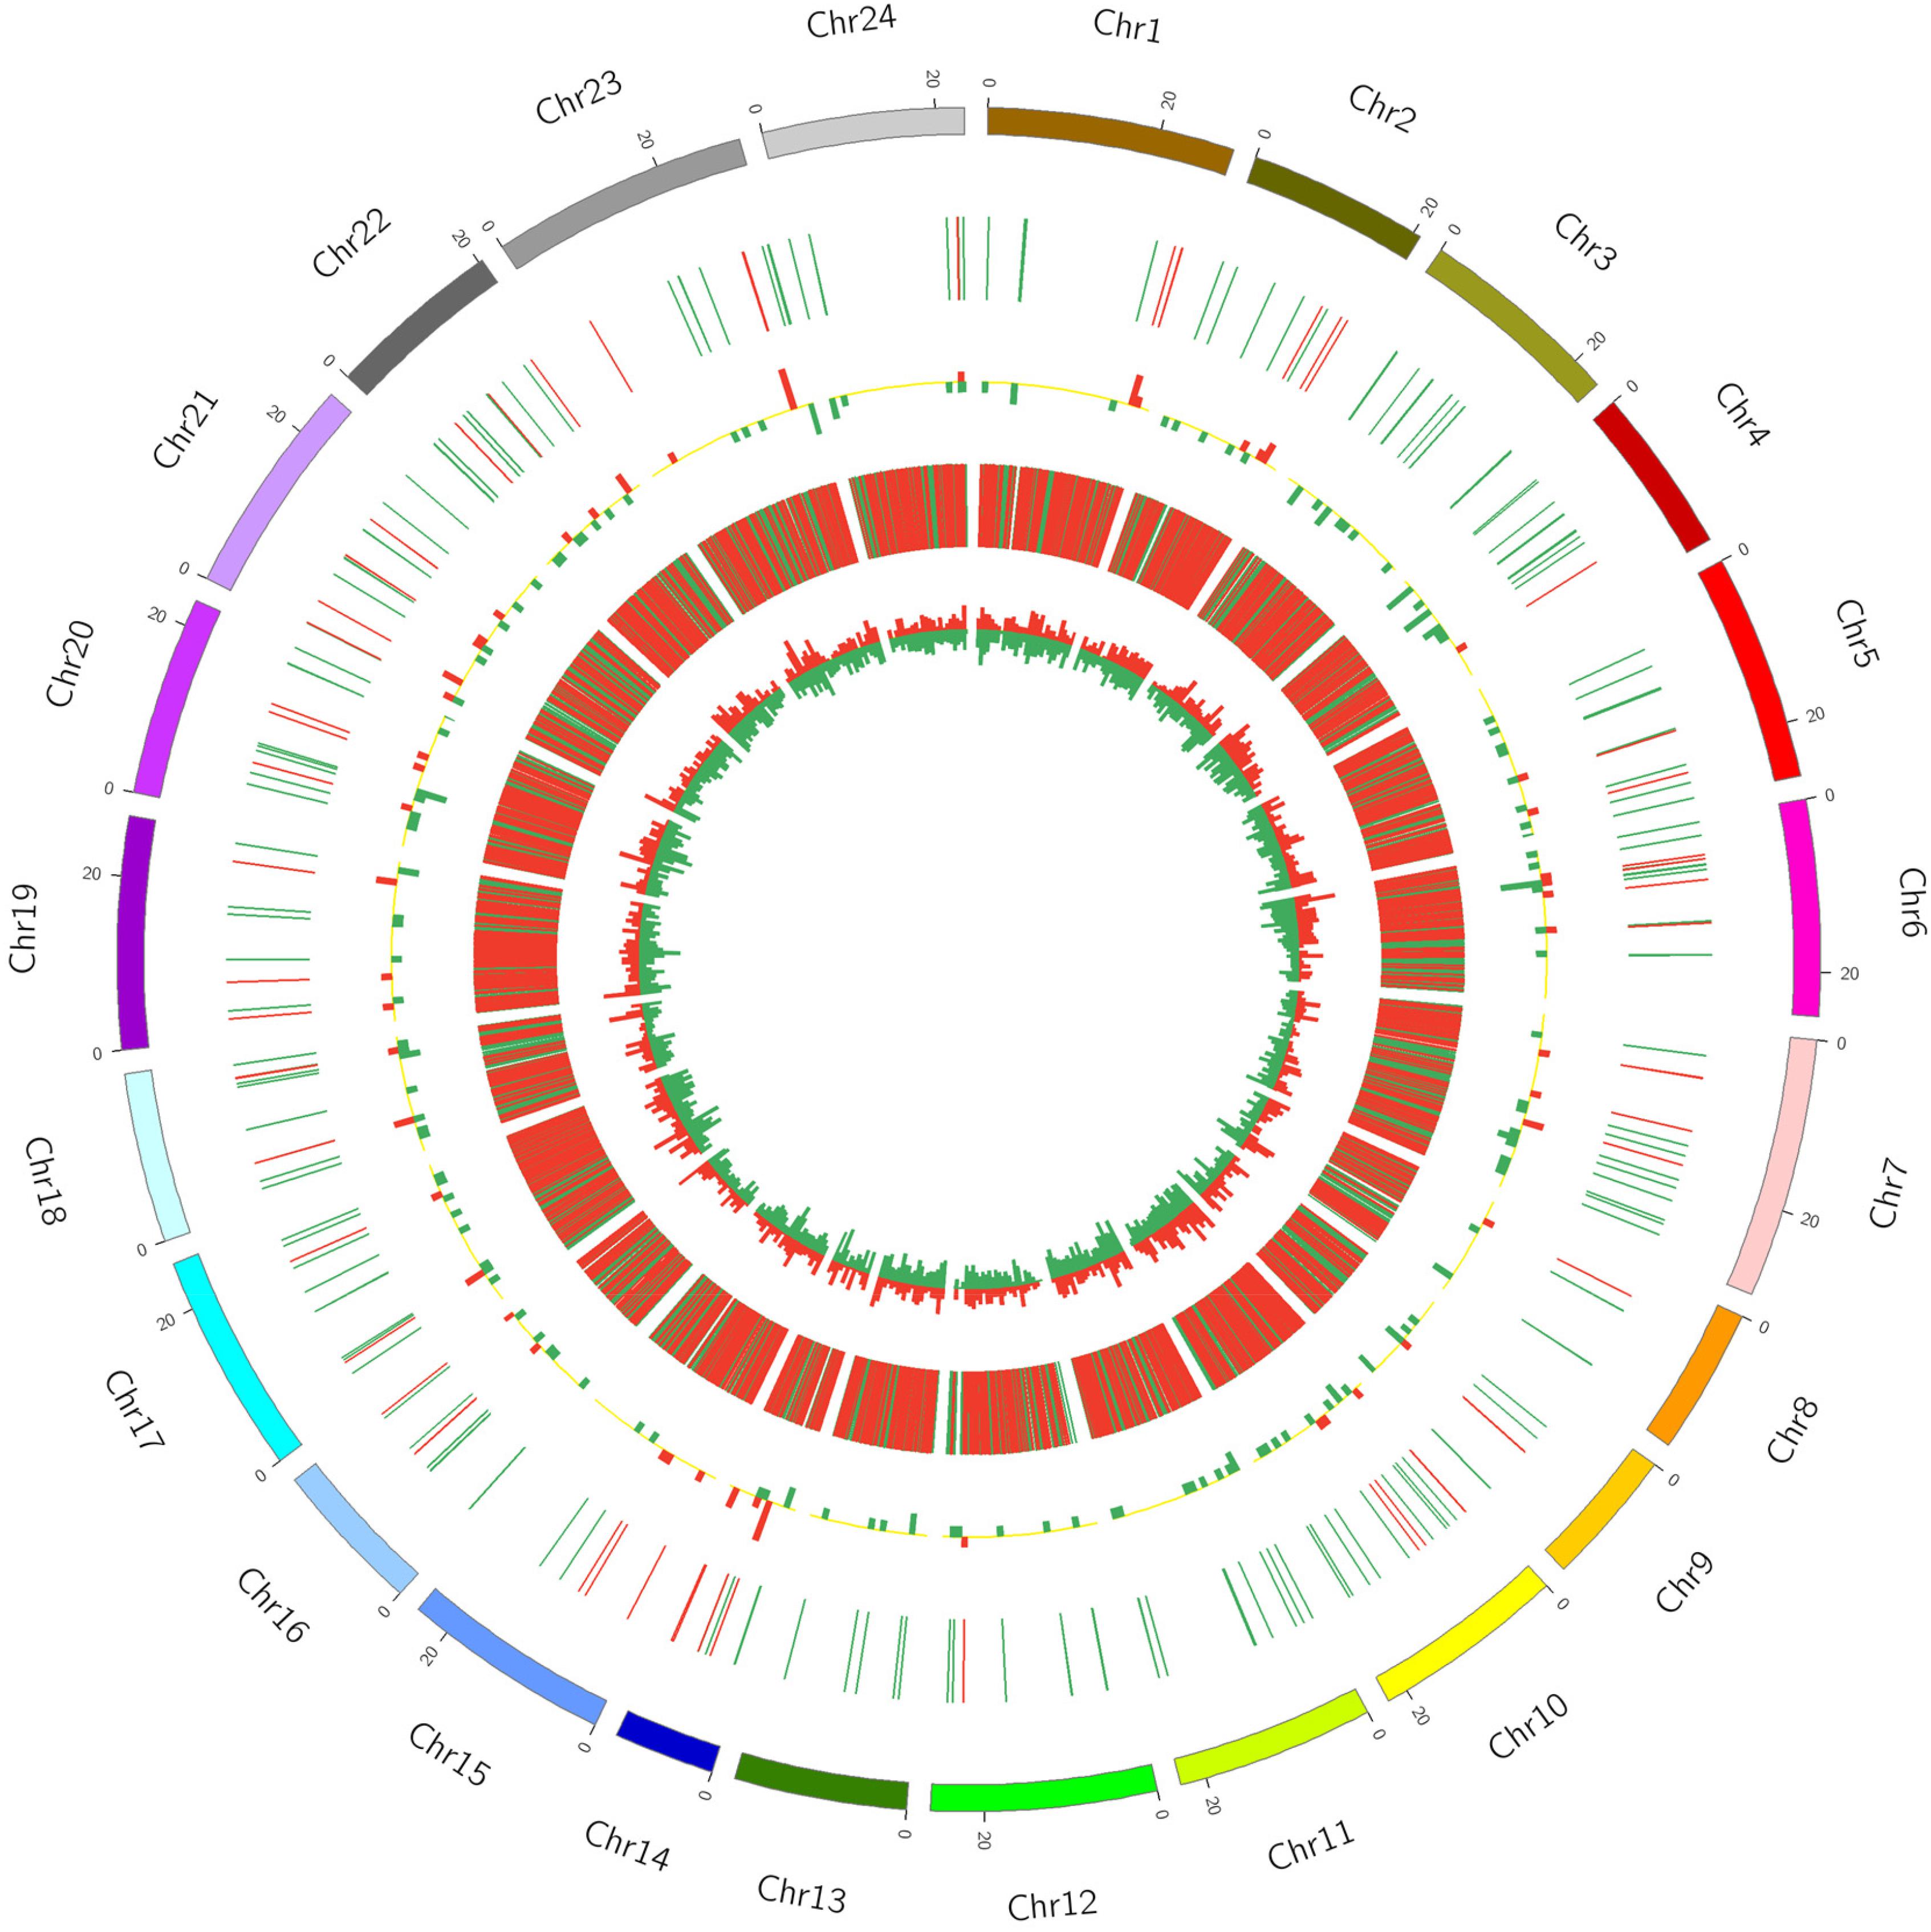
Figure 2. Circos diagram of differential expression of lncRNA and mRNA in A vs. B. In the figure, the outermost circle is the autosomal distribution of the Japanese flounder; the second circle is the lncRNA of differential expression on the chromosome, the red line indicates up-regulation, the green line indicates down-regulation; the third circle is the histogram of differentially expressed lncRNAs at different positions. Red indicates up-regulation, green indicates down-regulation, and the higher the column, indicates the more differentially expressed gene numbers. The fourth circle is the distribution of differentially expressed mRNAs on the chromosome, and the color distribution is the same as lncRNA; the innermost circle is the column with differentially expressed mRNAs at different positions, color distribution is the same as lncRNA.
lncRNA–Gene Interaction Network Construction
To address how lncRNA interacts with its target gene (mRNA) to regulate Japanese flounder muscle development and identify key molecular players in the process, we predicted cis- and trans-targets of differentially expressed lncRNAs and constructed the possible regulatory networks for these interactions. Previous studies have demonstrated that lncRNAs regulate the expression of adjacent protein-coding genes via a cis-acting mechanism (Han et al., 2012; Qian et al., 2012). In the present study, we screened for all the coding genes in the 100k that were upstream and downstream of the differentially expressed lncRNAs and significantly coexpressed with the lncRNAs (Pearson correlation calculation, Supplementary Tables S14–S19). These genes that are genomically adjacent and coexpressed in expression patterns are predicted to be cis-target genes of lncRNAs. In addition, lncRNAs regulate the expression of genes located on other chromosomes through a trans-acting mechanism (Han et al., 2012). Based on the results of differential co-expression, the lncRNAs and mRNAs that are not on the same chromosome were selected as candidate targets. The RNA interaction software RIsearch-2.0 was used to predict the binding of candidates of lncRNA and mRNA at the nucleic acid level. The lncRNAs and mRNAs that may have direct regulation were screened, and these genes were predicted to be trans-target genes. For the comparison of A and B, the lncRNA-gene interaction network contained 304 network nodes, 83 lncRNAs, 221 protein-coding genes, 200 pairs of cis-regulation relations, and 29 pairs of trans-regulation relations (Figure 3 and Supplementary Table S7). For the comparison of A and C, the lncRNA–gene interaction network contained 285 network nodes, 70 lncRNAs, 215 protein encode genes, 200 pairs of cis-regulation relations, and 19 pairs of trans-regulation relations (Supplementary Figure S2 and Supplementary Table S7). For the comparison of A and D, the lncRNA–gene interaction network consists of 278 network nodes, 69 lncRNAs, 209 protein-coding genes, 200 pairs of cis-regulation relations, and 24 pairs of trans-regulation relations (Supplementary Figure S2 and Supplementary Table S7). For the comparison of B and C, the lncRNA–gene interaction network contained 157 network nodes, 26 lncRNAs, 131 protein-coding genes, 93 pairs of cis-regulation relations, and 38 pairs of trans-regulation relations (Supplementary Figure S2 and Supplementary Table S7). For the comparison of B and D, the lncRNA–gene interaction network contained 108 network nodes, 22 lncRNAs, 86 protein encode genes, 47 pairs of cis-regulation relations, and 8 pairs of trans-regulation relations (Supplementary Figure S2 and Supplementary Table S7). For the comparison of C and D, the lncRNA–gene interaction network contained 97 network nodes, 12 lncRNAs, 85 protein-coding genes, 11 pairs of cis-regulation relations, and 47 pairs of trans-regulation relations (Supplementary Figure S2 and Supplementary Table S7). We then analyzed the expression correlation between the network lncRNA and its corresponding target gene. In the network constructed from the differentially expressed lncRNAs and target genes identified from the A versus B comparison, 212 lncRNA–gene linkages were positively correlated, and the other 18 linkages were negatively correlated (Figure 3 and Supplementary Table S7). For the A versus C comparison, 210 lncRNA–gene connections were positively correlated, and 9 connections were negatively correlated (Supplementary Figure S2 and Supplementary Table S7). For the comparison of A and D, 213 lncRNA–gene connections were positively correlated, and 11 connections were negatively correlated (Supplementary Figure S2 and Supplementary Table S7). For the B versus C comparison, 73 lncRNA–gene connections were positively correlated, and 58 connections were negatively correlated (Supplementary Figure S2 and Supplementary Table S7). For the B versus D comparison, 46 lncRNA–gene connections were positively correlated, and 9 connections were negatively correlated (Supplementary Figure S2 and Supplementary Table S7). For the C versus D comparison, 24 lncRNA-gene connections were positively correlated, and 34 connections were negatively correlated (Supplementary Figure S2 and Supplementary Table S7). The directional analysis shows that the positive correlation number between lncRNA–gene pairs was higher than the negative correlation number except for comparison networks of C and D.
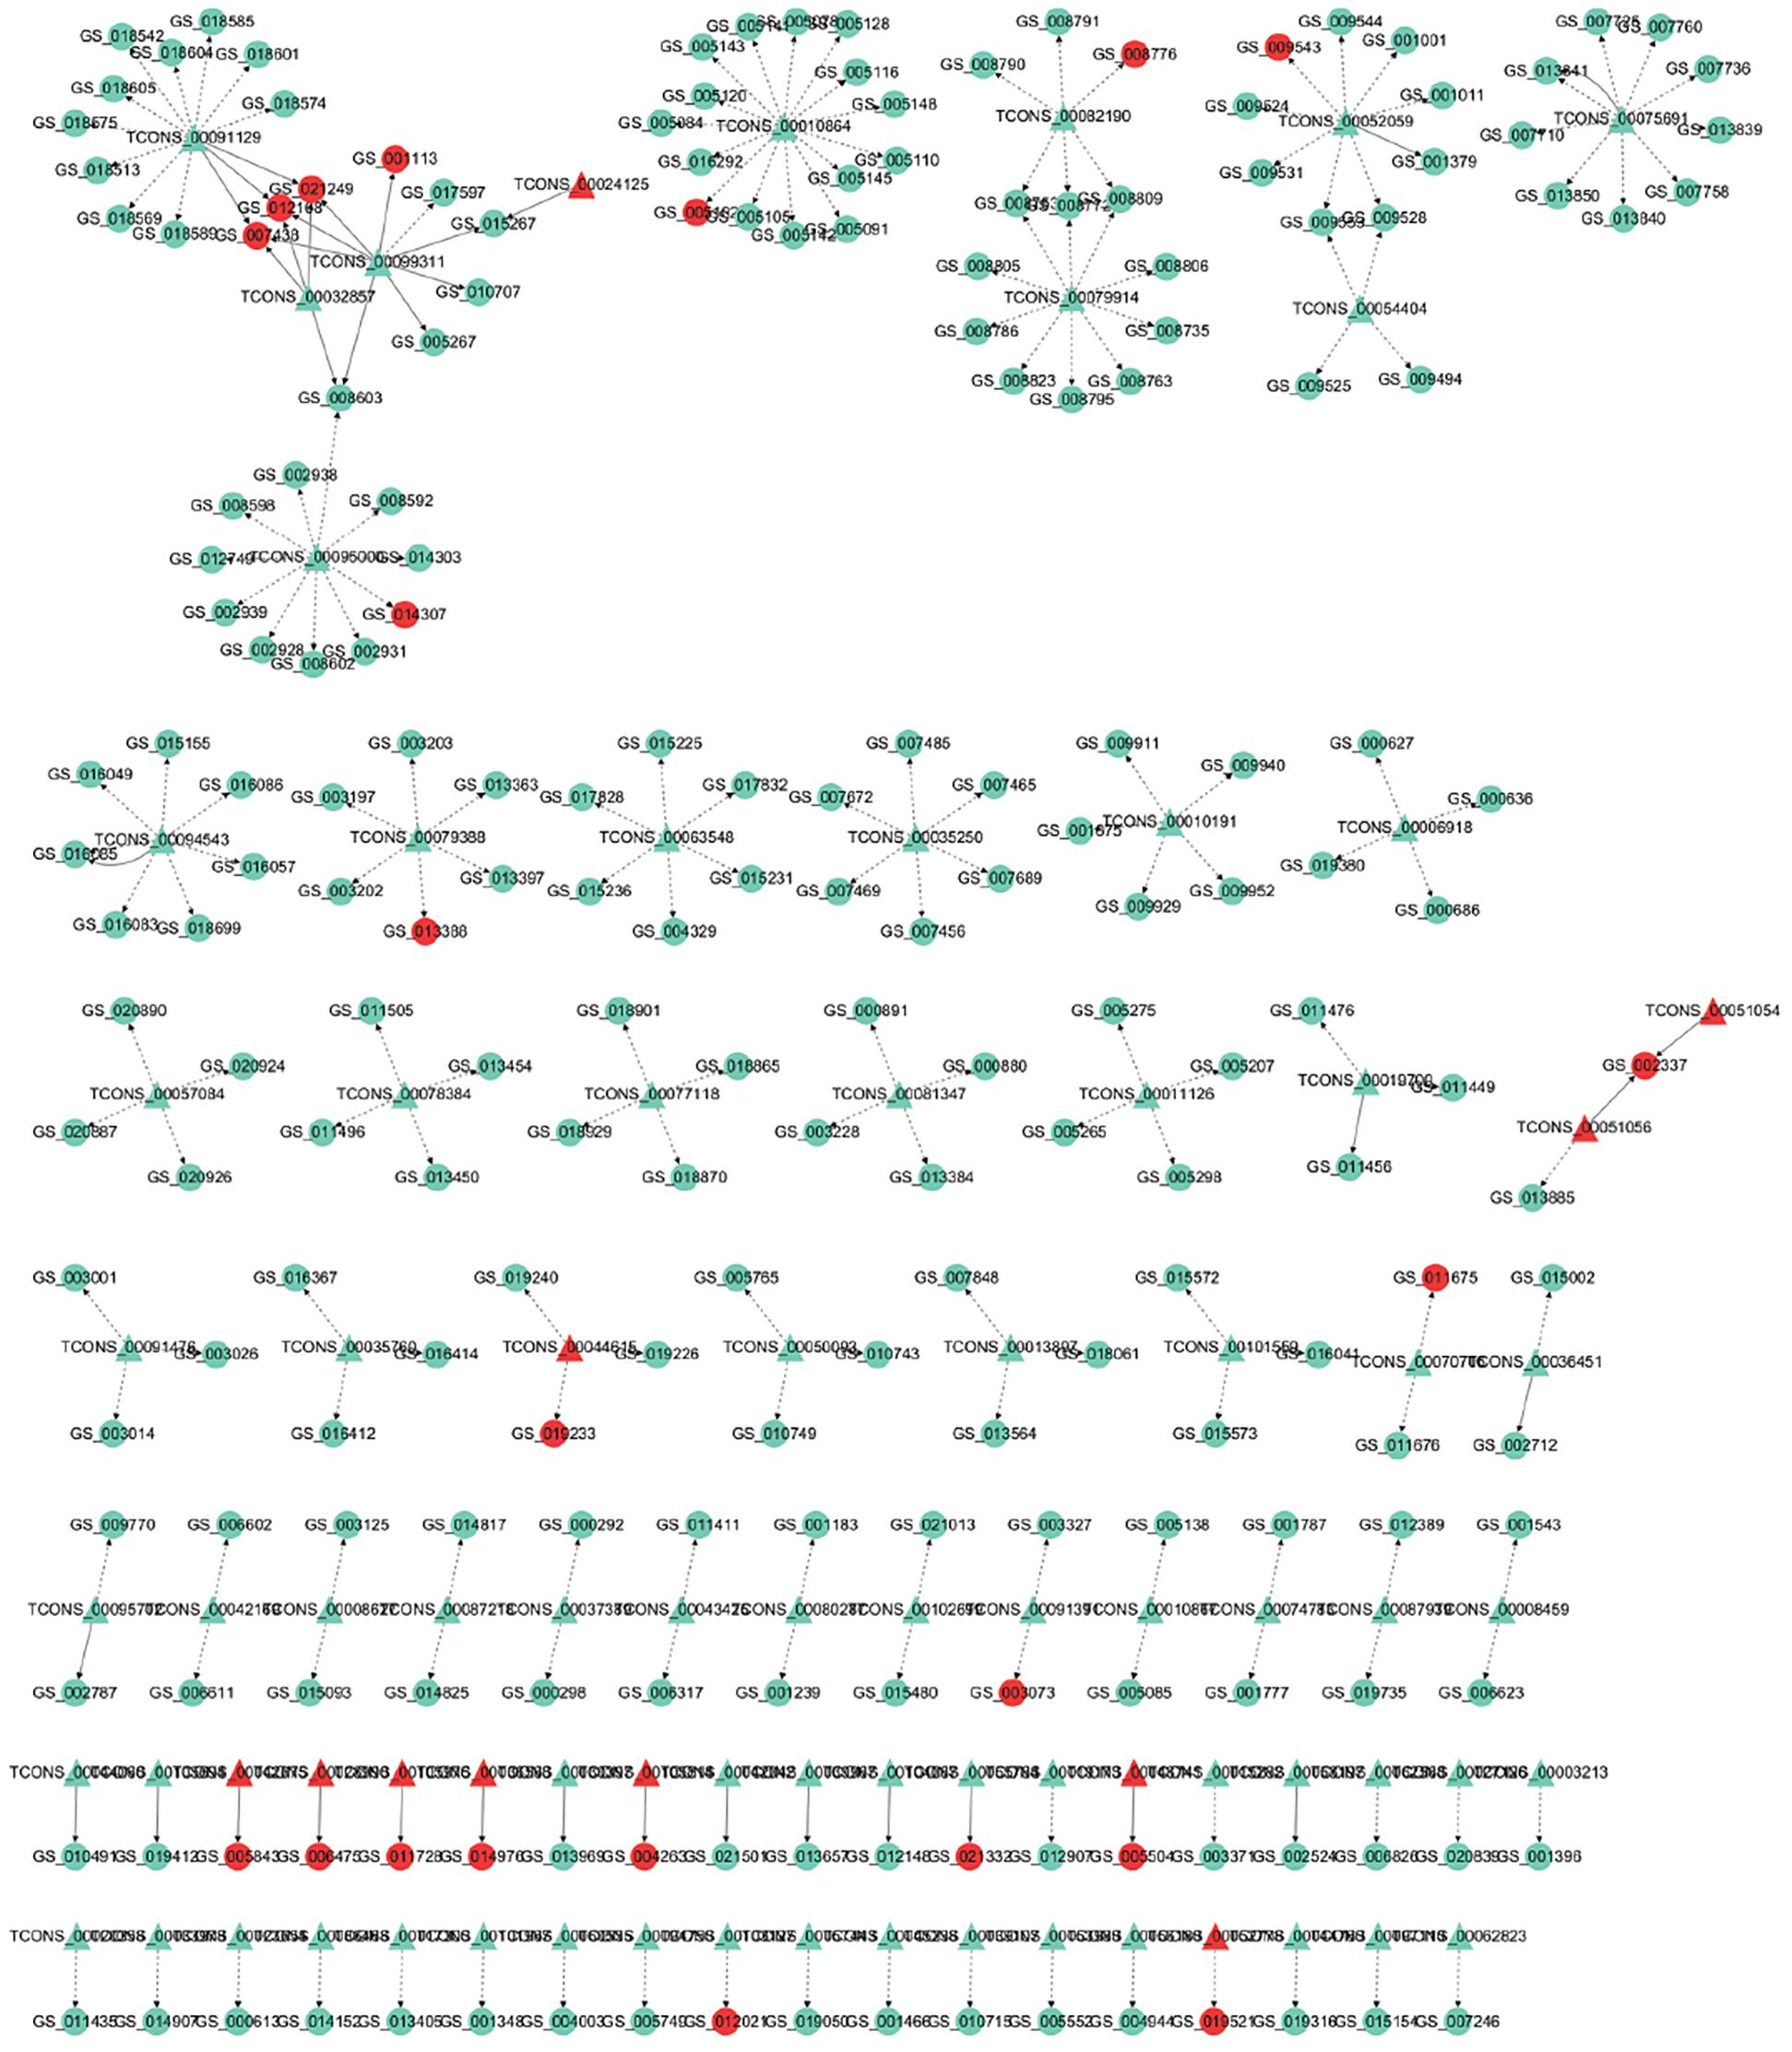
Figure 3. LncRNA – gene interaction network diagram in A vs. B. Red indicates up-regulation, green indicates down-regulation, triangles represent lncRNA, and circles indicate mRNA. The dashed line indicates the interaction between the differentially expressed lncRNA and its corresponding cis target gene, while the solid line indicates the interaction between the differentially expressed lncRNA and its corresponding trans target gene.
GO and KEGG Pathway Analysis
We enriched the biological processes and pathways in all comparisons. In the A versus B comparison, 3805 terms were enriched, and 3720 terms were enriched in the A versus C comparison, 3627 terms in A versus D, 1779 terms in B versus C, 1780 terms in B versus D, and 741 terms were enriched in the C versus D comparison (p < 0.05). We selected the top 30 terms in the GO enrichment analysis for each comparison (screening GO entries with corresponding transcript numbers greater than 2, sorting from large to small according to the corresponding −log10P-value for each entry and then selecting 10 terms in each of the three categories) analysis (Supplementary Tables S8–S13). Many GO terms that were enriched in more than one comparison were related to myosin filament, epidermal cell differentiation, and calcium- and calmodulin-responsive adenylate cyclase activity. In all of these GO terms, there were enriched muscle-related terms, such as muscle myosin complex, myosin filament, and actin binding. In all of these GO terms, muscle-related terms, such as muscle myosin complex, myosin filament, and actin binding, were enriched. Figure 4A is a GO enrichment map of the C versus D comparison in which actin binding is significantly enriched in the top 30. For A versus B, A versus C, A versus D, B versus C, B versus D, and C versus D comparisons, 79, 85, 72, 31, 31, and 31 enrichment pathways were detected, respectively (p < 0.05). We selected the top 20 terms in the KEGG pathway analysis for each comparison (screening the pathway entries with transcript numbers greater than 2 and sorting from large to small according to the corresponding −log10P-value for each entry) (Supplementary Tables S8–S13). The regulation of the actin cytoskeleton pathway was significantly enriched in the C versus D comparison (Figure 4B). These results suggest that some lncRNAs may be involved in the growth and development of skeletal muscle.
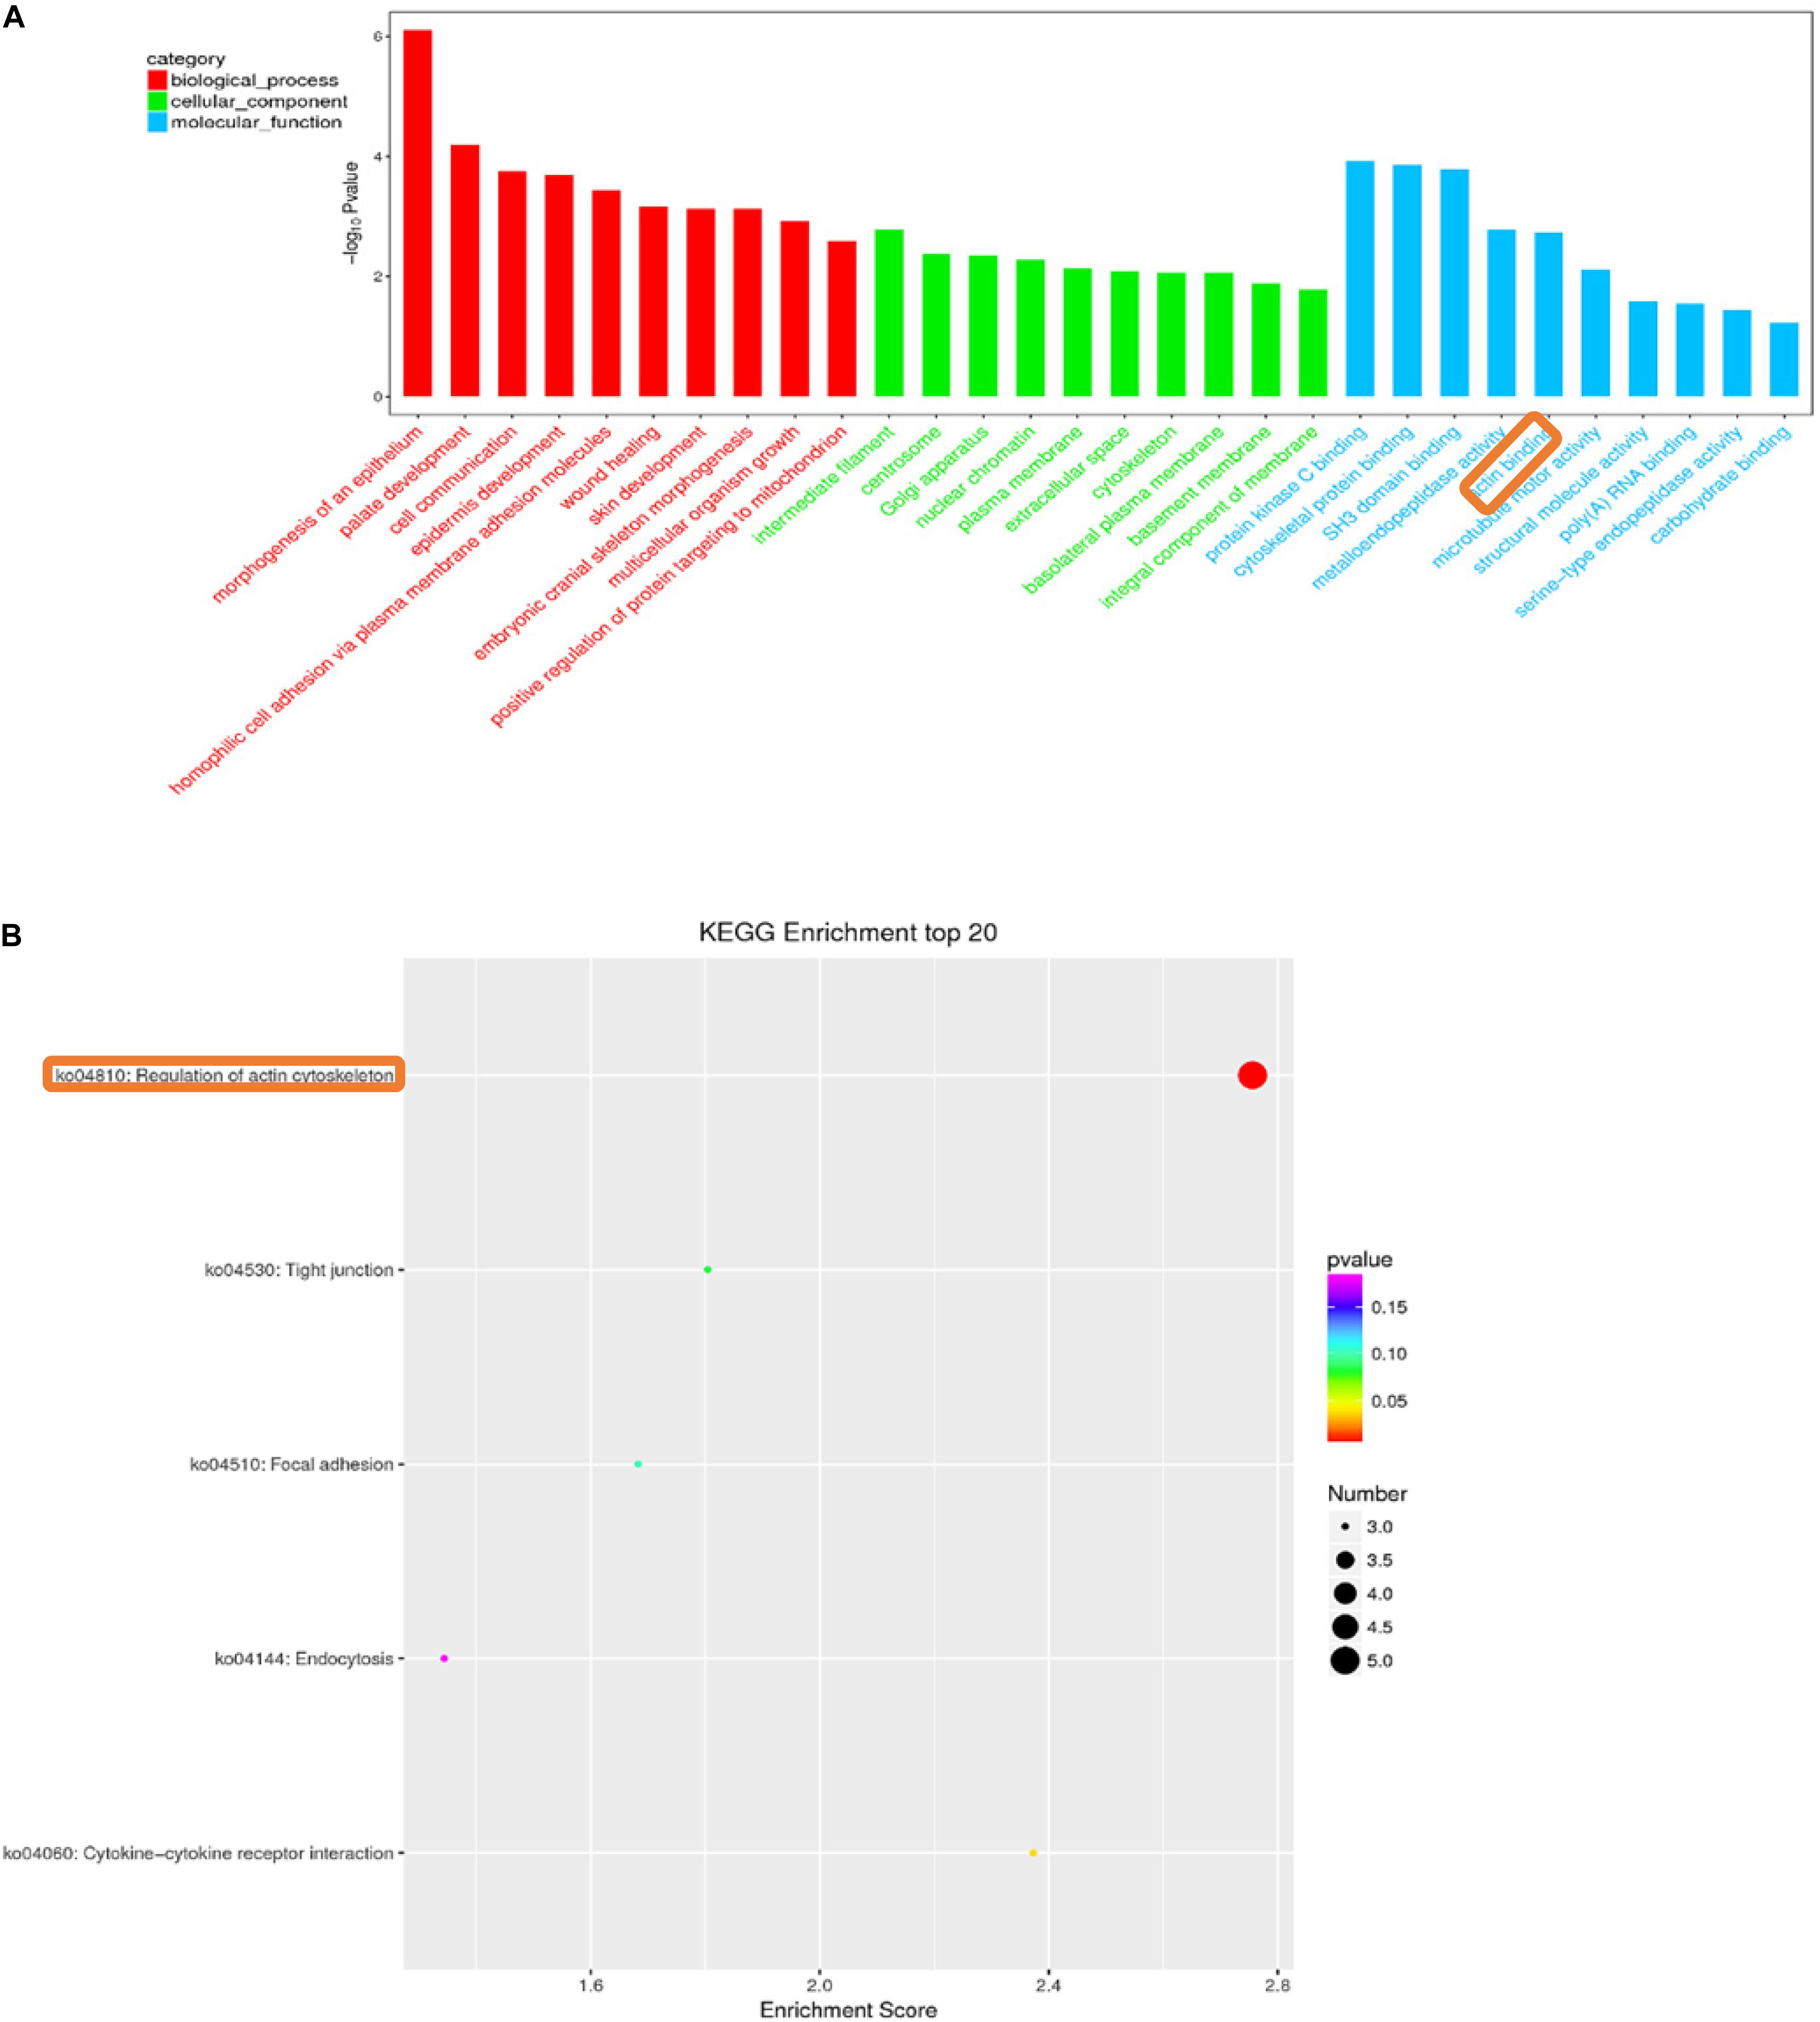
Figure 4. Histogram of gene ontology (GO) classification (A). GO analysis of C vs. D differentially expressed lncRNAs target genes. The horizontal axis indicates the GO entry name and the vertical axis indicates −log10Pvalue. Red bars: biological process; Green bars: cellular component; Blue bars: molecular function. KEGG pathway enrichment of C vs. D differentially expressed lncRNAs target genes (B). The horizontal axis is the enrichment score, the vertical axis indicates the name of the pathway.
Verification of Gene Expression Profiles Using qRT-PCR
To confirm the accuracy and reproducibility of differentially expressed lncRNAs and differentially expressed gene expression levels obtained from RNA-seq, we selected four differentially expressed lncRNA target genes that affect muscle development and performed qRT-PCR verification. The expression of cacna1d was downregulated in stage C compared with that in stage A. The expression of TCONS_00034769 was downregulated in stage C compared with that in stage A. The expression of actin-related protein 3B-like was upregulated in stage B compared with that in stage A. The expression of TCONS_00041871 was downregulated in stage B compared with that in stage A. The expression of kirrel2 was downregulated in stage B compared with that in stage A. The expression of TCONS_00089031 was downregulated in stage B compared with that in stage A. The expression of myosin-7B-like was downregulated in stage D compared with that in stage A. The expression of TCONS_00038291 was upregulated in stage D compared with that in stage A. All four lncRNAs and their target genes showed similar expression patterns compared to RNA-seq data, indicating the reliability of our RNA-seq data (Figure 5).
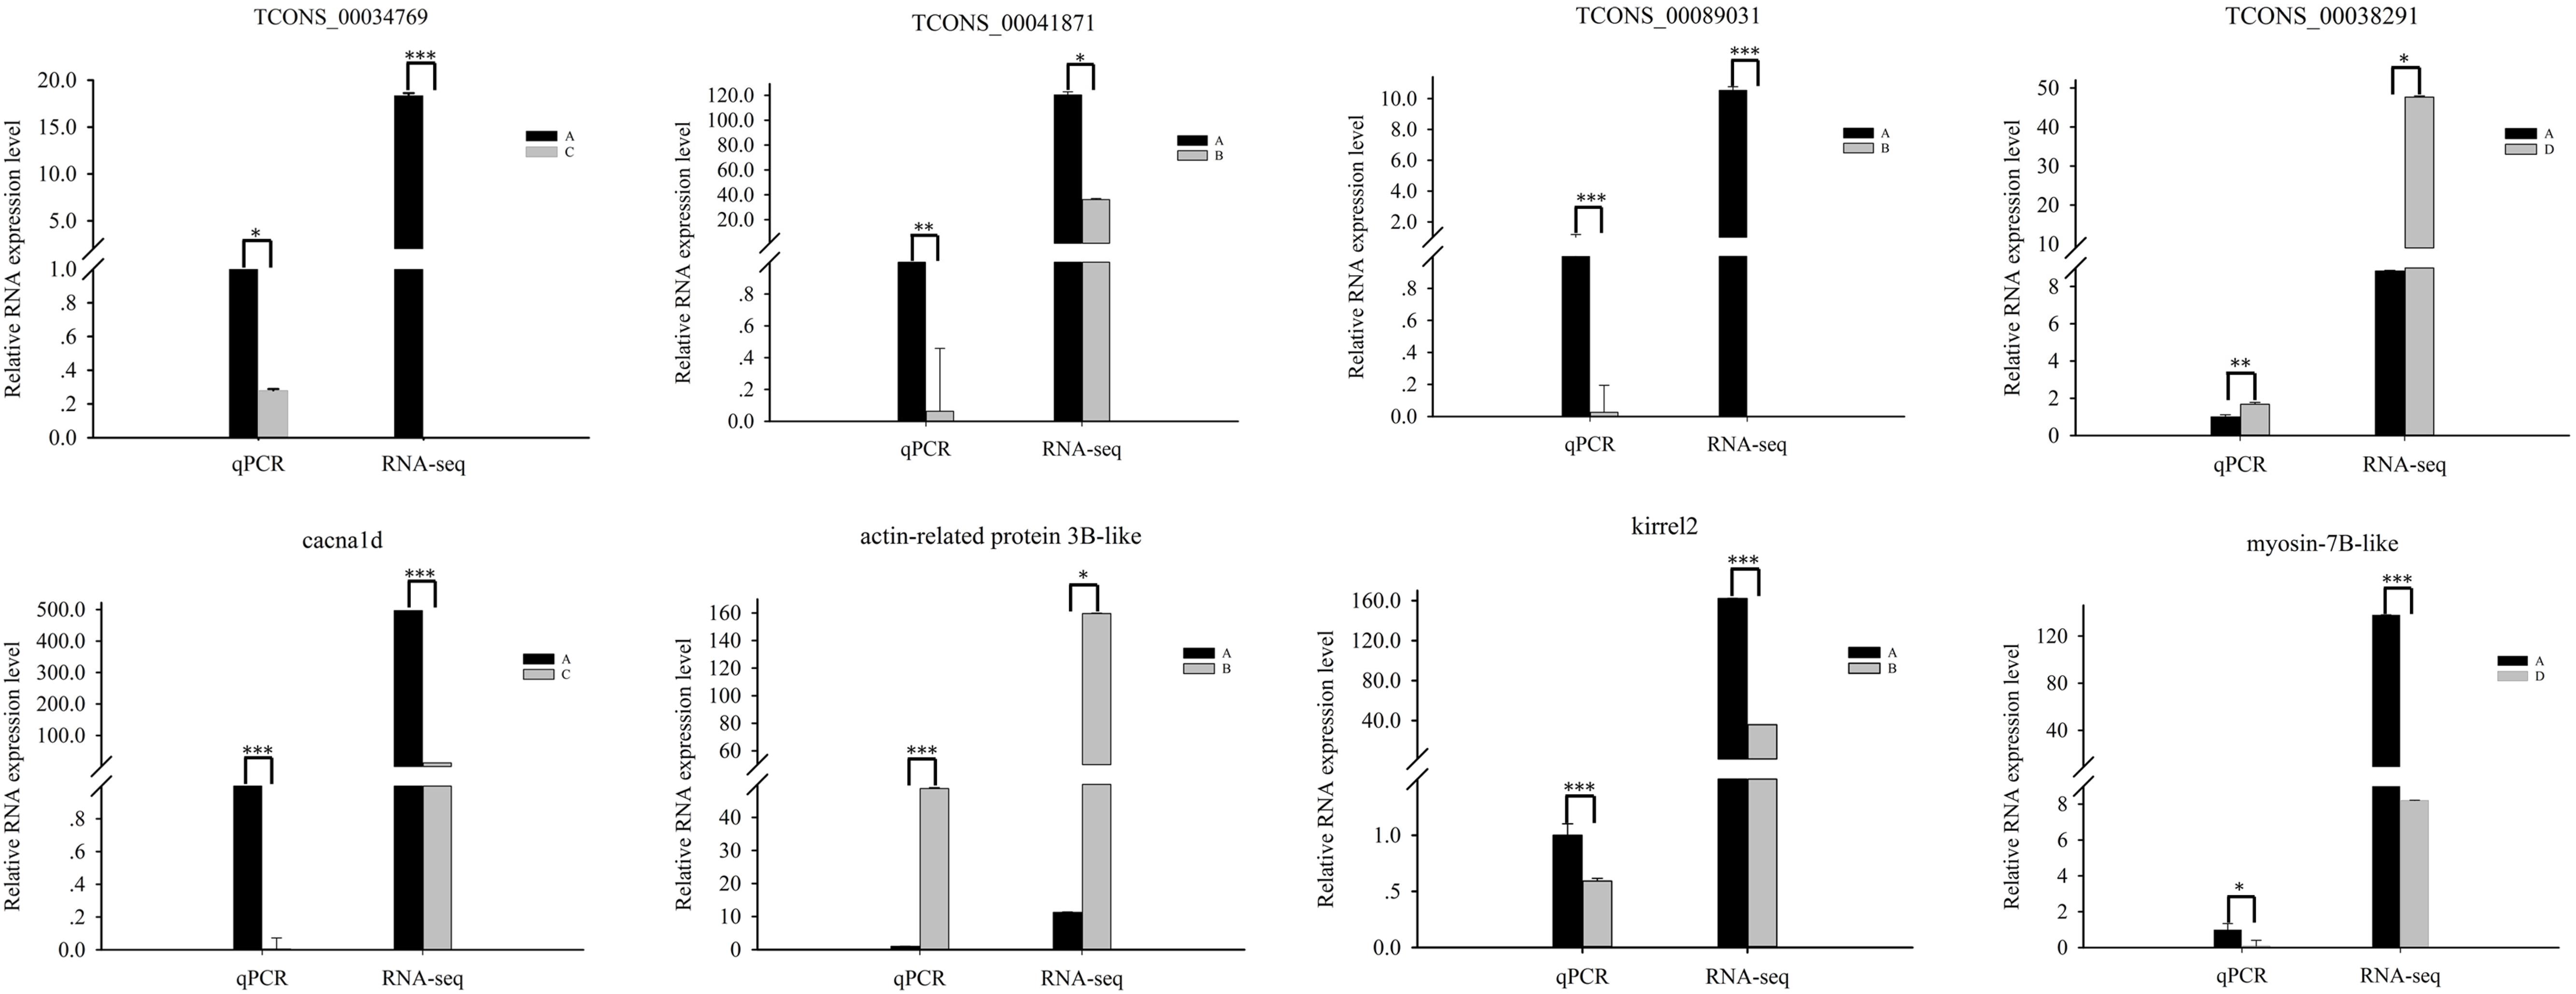
Figure 5. Quantitative real-time PCR validation of differentially expressed lncRNAs and their corresponding target genes. Values are shown as mean with SEM. Significant differences between stages are indicated by *. *, **, and *** indicate p < 0.01, p < 0.001, and p < 0.0001, respectively.
Bioinformatics Analysis of lncRNA–miRNA–mRNA Networks
Recent studies show that lncRNAs can act as a competitive endogenous RNA affecting post-transcriptional regulation by interfering with the miRNA pathway. To further elucidate the role of lncRNAs in the growth and development of skeletal muscle in Japanese flounder, we used TargetScan and miRanda to predict miRNAs that have a regulatory relationship with the given muscle development–associated mRNAs and the differentially expressed lncRNAs and established the basic lncRNA linkage (Figure 6). The lncRNA–miRNA–mRNA interaction network (Figure 7, Supplementary Figure S2,S3 and Supplementary Table S7) was constructed using Cytoscape software. In the A versus B comparison, there were 18 miRNAs, 13 mRNAs, and 101 lncRNAs, which had at least one predicted target miRNA. There were 18 miRNAs, 13 mRNAs, and 110 lncRNAs in the A versus C comparison. There were 18 miRNAs, 13 mRNAs, and 95 lncRNAs in the A versus D comparison. There were 19 miRNAs, 13 mRNAs, and 11 lncRNAs in the B versus C comparison. There were 19 miRNAs, 13 mRNAs, and 12 lncRNAs in the B versus D comparison. There were 19 miRNAs, 13 mRNAs, and 4 lncRNAs in the C versus D comparison. Some of these lncRNAs (including TCONS_00003213, TCONS_00006684, and TCONS_00023918) were found to interact with at least three target miRNAs.
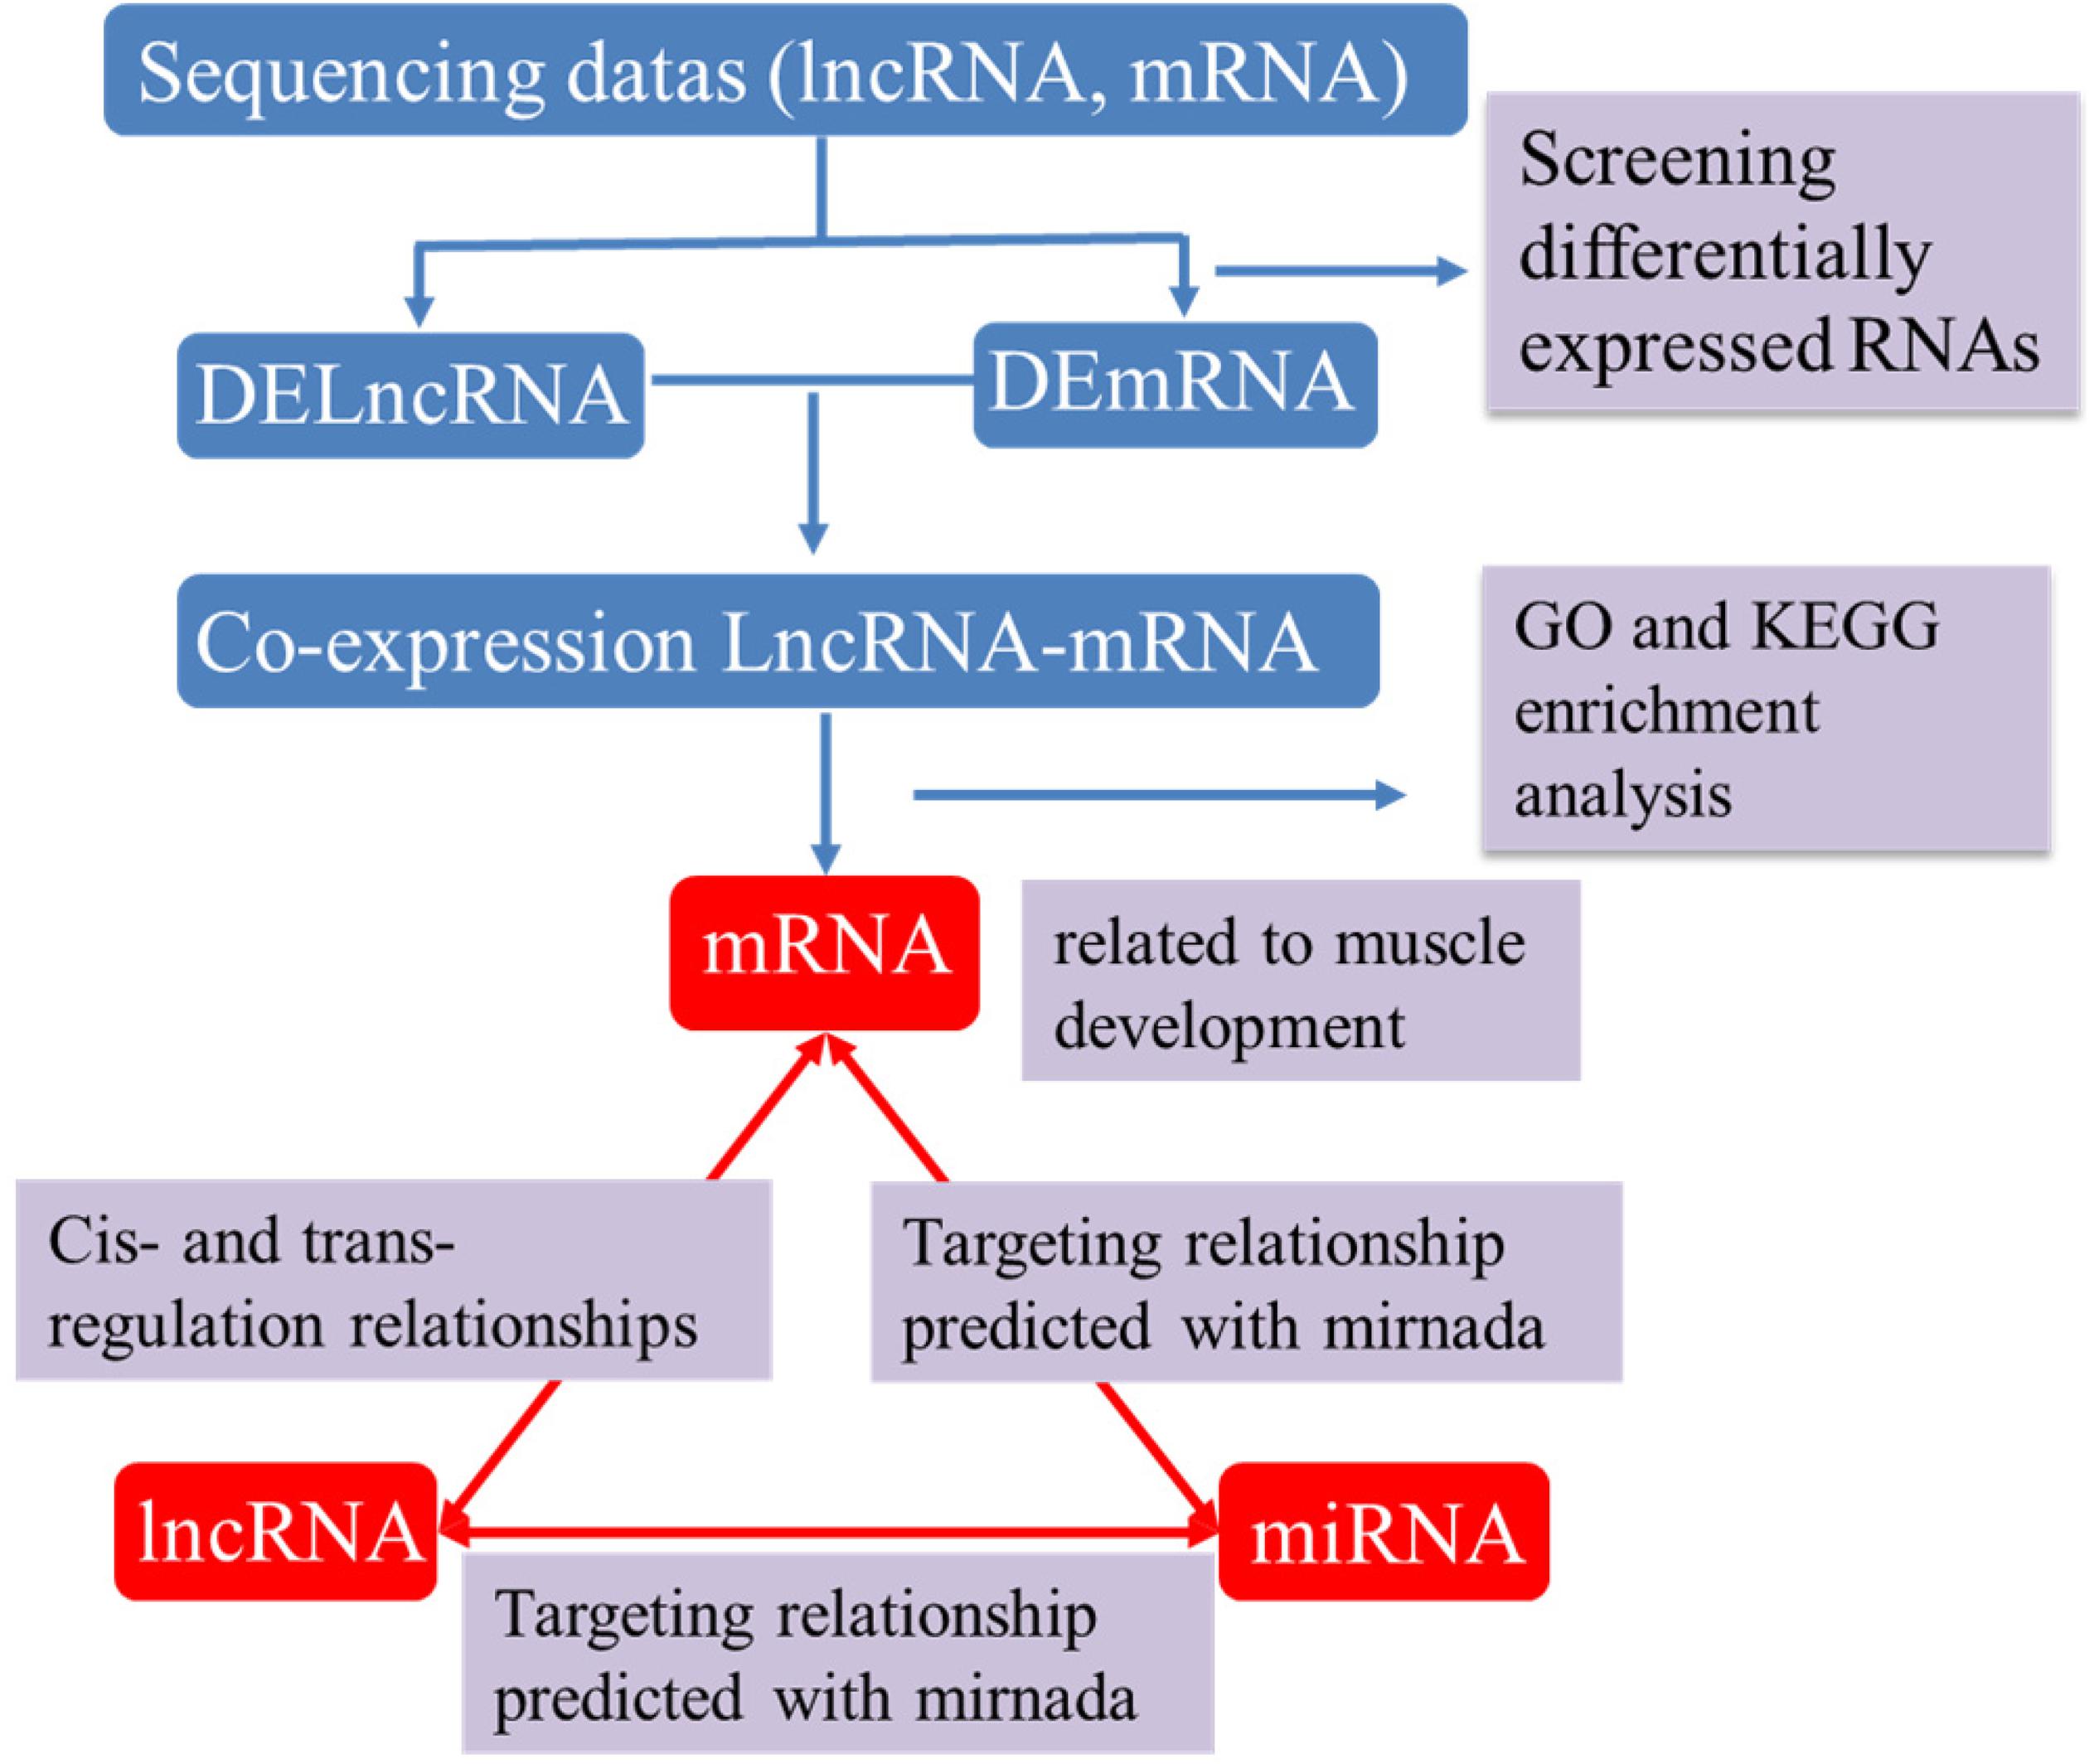
Figure 6. The process of building lncRNA – miRNA-mRNA interactive network. DElncRNA: differentially expressed lncRNA; DEmRNA: differentially expressed mRNA.
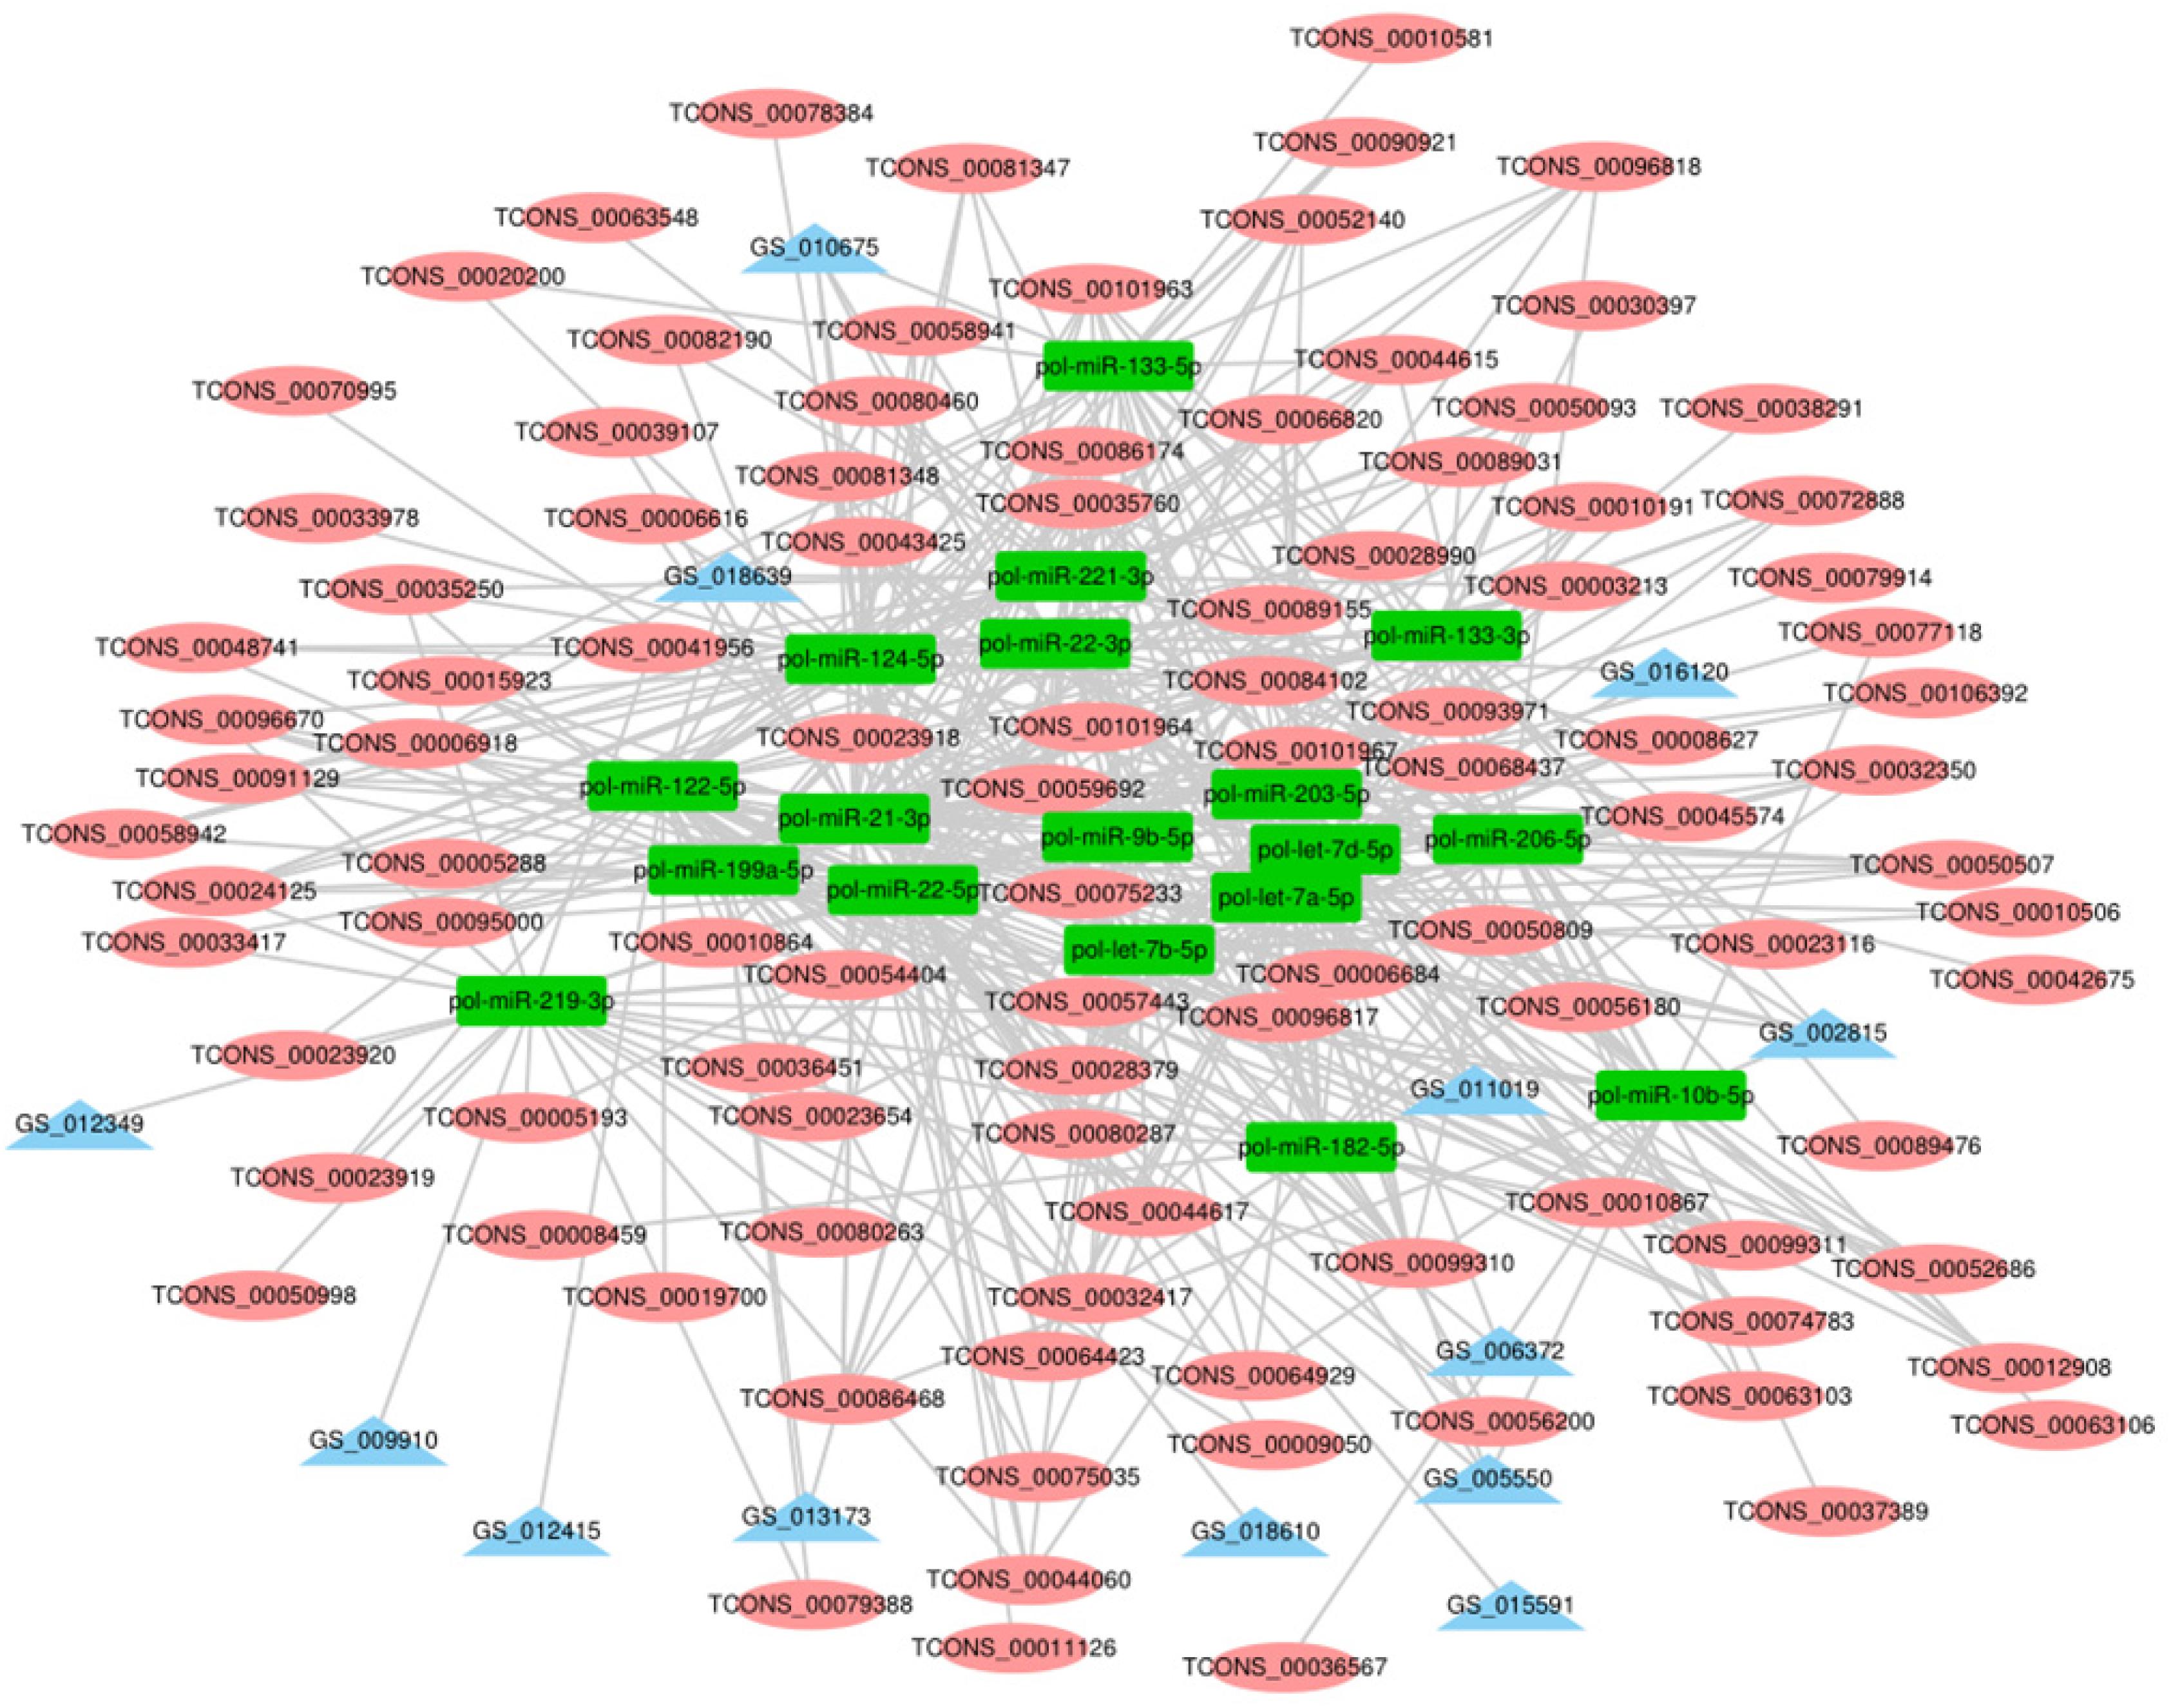
Figure 7. The lncRNA – miRNA-mRNA interaction network in A vs. B. In the network, blue triangles represent mRNAs, red ovals represent lncRNAs, and green rectangles represent miRNAs.
Discussion
More and more lncRNAs have been discovered in different tissues and cells by high-throughput sequencing technology, some of which have been proven to play important roles in the growth or disease development of some mammals (Geng et al., 2013; White et al., 2014; Gao et al., 2017) and other model organisms (Pauli et al., 2012; Grote et al., 2013). In this study, only 67.32% of the B_2_3 sample in the RNA-seq results was mapped to the Japanese flounder genome, and the mapping rate was a bit low. The main reason for the low reference genome-mapping rate is that the genome assembly of the reference species is not ideal. NCBI has two reference genomes of Japanese flounder, and the assembly quality is not high. ContigN50 is 30K and 36K, respectively. In general, the longer the contigN50, the better the assembly result. Previous reports have shown that the mapping rates were only 74 and 85% (Zhang et al., 2016; Sun et al., 2020), which are relatively low. There are still few analyses of Japanese flounder with the reference genome, most of which are Denovo strategies, which also reflects that the Japanese flounder genome is not very good.
The identification and characterization of lncRNAs in Japanese flounder, especially in skeletal muscle development, are very limited compared to those of lncRNAs in mammals. In this study, we identified 751 lncRNAs in four stages (A, B, C, D) of Japanese flounder skeletal muscle development through high-throughput sequencing. We also identified differentially expressed mRNAs and lncRNAs among the A versus B, A versus C, A versus D, B versus C, B versus D, and C versus D comparisons, respectively, 9549, 8673, 9181, 1821, 1080, and 557 differentially expressed mRNAs and 232, 211, 194, 28, 29, and 14 differentially expressed lncRNAs. These may have specific biological functions in skeletal muscle development of Japanese flounder. In recent years, the biological effects of some lncRNAs in muscle have been reported. For example, it is reported that lncRNA AK 017368 can promote the proliferation and inhibit the differentiation of skeletal muscle myoblasts (Liang et al., 2017). Linc-MD1 is the first identified lncRNA specifically involved in muscle differentiation (Cesana et al., 2011). In addition, the newly identified lncRNA MAR promotes muscle differentiation and regeneration and may also be a novel therapeutic target for the treatment of aging or muscle atrophy (Zhang et al., 2018). Therefore, differentially expressed lncRNAs identified here may also affect the development of skeletal muscle in Japanese flounder.
It is well known that lncRNAs can function by targeting protein-encoding genes. In this study, we hypothesized their potential biological function by predicting the cis- and trans-regulated target genes of lncRNAs. Recent studies have also shown that lncRNAs are involved in cis-regulatory activity in muscle development. Studies have shown that lncRNA-Six1, located 432 bp upstream of the protein-encoding gene Six homeobox 1 (Six1), promotes cell proliferation and participates in muscle growth through cis-acting regulation of genes (Cai et al., 2017). Previous studies show that the lncRNA Dum located upstream of the developmental pluripotency-associated 2 (Dppa2) gene is involved in myogenic differentiation and muscle regeneration (Wang et al., 2015). Here, we screened all the coding genes 100k upstream and downstream of the differentially expressed lncRNAs as cis-targets. In the comparisons of A versus B, A versus C, A versus D, B versus C, B versus D, and C versus D, 200, 200, 200, 93, 47, and 11 pairs of lncRNAs and genes were found to have cis-regulation relations, respectively. The identified cis-regulatory genes have important significance for predicting the function of lncRNAs. Thus, the regulatory role of lncRNAs on muscle development needs to be investigated further. Many studies have shown that lncRNA participates in muscle development through trans-acting. The synergistic activity of the two DNA enhancer elements CE and DRR located in the ∼24 kb upstream region of MYOD1 regulates the level of MyoD expression in the myogenic lineage, whereas DDRRNA promotes the expression of myogenin by trans-acting (Mousavi et al., 2013). MUNC, also known as DRR (eRNA), is located 5 kb upstream of the transcription start site of MyoD and promotes the function of MyoD during skeletal muscle development (Mueller et al., 2015). Based on the results of differential co-expression, the lncRNAs and mRNAs that are not on the same chromosome were selected as candidate targets. In the comparisons of A versus B, A versus C, A versus D, B versus C, B versus D, and C versus D, 29, 19, 24, 38, 8, and 47 pairs of LncRNAs and genes were found to have trans-regulation relations. These results suggest that lncRNA may participate in the development of Japanese flounder skeletal muscle through cis- or trans-acting mechanisms.
To identify the potential function of lncRNAs, in this study, we performed GO and KEGG enrichment analysis on the predicted cis- and trans-target genes of differentially expressed lncRNAs to understand the function of these differentially expressed lncRNA target genes and further predict the biological function of lncRNAs. In these enrichment analysis results, we find that the cis-acting regulatory gene LOC109635692 is enriched for the term “myosin VII complex, actin filament binding.” Furthermore, LOC109635692 is also found to be the cis-target gene predicted by lncRNA TCONS_00056200 and TCONS_00056180. The gene shows a downward trend in the comparison of A and B. During fish growth, increasing muscle fiber number or muscle size is the major muscle growth process. This gene is related to one of the factors that affect muscle development. A negative correlation is observed between LOC109635692 and TCONS_00056200, and a positive correlation is observed between LOC109635692 and TCONS_00056180, indicating that different lncRNAs may regulate the same target gene in different ways to regulate muscle development. Some coding genes regulated by lncRNA trans-action are also enriched in terms and pathways related to muscle development. For example, LOC109626851 identified in the comparison of B and C is enriched in the myosin filament term, LOC109648097 identified in the comparison of B and D is also enriched in the term of myosin filament, and the genes identified in the comparison of C and D, such as LOC109626999 and LOC109643555, are enriched in terms, such as actin binding. These genes are all cis- or trans-regulated with lncRNA. These results indicate that lncRNA may participate in the development of skeletal muscle in Japanese flounder.
Previous studies show that cacna1d is an important regulator of muscle development (Krasnyi and Ozernyuk, 2011, Park et al., 2018). In the lncRNA–gene network comparing A and C, the cacna1d gene -s the predicted cis-target of TCONS_00034769 (Figure 3B). In addition, it is enriched in the term of “skeletal muscle fiber development” in GO enrichment analysis. Moreover, the expression levels of cacna1d and TCONS_00034769 in stage A are higher than those in stage C. These results indicate that TCONS_00034769 targets cacna1d through a cis-regulatory mechanism to regulate skeletal muscle development in Japanese flounder. In the lncRNA–gene network comparing A and B, the actin-related protein 3B-like gene is the predicted cis-target of TCONS_00041871 (Figure 3A). In addition, it is enriched in the terms of “regulation of myosin II filament organization, positive regulation of actin filament polymerization, and actin binding” in GO enrichment analysis. In the skeletal muscle of Japanese flounder, the expression level of actin-related protein 3B-like in stage B is higher than that in stage A, indicating that this gene may be related to one of the factors that affect muscle development. The predicted regulatory lncRNA, TCONS_00041871, can control the expression of actin-related protein 3B-like through the cis-regulatory mechanism and is expressed at a higher level in skeletal muscle in stage A than in stage B. This negative correlation between LncRNA and target genes indicates that lncRNA regulates the muscle development of Japanese flounder by inhibiting the expression of the gene. Kin of IRRE like 2 (kirrel2) is predicted to be a cis-acting target of TCONS_00089031 (Figure 3A), and it is enriched in the terms of “myosin binding and positive regulation of actin filament polymerization” in GO enrichment analysis. In the skeletal muscle of Japanese flounder, the expression level of kirrel2 in stage A is higher than that in stage B. The predicted regulatory lncRNA, TCONS_00089031 can regulate the expression of kirrel2 through the cis-regulatory mechanism and is expressed at a higher level in skeletal muscle in stage A than in stage B. This positive correlation between lncRNA and target genes indicates that lncRNA regulates the muscle development of Paralichthys olivaceus by promoting the expression of the gene. In the lncRNA–gene network comparing A and D, the myosin-7B-like gene is the predicted cis-target of TCONS_00038291 (Figure 3C). In addition, it is enriched in the term of “myosin filament” in GO enrichment analysis. These results indicate that these lncRNAs play a role in the development of Japanese flounder skeletal muscle by regulating the related genes.
Both lncRNA and miRNA have their own regulatory networks. Their regulatory networks are not independent but are intertwined and interdependent, and they also have regulatory relationships and form complex regulatory networks with mRNA. In the study of pancreatic cancer, the large-scale effects of interrelated miRNAs are revealed by establishing an lncRNA–miRNA–mRNA regulatory network and constructing a model for predicting the disease mechanisms of miRNAs (Ye et al., 2014). In this study, we also predicted the biological function of lncRNAs by establishing lncRNA–miRNA–mRNA networks. Co-expression networks show that most lncRNAs interact with one or two predicted miRNAs that are involved in muscle growth and development. Some of these lncRNAs (including TCONS_00093971, TCONS_00096817, TCONS_00032744, etc.) have established interactions with at least three target miRNAs. Although these lncRNAs require further experimental validation, this information may help us explore the potential regulatory mechanisms of lncRNAs during Japanese flounder skeletal muscle growth and development.
Data Availability Statement
The sequencing data obtained from the RNA-seq were released to the National Center for Biotechnology Information (NCBI) Sequence Read Archive (SRA) database under the accession numbers SRR12102079, SRR12102078, SRR12102077, SRR12102076, SRR12102075, SRR12102074, SRR12102073, SRR12102072, SRR12102071, SRR12102070, SRR12102069, and SRR12102068.
Ethics Statement
The animal study was reviewed and approved by the Respective Animal Research and Ethics Committees of Ocean University of China.
Author Contributions
SW finished the experiment, analyzed the data, designed the tables and figures, and drafted the manuscript. BL, JZ, YH, SL, MZ, JL, YL, and HW revised the manuscript. FH conceived the study and revised the manuscript. All authors contributed to manuscript revision and approved the submitted version.
Funding
This research was supported by the National Nature Science Foundation of China (31672642) and the Natural Science Foundation of Shandong Province (ZR2014CM018). It is appreciated that the comments from editors and reviewers have greatly improved our manuscript.
Conflict of Interest
The authors declare that the research was conducted in the absence of any commercial or financial relationships that could be construed as a potential conflict of interest.
The reviewer QZ declared a shared affiliation, with no collaboration, with several of the authors, FH, SW, JZ, BL, YH, SL, HW, MZ, JL, YL, to the handling editor at the time of review.
Supplementary Material
The Supplementary Material for this article can be found online at: https://www.frontiersin.org/articles/10.3389/fgene.2020.01034/full#supplementary-material
Footnotes
- ^ https://www.ncbi.nlm.nih.gov/genome/?term=Japanese+flounder
- ^ http://bioconductor.org/packages/release/bioc/html/DESeq.html
References
Anders, S., and Huber, W. (2012). Differential Expression of RNA-Seq data at the Gene Level–the DESeq Package. Heidelberg: EMBL.
Bakhtiarizadeh, M. R., Hosseinpour, B., Arefnezhad, B., Shamabadi, N., and Salami, S. A. (2016). In silico prediction of long intergenic non-coding RNAs in sheep. Genome 59, 263–275. doi: 10.1139/gen-2015-0141
Buckingham, M. (2006). Myogenic progenitor cells and skeletal myogenesis in vertebrates. Curr. Opin. Gen. Dev. 16, 525–532. doi: 10.1016/j.gde.2006.08.008
Cabili, M. N., Cole, T., Loyal, G., Magdalena, K., Barbara, T. V., Aviv, R., et al. (2011). Integrative annotation of human large intergenic noncoding RNAs reveals global properties and specific subclasses. Genes Dev. 25, 1915–1927. doi: 10.1101/gad.17446611
Cai, B., Li, Z., Ma, M., Wang, Z., Han, P., Abdalla, B. A., et al. (2017). LncRNA-Six1 encodes a micropeptide to activate Six1 in Cis and is involved in cell proliferation and muscle growth. Front. Physiol. 8:230. doi: 10.3389/fphys.2017.00230
Cesana, M., Cacchiarelli, D., Legnini, I., Santini, T., Sthandier, O., Chinappi, M., et al. (2011). A long noncoding RNA controls muscle differentiation by functioning as a competing endogenous RNA. Cell 147, 358–369. doi: 10.1016/j.cell.2011.09.028
Durcan, P. J., Conradie, J. D., Devyver, M. V., and Myburgh, K. H. (2014). Identification of novel Kirrel3 gene splice variants in adult human skeletal muscle. BMC Physiol. 14:11. doi: 10.1186/s12899-014-0011-3
Eng, D., Ma, H. Y., Gross, M. K., and Kioussi, C. (2013). gene networks during skeletal myogenesis. ISRN Dev. Biol. 2013, 1–8. doi: 10.1155/2013/348704
Finn, R. D., Alex, B., Jody, C., Penelope, C., Eberhardt, R. Y., Eddy, S. R., et al. (2014). Pfam: the protein families database. Nucleic Acids Res. 42, 222–230.
Fu, Y., Shi, Z., Wu, M., Zhang, J., Jia, L., and Chen, X. (2011). Identification and differential expression of MicroRNAs during metamorphosis of the japanese flounder (Paralichthys olivaceus). PLoS One 6:e22957. doi: 10.1371/journal.pone.0022957
Fu, Y. S., Shi, Z. Y., Wang, G. Y., Li, W. J., Zhang, J. L., and Jia, L. (2012). Expression and regulation of miR-1, -133a, -206a, and MRFs by thyroid hormone during larval development in Paralichthys olivaceus. Comp. Biochem. Physiol. Part B Biochem. Mol. Biol. 161, 226–232. doi: 10.1016/j.cbpb.2011.11.009
Gao, X., Ye, J., Yang, C., Zhang, K., Li, X., Luo, L., et al. (2017). Screening and evaluating of long noncoding RNAs in the puberty of goats. BMC Genomics 18:164. doi: 10.1186/s12864-017-3578-9
Geng, C., Ziyun, W., Dongqing, W., Chengxiang, Q., Mingxi, L., Xing, C., et al. (2013). LncRNADisease: a database for long-non-coding RNA-associated diseases. Nucleic Acids Res. 41, D983–D986.
Girgenrath, S., Song, K., and Whittemore, L. A. (2005). Loss of myostatin expression alters fiber-type distribution and expression of myosin heavy chain isoforms in slow- and fast-type skeletal muscle. Muscle Nerve 31, 34–40. doi: 10.1002/mus.20175
Goodrich, J., and Kugel, J. (2006). Non-coding-RNA regulators of RNA polymerase II transcription. Nat. Rev. Mol. Cell Biol. 7, 612–616. doi: 10.1038/nrm1946
Grote, P., Wittler, L., Hendrix, D., Koch, F., Währisch, S., Beisaw, A., et al. (2013). The tissue-specific lncRNA Fendrr is an essential regulator of heart and body wall development in the mouse. Dev. Cell 24, 206–214. doi: 10.1016/j.devcel.2012.12.012
Han, L., Zhang, K., Shi, Z., Zhang, J., Zhu, J., Zhu, S., et al. (2012). LncRNA profile of glioblastoma reveals the potential role of lncRNAs in contributing to glioblastoma pathogenesis. Int. J. Oncol. 40, 2004–2012.
Handschin, C., Rhee, J., Lin, J., Tarr, P. T., and Spiegelman, B. M. (2003). An autoregulatory loop controls peroxisome proliferator-activated receptor γ coactivator 1α expression in muscle. Proc. Natl. Acad. Sci. U.S.A. 100, 7111–7116. doi: 10.1073/pnas.1232352100
Huang, Y., Wen, H., Zhang, M., Hu, N., Si, Y., Li, S., et al. (2018). DNA methylation status of MyoD and IGF-I gene correlated with its muscle growth during different development stages of Japanese flounder (Paralichthys olivaceus). Comp. Biochem. Physiol. Part B Biochem. Mol. Biol. 219-220, 33–43.
Iyer, M. K., Niknafs, Y. S., Rohit, M., Udit, S., Anirban, S., Yasuyuki, H., et al. (2015). The landscape of long noncoding RNAs in the human transcriptome. Nat. Genet. 47, 199–208.
Jebessa, E., Ouyang, H., Abdalla, B. A., Li, Z., Abdullahi, A. Y., Liu, Q., et al. (2018). Characterization of miRNA and their target gene during chicken embryo skeletal muscle development. Oncotarget. 9, 17309–17324. doi: 10.18632/oncotarget.22457
Keren, A., Tamir, Y., and Bengal, E. (2006). The p38 MAPK signaling pathway: a major regulator of skeletal muscle development. Mol. Cell. Endocrinol. 252, 224–230. doi: 10.1016/j.mce.2006.03.017
Krasnyi, A. M., and Ozernyuk, N. D. (2011). The expression of genes encoding the voltage-dependent L-type Ca 2+ channels in proliferating and differentiating C2C12 myoblasts of mice. Biol. Bull. 38, 292–296. doi: 10.1134/s1062359011030071
Lei, K., Yong, Z., Zhi-Qiang, Y., Xiao-Qiao, L., Shu-Qi, Z., Liping, W., et al. (2007). CPC: assess the protein-coding potential of transcripts using sequence features and support vector machine. Nucleic Acids Res. 35, W345–W349.
Li, A., Zhang, J., and Zhou, Z. (2014). PLEK: a tool for predicting long non-coding RNAs and messenger RNAs based on an improved k- mer scheme. BMC Bioinformatics 15:311. doi: 10.1186/1471-2105-15-311
Liang, S., Haitao, L., Dechao, B., Guoguang, Z., Kuntao, Y., Changhai, Z., et al. (2013). Utilizing sequence intrinsic composition to classify protein-coding and long non-coding transcripts. Nucleic Acids Res. 41, e166–e166.
Liang, T., Zhou, B., Shi, L., Wang, H., Chu, Q., Xu, F., et al. (2017). lncRNA AK017368 promotes proliferation and suppresses differentiation of myoblasts in skeletal muscle development by attenuating the function of miR-30c. FASEB J. 32, 377–389. doi: 10.1096/fj.201700560rr
Lina, M., Bajic, V. B., and Zhang, Z. (2013). On the classification of long non-coding RNAs. RNA Biol. 10, 924–933.
Livak, K. J., and Schmittgen, T. D. (2001). Analysis of relative gene expression data using real-time quantitative PCR and the 2(-Delta Delta C(T)) Method. Methods 25, 402–408. doi: 10.1006/meth.2001.1262
Lukiw, W. J., Handley, P., Wong, L., and Mclachlan, D. R. C. (1992). BC200 RNA in normal human neocortex, non-Alzheimer dementia (n.d.), and senile dementia of the Alzheimer type (AD). Neurochem. Res. 17, 591–597. doi: 10.1007/bf00968788
Lv, J., Liu, H., Yu, S., Liu, H., Cui, W., Gao, Y., et al. (2015). Identification of 4438 novel lincRNAs involved in mouse pre-implantation embryonic development. Mol. Gen. Genom. 290, 685–697. doi: 10.1007/s00438-014-0952-z
Mercer, T. R., Dinger, M. E., and Mattick, J. S. (2009). Long non-coding RNAs: insights into functions. Nat. Rev. Genet. 10, 155–159.
Mercer, T. R., and Mattick, J. S. (2013). Structure and function of long noncoding RNAs in epigenetic regulation. Nat. Struct. Mol. Biol. 20, 300–307. doi: 10.1038/nsmb.2480
Ming-De, Y., Chih-Chen, H., Gi-Ming, L., Ann-Lii, C., Ya-Wen, L., and Shuang-En, C. (2005). Identification and characterization of a novel gene Saf transcribed from the opposite strand of Fas. Hum. Mol. Genet. 14, 1465. doi: 10.1093/hmg/ddi156
Minoru, K., Michihiro, A., Susumu, G., Masahiro, H., Mika, H., Masumi, I., et al. (2008). KEGG for linking genomes to life and the environment. Nucleic Acids Res. 36, D480-D484.
Morlando, M., Ballarino, M., Fatica, A., and Bozzoni, I. (2014). The role of long noncoding RNAs in the epigenetic control of gene expression. Chemmedchem 9, 505–510. doi: 10.1002/cmdc.201300569
Mousavi, K., Zare, H., Dell’Orso, S., Grontved, L., Gutierrez-Cruz, G., Derfoul, A., et al. (2013). eRNAs promote transcription by establishing chromatin accessibility at defined genomic loci. Mol. Cell. 51, 606–617. doi: 10.1016/j.molcel.2013.07.022
Mueller, A. C., Cichewicz, M. A., Dey, B. K., Layer, R., Reon, B. J., Gagan, J. R., et al. (2015). MUNC, a long noncoding RNA that facilitates the function of MyoD in skeletal myogenesis. Mol. Cell. Biol. 35, 498–513. doi: 10.1128/mcb.01079-14
Naya, F. J., Mercer, B., Shelton, J., Richardson, J. A., Williams, R. S, and Olson, E. N. (2000). Stimulation of slow skeletal muscle fiber gene expression by calcineurin in vivo. J. Biol. Chem. 275, 4545–4548. doi: 10.1074/jbc.275.7.4545
Nishina, H., Green, L. R., Mcgarrigle, H. H., Noakes, D. E., Poston, L., and Hanson, M. A. (2003). Effect of nutritional restriction in early pregnancy on isolated femoral artery function in mid-gestation fetal sheep. J Physiol. 553(Pt 2), 637–647. doi: 10.1113/jphysiol.2003.045278
Park, J. W., Lee, J. H., Kim, S. W., Han, J. S., and Park, T. S. (2018). Muscle differentiation induced up-regulation of calcium-related gene expression in quail myoblasts. Asian Australas. J. Anim. Sci. 31, 1507–1515. doi: 10.5713/ajas.18.0302
Pauli, A., Valen, E., Lin, M. F., Garber, M., Vastenhouw, N. L., Levin, J. Z., et al. (2012). Systematic identification of long noncoding RNAs expressed during zebrafish embryogenesis. Genome Res. 22, 577–591. doi: 10.1101/gr.133009.111
Philipp, K., Jill, C., Sujit, D., Nix, D. A., Radharani, D., Willingham, A. T., et al. (2007). RNA maps reveal new RNA classes and a possible function for pervasive transcription. Science 316, 1484–1488. doi: 10.1126/science.1138341
Phillip, G., Lars, W., David, H., Frederic, K., Sandra, W. H., Arica, B., et al. (2013). The tissue-specific lncRNA Fendrr is an essential regulator of heart and body wall development in the mouse. Dev. Cell 24, 206–214. doi: 10.1016/j.devcel.2012.12.012
Pieter-Jan, V., Kenny, H., Xiaowei, W., BjoRn, M., Lennart, M., Kris, G., et al. (2013). LNCipedia: a database for annotated human lncRNA transcript sequences and structures. Nucleic Acids Res. 41, 246–251.
Qian, B., Zhengtao, H., Feng, C., Ruiming, Z., Yi, D., Xue, S., et al. (2012). Transcriptome analysis of long non-coding RNAs of the nucleus accumbens in cocaine-conditioned mice. J. Neurochem. 123, 790–799. doi: 10.1111/jnc.12006
Saito, R., Smoot, M. E., Ono, K., Ruscheinski, J., Wang, P. L., Lotia, S., et al. (2012). A travel guide to cytoscape plugins. Nat. Methods 9, 1069–1076. doi: 10.1038/nmeth.2212
Sun, B., Li, X., Ning, X., and Sun, L. (2020). Transcriptome analysis of paralichthys olivaceus erythrocytes reveals profound immune responses induced by edwardsiella tarda infection. Int. J. Mol. Sci. 21:3094. doi: 10.3390/ijms21093094
Takayuki, A., Ribar, T. J., Williams, R.S., and Zhen, Y. (2004). Skeletal muscle adaptation in response to voluntary running in Ca2+/calmodulin-dependent protein kinase IV-deficient mice. Am. J. Physiol. Cell Physiol. 287, C1311–C1319.
Tang, Z., Yang, Y., Wang, Z., Zhao, S., Mu, Y., and Li, K. (2015). Integrated analysis of miRNA and mRNA paired expression profiling of prenatal skeletal muscle development in three genotype pigs. Sci. Rep. 5:15544.
Thomas, B., and Mathias, G. (2011). Transcriptional mechanisms regulating skeletal muscle differentiation, growth and homeostasis. Nat. Rev. Mol. Cell Biol. 12, 349–361. doi: 10.1038/nrm3118
Tseng, B. S., Zhao, P., Pattison, J. S., Gordon, S. E., Granchelli, J. A., Madsen, R. W., et al. (2002). Regenerated mdx mouse skeletal muscle shows differential mRNA expression. J. Appl. Physiol. 93, 537–545. doi: 10.1152/japplphysiol.00202.2002
Wang, L., Zhao, Y., Bao, X., Zhu, X., Kwok, Y. K.-Y., Sun, K., et al. (2015). LncRNA Dum interacts with Dnmts to regulate Dppa2 expression during myogenic differentiation and muscle regeneration. Cell Res. 25, 335–350. doi: 10.1038/cr.2015.21
White, N. M., Cabanski, C. R., Silva-Fisher, J. M., Dang, H. X., Govindan, R., and Maher, C. A. (2014). Transcriptome sequencing reveals altered long intergenic non-coding RNAs in lung cancer. Genome Biol. 15, 429.
Wu, S., Huang, Y., Li, S., Wen, H., Zhang, M., Li, J., et al. (2018). DNA methylation levels and expression patterns of Smyd1a and Smyd1b genes during Metamorphosis of the Japanese Flounder (Paralichthys olivaceus). Comp. Biochem. Physiol. B. Biochem. Mol. Biol. 223, 16–22. doi: 10.1016/j.cbpb.2018.05.002
Ye, S., Yang, L., Zhao, X., Song, W., Wang, W., and Zheng, S. (2014). Bioinformatics method to predict two regulation mechanism: TF–miRNA–mRNA and lncRNA–miRNA–mRNA in pancreatic cancer. Cell Biochem. Biophys. 70, 1849–1858. doi: 10.1007/s12013-014-0142-y
Young, M. D., Wakefield, M. J., Smyth, G. K., and Alicia, O. (2010). Gene ontology analysis for RNA-seq: accounting for selection bias. Genome Biol. 11, R14–R14.
Zhan, S., Dong, Y., Zhao, W., Guo, J., Zhong, T., Wang, L., et al. (2016). Genome-wide identification and characterization of long non-coding RNAs in developmental skeletal muscle of fetal goat. BMC Genomics 17:666. doi: 10.1186/s12864-016-3009-3
Zhang, W., Liu, Y., Yu, H., Du, X., Zhang, Q., Wang, X., et al. (2016). Transcriptome analysis of the gonads of olive flounder (Paralichthys olivaceus). Fish Physiol. Biochem. 42, 1581–1594. doi: 10.1007/s10695-016-0242-2
Zhang, Y. C., Liao, J. Y., Li, Z. Y., Yu, Y., Zhang, J. P., Li, Q. F., et al. (2014). Genome-wide screening and functional analysis identify a large number of long noncoding RNAs involved in the sexual reproduction of rice. Genome Biol. 15:512.
Zhang, Z. K., Li, J., Guan, D., Liang, C., Zhuo, Z., Liu, J., et al. (2018). A newly identified lncRNA MAR1 acts as a miR-487b sponge to promote skeletal muscle differentiation and regeneration. J. Cachexia Sarcopenia Muscle 9, 613–626. doi: 10.1002/jcsm.12281
Keywords: Japanese flounder, skeletal muscle, lncRNA, integrated analysis, transcriptome
Citation: Wu S, Zhang J, Liu B, Huang Y, Li S, Wen H, Zhang M, Li J, Li Y and He F (2020) Identification and Characterization of lncRNAs Related to the Muscle Growth and Development of Japanese Flounder (Paralichthys olivaceus). Front. Genet. 11:1034. doi: 10.3389/fgene.2020.01034
Received: 22 August 2019; Accepted: 11 August 2020;
Published: 09 September 2020.
Edited by:
Jiajie Peng, Northwestern Polytechnical University, ChinaReviewed by:
Hao Zhang, Jilin University, ChinaXungang Tan, Chinese Academy of Sciences, China
Quanqi Zhang, Ocean University of China, China
Copyright © 2020 Wu, Zhang, Liu, Huang, Li, Wen, Zhang, Li, Li and He. This is an open-access article distributed under the terms of the Creative Commons Attribution License (CC BY). The use, distribution or reproduction in other forums is permitted, provided the original author(s) and the copyright owner(s) are credited and that the original publication in this journal is cited, in accordance with accepted academic practice. No use, distribution or reproduction is permitted which does not comply with these terms.
*Correspondence: Feng He, aGVmZW5nb3VjQG91Yy5lZHUuY24=