 Kwan-Yeung Lee1*
 Kwong-Sak Leung1
 Suk Ling Ma2
 Hon Cheong So2,3,4,5,6,7,8
 Dan Huang9
 Nelson Leung-Sang Tang4,10,11*
 Man-Hon Wong1
- 1Department of Computer Science and Engineering, The Chinese University of Hong Kong, Hong Kong, China
- 2Department of Psychiatry, The Chinese University of Hong Kong, Hong Kong, China
- 3School of Biomedical Science, The Chinese University of Hong Kong, Hong Kong, China
- 4Hong Kong Branch of CAS Center for Excellence in Animal Evolution and Genetics, School of Biomedical Sciences, The Chinese University of Hong Kong, Hong Kong, China
- 5KIZ-CUHK Joint Laboratory of Bioresources and Molecular Research of Common Diseases, Kunming Institute of Zoology, The Chinese University of Hong Kong, Hong Kong, China
- 6Margaret K.L. Cheung Research Centre for Management of Parkinsonism, The Chinese University of Hong Kong, Hong Kong, China
- 7Shenzhen Research Institute, The Chinese University of Hong Kong, Shenzhen, China
- 8Brain and Mind Institute, The Chinese University of Hong Kong, Hong Kong, China
- 9Cytomics Ltd, Shatin, Hong Kong
- 10Department of Chemical Pathology and Li Ka Shing Institute of Health Sciences, Faculty of Medicine, The Chinese University of Hong Kong, Hong Kong, China
- 11Functional Genomics and Biostatistical Computing Laboratory, CUHK Shenzhen Research Institute, Shenzhen, China
In this study, we looked for potential gene-gene interaction in susceptibility to schizophrenia by an exhaustive searching for SNP–SNP interactions in 3 GWAS datasets (phs000021:phg000013, phs000021:phg000014, phs000167) using our recently published algorithm. The search space for SNP–SNP interaction was confined to 8 biologically plausible ways of interaction under dominant-dominant or recessive-recessive modes. First, we performed our search of all pair-wise combination of 729,454 SNPs after filtering by SNP genotype quality. All possible pairwise interactions of any 2 SNPs (5 × 10¹¹) were exhausted to search for significant interaction which was defined by p-value of chi-square tests. Nine out the top 10 interactions, protein coding genes were partnered with non-coding RNA (ncRNA) which suggested a new alternative insight into interaction biology other than the frequently sought-after protein–protein interaction. Therefore, we extended to look for replication among the top 10,000 interaction SNP pairs and high proportion of concurrent genes forming the interaction pairs were found. The results indicated that an enrichment of signals over noise was present in the top 10,000 interactions. Then, replications of SNP–SNP interaction were confirmed for 14 SNPs-pairs in both replication datasets. Biological insight was highlighted by a potential binding between FHIT (protein coding gene) and LINC00969 (lncRNA) which showed a replicable interaction between their SNPs. Both of them were reported to have expression in brain. Our study represented an early attempt of exhaustive interaction analysis of GWAS data which also yield replicated interaction and new insight into understanding of genetic interaction in schizophrenia.
Introduction
Schizophrenia is a highly heritable disorder and it affected about 1% of the population worldwide (Sullivan et al., 2003, p. 20; Henriksen et al., 2017; Avramopoulos, 2018; Weinberger, 2019). Twins studies suggested the heritability is around 80% (Sullivan et al., 2003; Henriksen et al., 2017; Avramopoulos, 2018) and common variants contributed to up to half of the genetic risk of schizophrenia (International Schizophrenia Consortium et al., 2009; The Schizophrenia Psychiatric Genome-Wide Association Study (Gwas) Consortium, 2011). Genome-wide association studies (GWAS) identified more than 180 loci that were associated with the risk of schizophrenia (Ripke et al., 2014; Li et al., 2017; Pardiñas et al., 2018). Some of the genes were well known target for treatment such as dopamine receptor D2 (DRD2) and some new genes related to immune system were identified, which provided new target for therapy development. However, the SNPs identified by GWAS only explained a small effect on the disease risk (Manolio et al., 2009) and a large subset of SNPs associated with the disease is uncovered.
Single SNPs often have a small effect on the phenotype and they cannot account for all the genetic susceptibility of diseases. Many researchers explored various ways to re-analyse the GWAS data using approaches on top of the prevailing single SNP analysis, commonly used in GWAS analysis. For example, sub-classification of the phenotypes (Ruderfer et al., 2018), integration of omics data (Jaffe et al., 2018) and various ways of pathway or network analysis had been performed (Wang et al., 2019). On the other hand, it is recognized that SNP–SNP interaction can act as a stronger risk factor by working synergistically. Recently, the specific mode of enhancer-promoter interaction in GWAS had been pursued (Wu and Pan, 2018). A study showed some SNPs were not associated with the phenotypes of the disease when they were examined individually and they were only identified when examined in combination (Gerke et al., 2009). Our previous study on IGF1 promoter showed the interaction between a pair of SNPs and short tandem repeat (STR) resulted in the regulation on the level of circulating IGF1 (Chen et al., 2011, 2013, 2016). However, the association was not significant when individual SNP was examined. Furthermore, a recent study showed that the weak interaction of transcription factor to its promoter was able to regulate the expression of the gene (de Boer et al., 2020), further supporting SNP–SNP interaction provided synergistic effect on gene regulation. Other than SNP–SNP interaction occurring on the same gene, we and others showed SNP–SNP interaction across different genes were also important in determining the risk or severity of diseases including psoriasis (Lee et al., 2018), schizophrenia (Schrode et al., 2019), cancer (Lin et al., 2013), and obesity (Dong et al., 2017).
Genome-wide association studies is an important tool to identify SNP associating with a variety of diseases. However, only marginal effects of SNPs were detected. SNP–SNP interaction played an essential role in the pathogenesis of complex diseases (Phillips, 2008). To examine the SNP–SNP interaction in a GWAS dataset, there were over 10 billions of pairwise SNP combinations and it caused a huge demand of computational power. One approach was to limit the pairing of SNPs using specific features like genomic location in a study focused to the scope of Enhancer–Promoter interaction (Wu and Pan, 2018). With the improvement of computational power and better algorithm, it is now possible to exhaust all possible pairwise SNP combinations in a GWAS dataset to calculate the statistical significance of all possible pairwise interactions (Wan et al., 2010; Zhu et al., 2013; Lee et al., 2018). Another challenge for the detection of SNP-SNP interaction is arose from the multiple testing and interactions with weak effect size will not be detected under the stringent threshold. Exhaustive search approach is one of the major categories for detecting SNP–SNP interaction and the multi-factor dimensionality reduction (MDR) approach generates 3 × 3 genotype tables which may predict for high risk and low risk genotype. However, the SNP–SNP interaction identified might not be biologically interpretable.
We developed an algorithm which generated eight biological plausible SNP-SNP interactions (Chu et al., 2016) and identified some novel SNP-SNP interactions associating with the risk of psoriasis in our previous study (Lee et al., 2018). In this study, we utilized this algorithm to perform the exhaustive search for statistically significant 2nd order SNP–SNP interactions from our discovery dataset phs000021:phg000013. First, we found that 9 out of the top 10 SNP-SNP interactions in terms of p-value could be interpreted as the interactions between protein coding genes and non-coding RNA (ncRNA) genes which suggested the importance of interactions other than that of the traditional protein-protein interactions. After that, we investigated the replication among the top 10,000 SNP-SNP interactions and there was a high proportion of concurrent genes among the gene-gene interaction predicted from these SNP–SNP interaction. Therefore, there was an enrichment of signals over noise among these interactions. Finally, 9 SNP–SNP interactions were successfully replicated in both replication datasets. Among these SNP–SNP interactions, one of them could be interpreted as the interaction between FHIT (protein coding) and LINC00969 (lncRNA). Both of them were reported to have expression in brain.
Materials and Methods
Restricting Search Space of SNP–SNP Interaction With Biologically Plausible Genotype Interaction Patterns
The distribution of different genotypes of every 2nd order SNP combination across cases and controls can be measured and visualized as a 3 × 3 genotype table. Each genotype is represented as a cell in the 3 × 3 genotype table and can be labeled as high-risk or low-risk through statistical or heuristic algorithms like multi-factor dimensionality reduction (MDR) algorithm and its derivatives (Gola et al., 2015). However, the interactions found by these algorithms may have labeling patterns which may not be explained biologically. In this paper, we have applied eight 2nd order biological plausible SNP–SNP interaction labeling patterns (Chu et al., 2016; Lee et al., 2018) for labeling genotypes as high-risk or low risk in our exhaustive search. The principles and assumptions in deriving these eight SNP–SNP interaction patterns are shown in Figure 1 and are explained below.
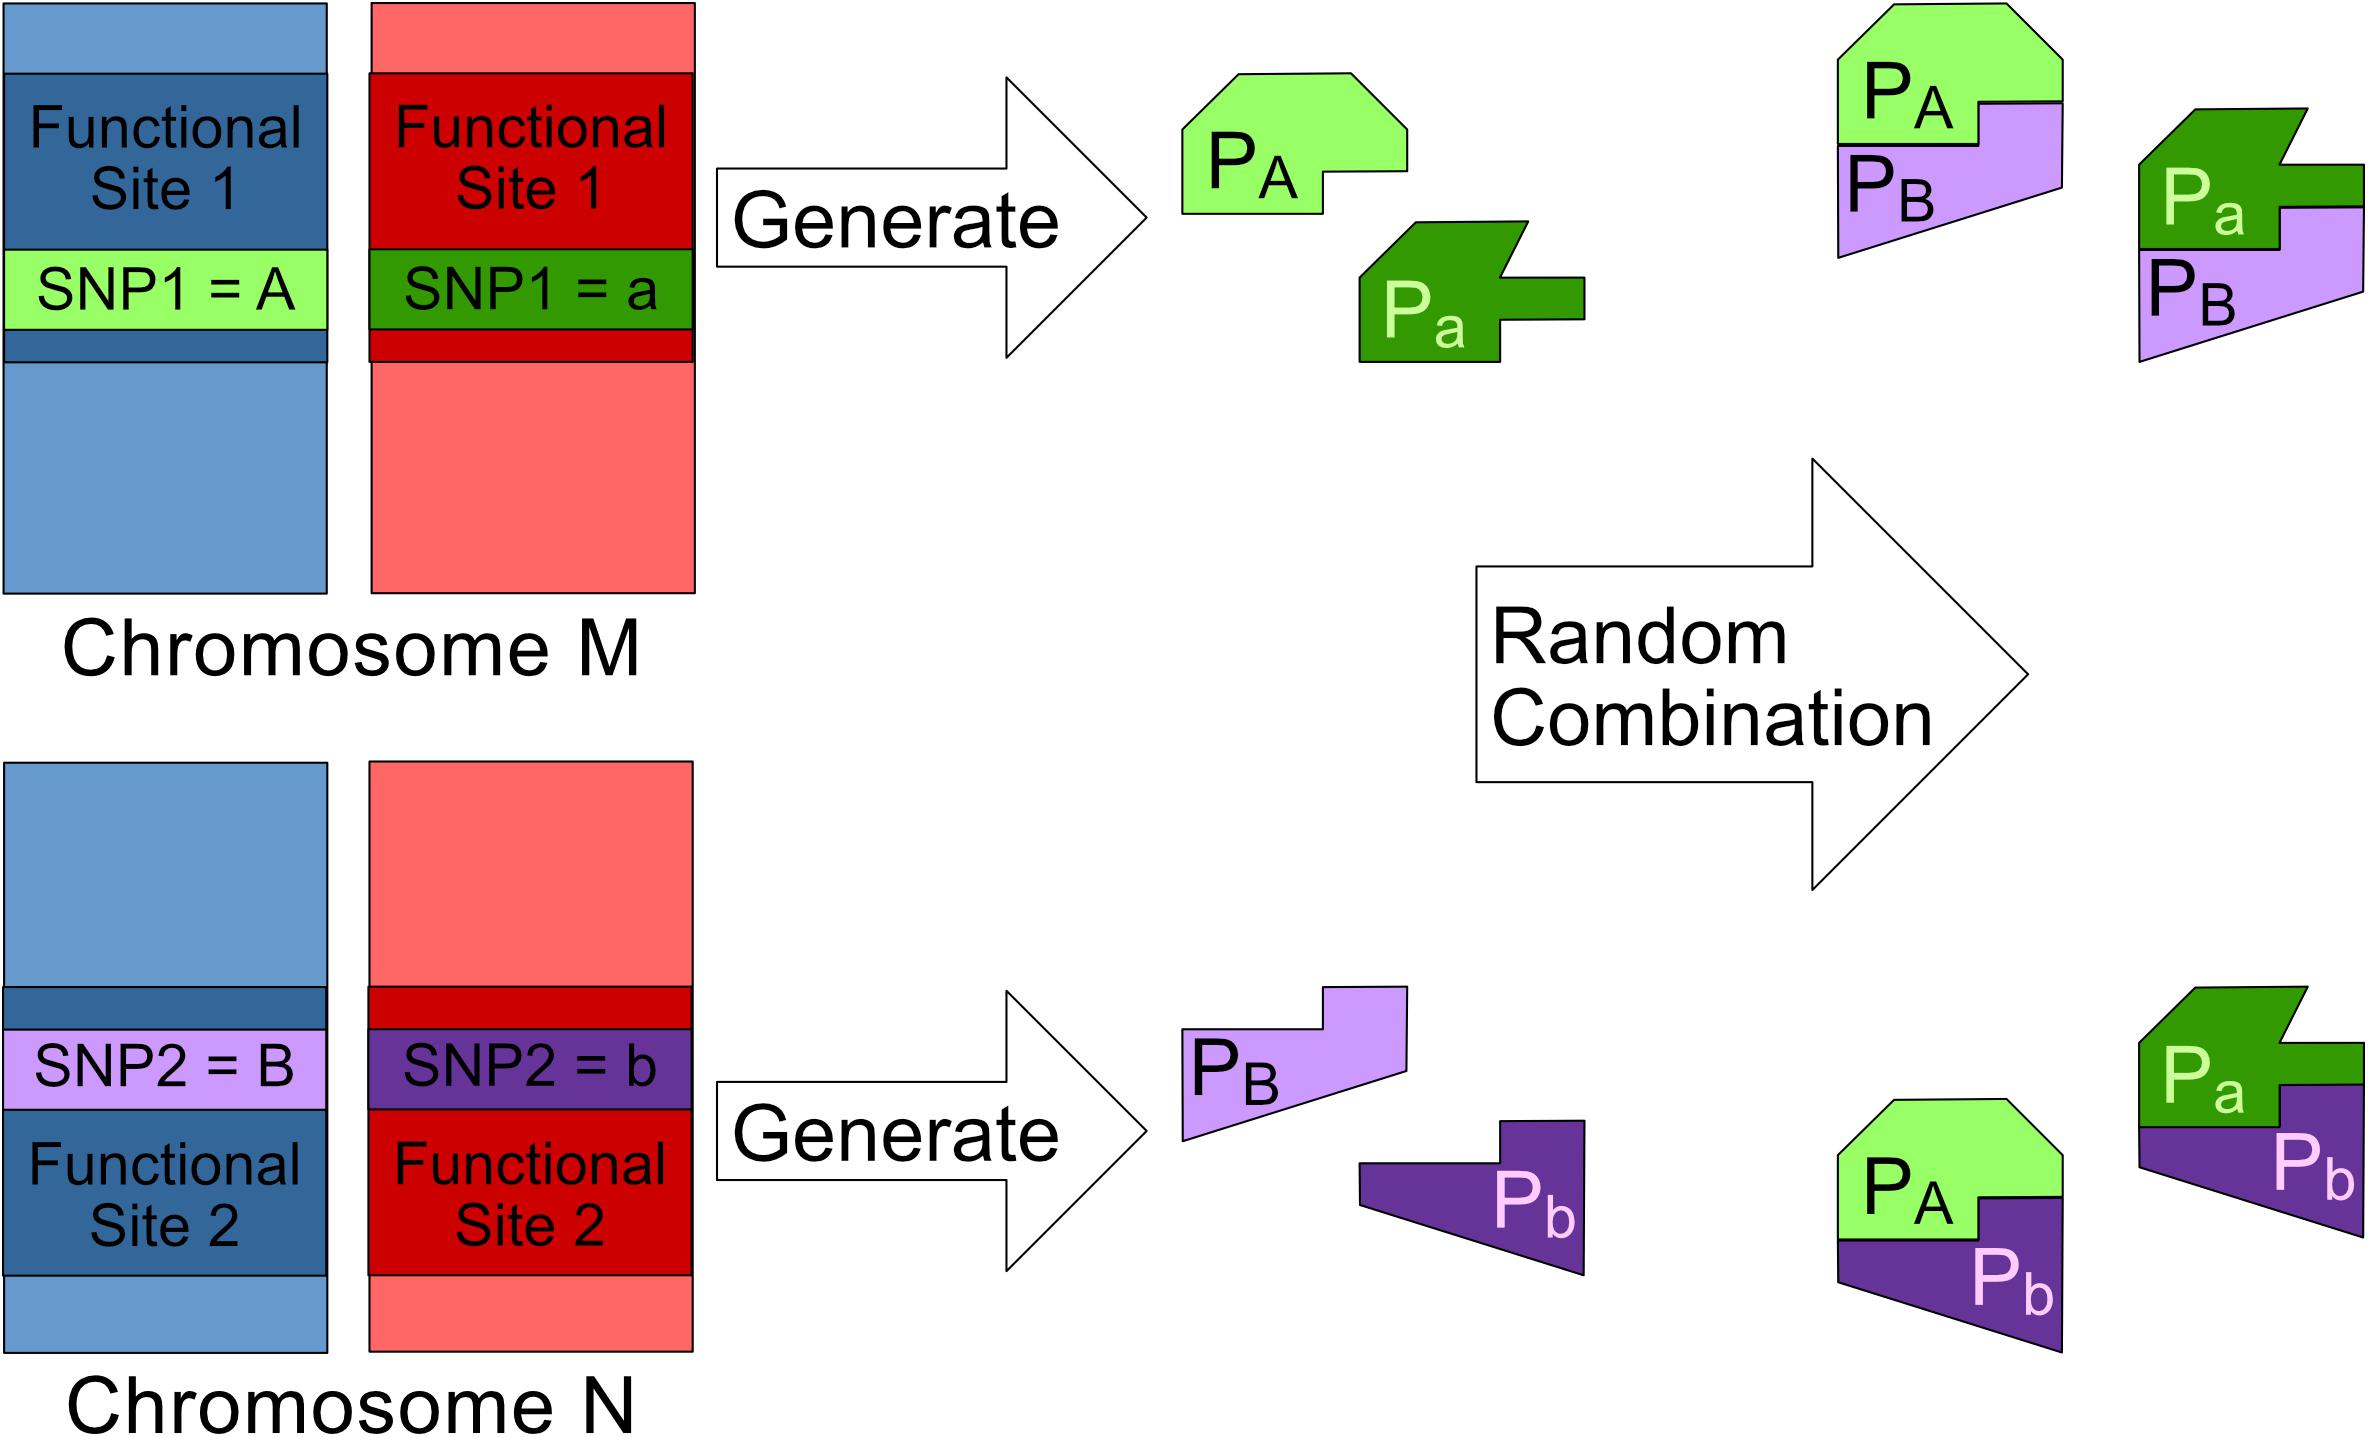
Figure 1. This figure shows the bio-molecule interaction mechanism behind a 2nd order SNP–SNP interaction where SNP1 and SNP2 are both having genotype (Major, Minor). Major alleles represented by upper-case letters (i.e., A, B) and minor alleles represented by lower-case letters (i.e., a, b) (Lee et al., 2018).
1. SNP1 and SNP2 are found in two different functional sites namely Site1 and Site2 respectively. (Letters “A” and “B” represent the major alleles of SNP1 and SNP2 respectively. Meanwhile, letters “a” and “b” represent the minor alleles of SNP1 and SNP2 respectively).
2. SNP1 and SNP2 can affect their respective functional sites and cause each site to generate at most two different subtypes of bio-molecules. For example, bio-molecules pA is generated from Site1 with SNP1 having a major allele.
3. The bio-molecules generated from Site1 and Site2 can randomly dock with each other to form at most four different bio-molecule complexes For example, bio-molecules pA and pB can combine with each other to form complex pApB.
4. A bio-molecule complex is considered to be associated to the genetic disease if any one of the following two conditions is satisfied:
a. Its dominant interaction can either promote or inhibit a disease.
b. Its recessive interaction presence can either promote or inhibit a disease.
Those eight SNP–SNP interaction patterns are shown in Figure 2. The pattern 1 in Figure 2 is derived through the following procedure. Without the loss of generality, assuming that pApB is the only bio-molecule complex associated to the genetic disease. If the dominant presence of pApB can either promote or inhibit the risk of a genetic disease, samples carrying genotype {AA, BB}, {AA, Bb}, {Aa, BB}, and {Aa, Bb} obviously would have a different disease risk level comparing to other samples. Pattern 1 is hence derived after labeling these genotypes with two different colors to reflect their difference in risk level. On the other hand, if only the recessive presence of pApB can either promote or inhibit a disease, samples carrying genotype {AA, BB} would have a different disease risk level comparing to other samples. Pattern 5 is hence derived after labeling these genotypes with two different colors to reflect their difference in risk level. Other patterns shown in Figure 2 can be also defined through a similar procedure shown above.
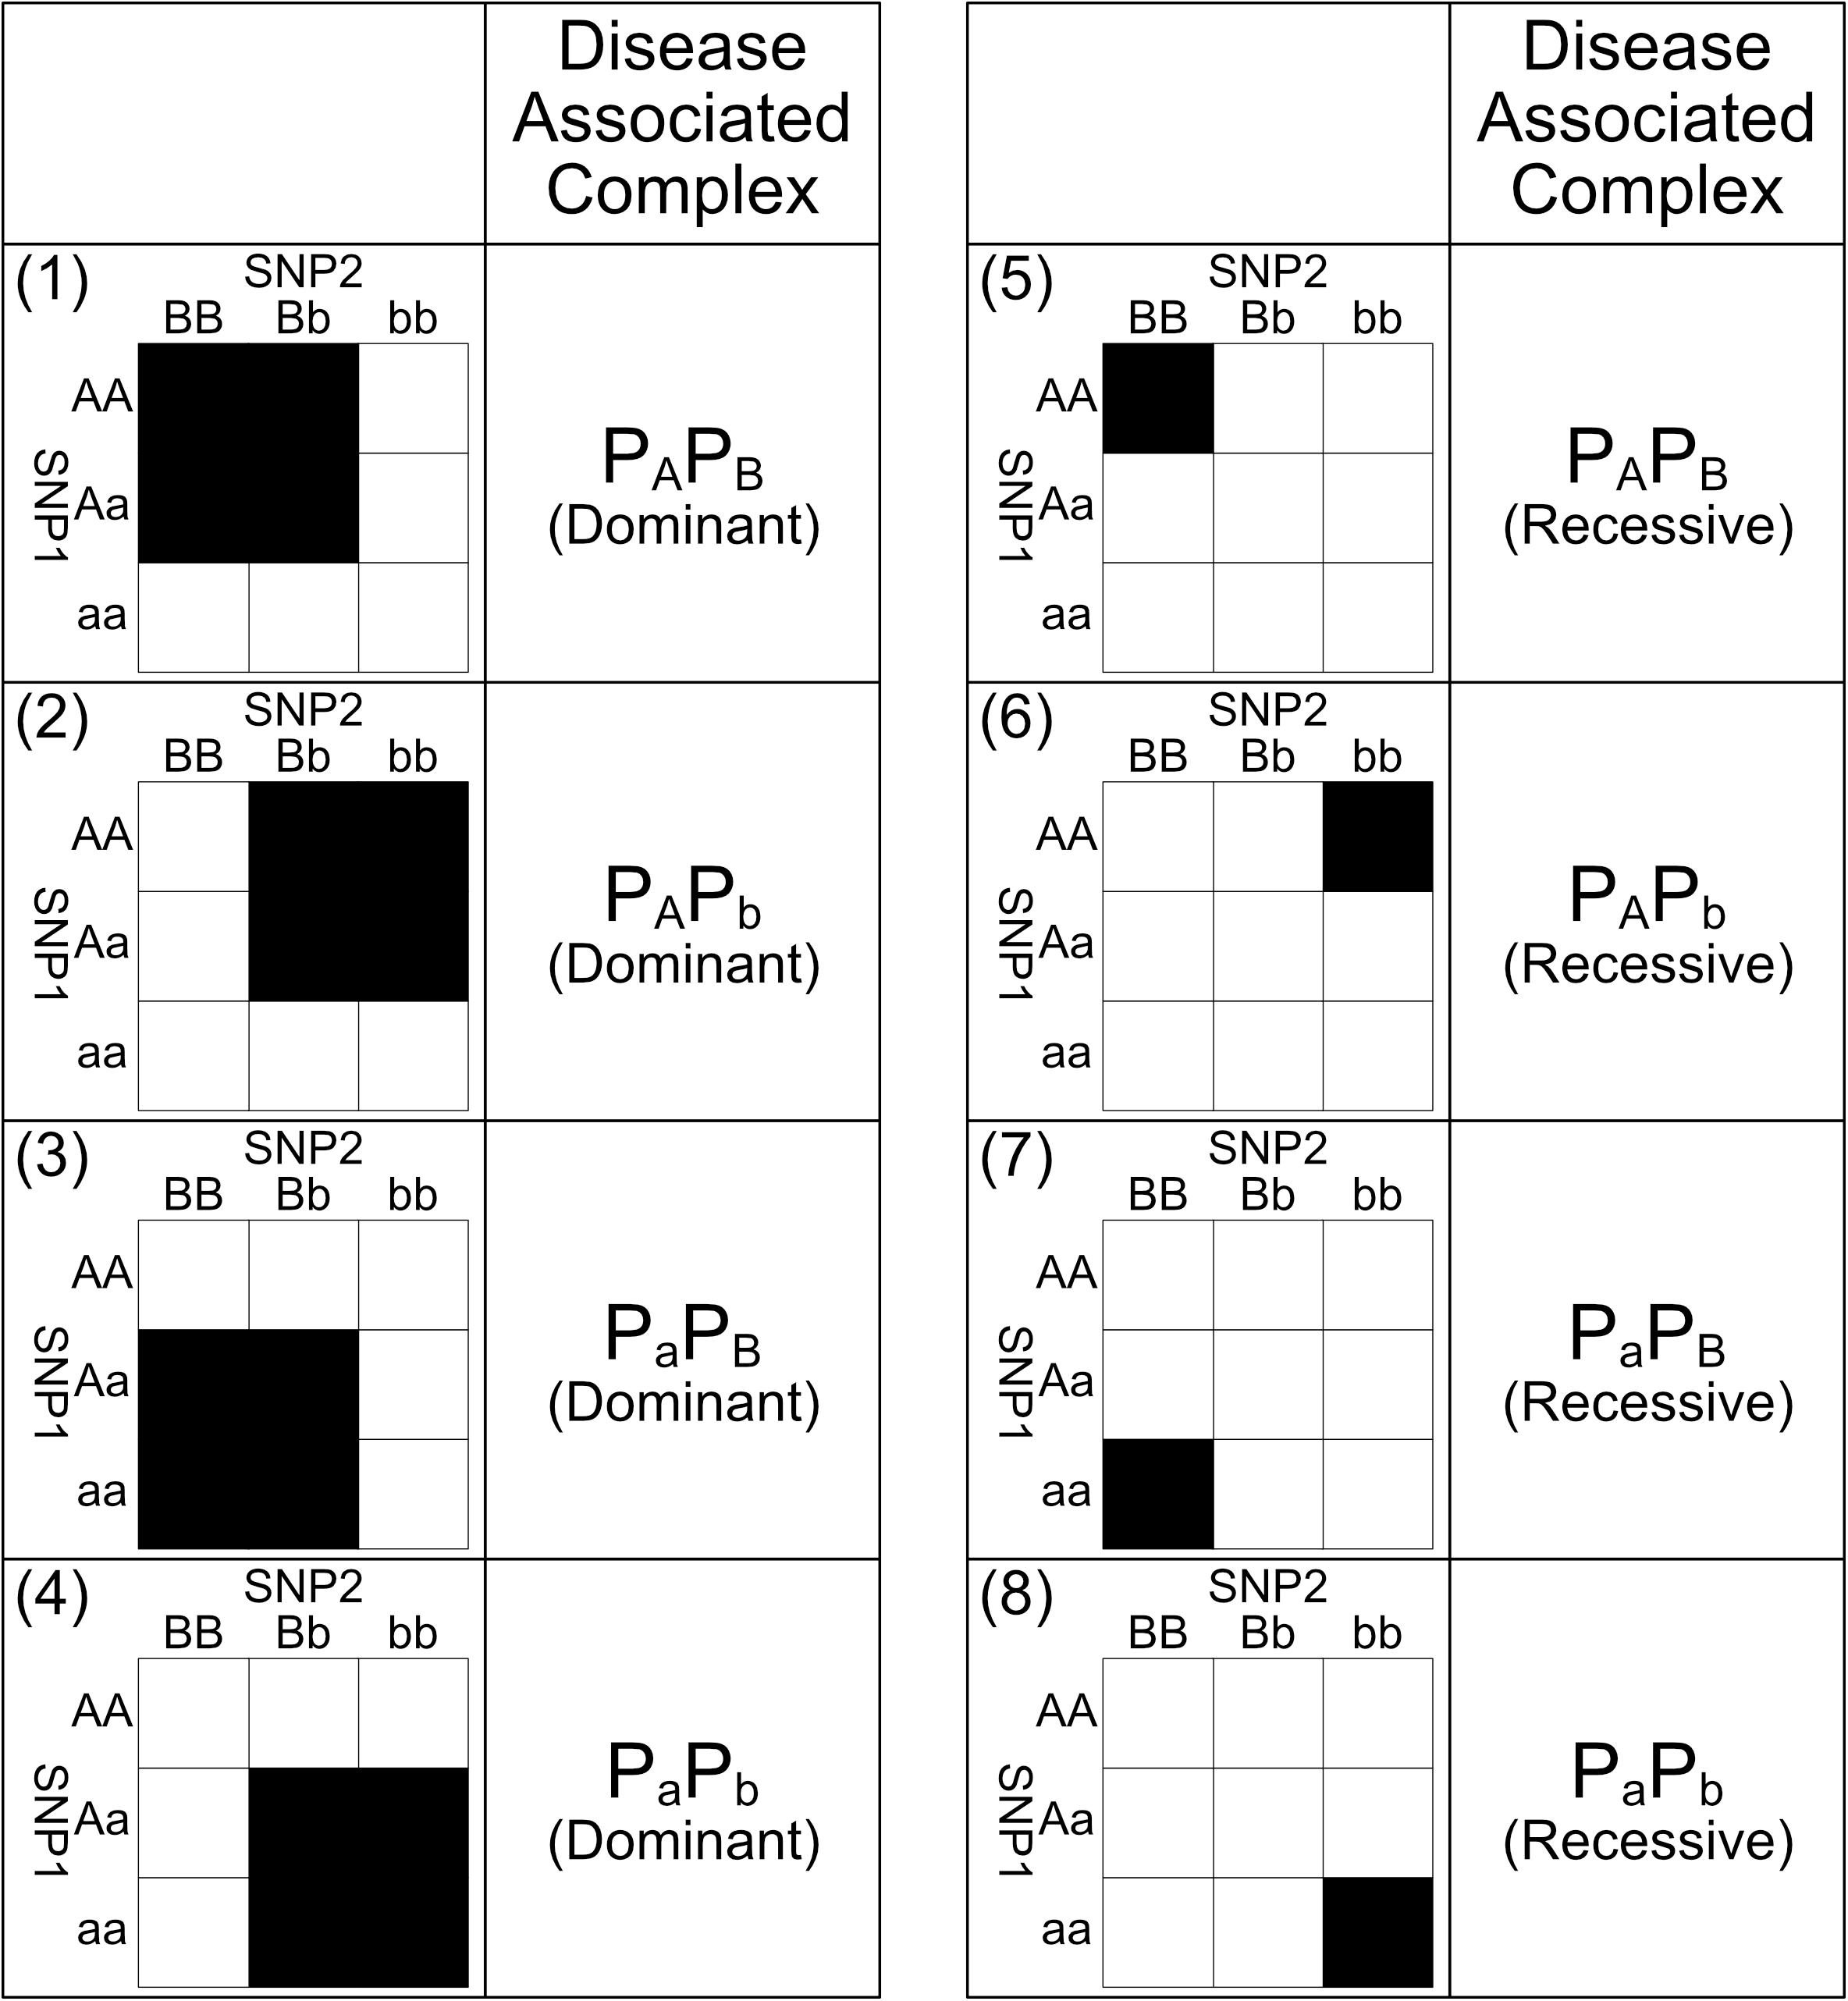
Figure 2. This figure shows the eight biologically plausible 2nd order genotype labeling patterns and their corresponding disease-associated complexes. Under dominant interaction patterns 1, 2, 3, and 4, their corresponding disease-associated complexes are presence in the samples carrying the black genotypes and absence in the counterpart genotypes. Meanwhile, under recessive interaction patterns 5, 6, 7, and 8, their corresponding disease-associated complexes are the only presence in the samples carrying the black genotypes and other complexes are presence in the counterpart genotypes. Among these eight interaction patterns, black genotypes and white genotypes have different risk levels caused by the difference in concentration of the disease associated bio-molecule complexes. Major alleles are represented by upper-case letters (i.e., A, B) and minor alleles are represented by lower-case letters (i.e., a, b) (Lee et al., 2018).
Finding Statistically Significant SNP–SNP Interactions With Exhaustive Search
After labeling the 3 × 3 genotype table of a 2nd order SNP combination, it can then be transformed into a 2 × 2 contingency table shown in Figures 3, 4. Among the black cells of the 3 × 3 genotype table at the left-hand side of Figure 3, the number of cases and controls are aggregated into the total number of cases (ND,B) and Controls (NH,B) respectively as shown in the table at the right-hand side of Figure 3. Similarly, the number of cases and controls of white genotypes are aggregated into ND,W and NH,W respectively. After calculating the aggregated number of cases and controls under different cell colors (ND,B, NH,B, ND,W and NH,W), a 2 × 2 contingency table can then be generated as shown in Figure 4.
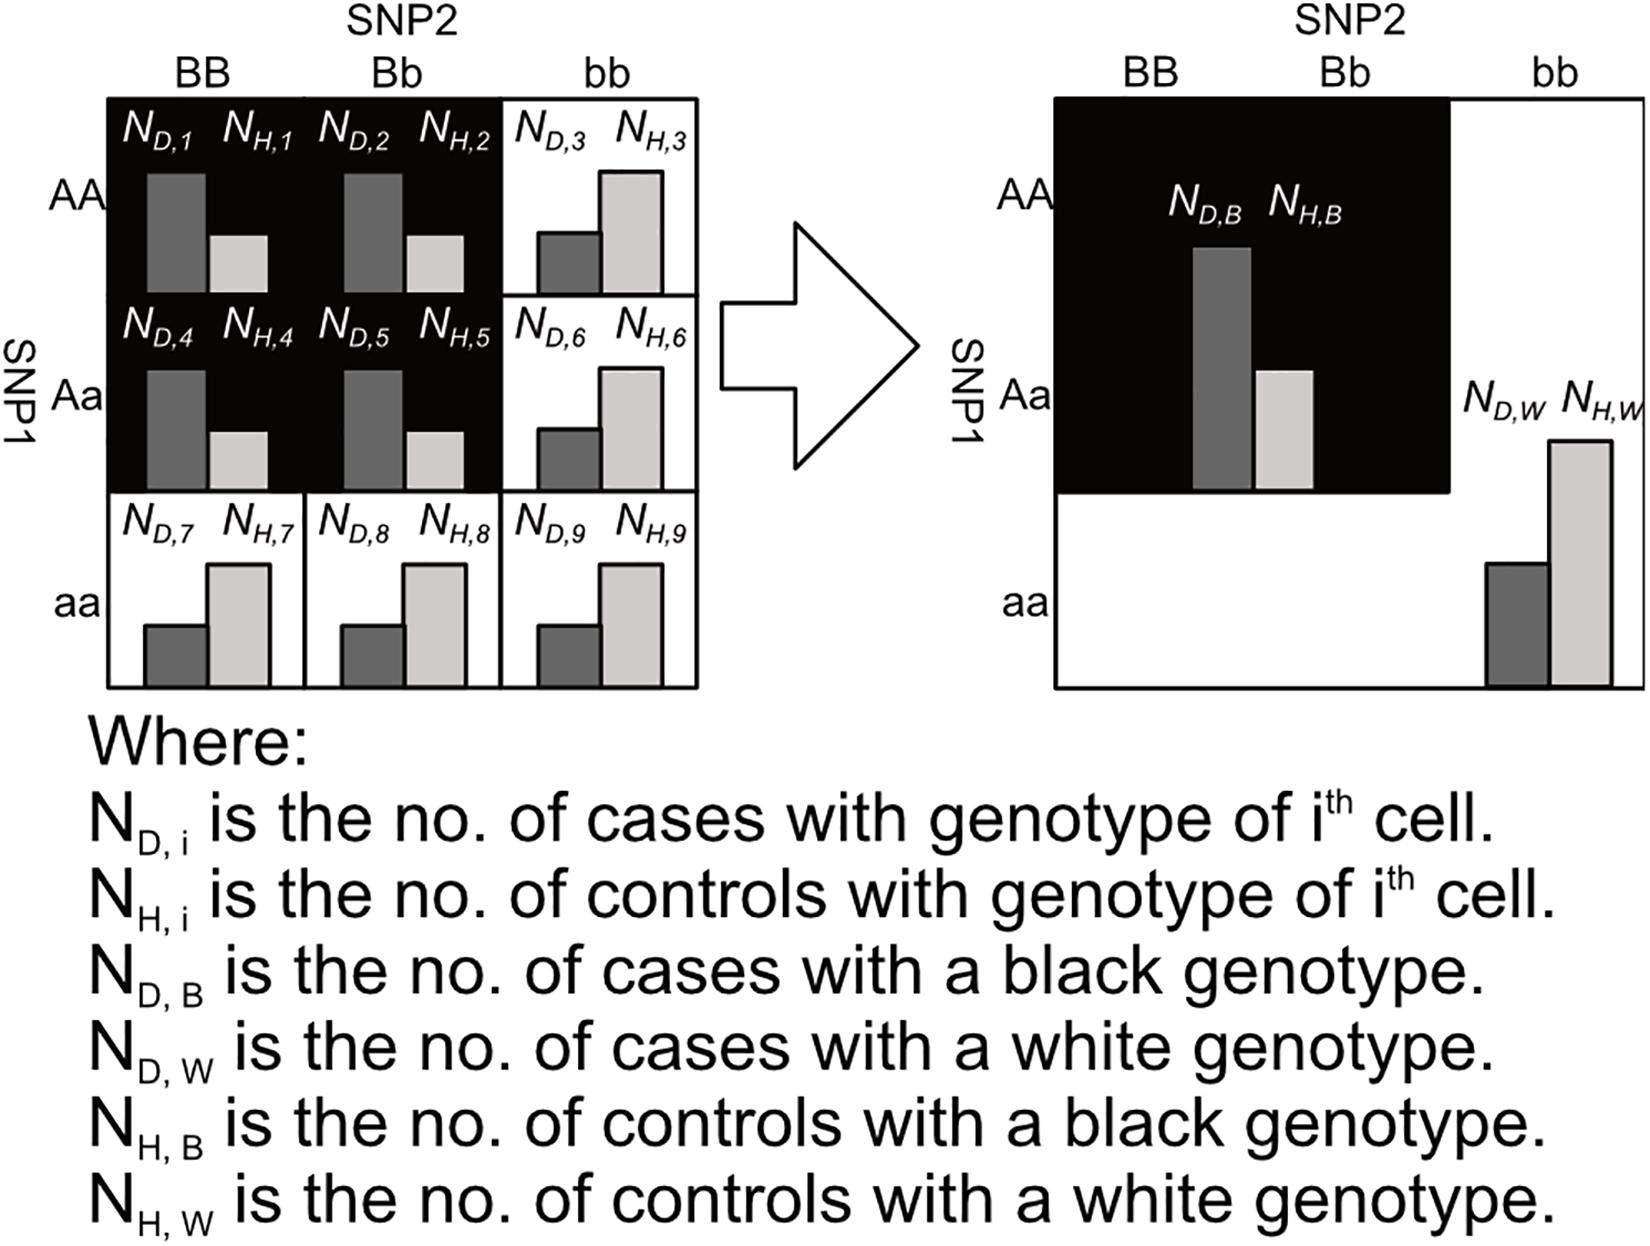
Figure 3. This figure shows the process of aggregating the number of cases and controls with black and white genotypes in a 3 × 3 table between SNP1 and SNP2, where the genotypes are colored according to the pattern 1 in Figure 2. Major alleles represented by upper-case letters (i.e., A, B) and minor alleles represented by lower-case letters (i.e., a, b) (Lee et al., 2018).
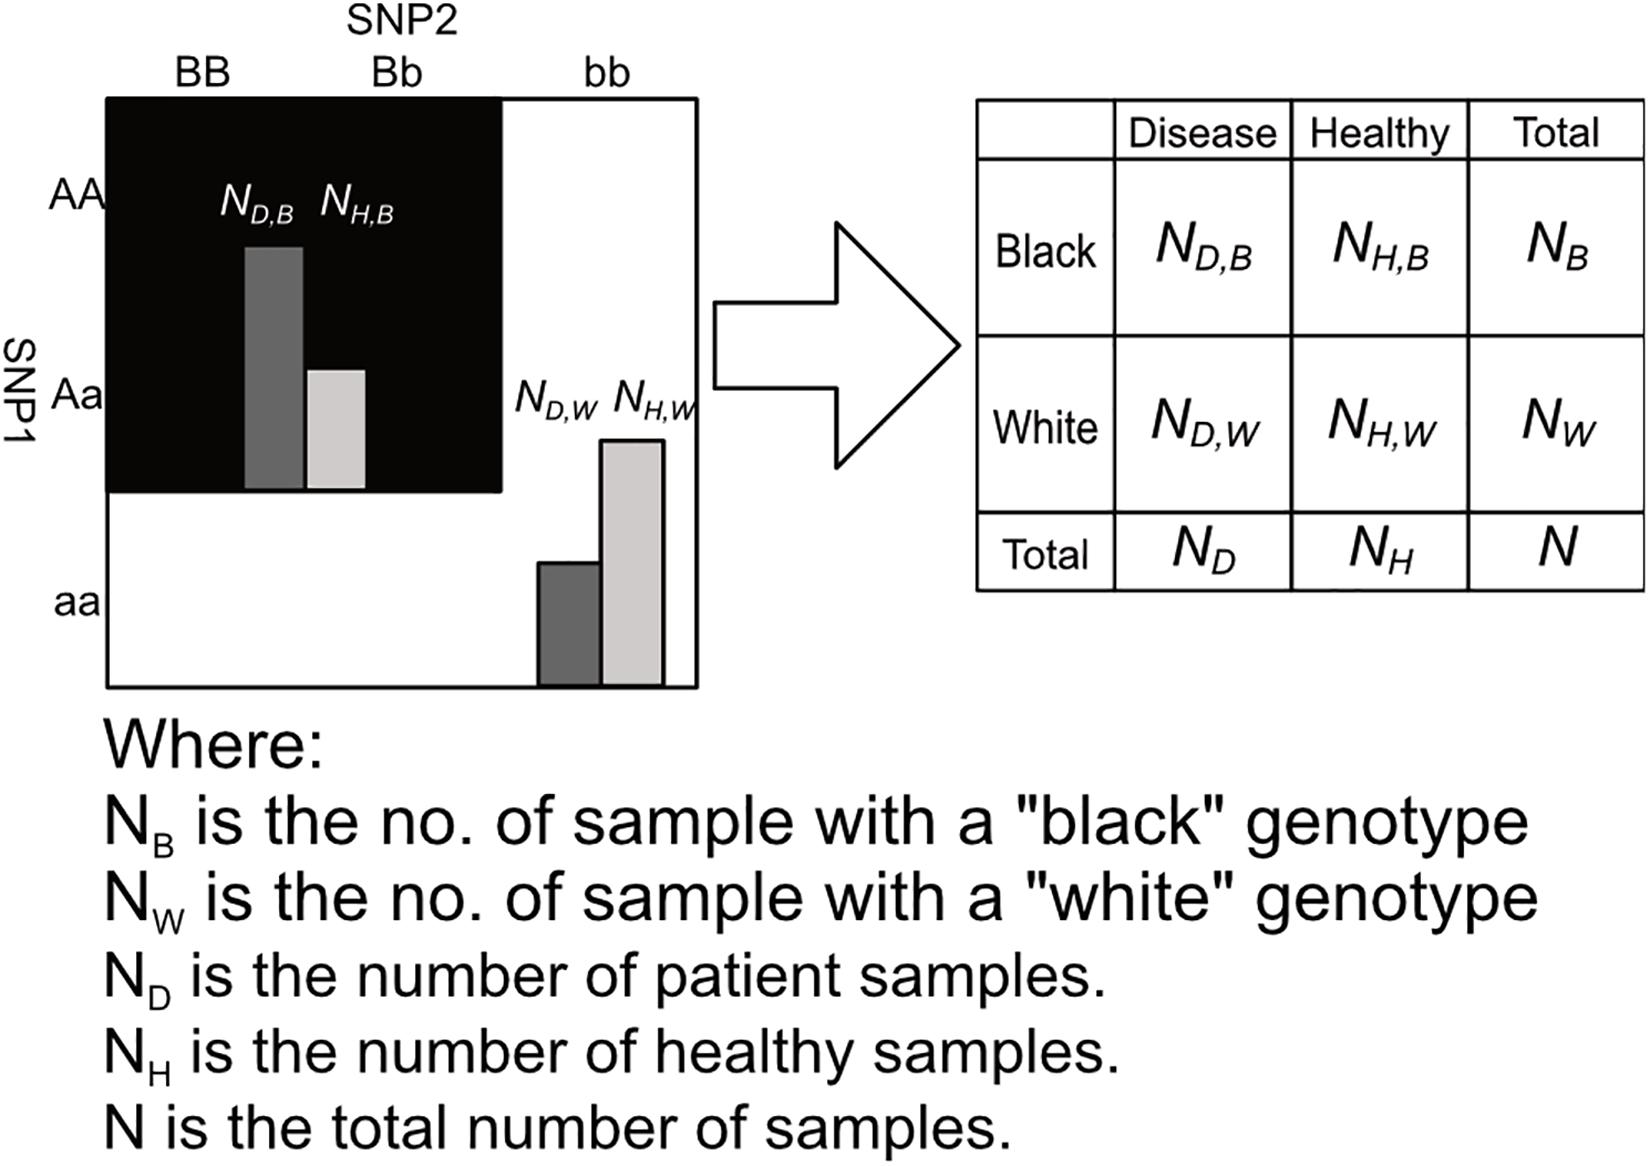
Figure 4. This figure shows the process of arranging the summed counts of cases and controls calculated in figure into a 2 × 2 contingency table. Major alleles represented by upper-case letters (i.e., A, B) and minor alleles represented by lower-case letters (i.e., a, b) (Lee et al., 2018).
After the corresponding 2 × 2 contingency tables of a 2nd order SNP combination (SNPi, SNPj) is calculated, statistical test like 1 d.f. chi-square statistical test can be performed to calculate the pairwise p-value of SNPi and SNPj.
Source of Real Datasets
We downloaded three schizophrenia GWAS datasets (phs000021:phg000013, phs000021:phg000014 and phs000167) from the database of Genotypes and Phenotypes (dbGaP). These three datasets were cleansed to remove low quality SNPs and samples with Plink (Purcell et al., 2007) following the common recommendations from NCBI (Anderson et al., 2010). The cleansing parameters are shown in Supplementary Tables S1, S2. The demographic information of the three datasets are shown in Supplementary Tables S4–S6.
After data pre-processing, there were 729,454 SNPs and 2,306 samples (cases: 1,051, controls: 1,214) in dataset phs000021:phg000013; 761,628 SNPs and 1,726 samples (cases: 829, controls: 874) in dataset phs000021:phg000014; 767,002 SNPs and 2689 samples (cases: 1,176, controls: 1,325) in dataset phs000167. The genotypes of every SNP in these three datasets were encoded as 0, 1, 2, 3 according to the encoding scheme shown in Supplementary Table S3.
Exhaustive Search on Schizophrenia Datasets in Discovery Dataset and 2 Replication Datasets
To identify potential biologically plausible and statistically significant 2nd order SNP–SNP interactions, we performed search on these three cleansed datasets. As phg000013 got a slightly larger sample size and was restricted to Caucasian subjects, it was chosen as the discovery dataset and the other two were used for replication of findings obtained from phg000013. First, we performed our search on these three datasets after filtering out SNPs in chromosome X, Y and mitochondrial DNA. After SNP–SNP interactions were ranked by their pairwise p-value, high ranking interactions would be selected for further analysis.
After sorting SNP–SNP interactions found in the discovery datasets in terms of their p-value, only a handful of interactions found in datasets phs000021:phg000013 had a p-value better than 10–11 which could be used as a cut-off value for statistically significant and the top 10 pairs of interaction were listed in Supplementary Material. They were largely related to SLC35A5 and an unknown transcript LOC105375629. However, the interaction was not replicated in the other 2 datasets.
Enrichment of Interacting Genes Among Top 10,000 Interactions
We considered using the Bonferroni approach for correction of cut-off p-values was too conservative and important interactions would be missed. Then we looked at the extend of replication among top ranked interaction found in the discovery dataset. Five sets of top ranked interaction found in phg000013 were checked if their component genes were also found to have high ranking in the two replication datasets (Supplementary Tables S9, S10). From the 2 tables, it was clear that up to 30% of genes reported in the top 10,000 interaction list could be replicated. This percentage replication (labeled as % common in the Supplementary Tables) increased with increasing number of top ranked interaction selected. The results indicated that signal were in fact enriched in the top ranked interaction SNPs pairs though they were not significant by Bonferroni correction. The very extreme p-values in the Supplementary Tables represents the probability of null hypothesis that there was no signal enrichment. We tried an addition way of sample filtering to exclude data bias or confounding by limiting to using female only subjects and repeating the whole procedure. Indeed, the same signal enrichment results was found among the top 10000 interacting gene pairs. Therefore, in the subsequent replication analysis, we selected top 10000th SNP–SNP interactions in terms of p-value.
After that, we selected nth (n = 100, 500, 1000, 5000, 10000) SNP–SNP interactions in terms of p-value from each dataset after each stage of our experiment and we predicted gene–gene interactions from these SNP–SNP interactions with CADD (Kircher et al., 2014). Then, we compared the gene-gene interactions predicted from the results of different datasets and analyzed the consistency among different datasets. Furthermore, we inferred and analyzed the biological function of these gene–gene interactions with GSEA (Mootha et al., 2003; Subramanian et al., 2005). Meanwhile, we constructed gene networks based on the gene–gene interactions which have a potential biological function based on our analysis with GSEA. Then, we performed follow-up network analysis on these gene networks. Genes which had a high degree within our network are selected for further analysis to identify potential novel schizophrenia associated genes.
Replication of SNP–SNP Interaction in Other 2 Datasets
Based on the top 10,000 SNP–SNP interaction pairs found discovery datasets, they were analyzed in the two replication datasets to see if they were also among the top 10,000 interaction. For those replicated interactions, odd ratios, p-values and 3 × 3 genotype data were shown. Bioinformatic methods were used to explore the potential biology of these replications including analysis of non-coding RNA binding sites, GO terms and gene set enrichment analysis.
According to existing literature, gene-gene interactions could be discovered through analyzing SNPs which are acting as conditional eQTLs (Jansen et al., 2017). After retrieving the genomic position of every SNP through referring the genome assembly GRCh37 published by Genome Reference Consortium (Schneider and Church, n.d.), the gene closest to every component SNP of every SNP-SNP interaction (if available) could then be found with CADD version 1.4 (Kircher et al., 2014). By making an assumption that if SNPi and SNPj were having a SNP–SNP interaction, Genei and Genej would have a corresponding gene-gene interaction (where Genei and Genej are the genes closest to SNPi and SNPj respectively), gene-gene interactions could then be predicted from the SNP–SNP interactions which we found.
Analysis of Protein Coding Transcript and Non-coding Transcripts
If there were non-coding genes closest to the SNP-SNP interaction pairs, LncRRIsearch (Fukunaga et al., 2019) was used to predict the lncRNA–RNA interactions of the corresponding gene–gene pairs. Threshold interaction energy was set to -12 kcal/mol here. To see whether the lncRNA–RNA interaction was specific, we used LncRRIsearch to investigate the interaction of the mRNA with 10 adjacent lncRNAs located both upstream and downstream of the interacting lncRNA.
Results and Discussion
Analysis on Top 10 SNP–SNP Interactions Found in Discovery Dataset
To reduce bias and confounding, we tried to analysis the discovery dataset in two different stages by using two sample filters. In our stage one experiment, we performed exhaustive search after filtering out SNPs in chromosome X, Y and mtDNA. Interactions were then ranked according to their p-value. Top 10 SNP–SNP interactions are listed in Supplementary Table S7. In the discovery dataset phs000021:phg000013, there were six SNPs rs7819913, rs1580508, rs16884273, rs35385383, rs16884251, and rs35648 reported to be associated to schizophrenia (Glessner et al., 2010; Bigdeli et al., 2016). On the other hand, there was a SNP rs34165590 being as an eQTL of a gene MMP16 in tibial nerve tissue according to GTEx Portal (Lonsdale et al., 2013). This gene was known to be associated to schizophrenia (Bitanihirwe et al., 2016). Meanwhile, there was a SNP rs8463 located in the 3-prime UTR region of gene RBM17 and this gene was known to be related to neurodegenerative diseases. There were two SNPs rs34729156 and rs1755286 which were located in the intron region of two schizophrenia-associated genes RYR2 and ADAMTSL1 respectively.
In our stage two experiment, we performed exhaustive search only using female samples and every SNP in autosomal chromosomes and chromosome X. Interactions were then ranked according to their p-value. Top 10 SNP–SNP interactions were selected from each dataset for further analysis and are listed in Supplementary Table S8. In the discovery dataset phs000021:phg000013, there were two SNPs rs10926030 and rs6050455 already reported in GTEx portal (Lonsdale et al., 2013) as expression quantitative trait loci (eQTls) of three genes FMN2, NOP56 and TMC2 in tibial nerve tissue where SNP rs10926030 acted as an eQTL of gene FMN2 and SNP rs6050455 acted an eQTL of genes NOP56 and TMC2. These three genes were known to be associated to schizophrenia and other neurodegenerative disorders (Mulligan et al., 2010; Kobayashi et al., 2011; Pamphlett et al., 2011; Van Scheltinga et al., 2013; Zhang et al., 2018). On the other hand, there were three SNPs rs12777747, rs41453047, and rs11755127 which were located in the intron region of the three literature-reported schizophrenia-associated genes TACC2, SEMA3A, and RPS6KA2 respectively. There were two SNPs rs8061891 and rs8057600 which were both located in the intron region of a schizophrenia-associated gene RBFOX1. We believed that these SNPs might have the potential to be associated to schizophrenia.
However, as it was more evidence in the female only analysis, genes or SNPs that were already significant predisposition gene by itself were mostly ranked among the top 10. For example, rs1277747 of TACC2 got a p-value of 2.03 × 10⁻⁷ on single SNP association analysis. In another word, many SNPs were also significant by itself and formed one of the interacting partner. In fact, 7 out of top 10 interacting pair was formed by exactly the same SNP, rs1277747. We believed that such GWAS significant SNP would dominate the interaction analysis and masked the true interacting pairs as they ranked lower in the list.
Predicting Gene–Gene Interactions After Annotating SNPs With CADD
We selected the top nth (n = 100, 500, 1000, 5000, 10000) SNP–SNP interactions in terms of p-value from each stage of our experiment independently and the corresponding gene-gene interactions of these SNP–SNP interactions could then be derived. First, we counted the number of gene-gene interactions predicted from each dataset and the number of individual component genes involved in those interactions. Then, we compared the gene–gene interactions predicted from each dataset against every other dataset and the number of common gene-gene interactions and common component genes between every pair of datasets were counted accordingly. The p-value on the number of occurrences of gene-gene interactions given the null hypothesis of no enrichment of signal were also calculated. Furthermore, the proportion of common component genes and the proportion of common gene-gene interactions in each dataset were calculated. These results are shown in Supplementary Tables S9, S10. Through observing the p-value on the number of common component genes, we believed that the occurrence of common component gene among datasets could not be simply explained as random cooccurrence by chance and genuine interaction signals must be enriched in the top ranked list. Furthermore, we observed that the proportion of common component genes under different pairs of datasets is roughly increasing linearly with the number of top ranked nth interactions selected until n = 1000. When n = 5000, the increase trends in the proportion of common component genes under different pairs of datasets might start to reach the plateau. Therefore, we believed that top 10000th of SNP–SNP interactions should already cover most of disease-associated SNP–SNP interactions in all three datasets. The top 10,000 gene–gene interactions found in the discovery dataset were visualized as circos diagrams as shown in Supplementary Figure S1. It was obvious that most gene–gene interactions were inter-chromosomal interactions.
Analysis on Predicted Gene–Gene Interactions With GSEA
Every component gene G in every predicted gene-gene interaction was annotated through the Molecular Signatures Database of Gene Set Enrichment Analysis (GSEA) such that every functional gene set containing G could be found. In our analysis, if both component genes of a gene-gene interaction I belonged to a common functional gene set F, then we believe that interaction I was associated to the biological function represented by functional gene set F. Among the gene-gene interactions predicted from top nth (n = 100, 500, 1000, 5000, 10000) SNP–SNP interactions, the number of predicted gene–gene interactions associated to each GSEA functional gene set was counted and shown in Supplementary Table S11. There were several predicted gene–gene interactions found to be associated to the following three functional gene sets namely GO_NEURON_PART, GO_NEURON_PROJECTION, and GO_SYNAPSE in stage one experiment of the discovery dataset. These gene–gene interactions were believed to be associated to the nervous system functionality and associated to schizophrenia.
Gene–gene interactions, which were considered to be associated to at least one biological functions in our analysis, were selected for forming gene networks. A gene–gene interaction could be selected for forming gene network only if both of its component genes were commonly predicted across three datasets. A gene network was then constructed for based on our results in the stage one experiment. Top 10 genes in terms of degree were separately selected from these two networks where the degree of a gene was the number of other neighboring genes directly interacting with it. These genes were listed in Supplementary Table S12. For each gene G in this table, direct interactions involving G were validated by the following three external biological interaction databases StringDB (Jensen et al., 2009), BioGrid (Stark et al., 2006) and RNAInter (Lin et al., 2020). A direct interaction was considered to be validated if there was at least one direct or indirect interactions between its two component genes in the external biological interaction databases. For each gene G and external biological database D, the number of validated direct interactions involving G and the mean and variance of the number of hidden interactors of these validated interactions under D were calculated.
Among the top 10 genes in terms of its degree selected from the network constructed based on the results of our stage one experiment, there were seven genes (CTNND2, ASTN2, DAB1, CAMK1D, PTPRD, RUNX1, ROBO2) which were reported to be associated to schizophrenia in existing literature as shown in Supplementary Table S12. This indicated schizophrenia-associated genes could be discovered from this network. Gene WDR27, VIT and CLSTN2 had not been previously reported to be associated with schizophrenia. However, these three genes were reported to be associated to insomnia (Hammerschlag et al., 2017), human brain asymmetry (Tadayon et al., 2016) and memory performance (Preuschhof et al., 2010) respectively. Therefore, they might all be associated to schizophrenia. This indicated GWAS discovered schizophrenia predisposition genes could also be discovered by our interaction analysis, however, this was not the primary aim of our analysis.
List of Replicated SNP–SNP Interactions in the Three Datasets and Gene–lncRNA Interactions
Using phg000013 as discovery dataset and the other 2 as replication datasets, the top 10,000 interaction pairs were mined to see if they were replicated in other datasets. Only replication by the exactly identical pattern out the 8 interactions were counted. After filtering out interactions with at least one component SNP which could not be mapped to a gene according to CADD, 14 interactions were replicated in both replication datasets in the exactly the same way as in the discovery dataset. These interactions were shown in Table 1.
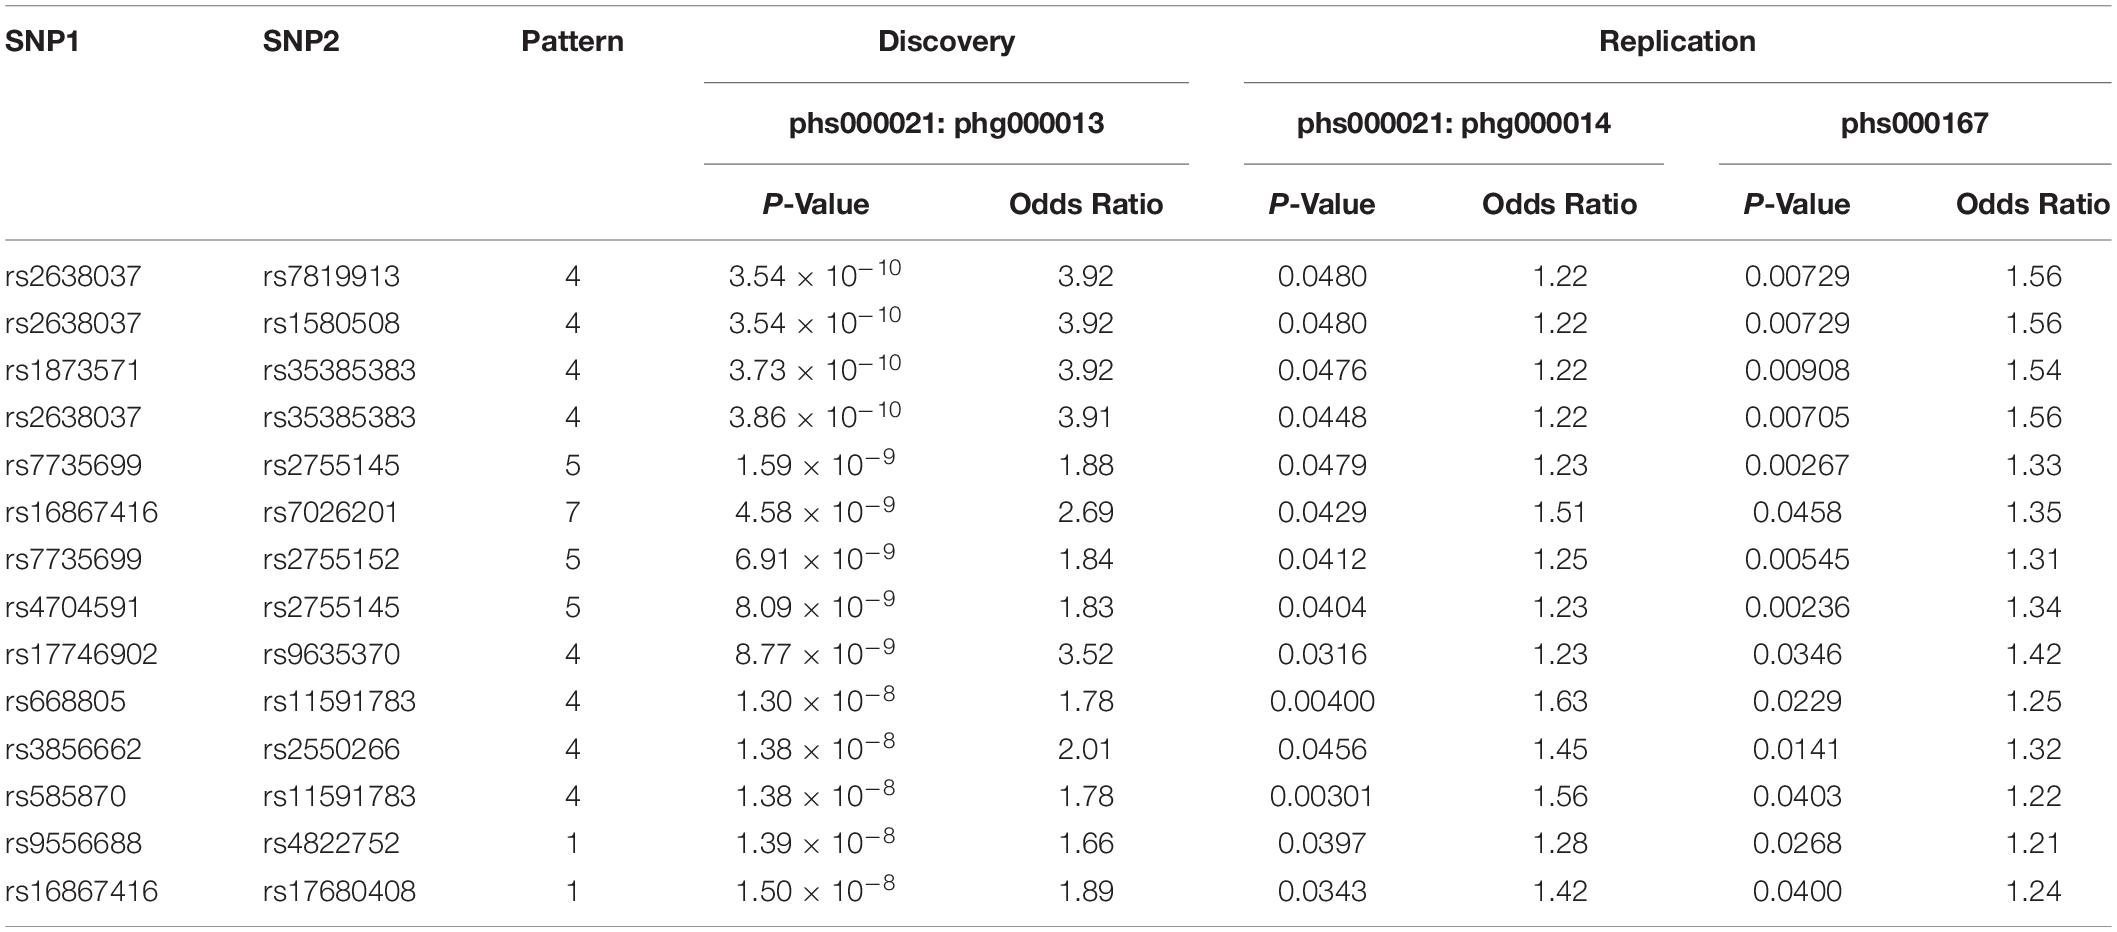
Table 1. This table shows the p-value and odds ratio of the 14 SNP–SNP interactions found in discovery dataset phs000021:phg000013 which are all replicable in both replication datasets phs000021:phg000014 and phs000167.
While we and most researchers are expecting to find protein interacting partners and investigate our discoveries with protein-protein interaction databases such as StringDB (Jensen et al., 2009), PINBA (Yu et al., 2014), and DMS (Jia et al., 2011) in this kind of analysis, 11 out of 14 replicated interactions involved gene transcript with no protein product, or non-coding RNA. 3 of them are recognized long non-coding RNA (lncRNA), including LINC01934 (AC104820.2), MUC20-OT1 (LINC00969), and LINC00456 (Table 2).
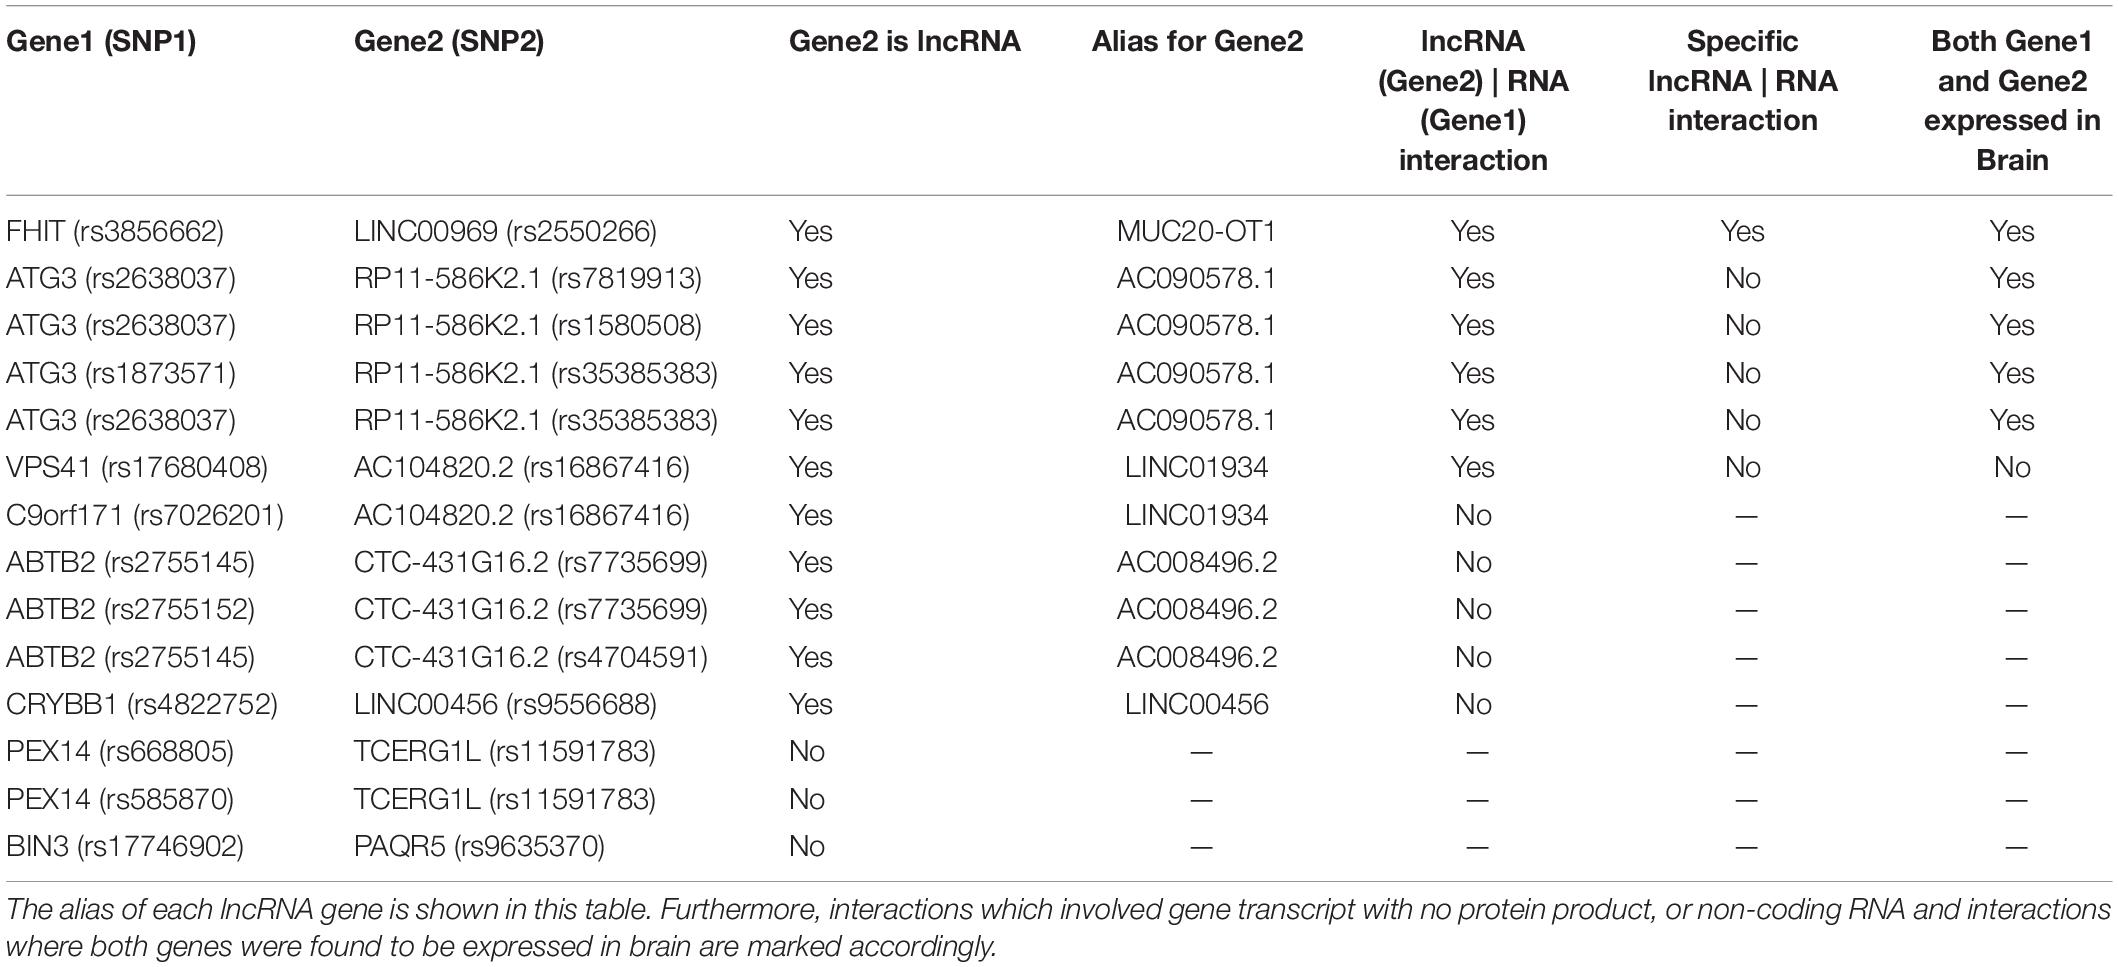
Table 2. This table summarizes our analysis on the gene–gene interactions predicted from the 14 SNP–SNP replicable interactions.
Therefore, we detailly investigated if there was evidence of binding sites between each of these coding transcripts and lncRNA transcripts using LncRRIsearch (Fukunaga et al., 2019). Six SNP–SNP interactions were found to have lncRNA–RNA interactions in their associated genes: rs16867416 (LINC01934, alias AC104820.2) and rs17680408 (VPS41), rs7819913 (AC090578.1, alias RP11-586K2.1) and rs2638037 (ATG3), rs1580508 (AC090578.1, alias RP11-586K2.1) and rs2638037 (ATG3), rs35385383 (AC090578.1, alias RP11-586K2.1) and rs1873571 (ATG3), rs35385383 (AC090578.1, alias RP11-586K2.1) and rs2638037 (ATG3), rs3856662 (FHIT) and rs2550266 (MUC20-OT1, alias LINC00969) (Figure 5). The sum of local base-pairing interaction energies of lncRNA-RNA interactions in LINC01934 (AC104820.2)-VPS41, AC090578.1 (RP11-586K2.1)-ATG3 and LINC00969 (MUC20-OT1)- FHIT gene pairs are −38.97 kcal/mol (3 interactions), −12.20 kcal/mol and −40.44 kcal/mol (3 interactions) respectively. As it is based on the principle of alignment entropy, it is difficult to assess how specific are these in silico identified binding sites. We screened the adjacent 10 lncRNAs located both upstream and downstream in the chromosomal region of the specific interacting lncRNA to see if these adjacent lncRNAs might interact with the protein-coding gene and its mRNA transcript. Among the three lncRNA–RNA interactions, only LINC00969-FHIT interaction is specific, with the mRNA of FHIT showing no interaction or weaker interaction with the adjacent lncRNAs of LINC00969 (Table 3 and Figure 6A). Furthermore, the tissue expression profiles of both the coding transcript and lncRNA were examined. The interaction is only plausible if both are expressed in the same tissue and more specific, brain or neuronal tissues. According to the LncRRIsearch result (Figure 6B), both LINC00969 and FHIT are expressed in multiple tissues at the same time, especially brain tissue, based on the RNA-seq data of GTEx consortium (E-MTAB-2919) (Lonsdale et al., 2013). The above analysis is summarized and showed in Table 2.
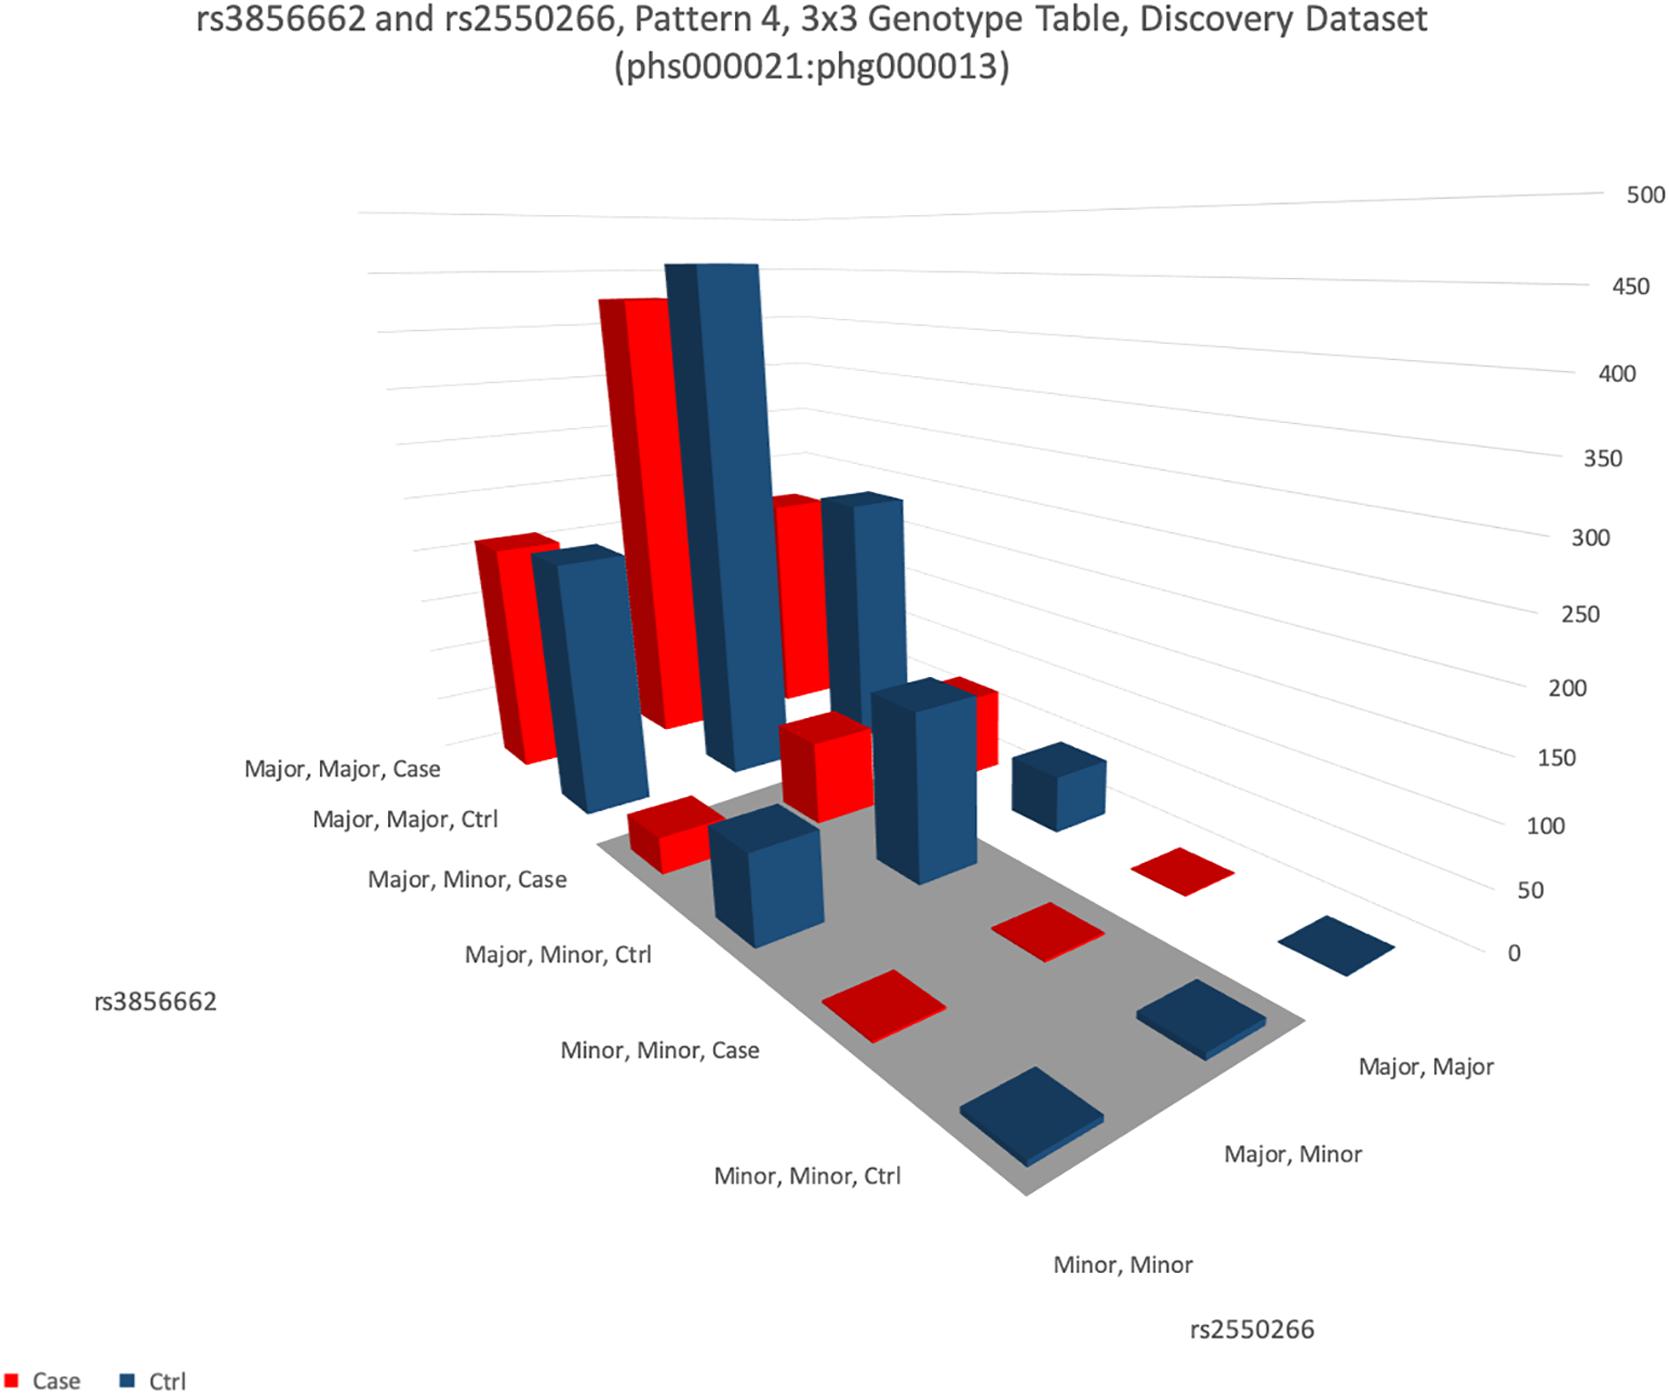
Figure 5. This figure shows the distribution of genotypes of two SNPs rs3856662 (FHIT gene) and rs2550266 (LINC00969). The height of the bar represents the number of samples of each of the nine combinations of the genotypes in these two SNPs. For each genotype combination, the bar in blue color represents the number of healthy samples (controls) and the bar in red color represents the number of patients (cases). It is apparent that the four blue (control) bars in the shaded area (dominant-dominant interaction between minor alleles of both SNPs) are over-represented than the four red (case) bars.
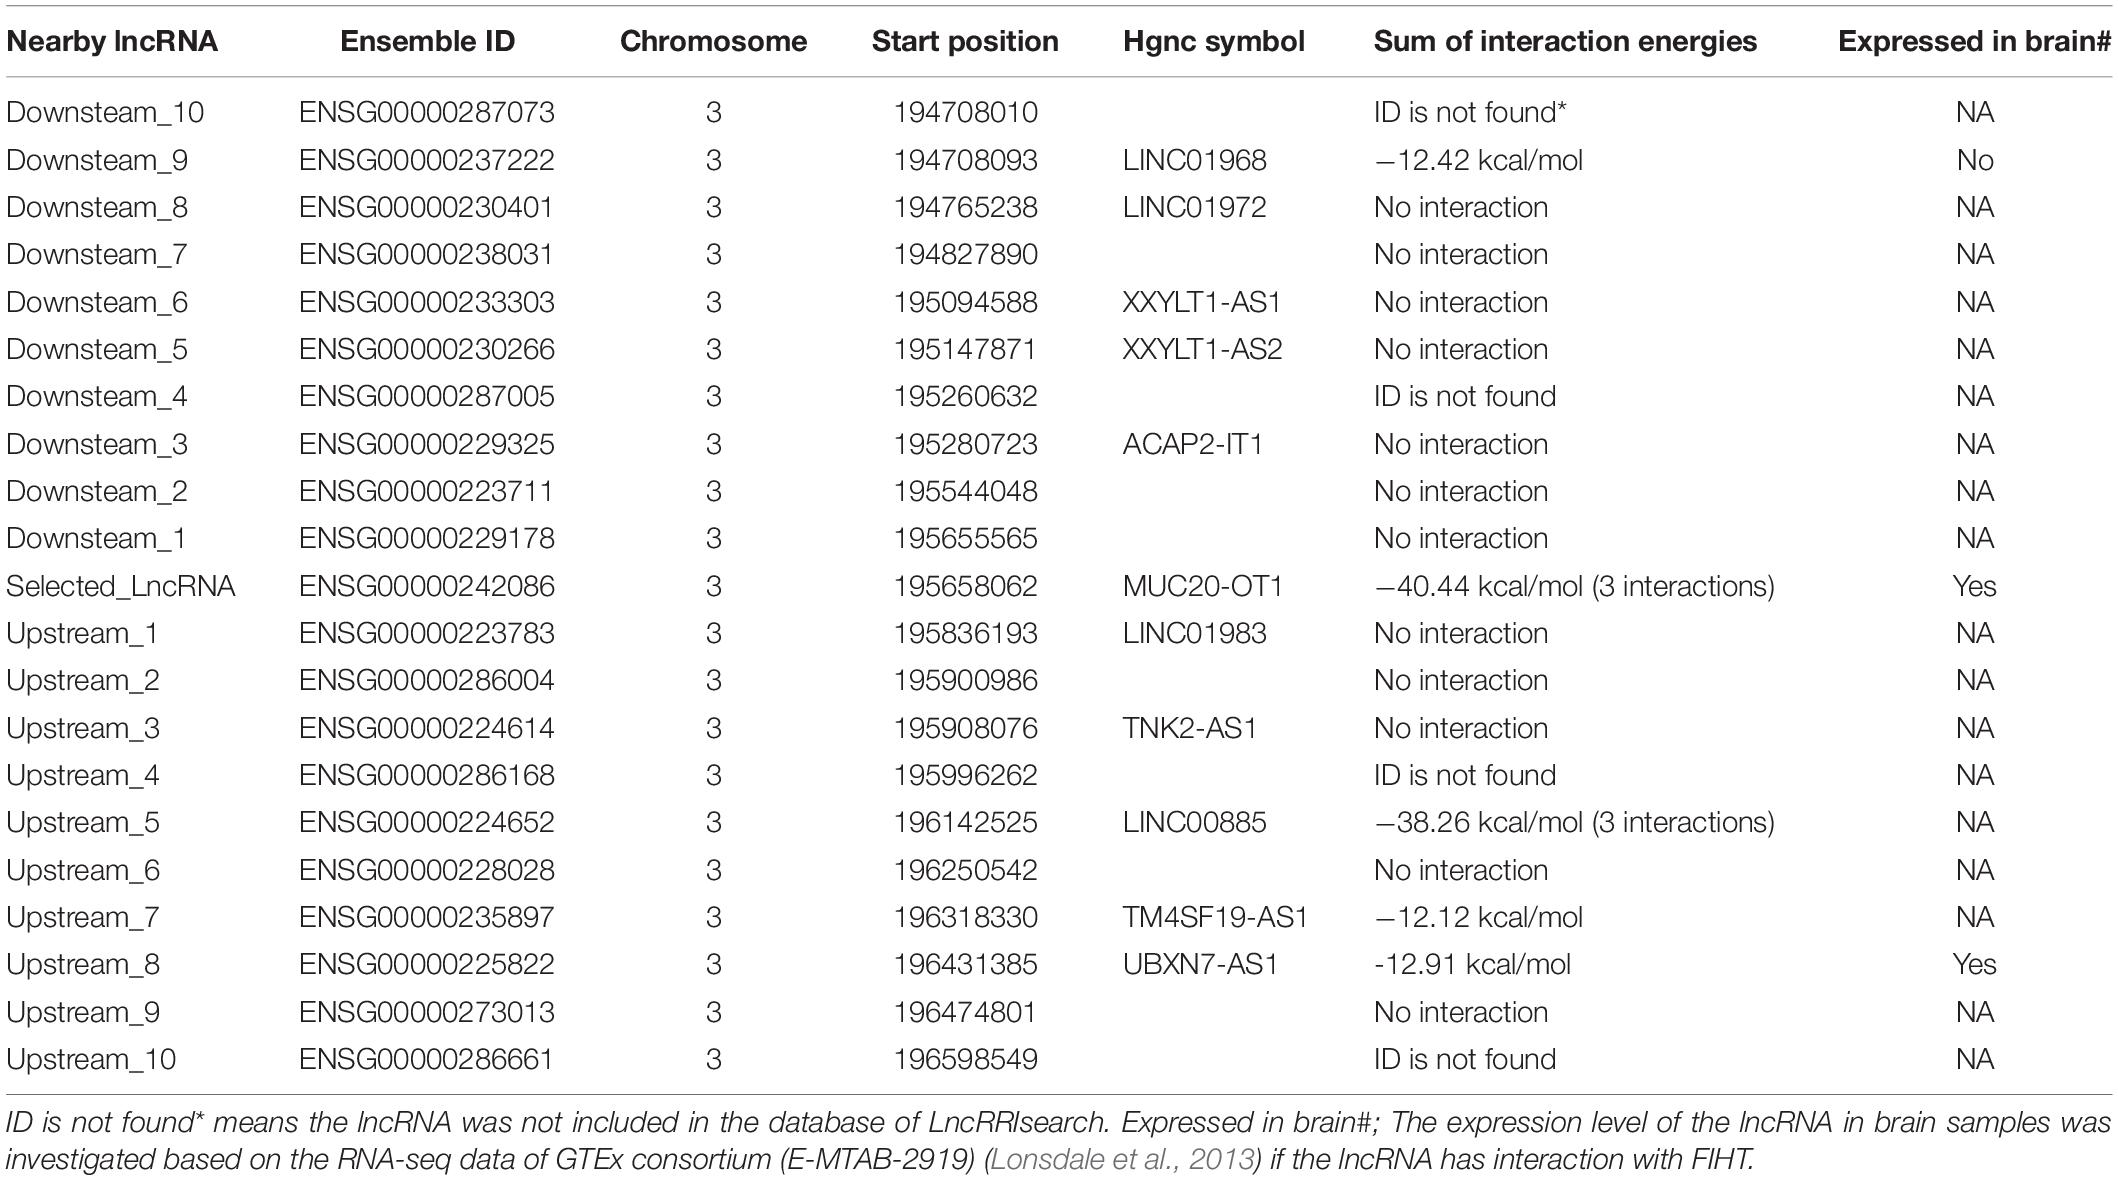
Table 3. Interaction of transcript of FIHT (ENST00000468189) and 10 lncRNA near the upstream or downstream of the LINC00969 (MUC20-OT1) based on LncRRIsearch (Fukunaga et al., 2019).
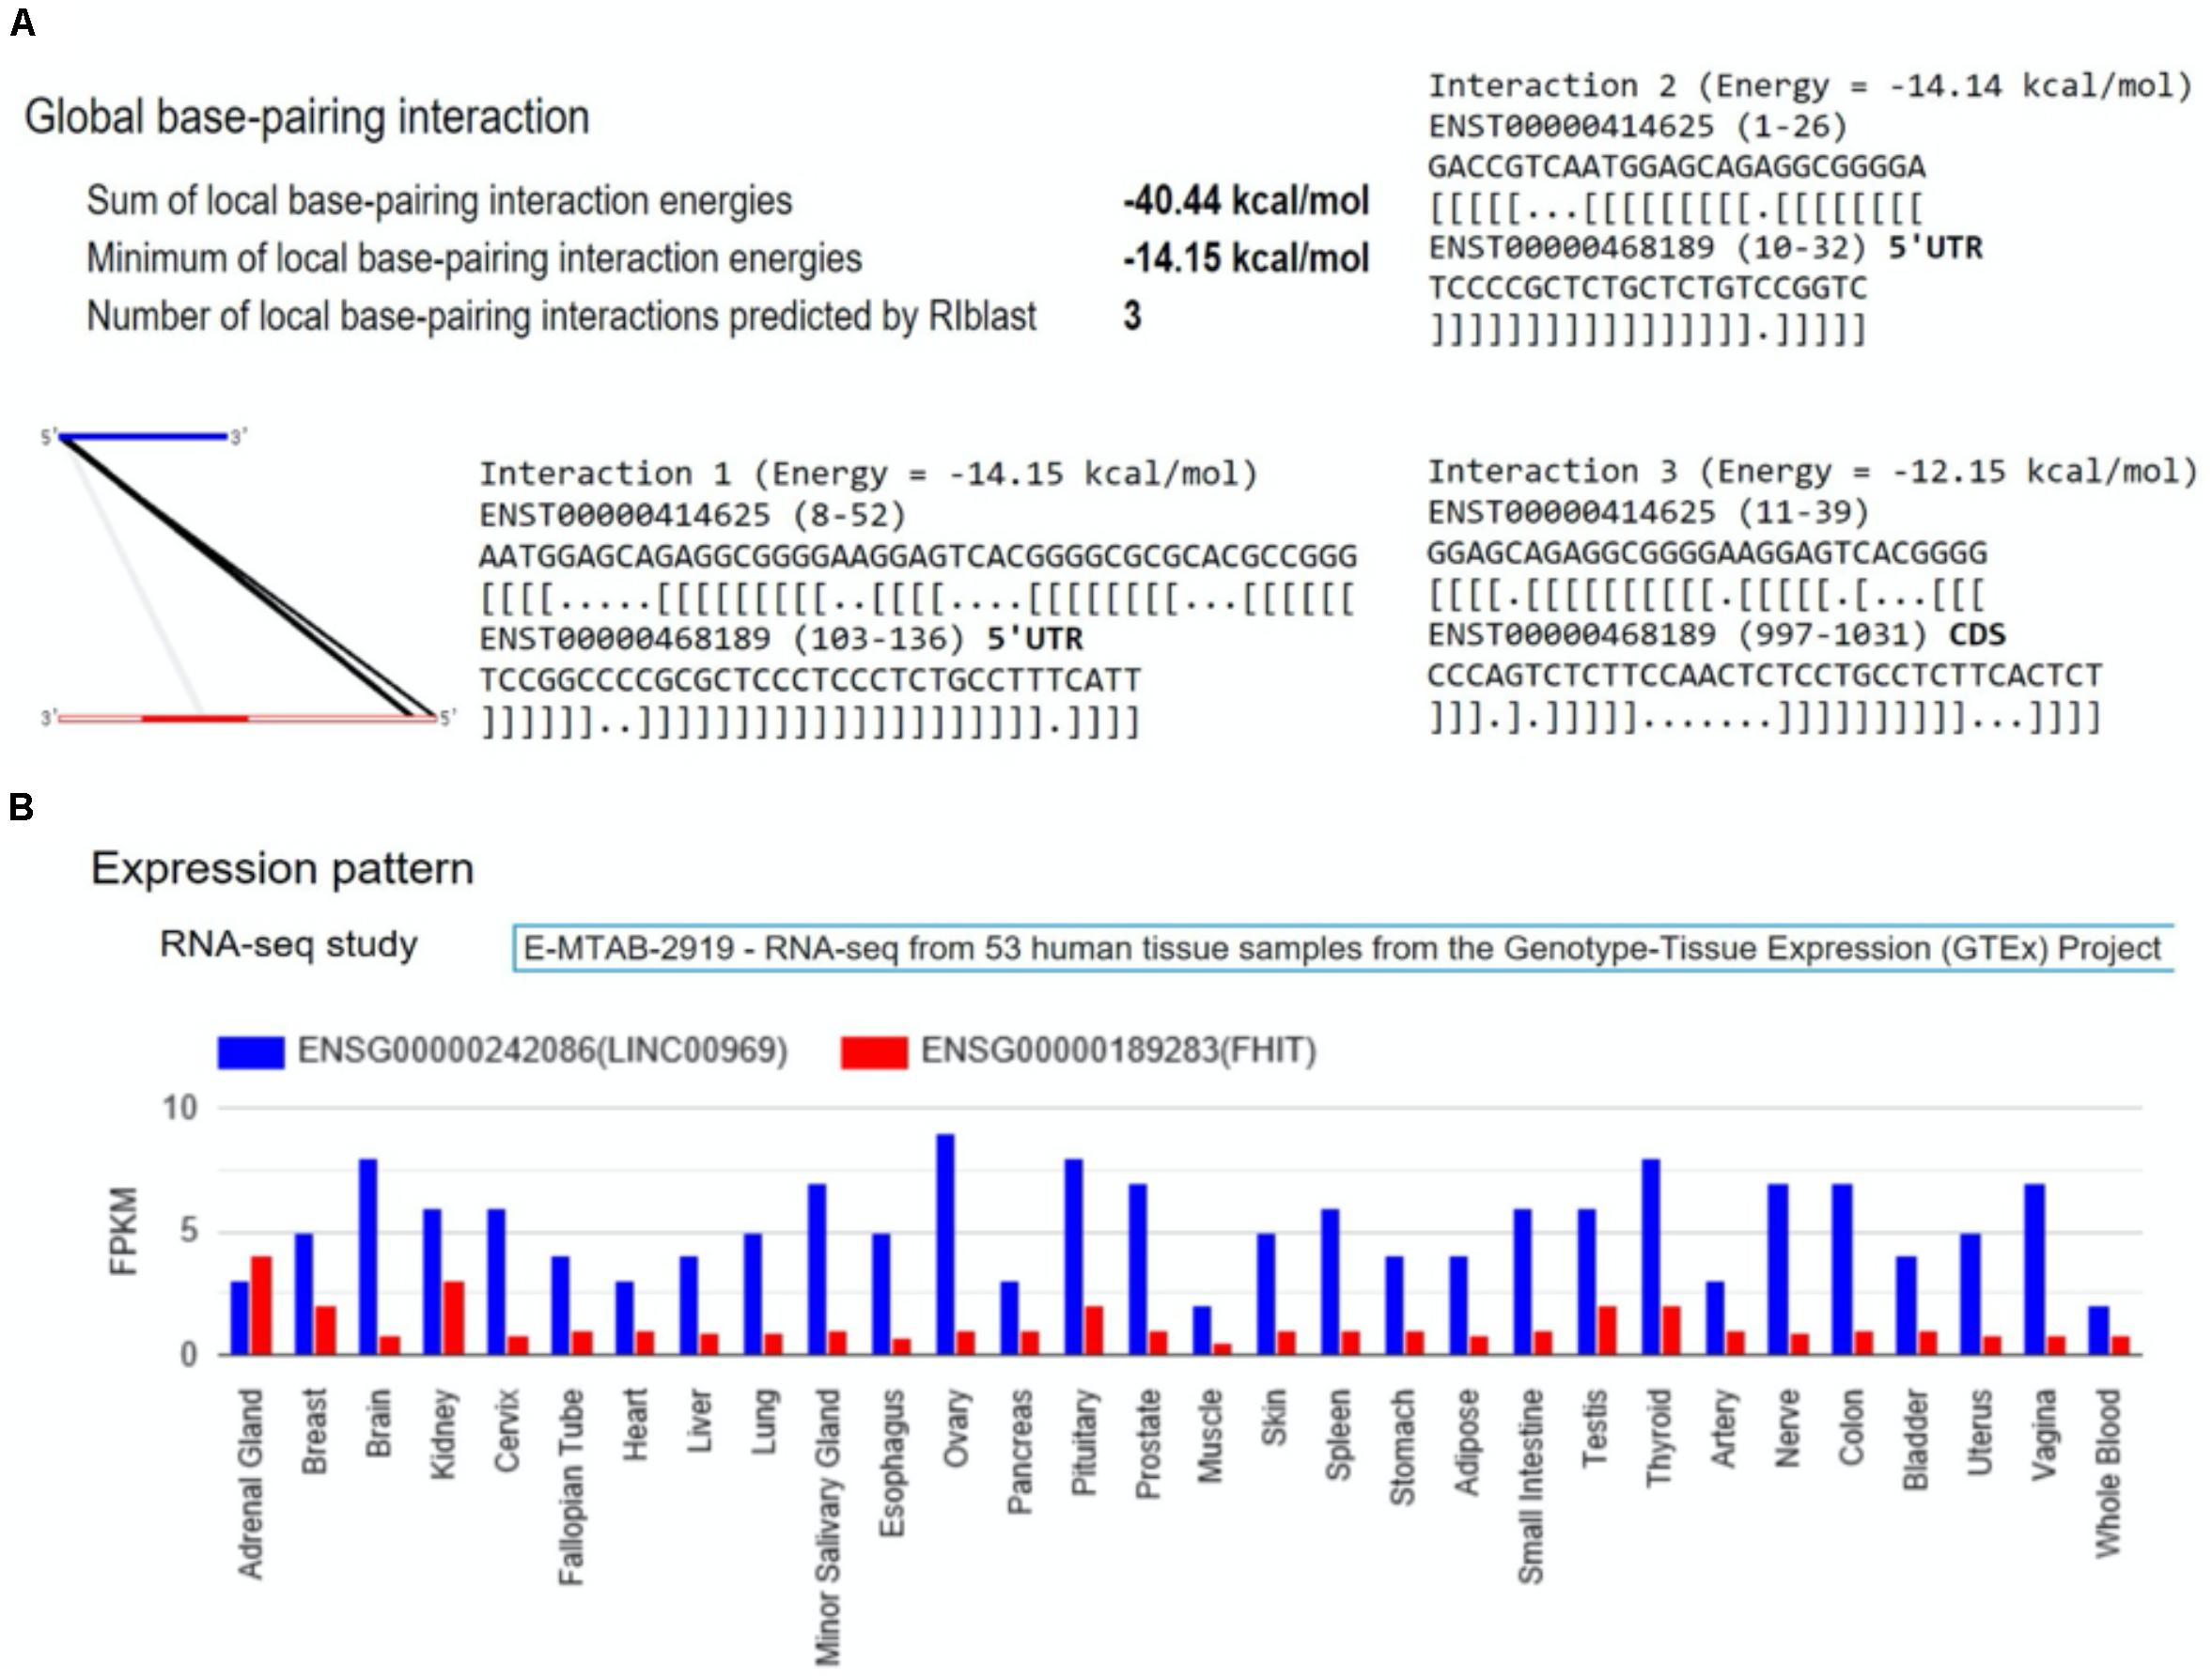
Figure 6. The output of LncRRIsearch (Fukunaga et al., 2019) for the interaction of the transcripts of LINC00969 and FHIT. (A) The graphical and text view of the global base -pairing interactions of LINC00969 and FHIT predicted by RIblast (Fukunaga and Hamada, 2017); (B) The expression pattern of LINC00969 and FHIT in RNA-seq data of GTEx consortium (E-MTAB-2919) (Lonsdale et al., 2013). LINC00969 and FHIT were represented by blue color and red color respectively.
A notable results was interaction between rs3856662 (FHIT gene) and rs2550266 (LINC00969). The 3 × 3 genotype table of this interaction is visualized in Figure 5, while the 3 × 3 genotype table of the other 13 replicable interaction are visualized as Supplementary Figures S2–S14. Statistical analysis of the interaction indicated that minor alleles of both gene interacted to reduce the risk of schizophrenia in a dominant way, such that carriers of both minor alleles of both genes had a 50% reduction in risk for schizophrenia (odds ratio = 0.50, confidence interval: 0.39–0.64). Combined p-values from 3 datasets were 3.15 × 10⁻⁹. Binding sites analysis were confirmed by both lncRNA software we used. It was possible for LINC00969 to bind to transcribed region of FHIT with a good predicted value of entropy.
Interaction of this profile might be genuine and representing how real interaction would look like. Genuine interaction profile should have these characteristics: (1) neither SNPs is significant by itself, or both interacting SNPs are not GWAS hits, (2) interaction should have a stronger effect size than single SNP GWAS hits, which usually have odds ratios in the range of 1.1–1.2 and (3) replication of interaction is evident. The example of rs3856662 (FHIT gene) and rs2550266 (LINC00969) indeed fulfills these expectations. Firstly, neither of them was significant by single SNP, and single SNP association p-values were not significant at only 5 × 10⁻³ and 1 × 10⁻¹. Secondly, the interaction protective effect was 0.5 (effect size is equivalent to odds ratio of 2). So such genetic risk profile is more useful in clinical setting. Finally, the interaction was observed in all 3 datasets. It is of note that replication was seen across ethnic groups (as phg000014 was an African dataset). The reduction of risk could be found even though the allelic frequencies of rs2550266 were very different between Africans and Caucasians. The pan-ethnic variation of allele frequency can be found in dbSNP1. Other potential interacting SNP pairs that could be replicated in one dataset but not both were shown in Supplementary Table 13.
Conclusion
In conclusion, after exhaustively search for every 2nd order SNP-SNP interaction from the discovery schizophrenia dataset phs000021:phg000013 with eight different biological plausible SNP–SNP interaction patterns, we first reported here that 9 out the top 10 SNP-SNP interactions in terms of p-value might represent interactions between protein coding genes and long non-coding RNA (lncRNA) genes. These results indicate the importance of interactions of other bio-molecules (like lncRNA–Protein, lncRNA–RNA, etc.) in addition to that of the traditional protein–protein interactions. Then, we showed there was a high proportion of concurrent genes among the gene–gene interactions predicted from the top 10 SNP–SNP interaction in terms of p-value. Therefore, these interactions were replicable under gene-level analysis and there was a strong enrichment of signals among these interactions. Finally, 9 SNP–SNP interactions were successfully replicated in both replication datasets. We discovered that one of these SNP–SNP interactions can be interpreted as the interaction between FHIT (protein coding) and LINC00969 (lncRNA). Both FHIT and LINC00969 were reported to have expression in brain and might be a new discovery.
Data Availability Statement
Publicly available datasets were analyzed in this study. This data can be found here: http://www.ncbi.nlm.nih.gov/gap.
Author Contributions
K-YL conducted the project, developed the algorithms used in this study, and ran the experiments under the supervision of M-HW and K-SL. K-YL and DH interpreted the biological meaning of the experimental results under the guidance of NT and HS. K-YL, SM, and DH wrote the main manuscript text. All the authors discussed the results and reviewed the manuscript thoroughly.
Funding
NT is currently receiving VC Discretionary Fund of CUHK for other research projects. SM was supported by a CUHK direct grant. This project is also partially supported by direct grant of CUHK.
Conflict of Interest
NT and K-SL are directors and hold shares of the company Cytomics Ltd. Cytomics Ltd holds a licence to use the patent related to single cell type specific gene expression analysis.
The remaining authors declare that the research was conducted in the absence of any commercial or financial relationships that could be construed as a potential conflict of interest.
Acknowledgments
Datasets phs000021:phg000013, phs000021:phg000014, and phs000167 used for the analyses described in this manuscript were downloaded from the database of Genotypes and Phenotypes (dbGaP) at http://www.ncbi.nlm.nih.gov/gap through dbGaP accession numbers phs000021.v3.p2 and phs000167.v1.p1. Datasets phs000021:phg000013 and phs000021:phg000014 are both originated from the study titled Genome-Wide Association of Schizophrenia Study (dbGaP accession number: phs000021.v3.p2). Samples and associated phenotype data of this study were provided by the Molecular Genetics of Schizophrenia Collaboration (PI: Pablo V. Gejman, Evanston Northwestern Healthcare (ENH) and Northwestern University, Evanston, IL, United States) and the genotyping of samples of this study was provided through the Genetic Association Information Network (GAIN). Data collection of this study was supported by the funding from the National Institute of Mental Health (R01 MH67257, R01 MH59588, R01 MH59571, R01 MH59565, R01 MH59587, R01 MH60870, R01 MH59566, R01 MH59586, R01 MH61675, R01 MH60879, R01 MH81800, U01 MH46276, U01 MH46289U01 MH46318, U01 MH79469, and U01 MH79470). Dataset phs000167 is originated from the study titled Molecular Genetics of Schizophrenia – nonGAIN Sample (MGS_nonGAIN) (dbGaP accession number: phs000167.v1.p1). Data collection of this study was supported by the funding from Genomics Research Branch at NIMH. Samples and associated phenotype data of this study were collected under the following grants: NIMH Schizophrenia Genetics Initiative U01s: MH46276 (C. R. Cloninger), MH46289 (C. Kaufmann), and MH46318 (M. T. Tsuang); and MGS Part 1 (MGS1) and Part 2 (MGS2) R01s: MH67257 (N. G. Buccola), MH59588 (B. J. Mowry), MH59571 (P. V. Gejman), MH59565 (Robert Freedman), MH59587 (F. Amin), MH60870 (W. F. Byerley), MH59566 (D. W. Black), MH59586 (J. M. Silverman), MH61675 (D. F. Levinson), and MH60879 (C. R. Cloninger). The genotyping of samples of this study was provided through the Genetic Association Information Network (GAIN) and under the MGS U01s: MH79469 and MH79470. Further details of collection sites, individuals, and institutions may be found in data supplement Table 1 of Sanders et al. (2008) and at the study dbGaP pages.
Supplementary Material
The Supplementary Material for this article can be found online at: https://www.frontiersin.org/articles/10.3389/fgene.2020.01003/full#supplementary-material
Footnotes
References
Anderson, C. A., Pettersson, F. H., Clarke, G. M., Cardon, L. R., Morris, A. P., and Zondervan, K. T. (2010). Data quality control in genetic case-control association studies. Nat. Protoc. 5, 1564–1573. doi: 10.1038/nprot.2010.116
Avramopoulos, D. (2018). Recent advances in the genetics of schizophrenia. Mol. Neuropsychiatry 4, 35–51. doi: 10.1159/000488679
Bigdeli, T. B., Lee, D., Webb, B. T., Riley, B. P., Vladimirov, V. I., Fanous, A. H., et al. (2016). A simple yet accurate correction for winner’s curse can predict signals discovered in much larger genome scans. Bioinformatics 32, 2598–2603. doi: 10.1093/bioinformatics/btw303
Bitanihirwe, B. K. Y., Mauney, S. A., and Woo, T.-U. W. (2016). Weaving a net of neurobiological mechanisms in schizophrenia and unraveling the underlying pathophysiology. Biol. Psychiatry 80, 589–598. doi: 10.1016/j.biopsych.2016.03.1047
Chen, H. Y., Chan, I. H. S., Sham, A. L. K., Leung, V. H. K., Ma, S. L., Ho, S. C., et al. (2011). Haplotype effect in the IGF1 promoter accounts for the association between microsatellite and serum IGF1 concentration. Clin. Endocrinol. 74, 520–527. doi: 10.1111/j.1365-2265.2010.03962.x
Chen, H. Y., Huang, W., Leung, V. H. K., Fung, S. L. M., Ma, S. L., Jiang, H., et al. (2013). Functional interaction between SNP s and microsatellite in the transcriptional regulation of insulin-like growth factor 1. Hum. Mutat. 34, 1289–1297. doi: 10.1002/humu.22363
Chen, H. Y., Ma, S. L., Huang, W., Ji, L., Leung, V. H. K., Jiang, H., et al. (2016). The mechanism of transactivation regulation due to polymorphic short tandem repeats (STRs) using IGF1 promoter as a model. Sci. Rep. 6: 38225.
Chu, S. K., Xu, S. G., Xu, F., and Tang, N. L. S. (2016). “Gene-gene interaction analysis by IAC (Interaction Analysis by Chi-Square),” in Proceedings of the International Joint Conference on Biomedical Engineering Systems and Technologies (SCITEPRESS-Science and Technology Publications, Lda), 142–150. doi: 10.5220/0005654601420150
de Boer, C. G., Vaishnav, E. D., Sadeh, R., Abeyta, E. L., Friedman, N., and Regev, A. (2020). Deciphering eukaryotic gene-regulatory logic with 100 million random promoters. Nat. Biotechnol. 38, 56–65. doi: 10.1038/s41587-019-0315-8
Dong, S.-S., Hu, W.-X., Yang, T.-L., Chen, X.-F., Yan, H., Chen, X.-D., et al. (2017). SNP-SNP interactions between WNT4 and WNT5A were associated with obesity related traits in Han Chinese Population. Sci. Rep. 7:43939.
Fukunaga, T., and Hamada, M. (2017). RIblast: an ultrafast RNA–RNA interaction prediction system based on a seed-and-extension approach. Bioinformatics 33, 2666–2674. doi: 10.1093/bioinformatics/btx287
Fukunaga, T., Iwakiri, J., Ono, Y., and Hamada, M. (2019). LncRRIsearch: a web server for lncRNA-RNA interaction prediction integrated with tissue-specific expression and subcellular localization data. Front. Genet. 10:462. doi: 10.3389/fgene.2019.00462
Gerke, J., Lorenz, K., and Cohen, B. (2009). Genetic interactions between transcription factors cause natural variation in yeast. Science 323, 498–501.
Glessner, J. T., Reilly, M. P., Kim, C. E., Takahashi, N., Albano, A., Hou, C., et al. (2010). Strong synaptic transmission impact by copy number variations in schizophrenia. Proc. Natl. Acad. Sci. U.S.A. 107, 10584–10589.
Gola, D., Mahachie John, J. M., Van Steen, K., and König, I. R. (2015). A roadmap to multifactor dimensionality reduction methods. Brief. Bioinform. 17, 293–308. doi: 10.1093/bib/bbv038
Hammerschlag, A. R., Stringer, S., De Leeuw, C. A., Sniekers, S., Taskesen, E., Watanabe, K., et al. (2017). Genome-wide association analysis of insomnia complaints identifies risk genes and genetic overlap with psychiatric and metabolic traits. Nat. Genet. 49, 1584–1592. doi: 10.1038/ng.3888
Henriksen, M. G., Nordgaard, J., and Jansson, L. B. (2017). Genetics of schizophrenia: overview of methods, findings and limitations. Front. Hum. Neurosci. 11:322. doi: 10.3389/fnhum.2017.00322
International Schizophrenia Consortium, Shaun, M. P., Naomi, R. W., Jennifer, L. S., Peter, M. V., and O’Donovan, M. C. (2009). Common polygenic variation contributes to risk of schizophrenia and bipolar disorder. Nature 460, 748–752. doi: 10.1038/nature08185
Jaffe, A. E., Straub, R. E., Shin, J. H., Tao, R., Gao, Y., Collado-Torres, L., et al. (2018). Developmental and genetic regulation of the human cortex transcriptome illuminate schizophrenia pathogenesis. Nat. Neurosci. 21, 1117–1125. doi: 10.1038/s41593-018-0197-y
Jansen, R., Jouke-Jan, H., Michel, G. N., Abdel, A., Bram, L., and Eco, J. D. G. (2017). Conditional {eQTL} analysis reveals allelic heterogeneity of gene expression. Hum. Mol. Genet. 37, D412–D416.
Jensen, L. J., Kuhn, M., Stark, M., Chaffron, S., Creevey, C., Muller, J., et al. (2009). STRING 8–a global view on proteins and their functional interactions in 630 organisms. Nucleic Acids Res. 37, D412–D416. doi: 10.1093/nar/gkn760
Jia, P., Zheng, S., Long, J., Zheng, W., and Zhao, Z. (2011). DmGWAS: dense module searching for genome-wide association studies in protein–protein interaction networks. Bioinformatics 27, 95–102. doi: 10.1093/bioinformatics/btq615
Kircher, M., Daniela, M. W., Preti, J., Brian, J. O., Gregory, M. C., and Jay, S. (2014). A general framework for estimating the relative pathogenicity of human genetic variants. Nat. Genet. 46, 310–315. doi: 10.1038/ng.2892
Kobayashi, H., Abe, K., Matsuura, T., Ikeda, Y., Hitomi, T., Akechi, Y., et al. (2011). Expansion of intronic GGCCTG hexanucleotide repeat in NOP56 causes SCA36, a type of spinocerebellar ataxia accompanied by motor neuron involvement. Am. J. Hum. Genet. 89, 121–130. doi: 10.1016/j.ajhg.2011.05.015
Lee, K.-Y., Leung, K.-S., Tang, N. L. S., and Wong, M.-H. (2018). Discovering Genetic Factors for psoriasis through exhaustively searching for significant second order SNP-SNP interactions. Sci. Rep. 8:15186.
Li, Z., Chen, J., Yu, H., He, L., Xu, Y., Zhang, D., et al. (2017). Genome-wide association analysis identifies 30 new susceptibility loci for schizophrenia. Nat. Genet. 49, 1576–1583.
Lin, H.-Y., Amankwah, E. K., Tseng, T.-S., Qu, X., Chen, D.-T., and Park, J. Y. (2013). SNP-SNP interaction network in angiogenesis genes associated with prostate cancer aggressiveness. PLoS One 8:e59688. doi: 10.1371/journal.pone.0059688
Lin, Y., Liu, T., Cui, T., Wang, Z., Zhang, Y., Tan, P., et al. (2020). RNAInter in 2020: RNA interactome repository with increased coverage and annotation. Nucleic Acids Res. 48, D189–D197.
Lonsdale, J., Jeffrey, T., Mike, S., Rebecca, P., Edmund, L., and Saboor, S. (2013). The genotype-tissue expression (GTEx) project. Nat. Genet. 45, 580–585.
Manolio, T. A., Collins, F. S., Cox, N. J., Goldstein, D. B., Hindorff, L. A., Hunter, D. J., et al. (2009). Finding the missing heritability of complex diseases. Nature 461, 747–753.
Mootha, V. K., Lindgren, C. M., Eriksson, K.-F., Subramanian, A., Sihag, S., Lehar, J., et al. (2003). PGC-1α-responsive genes involved in oxidative phosphorylation are coordinately downregulated in human diabetes. Nat. Genet. 34, 267–273. doi: 10.1038/ng1180
Mulligan, M. K., Lu, L., Overall, R. W., Kempermann, G., Rogers, G. L., Langston, M. A., et al. (2010). “Genetic analysis of BDNF expression cliques and adult neurogenesis in the hippocampus,” in 2010 Biomedical Sciences and Engineering Conference, Oak Ridge, TN, 1–4.
Pamphlett, R., Morahan, J. M., and Yu, B. (2011). Using case-parent trios to look for rare de novo genetic variants in adult-onset neurodegenerative diseases. J. Neurosci. Methods 197, 297–301. doi: 10.1016/j.jneumeth.2011.02.028
Pardiñas, A. F., Holmans, P., Pocklington, A. J., Escott-Price, V., Ripke, S., Carrera, N., et al. (2018). Common schizophrenia alleles are enriched in mutation-intolerant genes and in regions under strong background selection. Nat. Genet. 50, 381–389.
Phillips, P. C. (2008). Epistasis—The essential role of gene interactions in the structure and evolution of genetic systems. Nat. Rev. Genet. 9, 855–867. doi: 10.1038/nrg2452
Preuschhof, C., Heekeren, H. R., Li, S. C., Sander, T., Lindenberger, U., and Bäckman, L. (2010). KIBRA and CLSTN2 polymorphisms exert interactive effects on human episodic memory. Neuropsychologia 48, 402–408. doi: 10.1016/j.neuropsychologia.2009.09.031
Purcell, S., Benjamin, N., Kathe, T. B., Lori, T., Manuel, A. R. F., and Bender, D. (2007). {PLINK}: a tool set for whole-genome association and population–based linkage analyses. Am. J. Hum. Genet. 81, 559–575. doi: 10.1086/519795
Ripke, S., Neale, B. M., Corvin, A., Walters, J. T. R., Farh, K.-H., and Holmans, P. A. (2014). Biological insights from 108 schizophrenia-associated genetic loci. Nature 511, 421–427. doi: 10.1038/nature13595
Ruderfer, D. M., Ripke, S., McQuillin, A., Boocock, J., Stahl, E. A., and Pavlides, J. M. W. (2018). Genomic dissection of bipolar disorder and schizophrenia, including 28 subphenotypes. Cell 173, 1705.e16–1715.e16. doi: 10.1016/j.cell.2018.05.046
Sanders, A. R., Duan, J., Levinson, D. F., Shi, J., He, D., Hou, C., et al. (2008). No significant association of 14 candidate genes with schizophrenia in a large European ancestry sample: implications for psychiatric genetics. Am. J. Psychiat. 165, 497–506. doi: 10.1176/appi.ajp.2007.07101573
Schneider, V., and Church, D. (n.d.). Genome Reference Consortium. Bethesda, MA: National Center for Biotechnology Information (US).
Schrode, N., Ho, S. M., Yamamuro, K., Dobbyn, A., Huckins, L., Matos, M. R., et al. (2019). Synergistic effects of common schizophrenia risk variants. Nat. Genet. 51, 1475–1485.
Stark, C., Bobby-Joe, B., Teresa, R., Lorrie, B., Ashton, B., and Mike, T. (2006). BioGRID: a general repository for interaction datasets. Nucleic Acids Res. 34, D535–D539. doi: 10.1093/nar/gkj109
Subramanian, A., Tamayo, P., Mootha, V. K., Mukherjee, S., Ebert, B. L., Gillette, M. A., et al. (2005). Gene set enrichment analysis: a knowledge-based approach for interpreting genome-wide expression profiles. Proc. Natl. Acad. Sci. US.A. 102, 15545–15550. doi: 10.1073/pnas.0506580102
Sullivan, P. F., Kendler, K. S., and Neale, M. C. (2003). Schizophrenia as a complex trait: evidence from a meta-analysis of twin studies. Arch. Gen. Psychiatry 60, 1187–1192.
Tadayon, S. H., Vaziri-Pashkam, M., Kahali, P., Ansari Dezfouli, M., and Abbassian, A. (2016). Common genetic variant in VIT is associated with human brain asymmetry. Front. Hum. Neurosci. 10:236. doi: 10.3389/fnhum.2016.00236
The Schizophrenia Psychiatric Genome-Wide Association Study (Gwas) Consortium (2011). Genome-wide association study identifies five new schizophrenia loci. Nat. Genet. 43, 969–976. doi: 10.1038/ng.940
Van Scheltinga, A. F. T., Bakker, S. C., Van Haren, N. E. M., Derks, E. M., Buizer-Voskamp, J. E., and Boos, H. B. M. (2013). Genetic schizophrenia risk variants jointly modulate total brain and white matter volume. Biol. Psychiatry 73, 525–531. doi: 10.1016/j.biopsych.2012.08.017
Wan, X., Yang, C., Yang, Q., Xue, H., Fan, X., Tang, N. L. S., et al. (2010). BOOST: a fast approach to detecting gene-gene interactions in genome-wide case-control studies. Am. J. Hum. Genet. 87, 325–340. doi: 10.1016/j.ajhg.2010.07.021
Wang, Q., Chen, R., Cheng, F., Wei, Q., Ji, Y., Yang, H., et al. (2019). A Bayesian framework that integrates multi-omics data and gene networks predicts risk genes from schizophrenia GWAS data. Nat. Neurosci. 22, 691–699. doi: 10.1038/s41593-019-0382-7
Weinberger, D. R. (2019). Thinking about schizophrenia in an era of genomic medicine. Am. J. Psychiatry 176, 12–20. doi: 10.1176/appi.ajp.2018.18111275
Wu, C., and Pan, W. (2018). Integration of enhancer-promoter interactions with GWAS summary results identifies novel schizophrenia-associated genes and pathways. Genetics 209, 699–709. doi: 10.1534/genetics.118.300805
Yu, H., Bi, W., Liu, C., Zhao, Y., Zhang, J.-F., Zhang, D., et al. (2014). Protein-interaction-network-based analysis for genome-wide association analysis of schizophrenia in Han Chinese population. J. Psychiatric Res. 50, 73–78. doi: 10.1016/j.jpsychires.2013.11.014
Zhang, T., Zhu, L., Ni, T., Liu, D., Chen, G., Yan, Z., et al. (2018). Voltage-gated calcium channel activity and complex related genes and schizophrenia: a systematic investigation based on Han Chinese population. J. Psychiatr. Res. 106, 99–105. doi: 10.1016/j.jpsychires.2018.09.020
Keywords: schizophrenia, GWAS, exhaustive search, second order SNP–SNP interaction, gene–lncRNA interactions
Citation: Lee K-Y, Leung K-S, Ma SL, So HC, Huang D, Tang NL-S and Wong M-H (2020) Genome-Wide Search for SNP Interactions in GWAS Data: Algorithm, Feasibility, Replication Using Schizophrenia Datasets. Front. Genet. 11:1003. doi: 10.3389/fgene.2020.01003
Received: 26 May 2020; Accepted: 06 August 2020;
Published: 28 August 2020.
Edited by:
Shibiao Wan, St. Jude Children’s Research Hospital, United StatesReviewed by:
Weihua Yue, Peking University Sixth Hospital, ChinaHao Lin, University of Electronic Science and Technology of China, China
Copyright © 2020 Lee, Leung, Ma, So, Huang, Tang and Wong. This is an open-access article distributed under the terms of the Creative Commons Attribution License (CC BY). The use, distribution or reproduction in other forums is permitted, provided the original author(s) and the copyright owner(s) are credited and that the original publication in this journal is cited, in accordance with accepted academic practice. No use, distribution or reproduction is permitted which does not comply with these terms.
*Correspondence: Kwan-Yeung Lee, kylee@cse.cuhk.edu.hk; kesterleeky@gmail.com; Nelson Leung-Sang Tang, nelsontang@cuhk.edu.hk