- 1Innovation Center for Neurological Disorders and Department of Neurology, Xuanwu Hospital, Capital Medical University, National Clinical Research Center for Geriatric Diseases, Beijing, China
- 2Beijing Key Laboratory of Geriatric Cognitive Disorders, Beijing, China
- 3Clinical Center for Neurodegenerative Disease and Memory Impairment, Capital Medical University, Beijing, China
- 4Center of Alzheimer’s Disease, Beijing Institute for Brain Disorders, Beijing, China
Alzheimer disease (AD) is the most common cause of dementia and creates a significant burden on society. As a result, the investigation of hub genes for the discovery of potential therapeutic targets and candidate biomarkers is warranted. In this study, we used the ComBat method to merge three gene expression datasets of AD from the Gene Expression Omnibus (GEO). During combined analysis, we identified 850 differentially expressed genes (DEGs) from the temporal cortex of AD and cognitively normal (CN) samples. We performed weighted gene coexpression network analysis to build gene coexpression networks incorporating these DEGs to identify key modules and hub genes. We found one module most strongly correlated with AD onset as the key module and 19 hub genes in the key module that were down-regulated in AD brains. According to Gene Ontology and Kyoto Encyclopedia of Genes and Genomes analyses, DEGs were mostly enriched in synapse function, and genes in the key module were mostly related to learning and memory. We selected five little-studied genes, AP3B2, GABRD, GPR158, KIAA0513, and MAL2, to validate their expression in AD mouse model by performing quantitative real-time polymerase chain reaction. We found that all of them were down-regulated in cortices of 8-month 5xFAD mice compared to those of wild-type mice. We then further investigated their correlations with β-secretase activity and Aβ42 levels in AD samples of different Braak stages. We found that all five hub genes had significant negative associations with β-secretase activity and that AP3B2 and KIAA0513 had significant negative associations with Aβ42 levels. We tested the differential expressions of the five hub genes in two AD GEO datasets from the blood and found that KIAA0513 was significantly up-regulated in patients with both mild cognitive impairment (MCI) and AD and was able to differentiate MCI and AD from CN in the two datasets. In conclusion, these five novel vulnerable genes were involved in AD progression, and KIAA0513 was a promising candidate biomarker for early diagnosis of AD.
Introduction
Alzheimer disease (AD) is the most common cause of dementia and is manifested as progressive impairments of memory and other cognitive domains. Pathological lesions in AD include β-amyloid (Aβ) plaques, neurofibrillary tangles, synaptic failure, neuronal loss, and brain atrophy (Serrano-Pozo et al., 2011). At present, only APP, PSEN1, PSEN2, and APOEε4 are considered to be causal genes or variants for AD (Tanzi, 2012; Jia et al., 2020; Neuner et al., 2020). In addition, genome-wide association studies also found AD risk genes including ABCA7, CLU, SORL1, TREM2, and so on (Campion et al., 2019; Kunkle et al., 2019). Network analyses of AD-related genes from publications revealed the complexed molecular mechanisms of AD (Hu et al., 2017). In vitro studies have identified other genes such as AChE (Garcia-Ayllon et al., 2011) and TFEB (Guo et al., 2017; Xu et al., 2020) playing roles in AD pathologies, which provides potential targets for AD therapy. However, there are still no effective drugs for AD treatment. Because AD is a complicated disease affected by age, genetic, and environmental factors, a greater number of key genes and their underlying mechanisms must be identified in order to facilitate the discovery of novel therapeutic targets and candidate biomarkers.
Weighted gene coexpression network analysis (WGCNA) is a gene-screening (i.e., ranking) method and a data exploratory tool for finding clusters (i.e., modules) that includes highly correlated genes, which can then be used for identification of candidate biomarkers and therapeutic targets (Langfelder and Horvath, 2008, 2012). This analysis has been applied widely in studies of various diseases, including cancers and neuropsychiatric disorders (Chuang et al., 2017; Radulescu et al., 2018; Ding et al., 2019; Luo et al., 2019). In the current study, we merged three independent gene expression datasets from the Gene Expression Omnibus (GEO) database1 using the ComBat method (Johnson et al., 2007) and analyzed the merged datasets to identify differentially expressed genes (DEGs). These DEGs were then used to find key modules and hub genes associated with AD by WGCNA. Gene Ontology (GO) enrichment and Kyoto Encyclopedia of Genes and Genomes (KEGG) pathway analyses were further utilized to identify possible functions of the DEGs and key modules. Finally, five little-characterized hub genes, AP3B2, GABRD, GPR158, KIAA0513, and MAL2, were chosen to test their expression levels in different Braak stages, their diagnostic values for AD and mild cognitive impairment (MCI), and their correlations with β-secretase activity and Aβ42 levels. Gene Set Enrichment Analysis (GSEA) was used to explore potential biological functions of these hub genes.
Materials and Methods
Data Collection
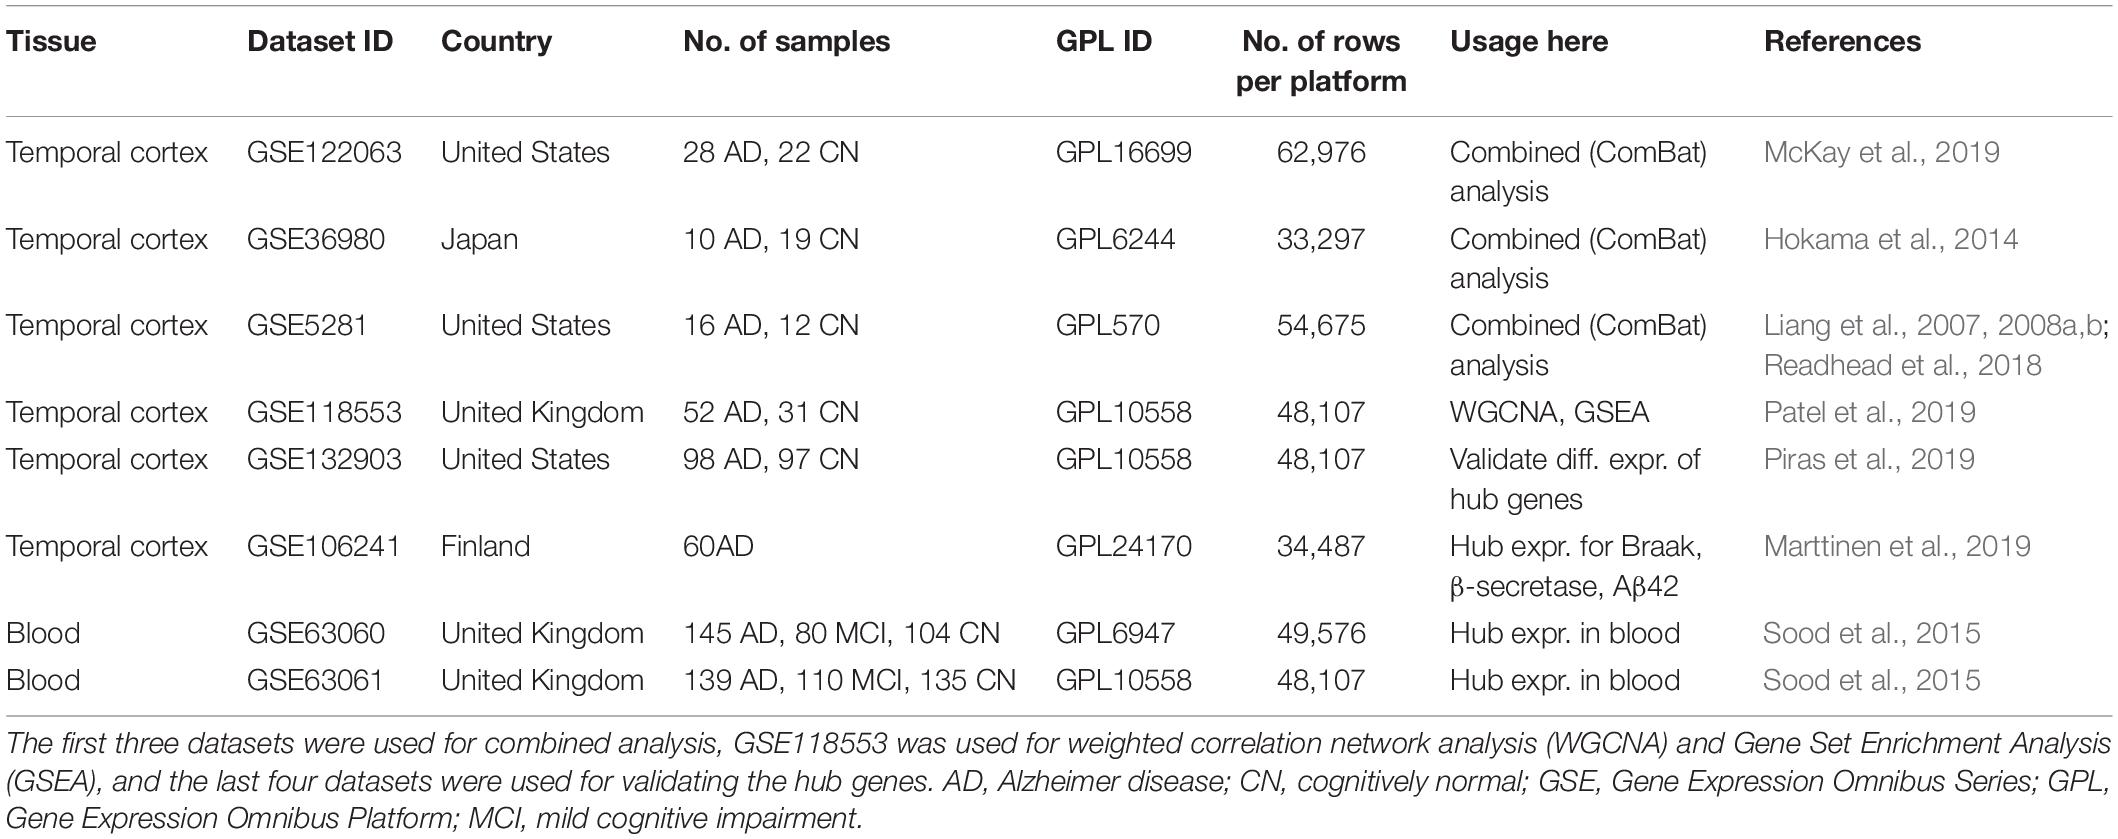
Figure 1 shows the overall workflow of this study. All microarray datasets were downloaded from the GEO database1. We searched the GEO database for microarray datasets using the keyword “Alzheimer.” Datasets were included if they met the following criteria: (1) were from humans; (2) included expression data from the temporal cortex of both AD and cognitively normal (CN) samples, expression data from the temporal cortex of AD samples with different Braak stages, or blood expression data from AD, MCI, and CN samples; (3) the number of rows in each platform was >30,000; (4) the number of AD samples was ≥10, and the number of CN samples was ≥10; and (5) there were no repeated samples among datasets. Finally, five datasets from the temporal cortex of AD and CN samples; one dataset from the temporal cortex of AD samples with different Braak stages; and two datasets from the blood of AD, MCI, and CN samples were selected. Detailed information for these datasets, including GEO accession ID, dataset country, sample numbers, platform ID, and number of genes in each platform, as well as usage in the current study and references, was recorded and is shown in Table 1. Because GSE132903 had far more samples (98 AD, 97 CN) than the other four datasets from the temporal cortex of AD and CN samples, combining this dataset would have blurred the results of the combined analysis. Thus, GSE132903 (Piras et al., 2019) was used to validate further the differential expression of hub genes. Datasets GSE122063 (28 AD, 22 CN; McKay et al., 2019), GSE36980 (10 AD, 19 CN; Hokama et al., 2014), and GSE5281 (16 AD, 12 CN; Liang et al., 2007, 2008a,b; Readhead et al., 2018) had similar sample sizes and were chosen for the combined analysis in the current study. Dataset GSE118553 (52 AD, 31 CN; Patel et al., 2019) was used to build the coexpression network and to perform GSEA. Dataset GSE106241 (Marttinen et al., 2019) was used to test the expression of hub genes in different Braak stages and to explore the correlation with β-secretase activity and Aβ42 levels. Datasets GSE63060 and GSE63061 (Sood et al., 2015) were used to validate the expression of hub genes in the blood of AD samples. Series matrix files of these datasets and their corresponding platform files were downloaded for the current analysis.
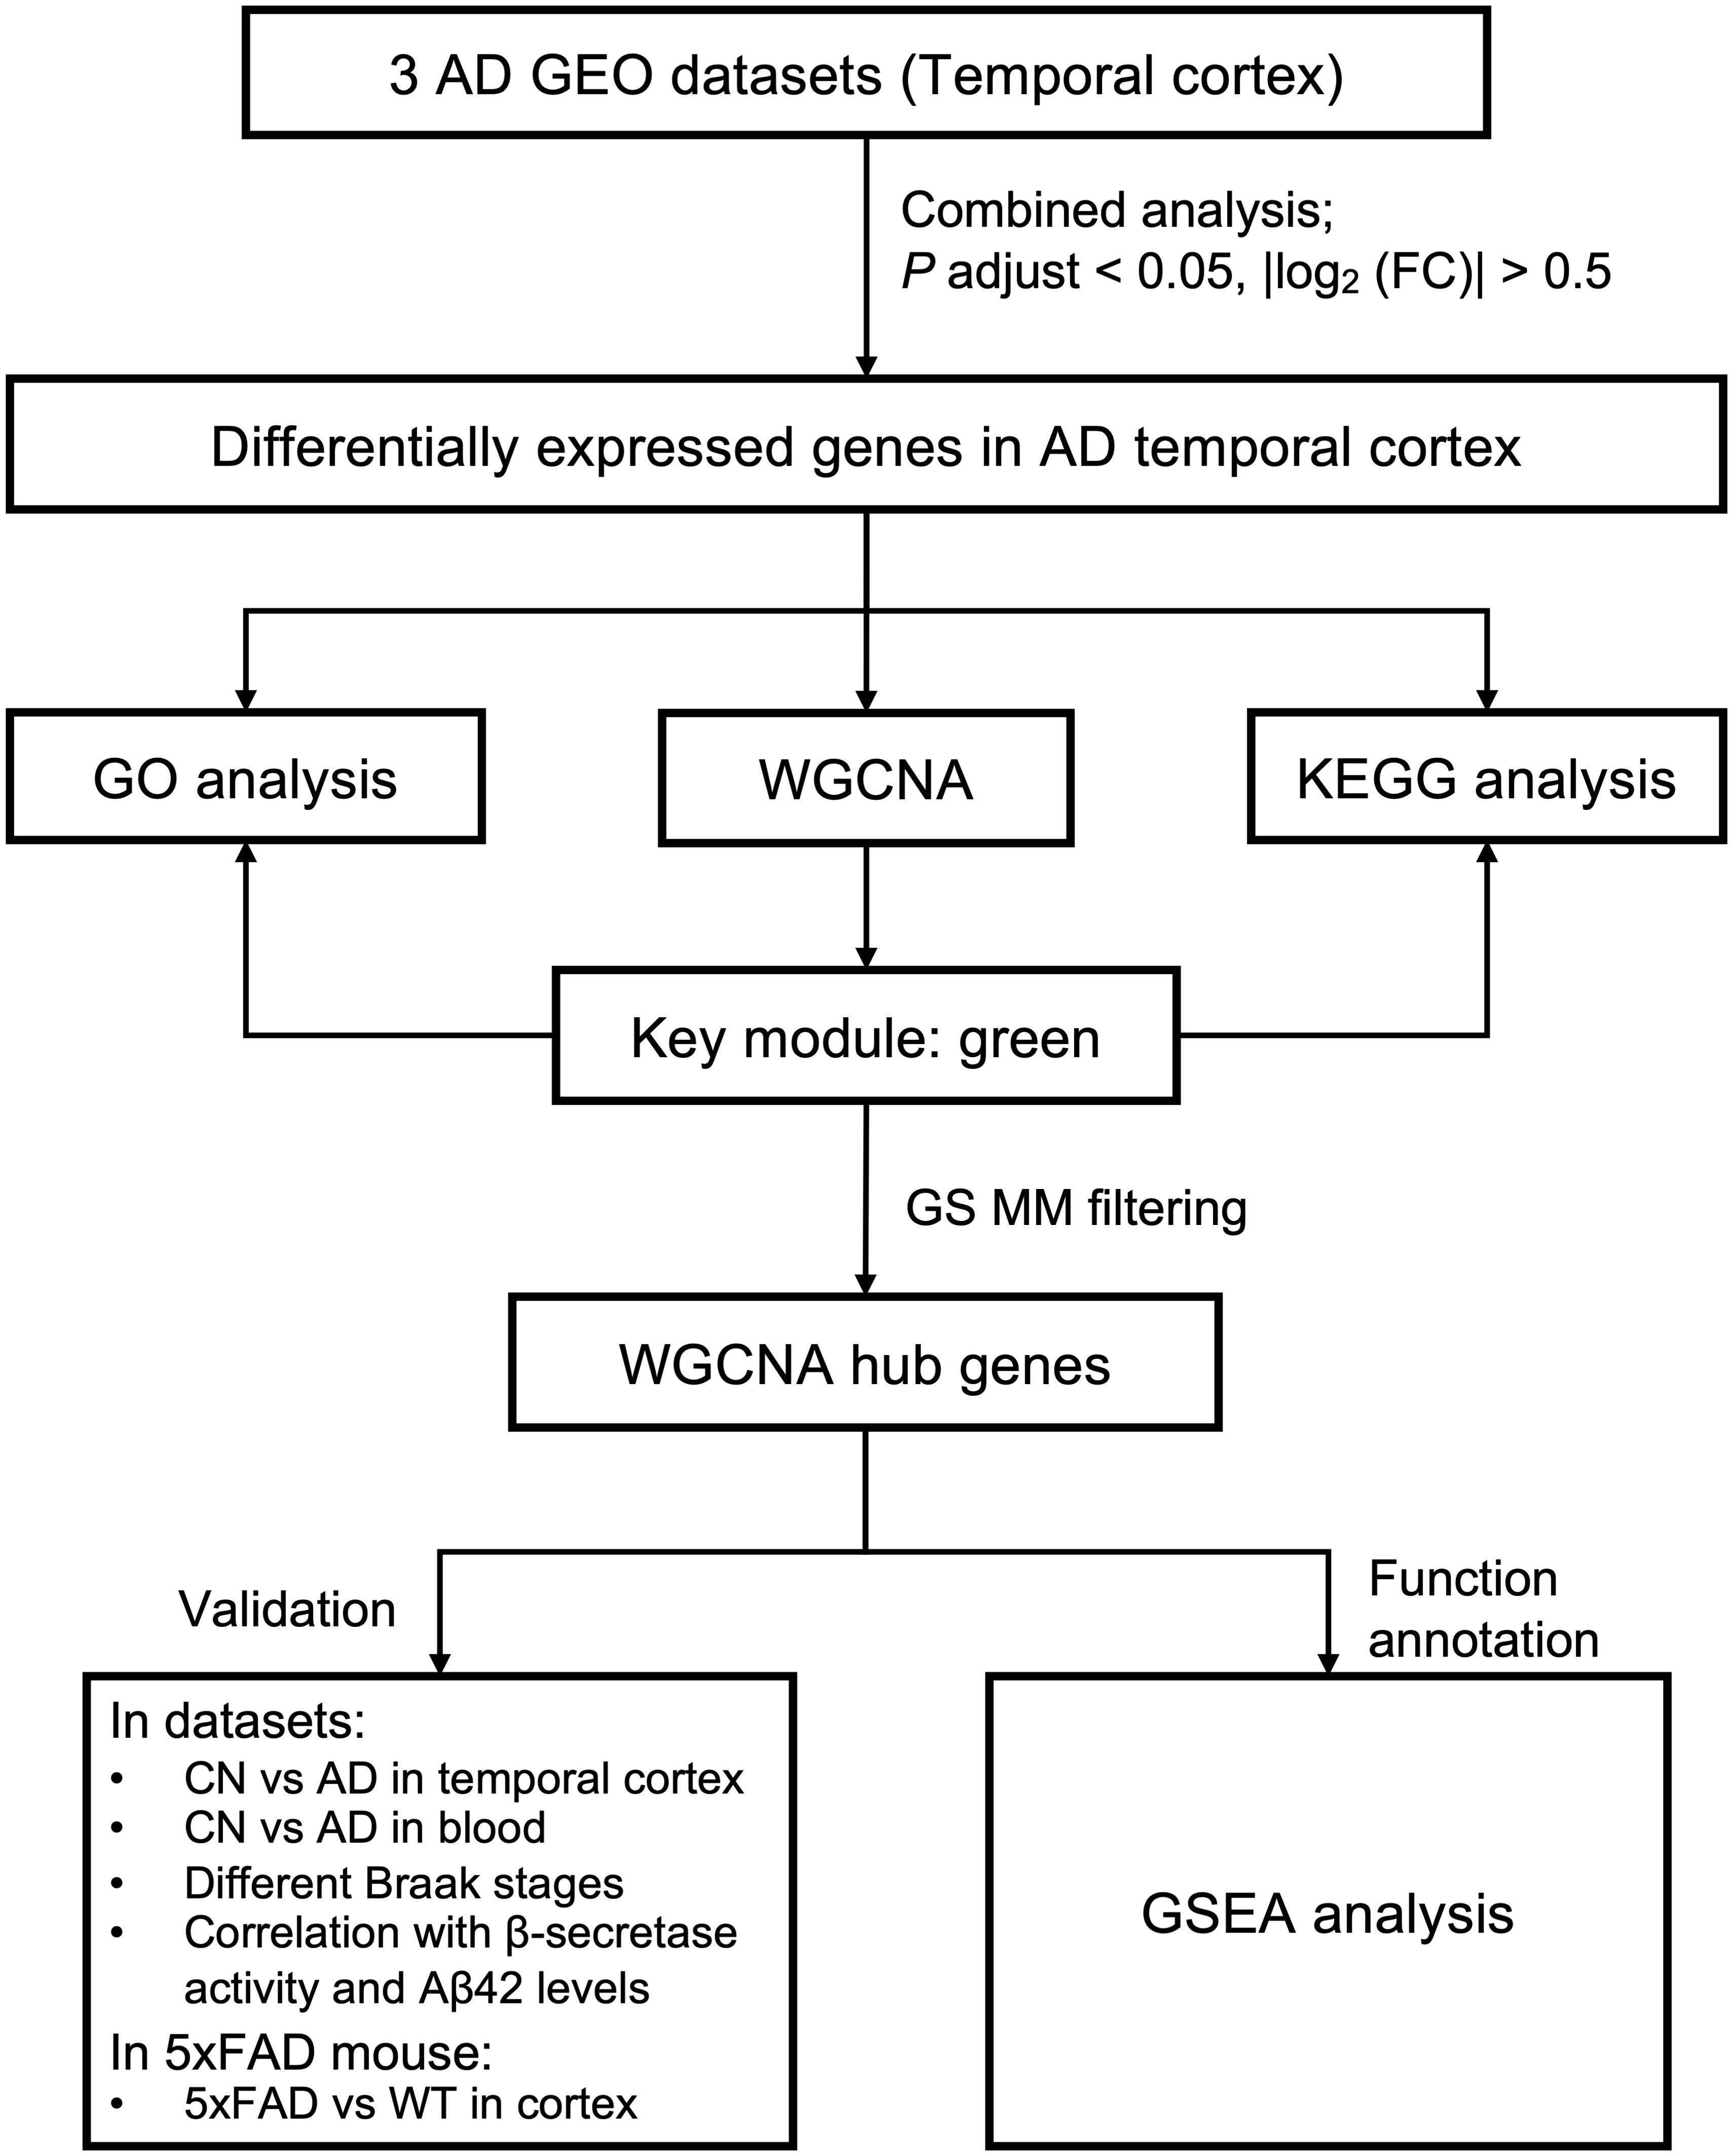
Figure 1. Study workflow. AD, Alzheimer disease; CN, cognitively normal; FC, fold change; GEO, Gene Expression Omnibus; GO, Gene Ontology; GS, gene significance; GSEA, Gene Set Enrichment Analysis; KEGG, Kyoto Encyclopedia of Genes and Genomes; MM, module membership; WGCNA, weighted gene coexpression network analysis; WT, wild type.
Identification of Differentially Expressed Genes by Combined Analysis
Combined analysis was performed for three datasets, including GSE122063 (McKay et al., 2019), GSE36980 (Hokama et al., 2014), and GSE5281 (Liang et al., 2007, 2008a,b; Readhead et al., 2018). Converting probes to gene symbols for series matrix files of each dataset and merging the gene expression data of these three datasets were conducted using Perl (version 5.18.4) (Wall, 1994, Wall et al., 2000). Batch normalization of the merged file was conducted using the ComBat method from the R package “sva” (Johnson et al., 2007; Leek et al., 2019; R Core Team, 2020). DEG screenings were conducted using the R package “limma” (Ritchie et al., 2015). P-values were adjusted using the false discovery rate (FDR) method. Genes with adjusted P <0.05 and | log2 fold change (FC)| >0.5 were considered as DEGs in the combined analysis. A heatmap of all DEGs was made by the R package “pheatmap” (Kolde, 2019). The R package “OmicCircos” was used to show the chromosomal locations, as well as expression patterns of the top 100 DEGs from the combined analysis.
Function Enrichment Analyses
GO and KEGG pathway analyses were conducted utilizing the R package “clusterProfiler” (Yu et al., 2012). GO terms and KEGG pathways with adjusted P <0.05 were considered to be significant and were exhibited using the R package “GOplot” (Walter et al., 2015).
Weighted Gene Coexpression Network Analysis
We used the DEGs from the combined analysis to perform WGCNA using expression data from GSE118553 (Patel et al., 2019). The R package “WGCNA” was used to conduct this analysis and to find clinical trait–related modules and hub genes among the DEGs (Langfelder and Horvath, 2008, 2012). To transform the adjacency matrix to a topological overlap matrix, a soft-threshold power with a scale-free R2 near 0.9 and a slope near 1 was selected. We set the soft-threshold power as 5 (scale-free R2 = 0.9, slope = -0.96), cut height as 0.25, and the minimal module size as 10 for network construction and module detection. The module with the highest correlation with AD was considered the key module. The network of the key module from WGCNA was generated by Cytoscape (version 3.7.1)2. Genes in the key module were selected to perform GO and KEGG analyses to explore their biological functions. Hub genes in WGCNA were defined as those with a gene significance (GS) >0.4 and a module membership (MM) >0.8.
Validation of Hub Genes in Datasets
Expression data of hub genes extracted from Dataset GSE132903 (Piras et al., 2019) and the other four aforementioned datasets were utilized to validate the differential expression of these hub genes in the temporal cortex. Hub gene expression data, β-secretase activity, and Aβ42 levels in AD samples from GSE106241 (Marttinen et al., 2019) were used to validate the expressions of hub genes in different Braak stages and to investigate their correlations with β-secretase activity and Aβ42 levels. Moreover, GSE63060 and GSE63061 (Sood et al., 2015) were used to explore the differential expressions of hub genes in the blood of AD and MCI samples. Using the two datasets, receiver operating characteristic (ROC) curves were made by GraphPad Prism (version 8.0.0)3. Bar plots, box plots, and correlation analysis in this section were all generated using GraphPad Prism (version 8.0.0)3.
Mice
The animal study protocol was reviewed and approved by the Ethics Committee of Capital Medical University. 5xFAD mice express five AD-related mutations in human forms of APP and PSEN1, including three in APP (K670N/M671L, I716V, and V717I) and two in PSEN1 (M146L and L286V). Eight-month 5xFAD and wild-type (WT, non-transgenic littermates) mice with mixed genders were used in the experiments.
Quantitative Real-Time Polymerase Chain Reaction
Total RNA was extracted from cortices of 8-month 5xFAD and WT mice by RNAsimple Total RNA Kit (#DP419, TIANGEN, China). RNA 1 μg was used in the following reverse transcription (#RR047, Takara, Japan). Quantitative real-time polymerase chain reaction (qRT-PCR) was done on Applied Biosystems ViiATM 7 Real-Time PCR System using TB Green® Premix Ex Taq (#RR420, Takara, Japan). β-Actin was used as internal control, and relative expression was determined using 2–ΔΔCT method. Primers were designed and synthesized by BGI Tech Solutions (Beijing Liu He) Co., Ltd. Sequences of primers were shown in Supplementary Table 1.
Gene Set Enrichment Analysis
GSEA (version 4.0.3, Broad Institute, Inc., Massachusetts Institute of Technology, and Regents of the University of California) was conducted to explore the possible biological functions of the hub genes (Mootha et al., 2003; Subramanian et al., 2005). AD samples in GSE118553 (Patel et al., 2019) were divided into two groups according to the expression level of the hub genes. The database “c2.cp.kegg.v7.0.symbols.gmt” was chosen for enrichment. Terms with P <0.05 and FDR <0.25 were defined as significant.
Statistical Analysis
The normality test and homogeneity of variance test were performed on data extracted from GEO datasets. Data that passed these two tests then underwent t-testing for comparisons between two groups and analysis of variance (ANOVA) testing for comparisons among three or more groups. After ANOVA analysis, a Dunnett multiple-comparisons test was used for post-hoc testing. Data that passed the normality test, but did not pass the homogeneity of variance test, underwent t-testing with Welch correction for comparisons between two groups and the Brown–Forsythe ANOVA test for comparisons among three or more groups. Data that did not pass the normality test underwent non-parametric testing, using the Kruskal–Wallis test and Dunn multiple-comparisons test for comparisons among three or more groups. GraphPad Prism (version 8.0.0) (see text footnote 4) was utilized to perform the above tests.
Results
Screening of DEGs by Combined Analysis
Datasets GSE122063 (McKay et al., 2019), GSE36980 (Hokama et al., 2014), and GSE5281 (Liang et al., 2007, 2008a,b; Readhead et al., 2018) were included in the combined analysis. After combined analysis, 850 DEGs (223 up-regulated and 627 down-regulated) were identified and are shown in heatmap and volcano plots (Supplementary Figures 1, 2 and Supplementary Table 2). The polarity of genes described as “up-regulated” or “down-regulated” in this article is with respect to AD vs. CN. The top 100 DEGs (according to | log2FC|, including top 50 up-regulated genes, as well as top 50 down-regulated genes) were chosen to visualize their chromosomal locations and expression patterns across the three datasets used for combined analysis, as well as their logarithmic adjusted P-values shown in the inner layer (Figure 2). The top five up-regulated genes were SERPINA3, FCGBP, MAFF, SCIN, and CD163, whereas the top five down-regulated genes were CARTPT, SST, PCSK1, PPEF1, and NPTX2 (Figure 2).
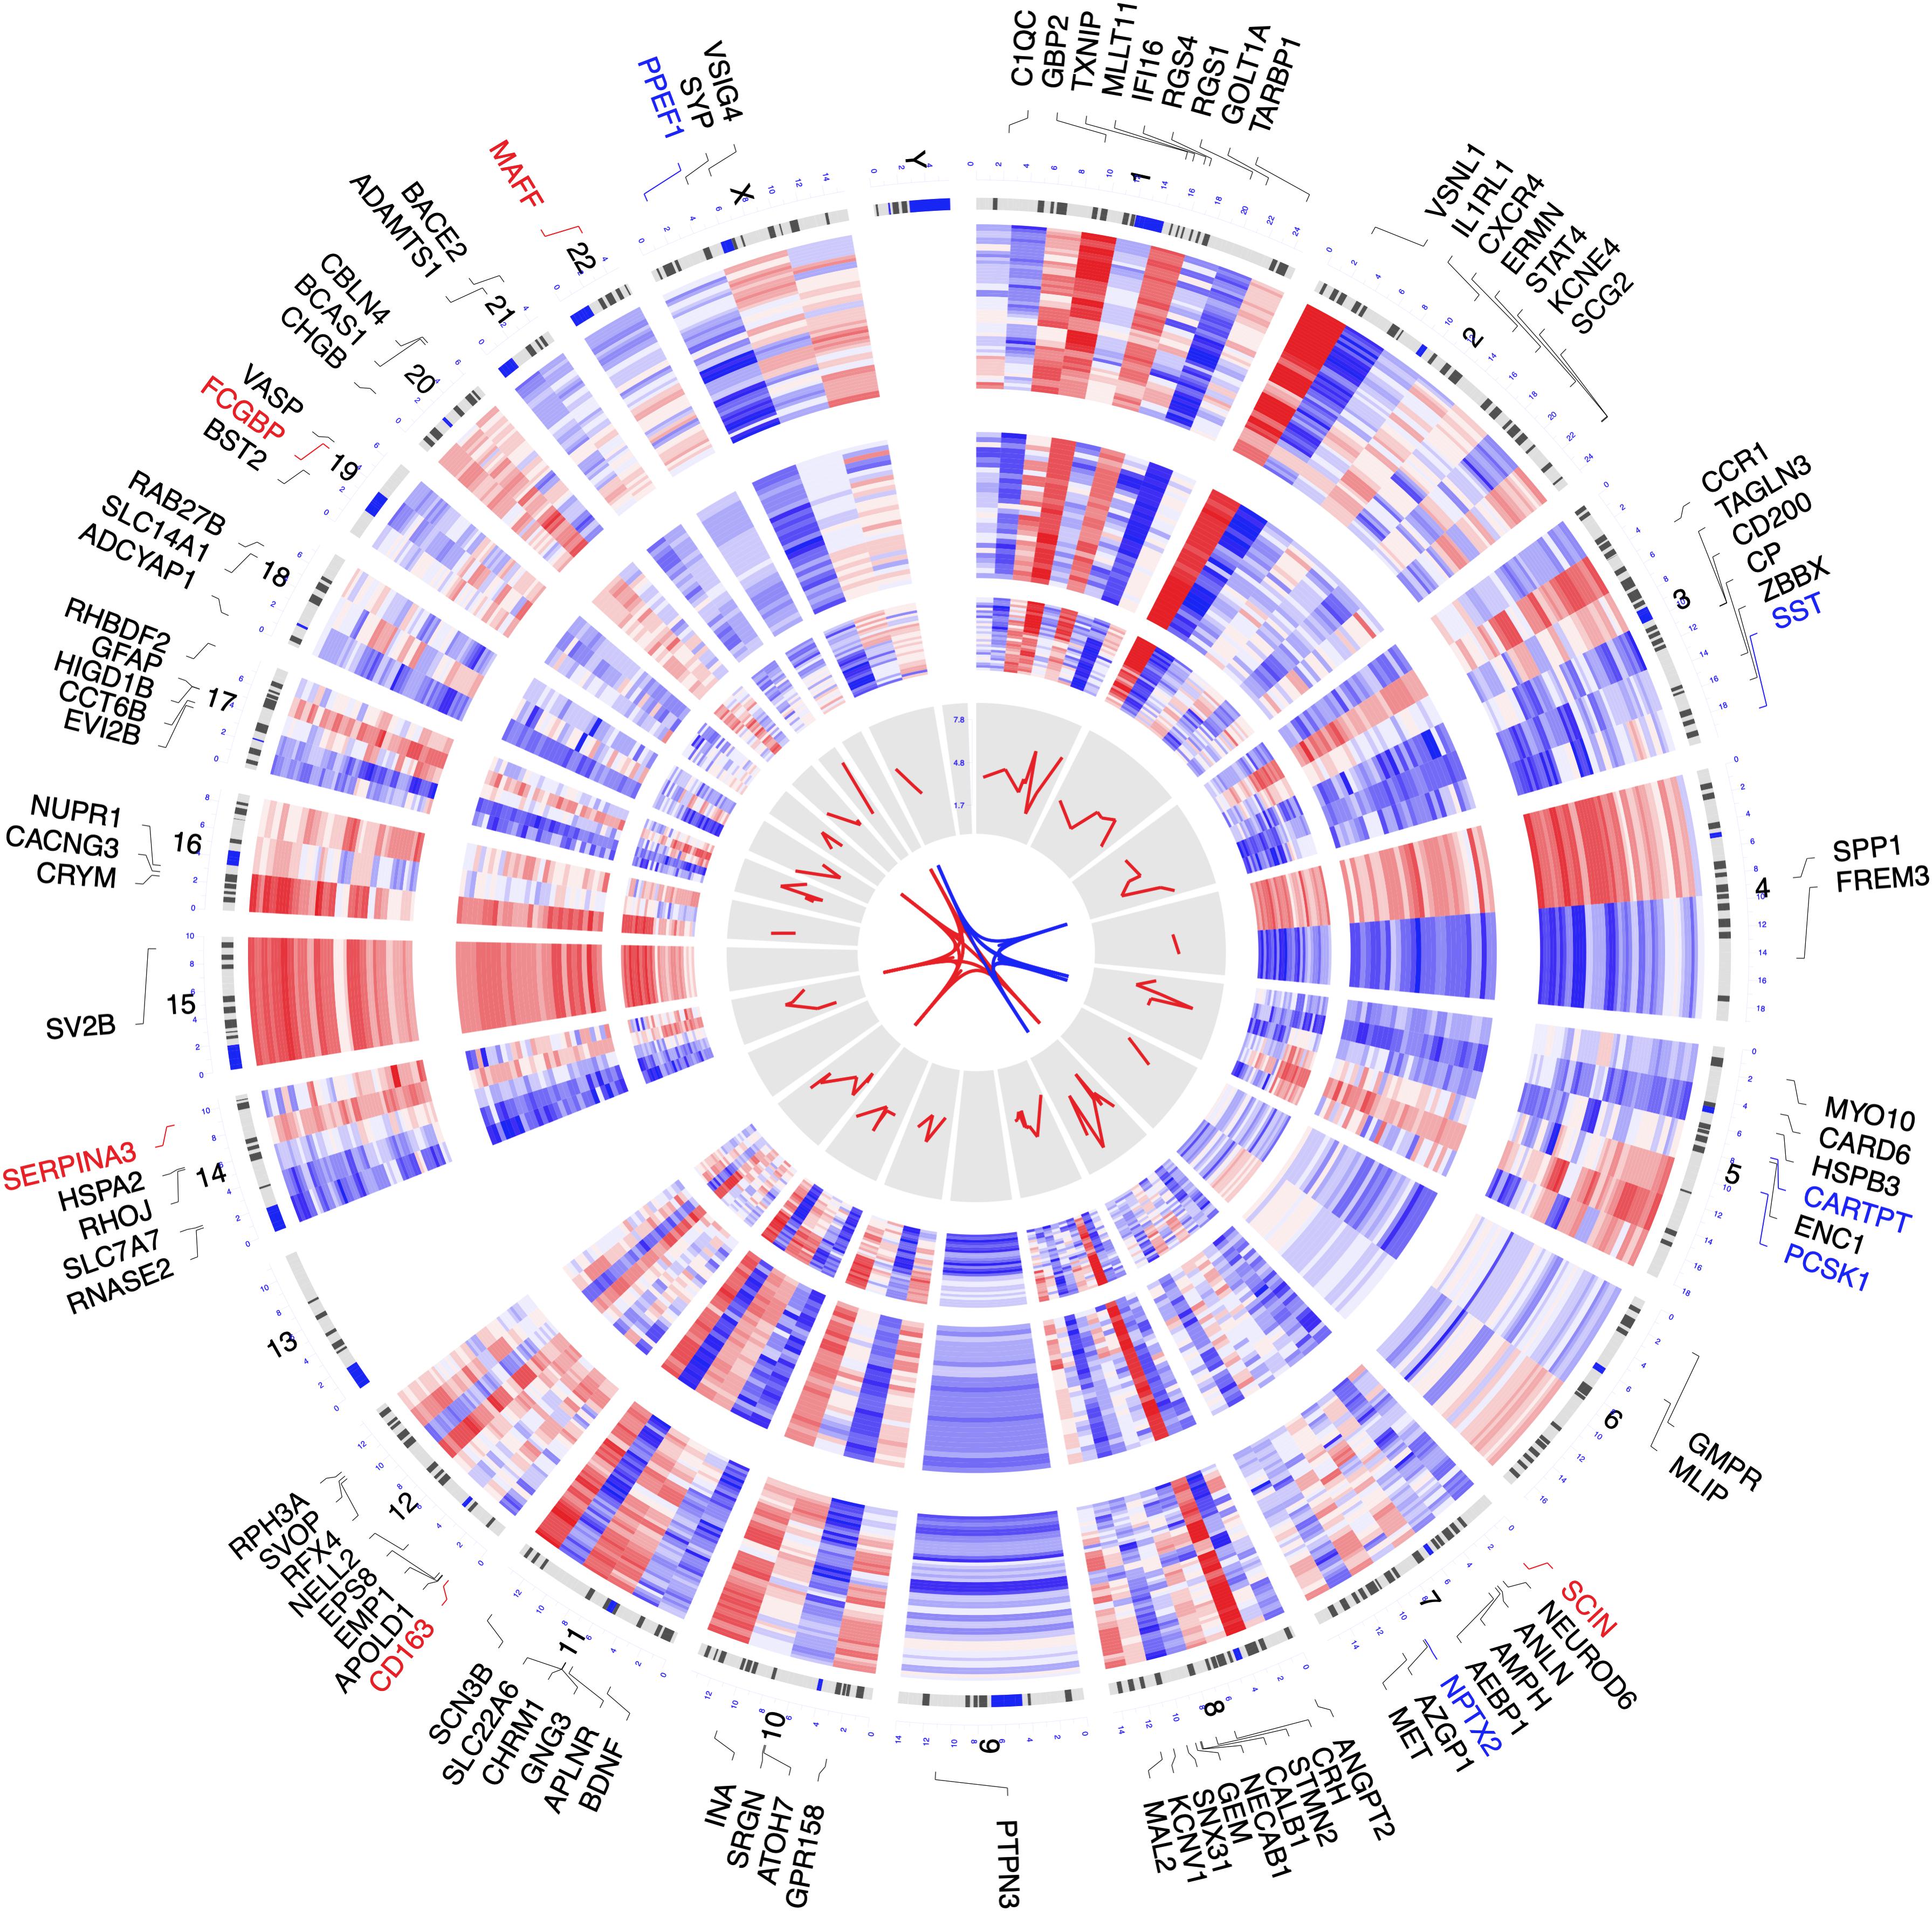
Figure 2. Circos plot of expression patterns and chromosomal positions of top 100 differentially expressed genes (DEGs). The outer circle represents chromosomes, and lines coming from each gene point to their specific chromosomal locations. The three Alzheimer disease (AD) microarray datasets from Gene Expression Omnibus (GEO) used for combined analysis are represented in the inner circular heatmaps. GSE122063, GSE36980, and GSE5281 are presented from the outside to the inside. The red lines in the inner layer indicate -log10 (adjusted P-value) of each gene. According to |log2 fold change|, the top five up-regulated genes (red) and the top five down-regulated genes (blue) are connected with red and blue lines in the center of the Circos plot.
Functional Enrichment Analysis of DEGs
All DEGs were utilized to perform GO and KEGG analyses, and the top five of these terms based on their adjusted P-values are shown in chord plots (Figure 3). We found enrichments in several biological process terms for GO analysis. The top five terms were neurotransmitter transport, synaptic vesicle cycle, neurotransmitter secretion, signal release from synapse, and vesicle-mediated transport in synapse, which are shown in Figure 3A. The top five cellular component terms for GO analysis were presynapse, glutamatergic synapse, synaptic membrane, axon part, and exocytic vesicle (Figure 3B). The top five molecular function terms for GO analysis were neurotransmitter receptor activity, voltage-gated ion channel activity, voltage-gated channel activity, ion gated channel activity, and gated channel activity (Figure 3C). For KEGG pathway analysis, DEGs were mostly enriched in neuroactive ligand-receptor interaction, nicotine addiction, GABAergic synapse, synaptic vesicle cycle, and amphetamine addiction pathways (Figure 3D). Further, we did enrichment analyses in up-regulated genes and down-regulated genes of AD brains separately and found that up-regulated genes were mostly enriched in regulation of angiogenesis, whereas down-regulated genes were mostly related to synaptic functions (Supplementary Figures 3, 4).
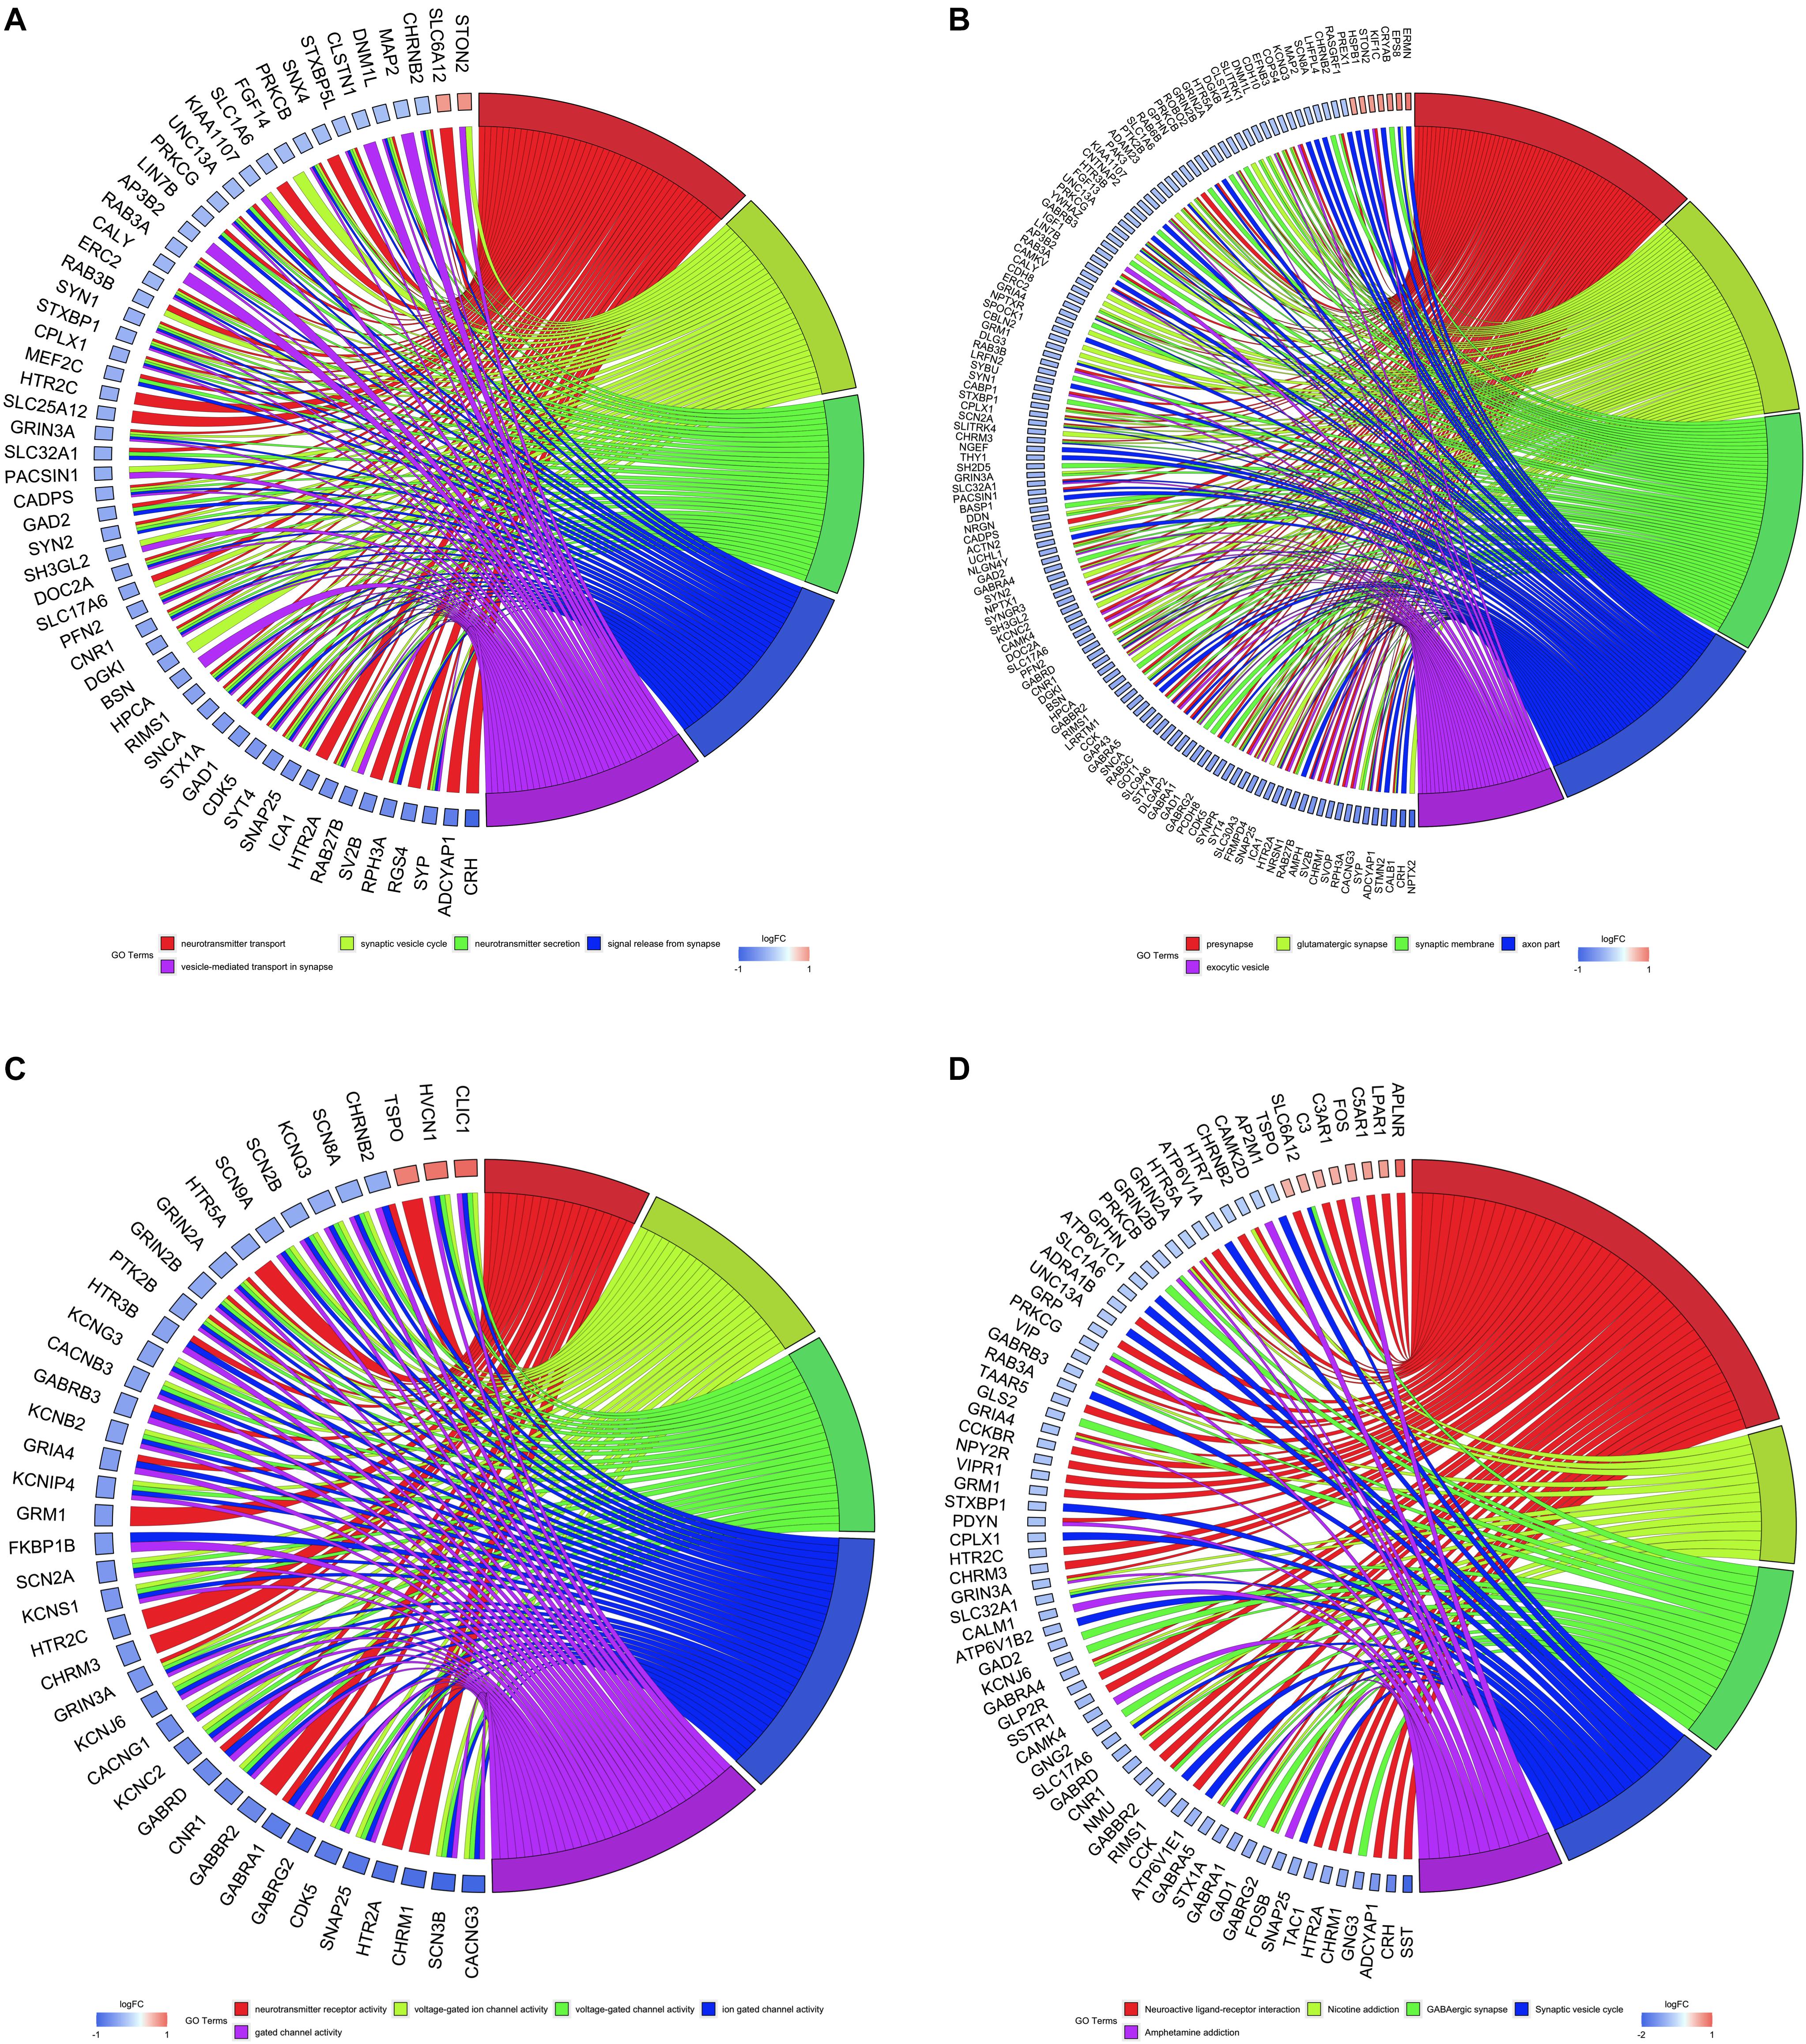
Figure 3. Gene Ontology (GO) and Kyoto Encyclopedia of Genes and Genomes (KEGG) analyses of all differentially expressed genes. Chord plots indicate enrichment analysis of genes. (A) Biological process of GO analysis. (B) Cellular component of GO analysis. (C) Molecular function of GO analysis. (D) KEGG pathways.
WGCNA and Key Module Identification
Expression data of 823 DEGs were extracted from GSE118553 (27 DEGs not available; Patel et al., 2019) and used to conduct WGCNA (Figure 4). By setting the soft-threshold power as 5 (scale-free R2 = 0.9, slope = -0.96; Figure 4B and Supplementary Figure 5) and cut height as 0.25, we acquired eight modules (Figures 4C,D), with non-clustering DEGs in the gray module. Genes in each module are shown in Supplementary Table 3. From the heatmap of module–trait correlations, we found that the green module was the most highly correlated with AD (correlation coefficient = -0.57, P = 2 × 10⁻⁸; Figures 4E,F). We also found that the blue, yellow, and brown modules had similar correlation coefficients with the green module. However, after comparing the relationships between GS and MM, we considered the green module (correlation coefficient = 0.74, P = 2 × 10⁻⁶; Figure 5A and Supplementary Figure 6) to be the key module associated with AD and therefore analyzed it further in detail. The key module contained 31 genes (Figure 5A and Supplementary Table 3), and the interaction of the genes in the key module is shown in Figure 5B. To explore the potential biological functions of genes in the key module, GO and KEGG analyses were performed, and the enrichments are shown in Figures 5C–F. The results indicated that genes in the key module were mostly related to biological processes like learning or memory and cognition (Figure 5C) and enriched in pathways like nicotine addiction and retrograde endocannabinoid signaling (Figure 5F). Under the threshold of MM >0.8 and GS >0.4, we identified the following 19 down-regulated hub genes in the key module: AP3B2, CAMKK2, CHGB, CLSTN1, CRYM, GABRD, GPR158, KIAA0513, MAL2, NPTX1, NRXN3, PHYHIP, RASGRF1, RPH3A, SCN2A, SCN2B, SLC8A2, STMN2, and TERF2IP.
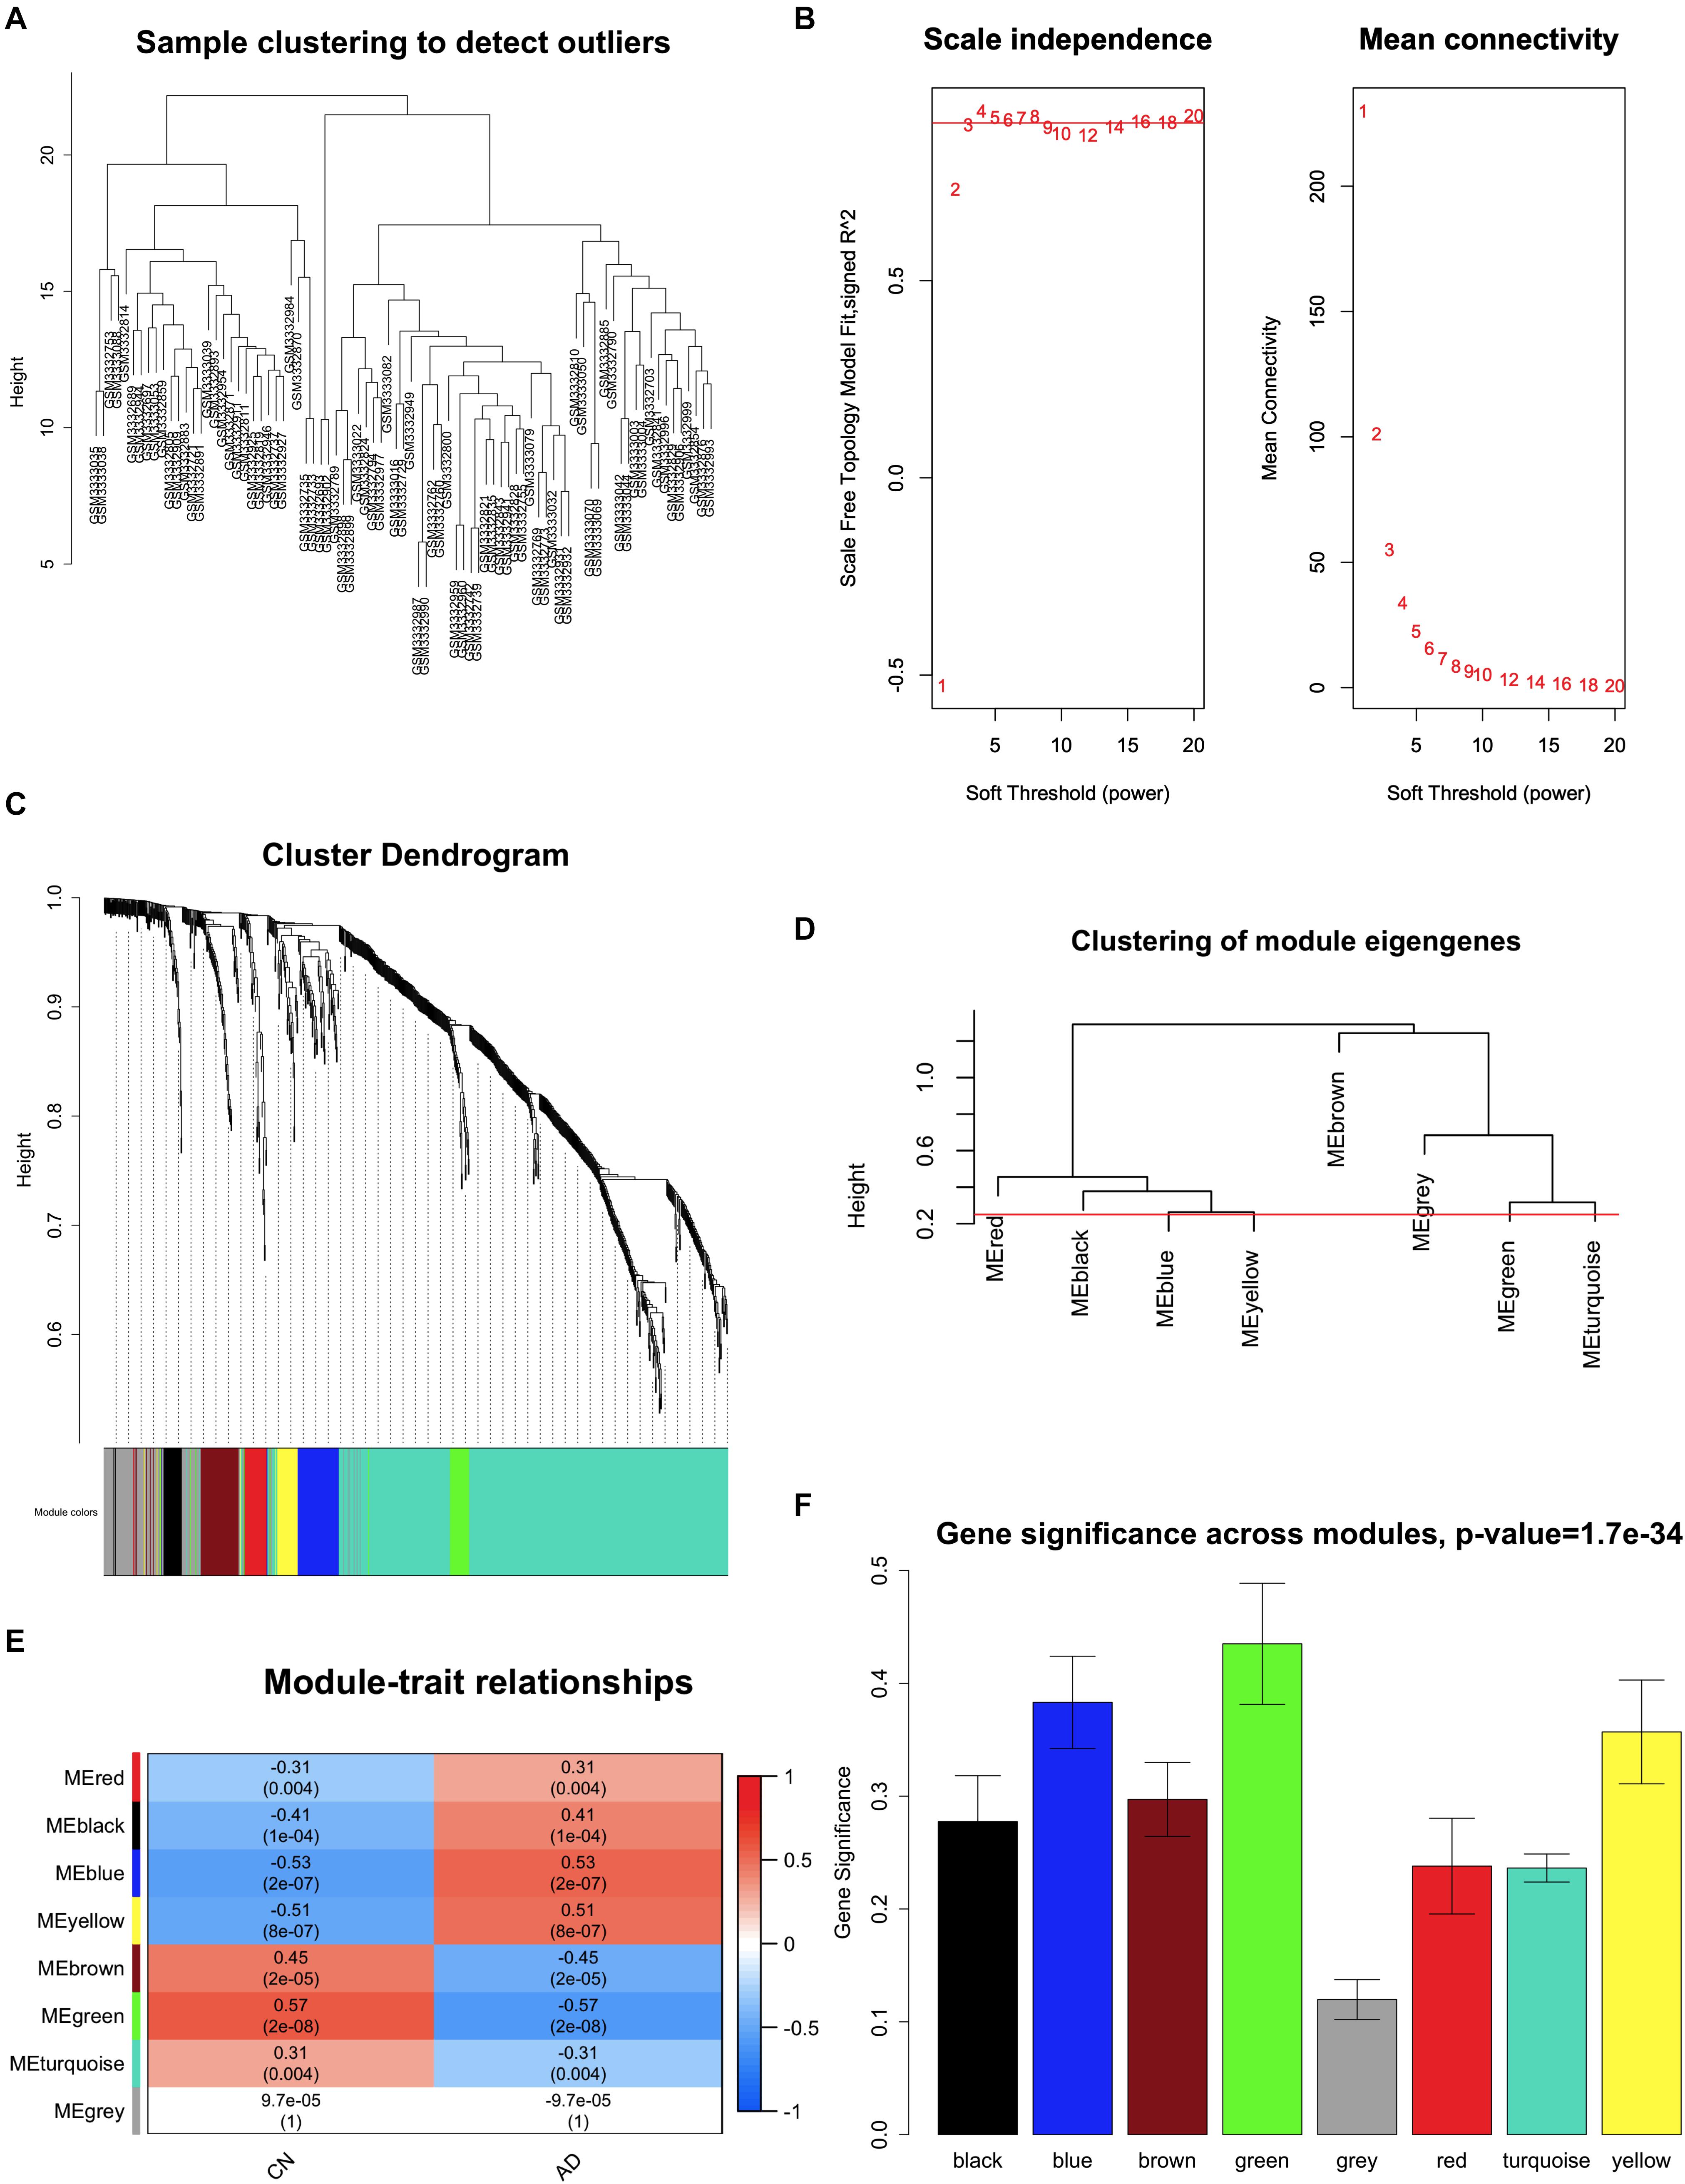
Figure 4. Key module correlated with Alzheimer disease identified by weighted gene coexpression network analysis (WGCNA). (A) Clustering of samples to detect outliers. (B) Scale-free topology model (left) and mean connectivity (right) for finding the soft-thresholding power. The power selected is 5. (C) Cluster dendrogram of genes. (D) Clustering of all modules. The red line indicates the height cutoff (0.25). (E) Heatmap shows the relationships between different modules and clinical traits. (F) Gene significance in different modules associated with AD. AD, Alzheimer disease; CN, cognitively normal.
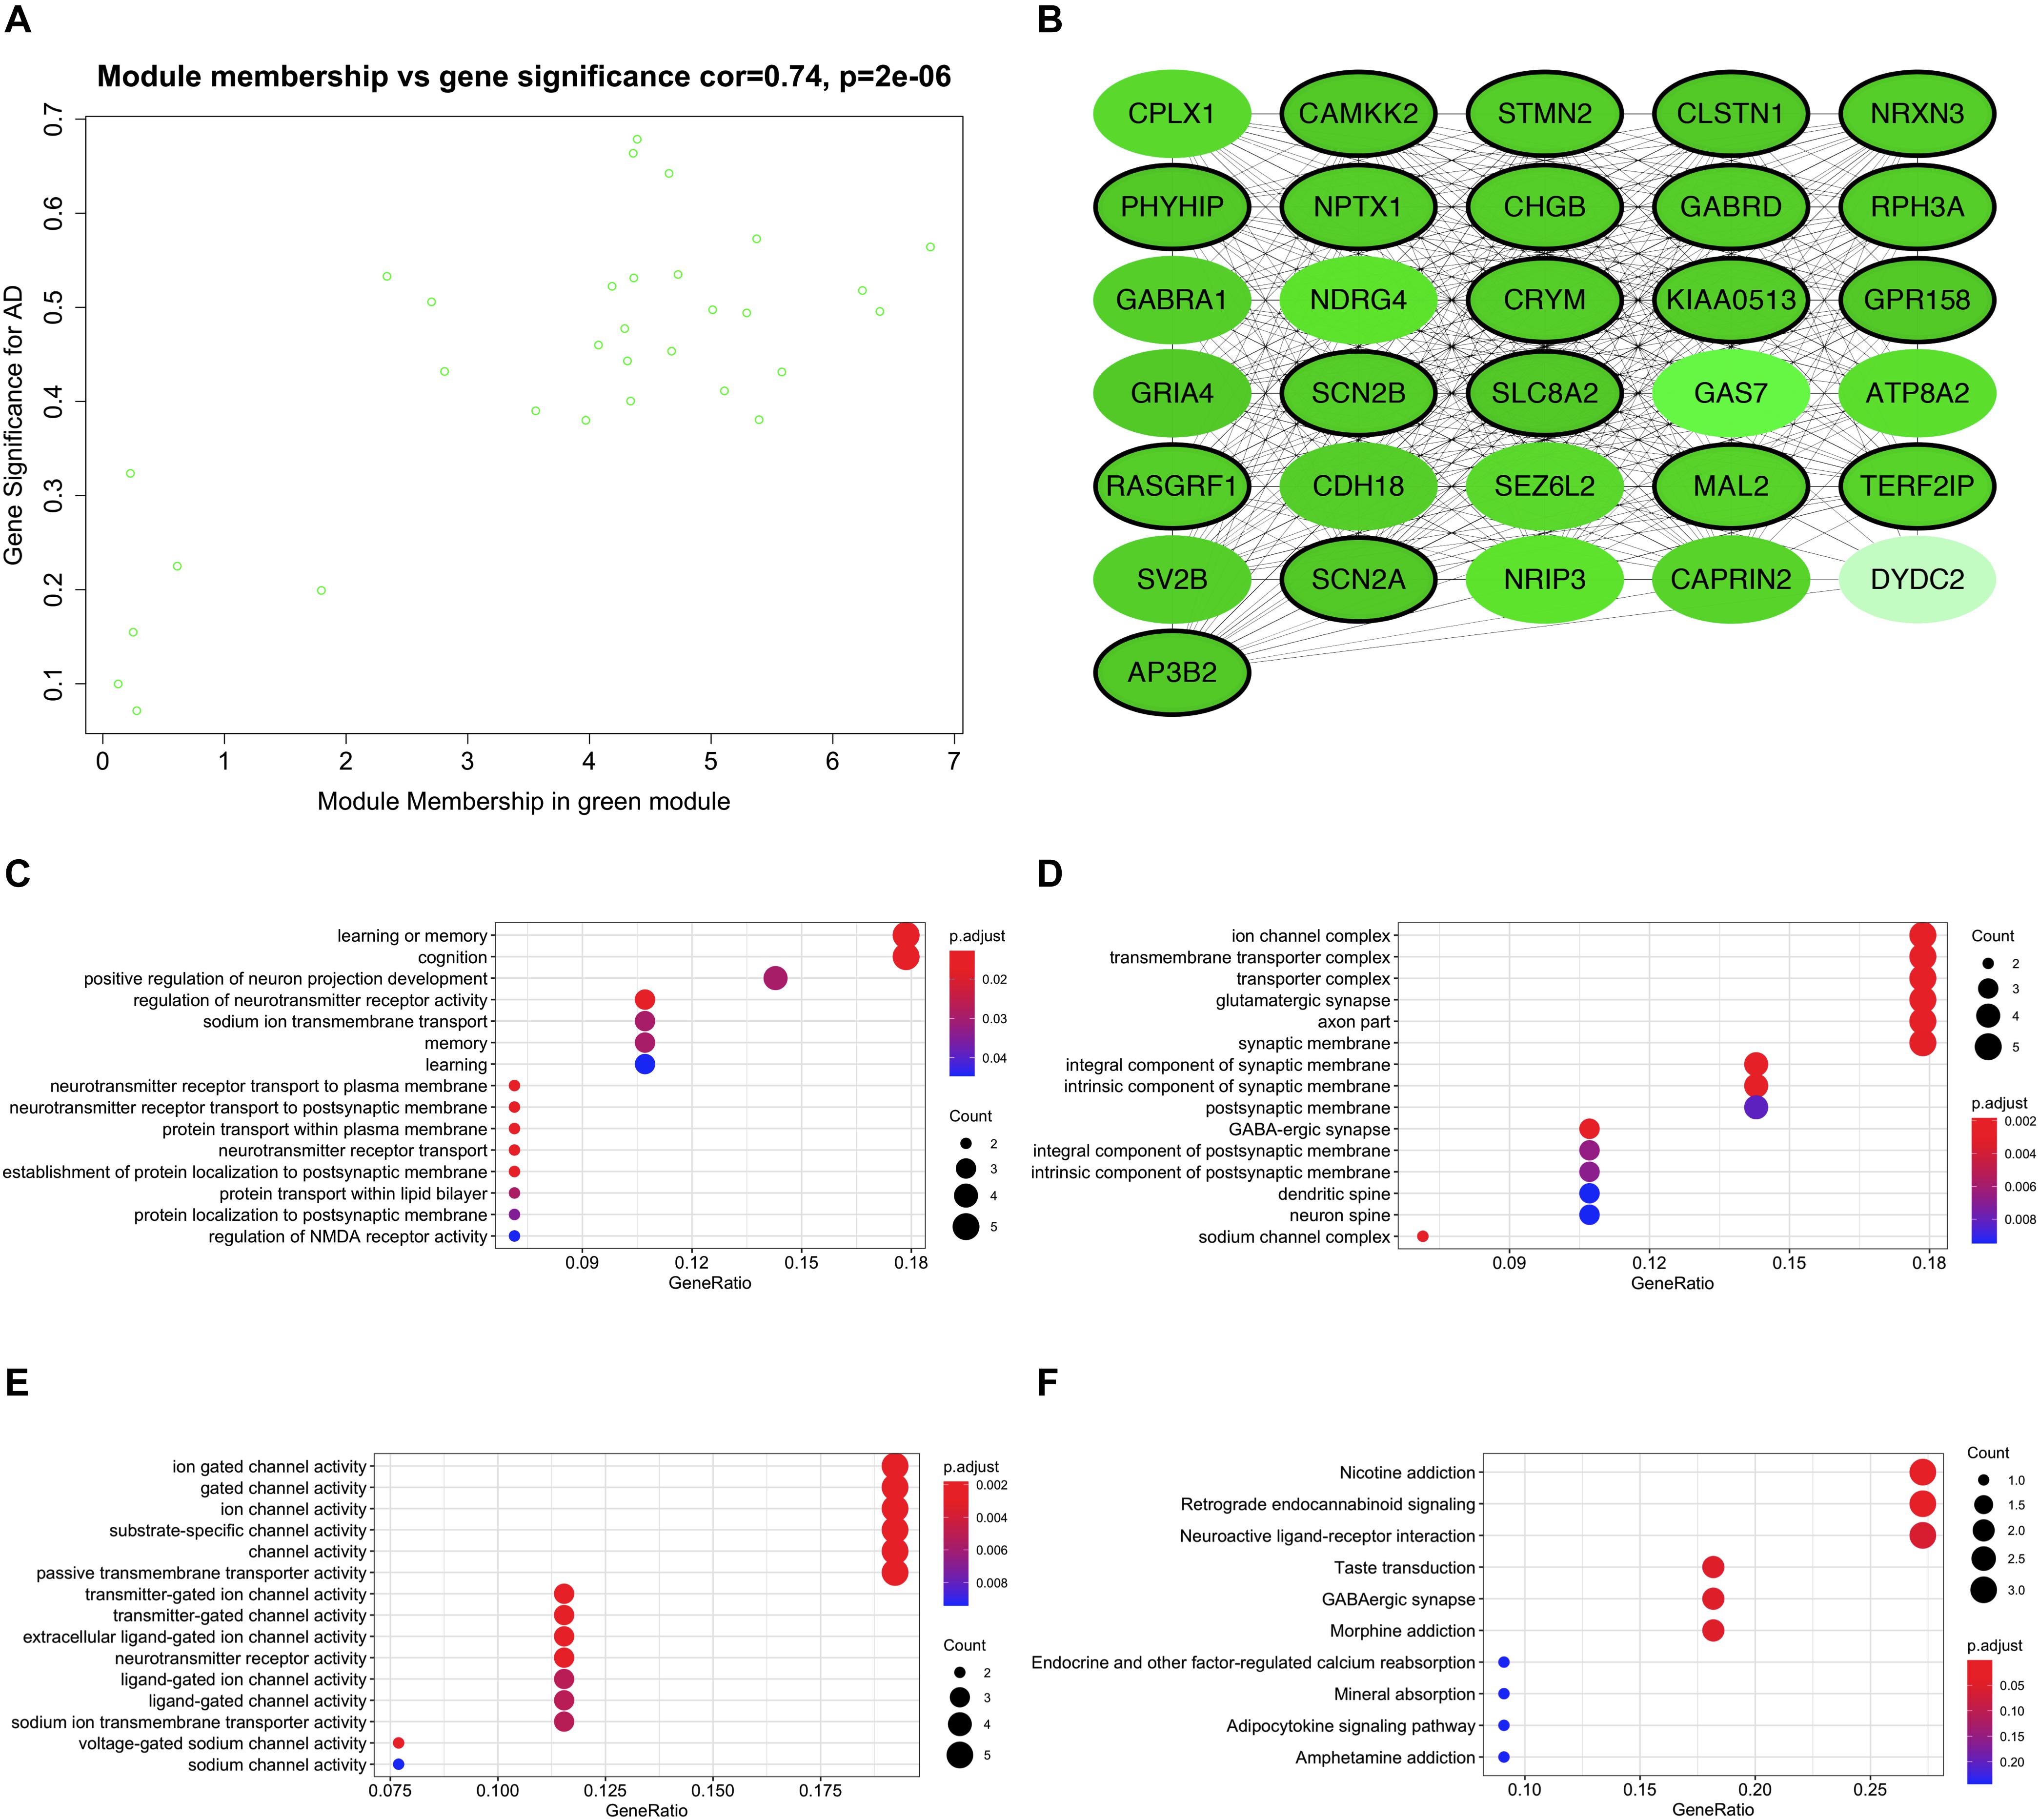
Figure 5. Functional enrichment of the key module. (A) Scatter plot of module eigengenes in the key module. (B) Interaction network of genes in the key module. Genes in black circles are hub genes in the key module. (C) Bubble plots of biological process of gene ontology (GO) analysis. (D) Bubble plots of cellular component of GO analysis. (E) Bubble plots of molecular function of GO analysis. (F) Bubble plots of KEGG pathways.
Validation of the Expression of Hub Genes
All 19 hub genes underwent expression validation in GSE132903 (Piras et al., 2019), GSE122063 (McKay et al., 2019), GSE36980 (Hokama et al., 2014), GSE5281 (Liang et al., 2007, 2008a,b; Readhead et al., 2018), and GSE118553 (Patel et al., 2019) datasets. Except for CRYM, GABRD, PHYHIP, SCN2B, and TERF2IP in GSE36980 and CAMKK2, PHYHIP, and GPR158 in GSE132903, all other hub genes were significantly down-regulated in AD samples from the five datasets (P < 0.05, 0.01, 0.001, or 0.0001; Figure 6 and Supplementary Figure 7). Among the 19 hub genes, we selected AP3B2, GABRD, GPR158, KIAA0513, and MAL2, which have been little studied on the associations with AD, in order to validate their expressions in cortices of 5xFAD and WT mice and in different Braak stages of AD samples (GSE106241; Marttinen et al., 2019). All five hub genes were down-regulated in cortices of 5xFAD mice compared to those of WT (Figure 7). We also found that the five hub genes were down-regulated as AD progressed, especially AP3B2, KIAA0513, and MAL2, which were significantly down-regulated in Braak III–IV and Braak V–VI when compared with Braak 0 (P < 0.05, 0.01, respectively, Figure 8A). β-Secretase activity and Aβ42 levels in GSE106241 were identified to be up-regulated during AD progression (Figure 8A). We found that all five hub genes were negatively associated with β-secretase activity (P < 0.0001, P = 0.001, P = 0.0004, P < 0.0001, and P = 0.0002, respectively, Figure 8B) and that AP3B2 and KIAA0513 were negatively associated with Aβ42 levels (P = 0.019, 0.032, respectively, Figure 8C). Next, we tested the differential expressions of the five hub genes in the two AD GEO datasets from the blood (data not shown; Sood et al., 2015) and found that KIAA0513 was significantly up-regulated in MCI and AD samples when compared with CN samples (P < 0.05, 0.01, 0.0001, respectively, Figure 9A). We also found that KIAA0513 had the ability to differentiate MCI and AD from CN in the two datasets (Figure 9B). In GSE63060, the area under the curve (AUC) for differentiating MCI and CN samples is 0.69 [95% confidence interval (CI) = 0.61–0.77], and AUC for AD and CN samples is 0.63 (95% CI = 0.56–0.70). In GSE63061, AUC for MCI and CN is 0.62 (95% CI = 0.55–0.69), and AUC for AD and CN is 0.58 (95% CI = 0.51–0.65). Furthermore, KIAA0513 was found to be enriched in neurons of healthy human brains, as determined using an online database AlzData (Xu et al., 2018; Supplementary Figure 8)4.
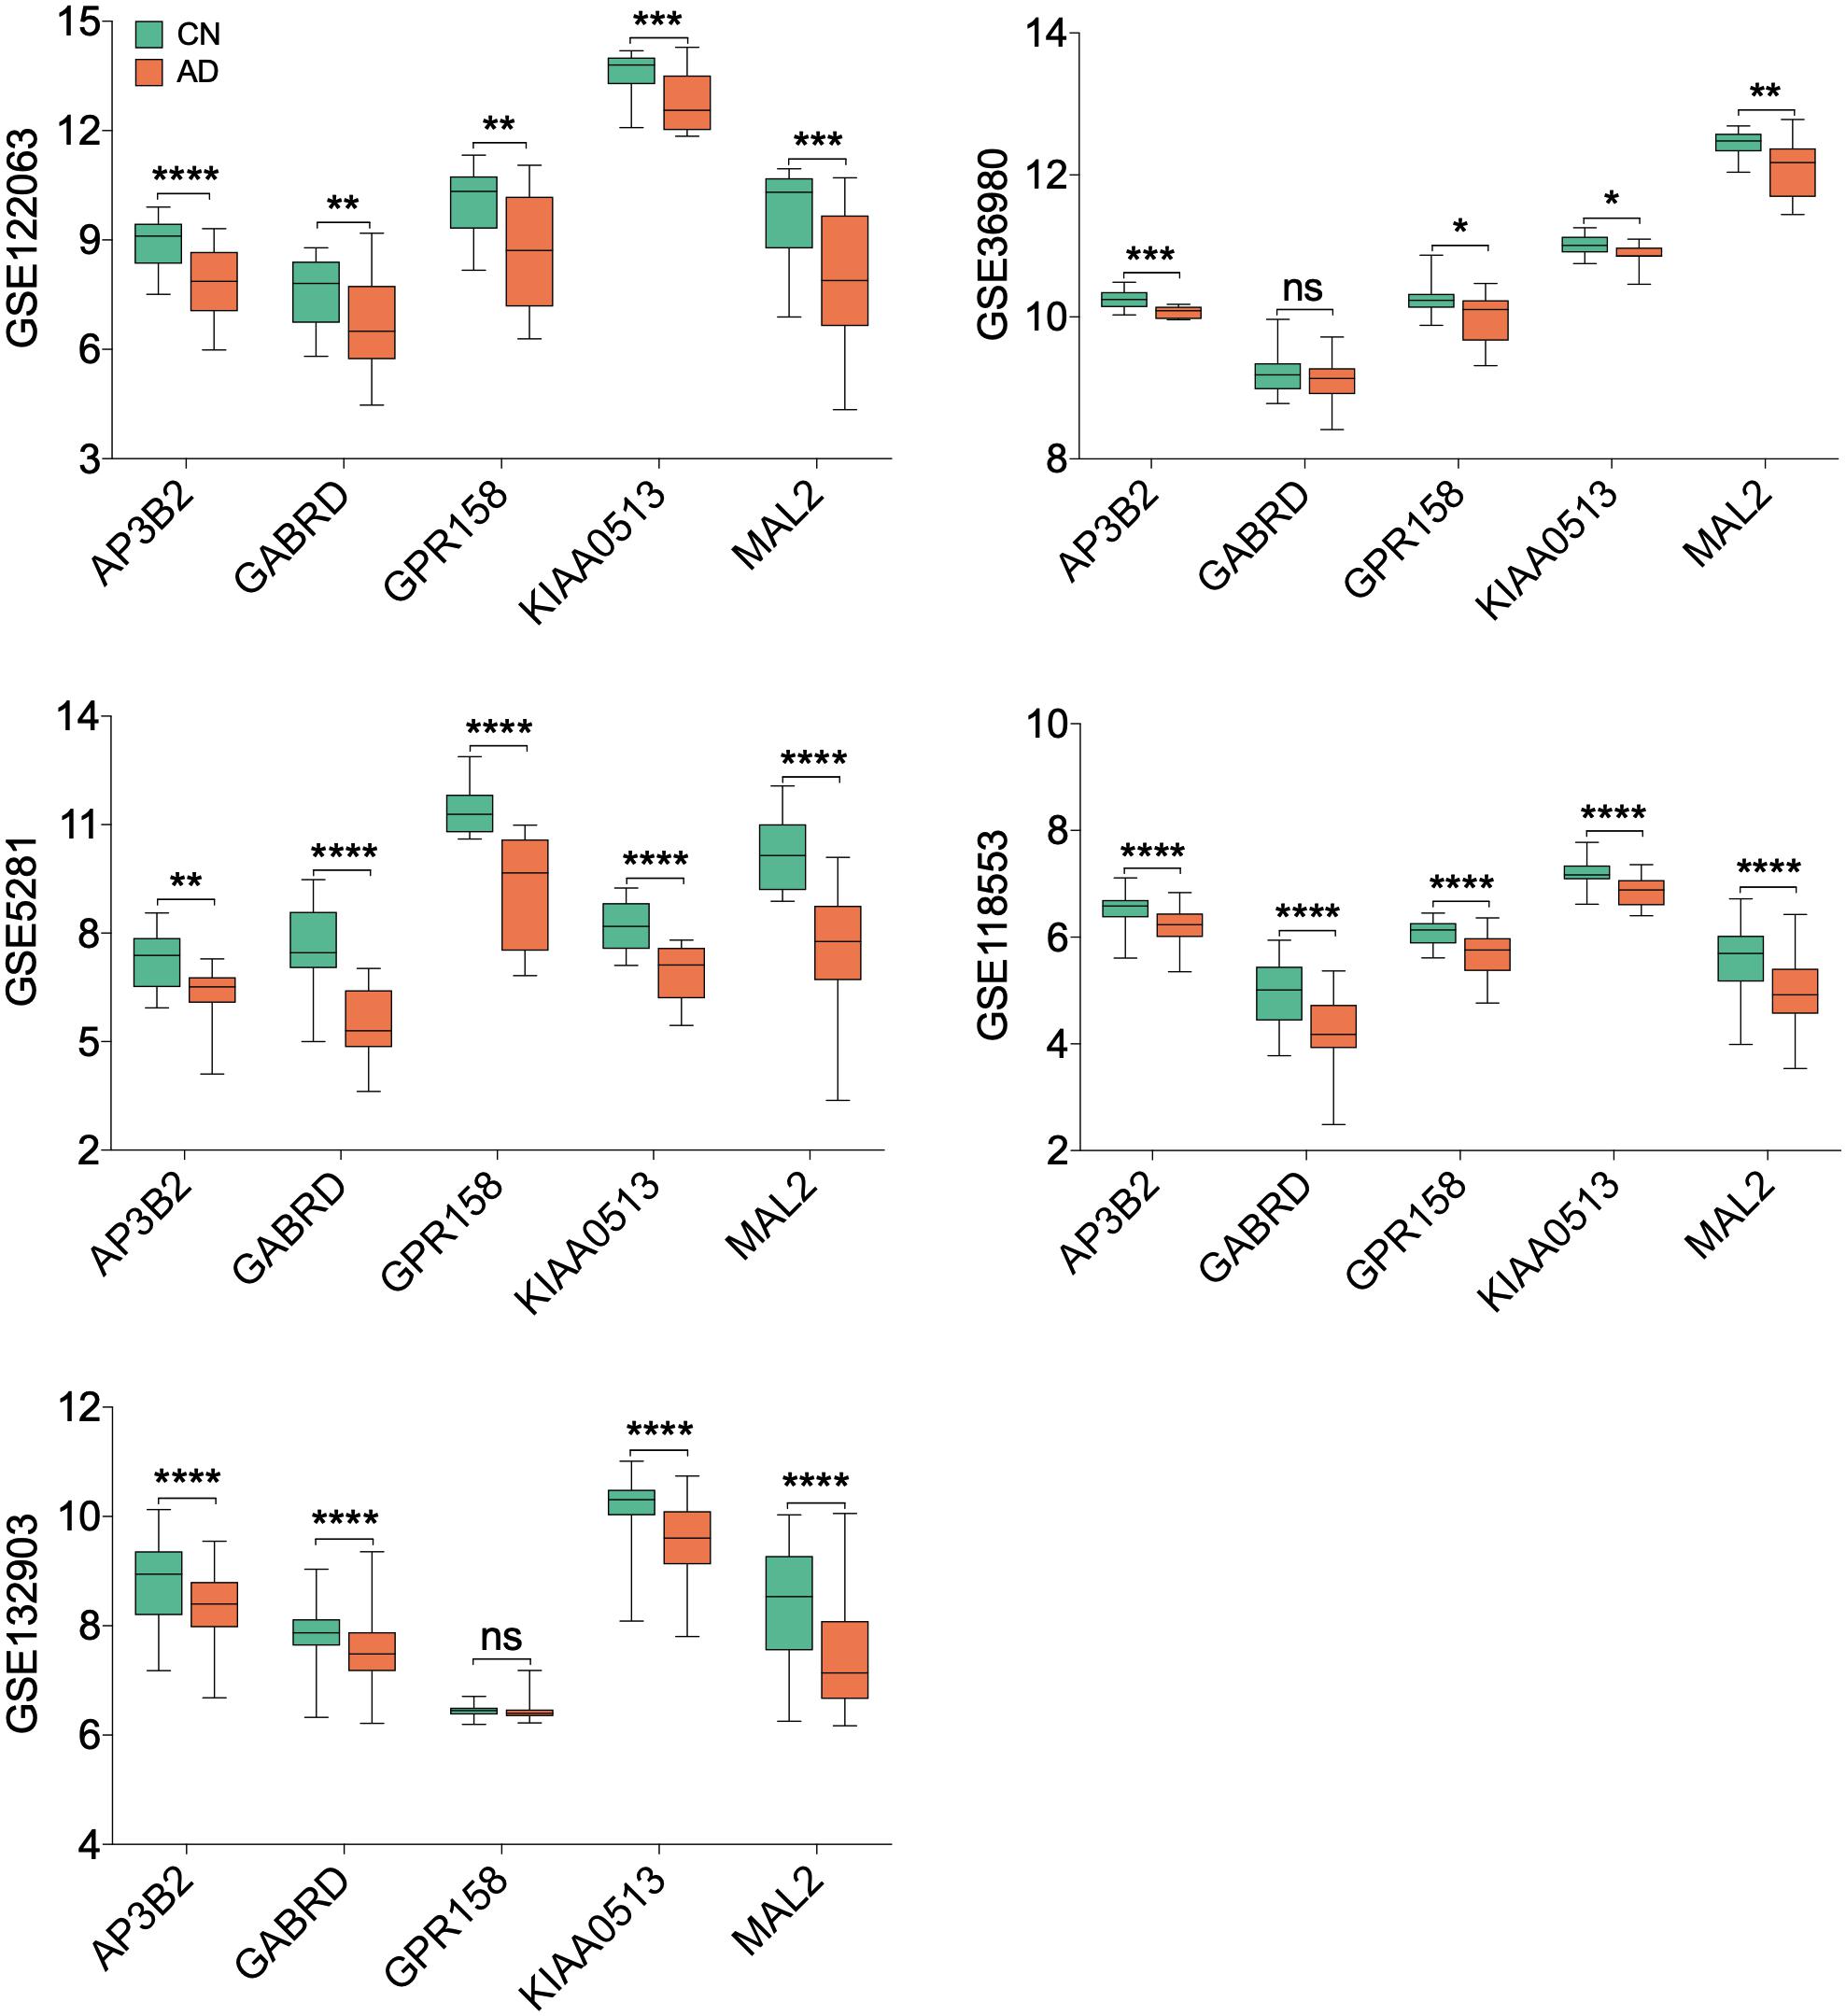
Figure 6. Expression of five hub genes in the temporal cortex. Only hub genes that have been little characterized to be associated with Alzheimer disease (AD) are listed. The green box indicates the cognitively normal group, and the orange box indicates the AD group. T-testing was performed to compare the means of two groups. *P < 0.05; **P < 0.01; ***P < 0.001; ****P < 0.0001. AD, Alzheimer disease; CN, cognitively normal; ns, no significance.
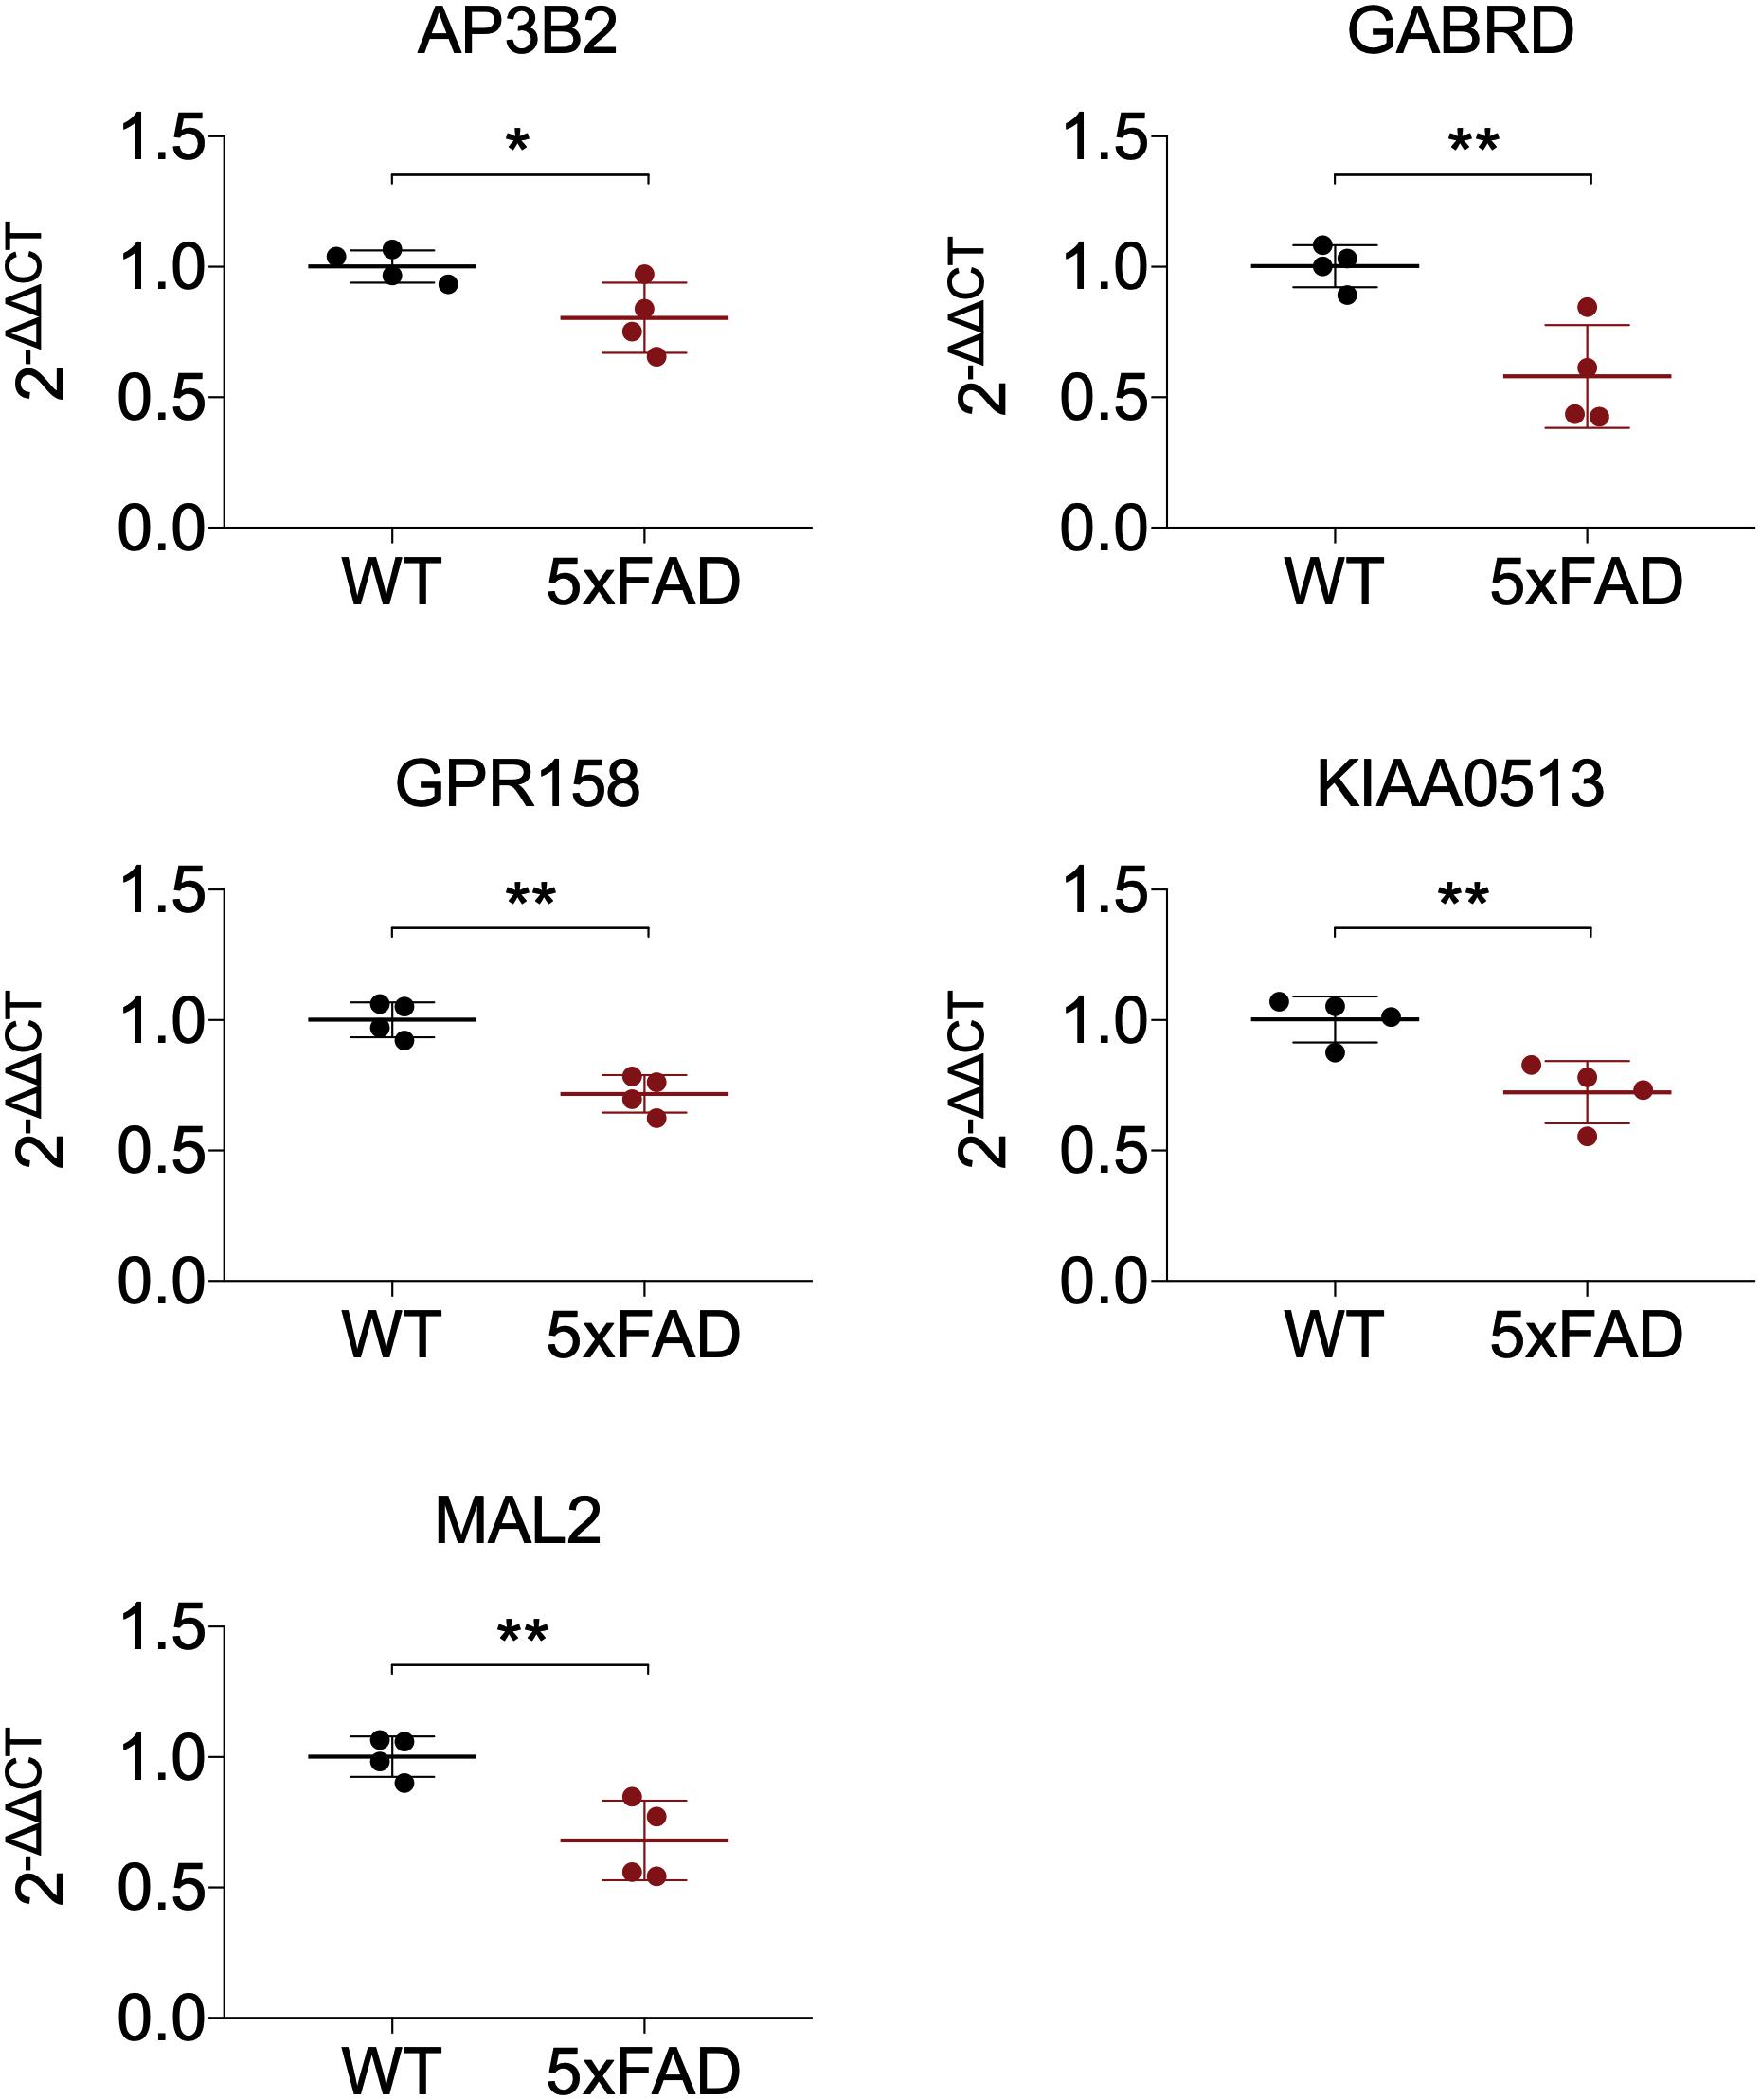
Figure 7. Expression of five hub genes in cortex of 5xFAD mice. The results were presented as mean ± standard deviation (t-testing; n = 4 in each group). *P < 0.05; **P < 0.01. WT, wild type.
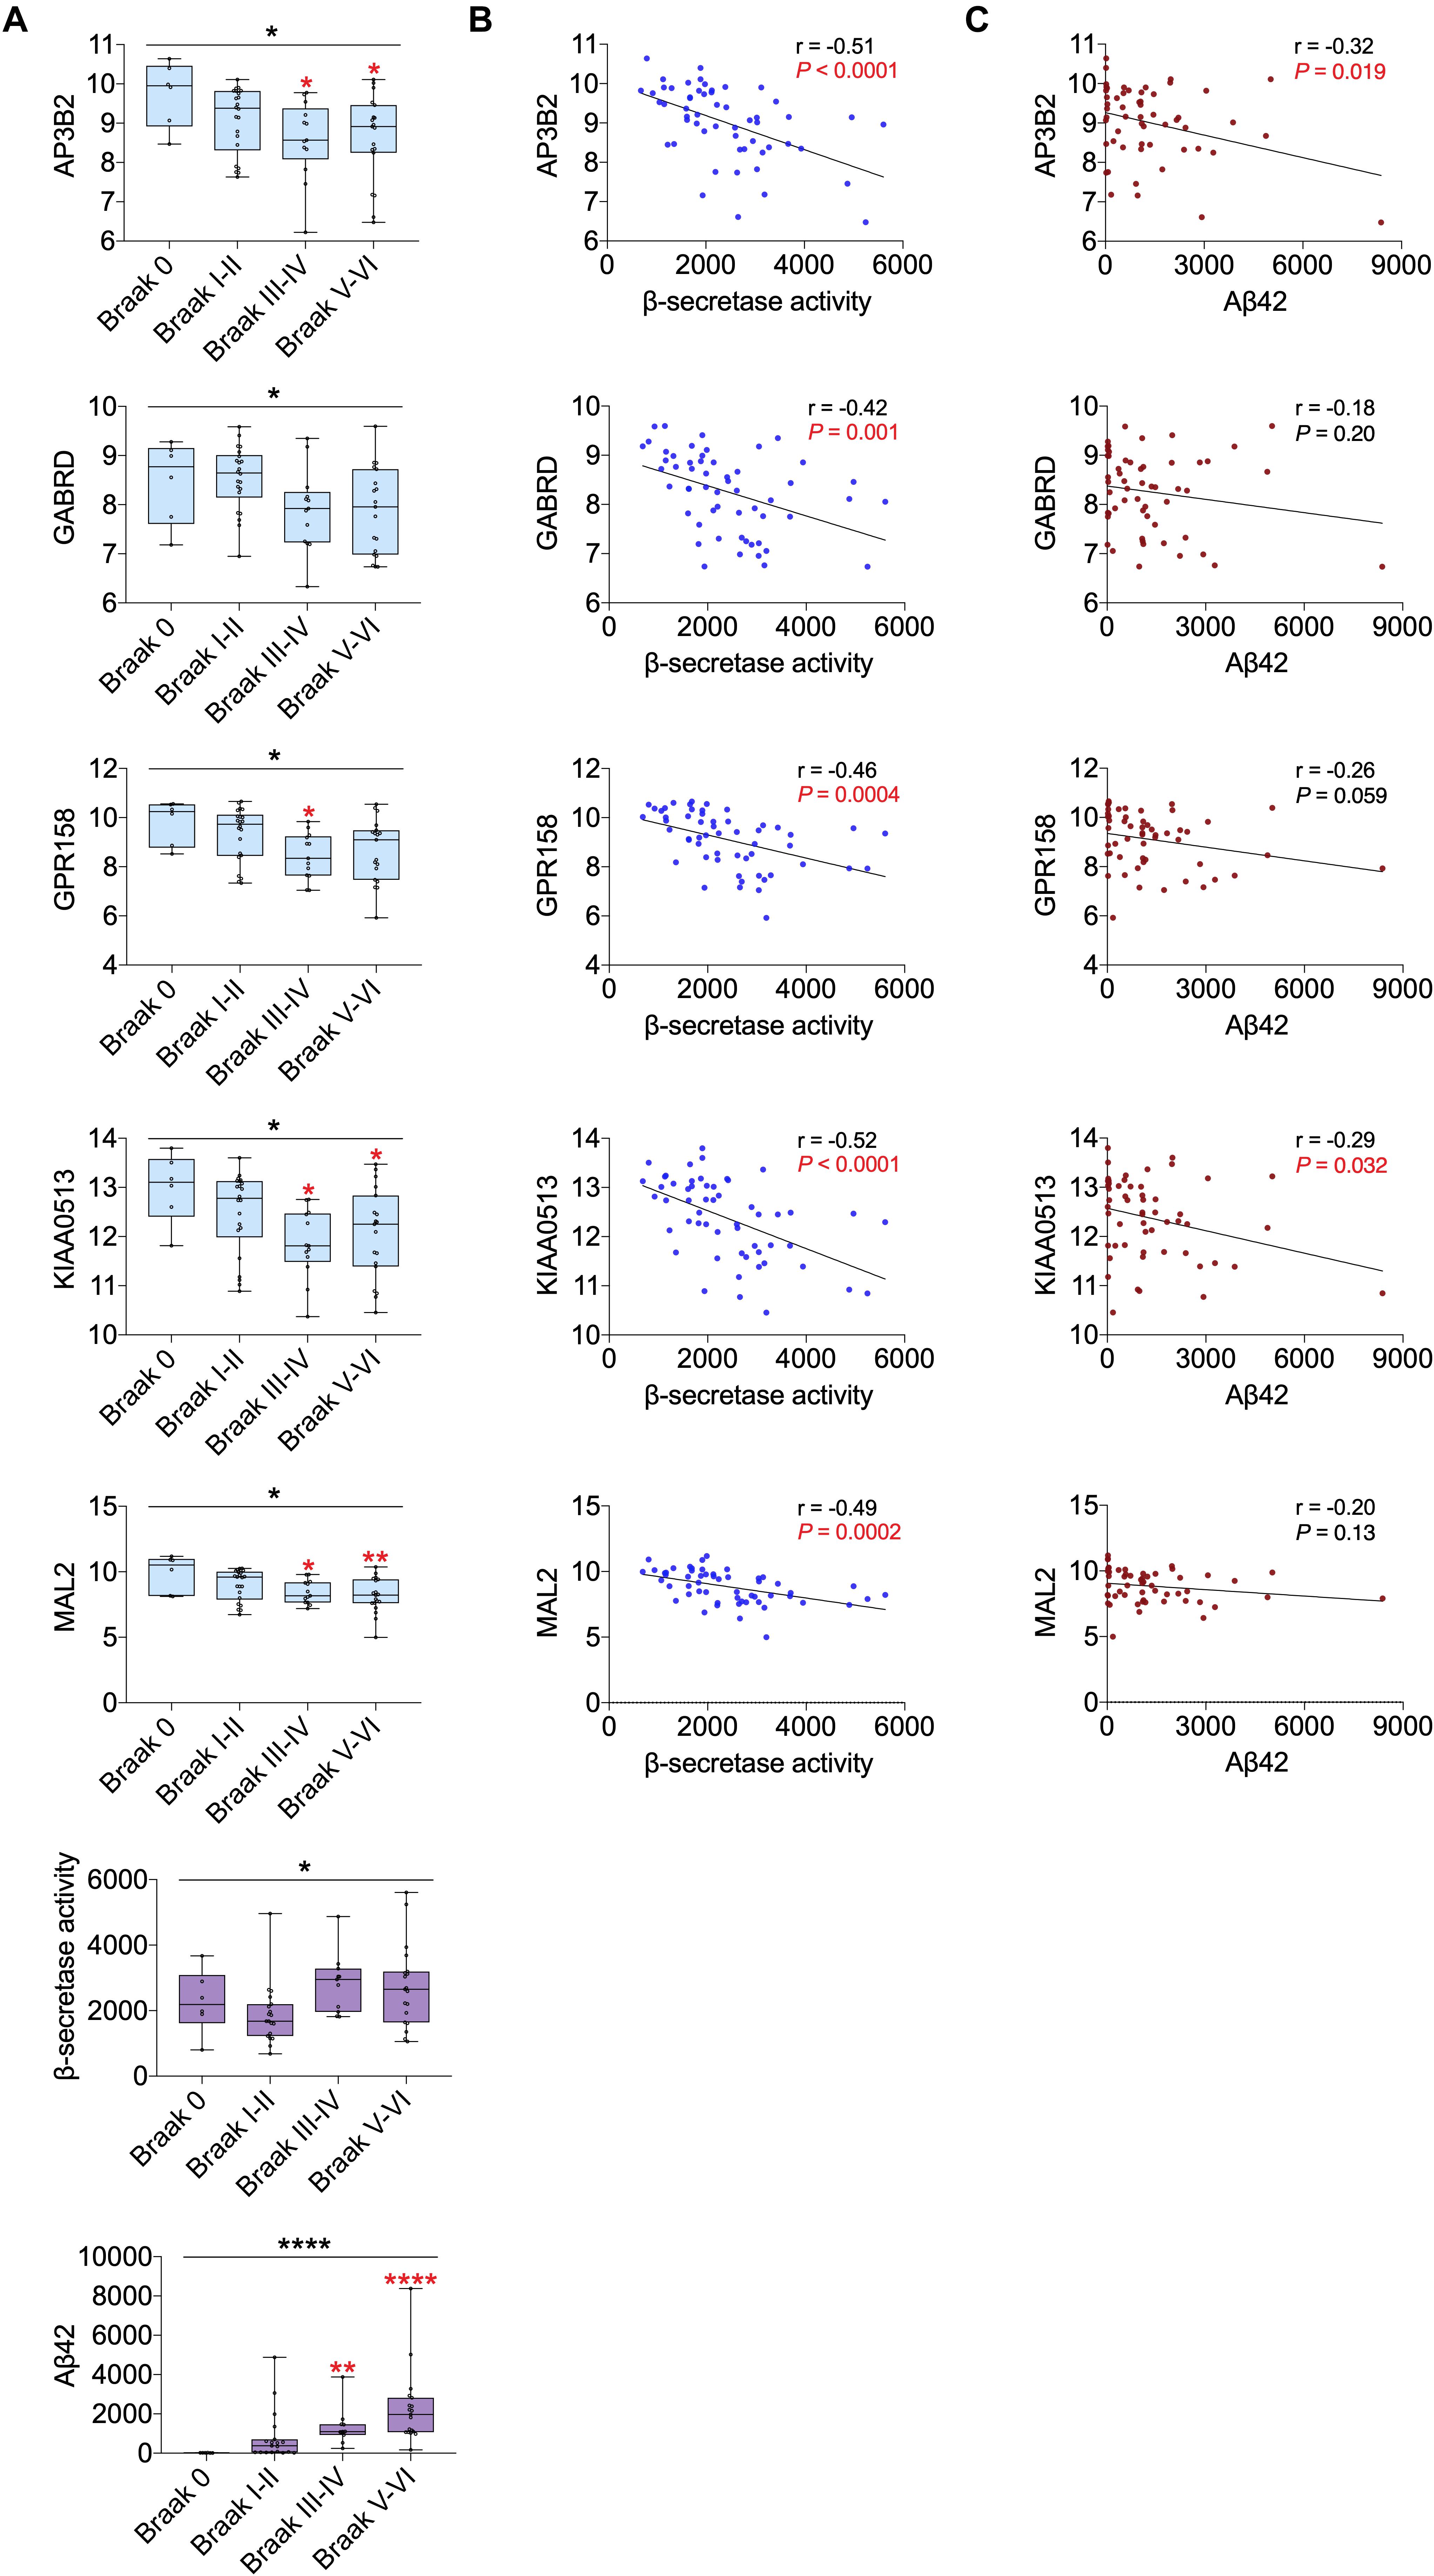
Figure 8. Correlation of five hub genes with β-secretase activity and Aβ42 levels using GSE106241. (A) The five hub gene expression, β-secretase activity, and Aβ42 levels in different Braak stages. Red asterisks indicate significant vs. Braak 0 groups. (B) Correlation between five hub genes and β-secretase activity. (C) Correlation between five hub genes and Aβ42 levels. For Panels B and C, P values in red are significant (P < 0.05). *P < 0.05; **P < 0.01; ****P < 0.0001. AD, Alzheimer disease; CN, cognitively normal.
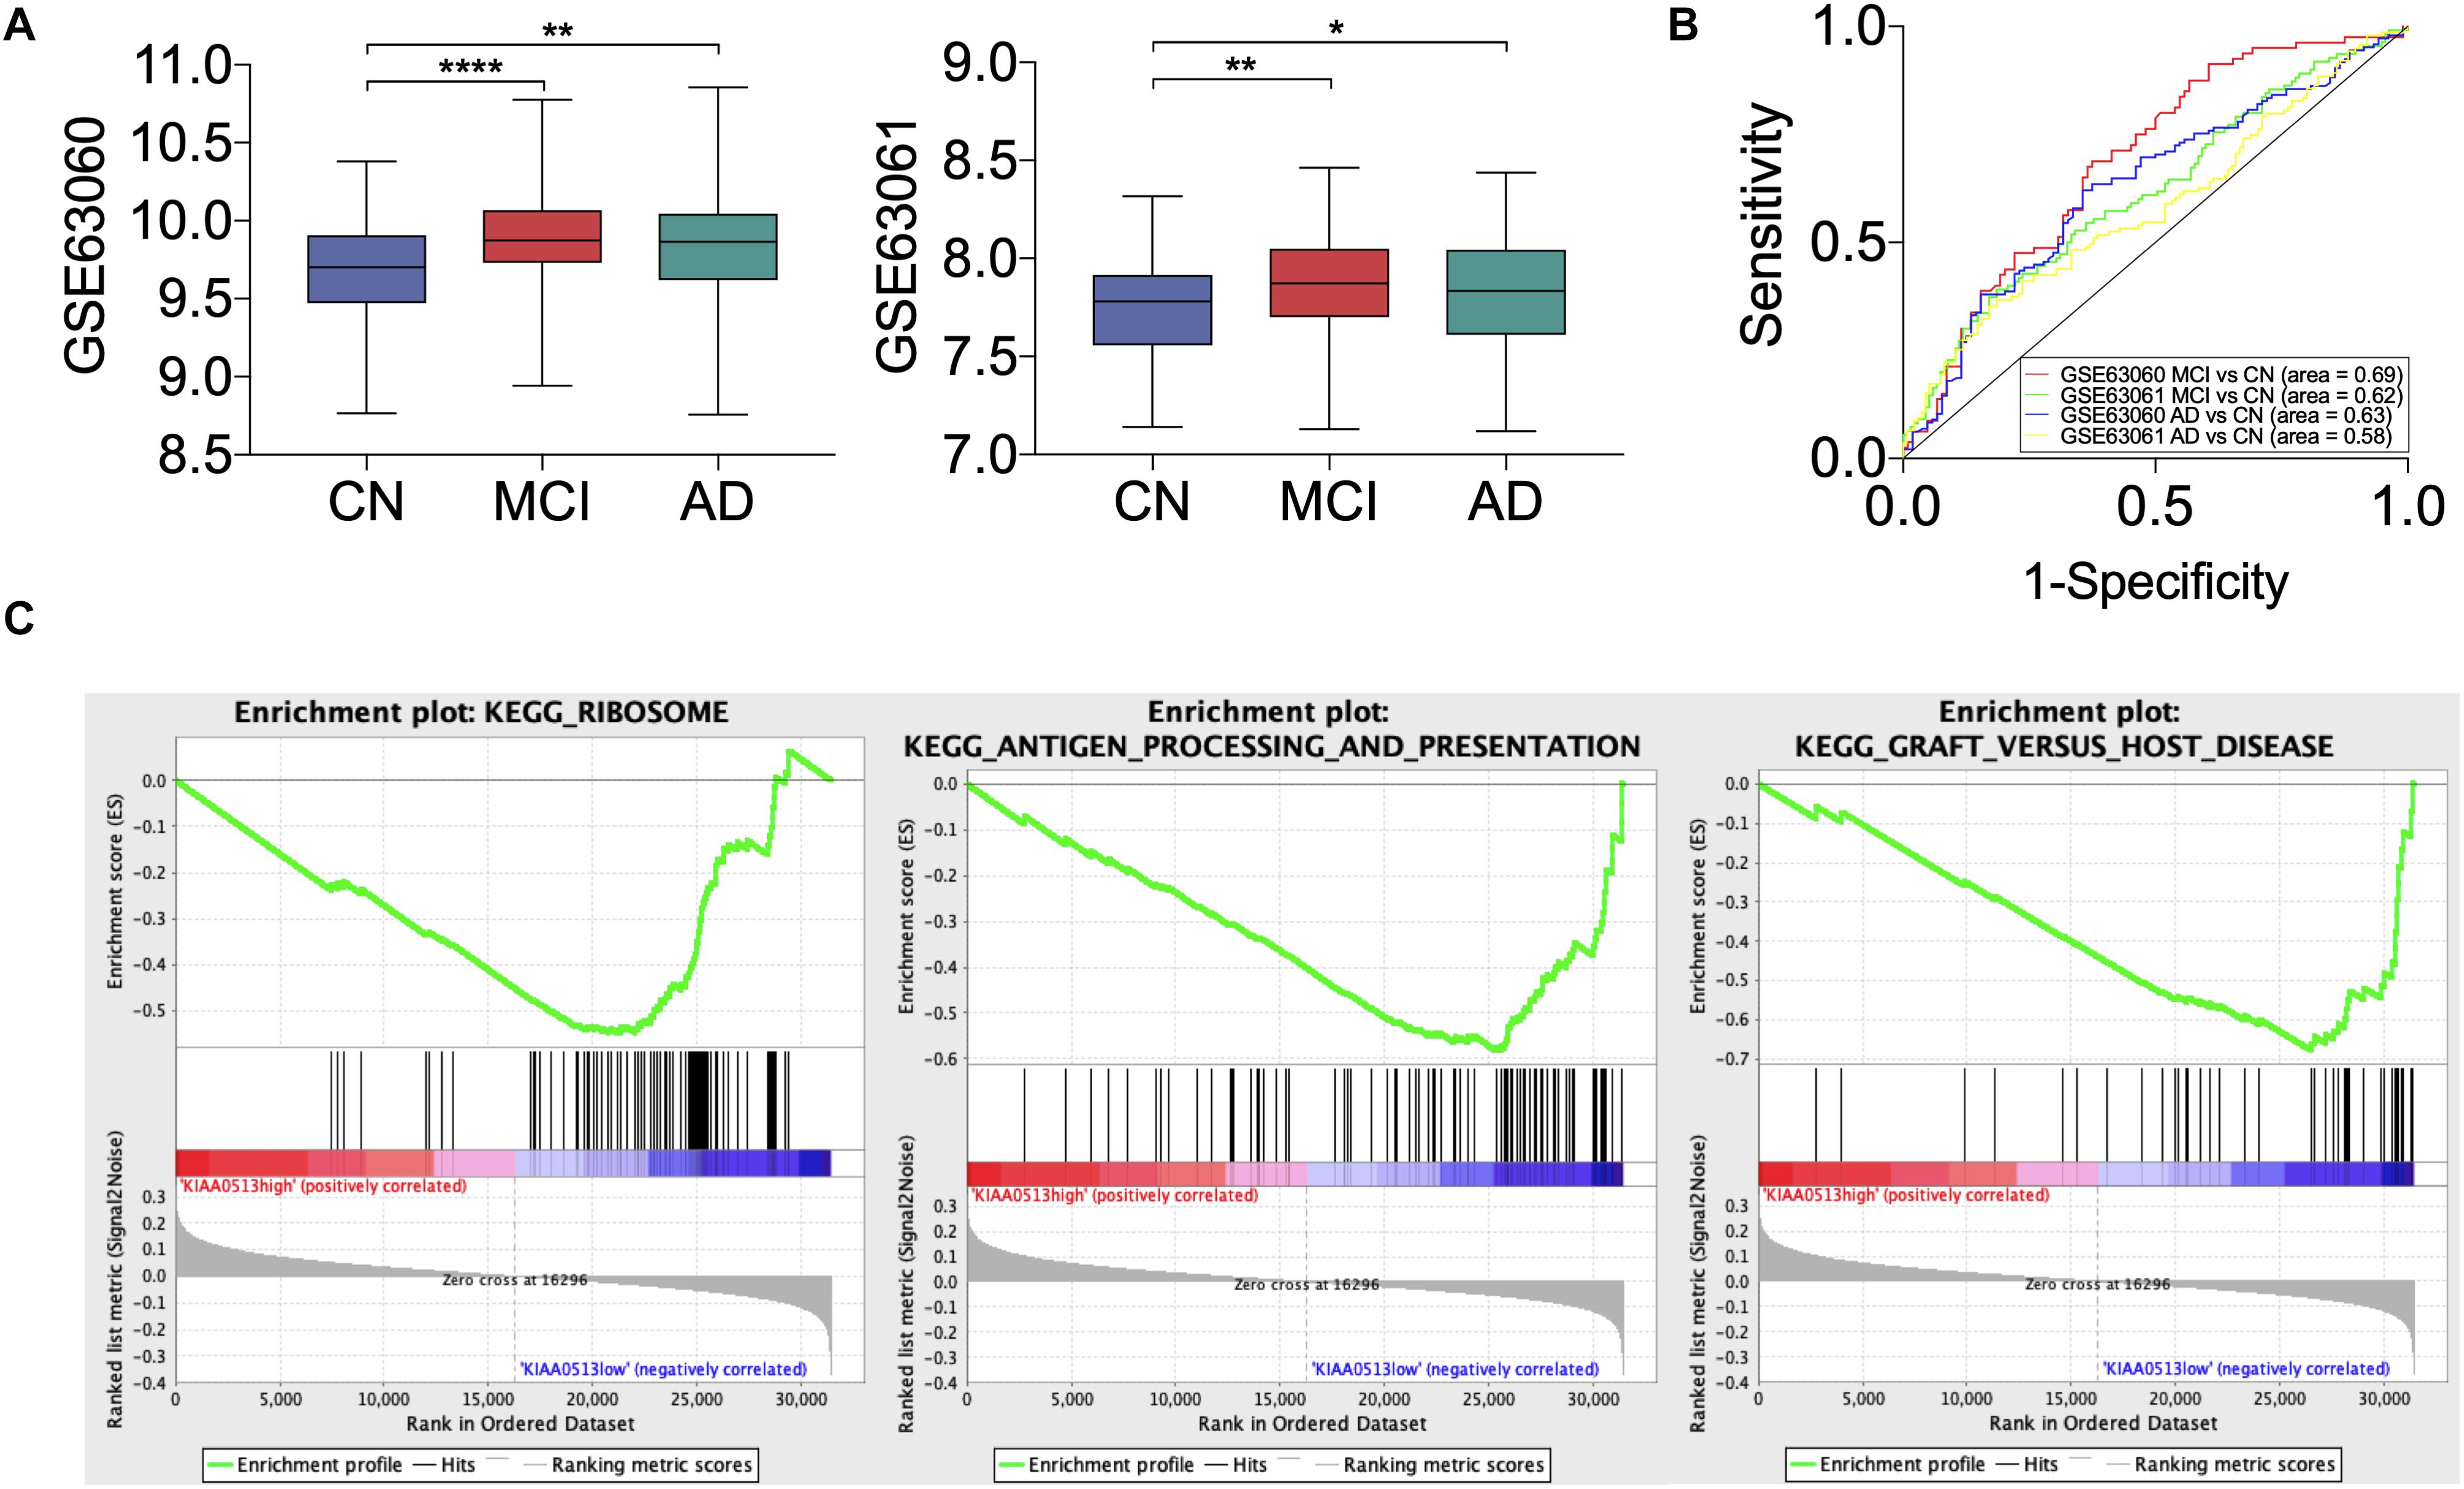
Figure 9. Disease-predicting ability and Gene Set Enrichment Analysis (GSEA) of KIAA0513. (A) The expression of KIAA0513 in two blood GEO datasets, GSE63060 and GSE63061. (B) Receiver operating characteristic (ROC) curve of KIAA0513 for predicting AD and MCI. (C) The top three GSEA terms, according to normalized enrichment scores in the low-expression group of KIAA0513. *P < 0.05; **P < 0.01; ****P < 0.0001. AD, Alzheimer disease; CN, cognitively normal; MCI, mild cognitive impairment.
GSEA Reveals Potential Biological Functions of Hub Genes
We conducted GSEA of the five little-studied hub genes in the expression data of GSE118553. AD samples in GSE118553 were divided into a “high-expression group” and a “low-expression group.” We acquired 17, 9, 1, 7, and 33 significant gene sets enriched in the expression groups of AP3B2, GABRD, GPR158, KIAA0513, and MAL2, respectively (Supplementary Table 4). According to normalized enrichment scores, genes in the low-expressed KIAA0513 group were mostly related to ribosome function, antigen processing and presentation, and graft-vs.-host disease (Figure 9C).
Discussion
The current study incorporated gene expression data extracted from the temporal cortex in three GEO datasets for combined analysis and identified a key module and hub genes associated with AD via WGCNA. We believe that this is the first study to integrate combined analysis and WGCNA to identify potential hub genes as candidate biomarkers or therapeutic targets for AD using temporal cortex datasets. According to GO and KEGG analyses, the DEGs identified by combined analysis were mostly enriched in synapse function, and genes from the key module were mostly related to learning and memory, which are closely correlated with AD onset. Among these DEGs, we identified some robust genes that played vital roles in AD pathogenesis, such as SERPINA3 (Kamboh et al., 2006), CD163 (Pey et al., 2014), and SST (Duron et al., 2018; Solarski et al., 2018).
We also found 19 down-regulated hub genes. Some of these genes and their encoded proteins have been implicated in AD proceeding. For example, it was reported that aberrant Ca2+/calmodulin-dependent protein kinase kinase 2 (CaMKK2) may lead to the interference of iron homeostasis in the brain of AD. Also, a loss of calsyntenin-1 (CLSTN1) induced alterations to amyloid precursor protein (APP) processing (Vagnoni et al., 2012), and neuronal pentraxin 1 (NPTX1) was implicated in synaptic function dysregulation during AD progression (Cummings et al., 2017). Among these 19 hub genes, we selected five that have been little studied in AD, namely, AP3B2, GABRD, GPR158, KIAA0513, and MAL2, in order to explore their potential functions. Results of qRT-PCR revealed their down-regulation in 8-month 5xFAD mice, and reference mining suggested that these genes are involved in synaptic functions. AP3B2 encodes adaptor-related protein complex 3 subunit β2 (AP3B2) that composes the neuronal isoform of adaptor-related protein complex 3 (AP-3 complex), which is involved in the sorting of synaptic vesicle proteins (Newell-Litwa et al., 2009). It was reported that AP3B2-knockout mouse exhibited neurobehavioral abnormalities (Anazi et al., 2017). GABRD encodes the delta subunit of γ-aminobutyric acid type A (GABA-A) receptor, named GABRD, which was necessary for synaptic plasticity in the hippocampi of mouse models (Whissell et al., 2016). GPR158 encodes G protein–coupled receptor 158 (GPR158), which was found to be important in synaptic modulation, especially in the hippocampus (Khrimian et al., 2017; Condomitti et al., 2018; Sutton et al., 2018; Cetereisi et al., 2019). KIAA0513 encodes the protein KIAA0513, which was assumed to participate in neuroplasticity and apoptosis (Lauriat et al., 2006). MAL2 encodes a multispan transmembrane protein belonging to the myelin and lymphocyte (MAL) proteolipid family named MAL2, which was shown to be necessary as a membrane constituent of synaptic vesicles (Gronborg et al., 2010). We determined that all five hub genes were not only significantly down-regulated as AD progressed, but also in negative correlation with β-secretase activity, indicating their strong involvement existed during AD proceeding.
We also explored the diagnostic values of these five hub genes. Intriguingly, expression of KIAA0513 was found to have a negative correlation with Aβ42 levels in the temporal cortex of AD samples and was able to distinguish MCI and AD samples from CN samples in the blood, according to ROC curves. These findings indicate that KIAA0513 could be an interesting target for further exploration. Further investigation of KIAA0513 revealed that it was shown to be enriched in neurons of normal human brains, suggesting that low expression level of this gene might reflect the pathological condition of the brains. Furthermore, GSEA indicated that the low-expression group of this gene was related to immune function during AD progression. In addition, its encoded protein KIAA0513 was found to potentially interact with kidney and brain expressed protein (KIBRA) in vitro, a cytoplasmic phosphoprotein exerting neuroprotective effects in AD (Lauriat et al., 2006; Song et al., 2019a). KIBRA was reported to be involved in exosome secretion and synaptic plasticity (Tracy et al., 2016; Song et al., 2019b), suggesting that KIAA0513 might participate in these biological functions. Because of its involvement in immune function, exosome secretion, and synaptic plasticity, a low level of expression of KIAA0513 in neurons may cause synaptic dysfunction and neuronal apoptosis during AD progression. Based on these findings, KIAA0513 could be a promising biomarker for AD diagnosis, as well as a potential target for AD treatment.
Previous microarray analyses used for combined analysis in the present study had identified genes that were involved in cellular physiological process (Liang et al., 2008a), energy metabolism (Liang et al., 2008b), gliosis (Hokama et al., 2014), and oxidative phosphorylation (McKay et al., 2019). However, after combining the three datasets (total: 54AD, 53CN), we obtained genes that mainly participated in synaptic functions, which is consistent with the results of datasets having similar or larger sample sizes (Patel et al., 2019; Piras et al., 2019). The accordance indicates that a large sample size for analysis may bring us closer to understand the genuine pathogenesis of a disease. In addition, when the resources are limited, a valid combined analysis could be of great help to enlarge the sample size.
Conclusion
In conclusion, after integrating combined analysis and WGCNA, we identified that AP3B2, GABRD, GPR158, KIAA0513, and MAL2, which have been little characterized previously to be associated with AD, are vulnerable to AD. Among them, KIAA0513 was found to be a potential biomarker for early diagnosis of AD and potentially even a therapeutic target. Further research is needed to validate further the roles of these hub genes in AD pathogenesis.
Data Availability Statement
The datasets generated for this study can be found in the online repositories. The names of the repository/repositories and accession number(s) can be found in the article/Supplementary Material.
Ethics Statement
The animal study was reviewed and approved by the Ethics Committee of Capital Medical University.
Author Contributions
JJ and MZ: study design. MZ and FL: data collection and analysis. MZ and LJ: experiment conducting, literature search, and article writing. JJ, MZ, LJ, and FL: article revision. All authors contributed to the article and approved the submitted version.
Funding
This study was supported by the Key Project of the National Natural Science Foundation of China (81530036); the National Key Scientific Instrument and Equipment Development Project (31627803); the Mission Program of Beijing Municipal Administration of Hospitals (SML20150801); the Beijing Scholars Program; the Beijing Brain Initiative from Beijing Municipal Science & Technology Commission (Z161100000216137); the Project for Outstanding Doctor with Combined Ability of Western and Chinese Medicine; and the Beijing Municipal Commission of Health and Family Planning (PXM2019_026283_000003).
Conflict of Interest
The authors declare that the research was conducted in the absence of any commercial or financial relationships that could be construed as a potential conflict of interest.
Acknowledgments
We thank those who helped us and shared their laboratory or reagents with us during the COVID-19 outbreak. They are: Yifeng Du, Tingting Hou, Fangfang Zhu, and Yuan Lu from Shandong Provincial Hospital, Cheeloo College of Medicine, Shandong University, Jinan, China; Yicheng Lin, Juanjuan Du, and Chunlin Yang from The First Affiliated Hospital of Shandong First Medical University, Jinan, China; Heng Zhang from Xuanwu Hospital, Capital Medical University, National Clinical Research Center for Geriatric Diseases, Beijing, China.
Supplementary Material
The Supplementary Material for this article can be found online at: https://www.frontiersin.org/articles/10.3389/fgene.2020.00981/full#supplementary-material
Footnotes
- ^ https://www.ncbi.nlm.nih.gov/geo/
- ^ https://cytoscape.org
- ^ https://www.graphpad.com
- ^ http://www.alzdata.org/single_RNAseq.php
References
Anazi, S., Maddirevula, S., Faqeih, E., Alsedairy, H., Alzahrani, F., Shamseldin, H. E., et al. (2017). Clinical genomics expands the morbid genome of intellectual disability and offers a high diagnostic yield. Mol. Psychiatry 22, 615–624. doi: 10.1038/mp.2016.113
Campion, D., Charbonnier, C., and Nicolas, G. (2019). SORL1 genetic variants and Alzheimer disease risk: a literature review and meta-analysis of sequencing data. Acta Neuropathol. 138, 173–186. doi: 10.1007/s00401-019-01991-4
Cetereisi, D., Kramvis, I., Gebuis, T., Van Der Loo, R. J., Gouwenberg, Y., Mansvelder, H. D., et al. (2019). Gpr158 deficiency impacts hippocampal CA1 neuronal excitability, dendritic architecture, and affects spatial learning. Front. Cell Neurosci. 13:465. doi: 10.3389/fncel.2019.00465
Chuang, Y. H., Paul, K. C., Bronstein, J. M., Bordelon, Y., Horvath, S., and Ritz, B. (2017). Parkinson’s disease is associated with DNA methylation levels in human blood and saliva. Genome Med. 9:76. doi: 10.1186/s13073-017-0466-5
Condomitti, G., Wierda, K. D., Schroeder, A., Rubio, S. E., Vennekens, K. M., Orlandi, C., et al. (2018). An input-specific orphan receptor GPR158-HSPG interaction organizes hippocampal mossy Fiber-CA3 synapses. Neuron 100, 201.e9–215.e9. doi: 10.1016/j.neuron.2018.08.038
Cummings, D. M., Benway, T. A., Ho, H., Tedoldi, A., Fernandes Freitas, M. M., Shahab, L., et al. (2017). Neuronal and peripheral pentraxins modify glutamate release and may interact in blood-brain barrier failure. Cereb. Cortex 27, 3437–3448. doi: 10.1093/cercor/bhx046
Ding, M., Li, F., Wang, B., Chi, G., and Liu, H. (2019). A comprehensive analysis of WGCNA and serum metabolomics manifests the lung cancer-associated disordered glucose metabolism. J. Cell Biochem. 120, 10855–10863. doi: 10.1002/jcb.28377
Duron, E., Vidal, J. S., Grousselle, D., Gabelle, A., Lehmann, S., Pasquier, F., et al. (2018). Somatostatin and neuropeptide Y in cerebrospinal fluid: correlations with amyloid peptides abeta1-42 and tau proteins in elderly patients with mild cognitive impairment. Front. Aging Neurosci. 10:297. doi: 10.3389/fnagi.2018.00297
Garcia-Ayllon, M. S., Small, D. H., Avila, J., and Saez-Valero, J. (2011). Revisiting the role of acetylcholinesterase in Alzheimer’s Disease: cross-talk with p-tau and beta-amyloid. Front. Mol. Neurosci. 4:22. doi: 10.3389/fnmol.2011.00022
Gronborg, M., Pavlos, N. J., Brunk, I., Chua, J. J., Munster-Wandowski, A., Riedel, D., et al. (2010). Quantitative comparison of glutamatergic and GABAergic synaptic vesicles unveils selectivity for few proteins including MAL2, a novel synaptic vesicle protein. J. Neurosci. 30, 2–12. doi: 10.1523/jneurosci.4074-09.2010
Guo, X., Tang, P., Chen, L., Liu, P., Hou, C., Zhang, X., et al. (2017). Amyloid beta-induced redistribution of transcriptional factor eb and lysosomal dysfunction in primary microglial cells. Front. Aging Neurosci. 9:228. doi: 10.3389/fnagi.2017.00228
Hokama, M., Oka, S., Leon, J., Ninomiya, T., Honda, H., Sasaki, K., et al. (2014). Altered expression of diabetes-related genes in Alzheimer’s disease brains: the Hisayama study. Cereb. Cortex 24, 2476–2488. doi: 10.1093/cercor/bht101
Hu, Y. S., Xin, J., Hu, Y., Zhang, L., and Wang, J. (2017). Analyzing the genes related to Alzheimer’s disease via a network and pathway-based approach. Alzheimers Res. Ther. 9:29. doi: 10.1186/s13195-017-0252-z
Jia, L., Fu, Y., Shen, L., Zhang, H., Zhu, M., Qiu, Q., et al. (2020). PSEN1, PSEN2, and APP mutations in 404 Chinese pedigrees with familial Alzheimer’s disease. Alzheimers Dement. 16, 178–191. doi: 10.1002/alz.12005
Johnson, W. E., Li, C., and Rabinovic, A. (2007). Adjusting batch effects in microarray expression data using empirical Bayes methods. Biostatistics 8, 118–127. doi: 10.1093/biostatistics/kxj037
Kamboh, M. I., Minster, R. L., Kenney, M., Ozturk, A., Desai, P. P., Kammerer, C. M., et al. (2006). Alpha-1-antichymotrypsin (ACT or SERPINA3) polymorphism may affect age-at-onset and disease duration of Alzheimer’s disease. Neurobiol. Aging 27, 1435–1439. doi: 10.1016/j.neurobiolaging.2005.07.015
Khrimian, L., Obri, A., Ramos-Brossier, M., Rousseaud, A., Moriceau, S., Nicot, A. S., et al. (2017). Gpr158 mediates osteocalcin’s regulation of cognition. J. Exp. Med. 214, 2859–2873. doi: 10.1084/jem.20171320
Kolde, R. (2019). pheatmap: Pretty Heatmaps. Avaliable at: https://cran.r-project.org/web/packages/pheatmap/index.html (accessed April 01, 2019).
Kunkle, B. W., Grenier-Boley, B., Sims, R., Bis, J. C., Damotte, V., Naj, A. C., et al. (2019). Genetic meta-analysis of diagnosed Alzheimer’s disease identifies new risk loci and implicates Abeta, tau, immunity and lipid processing. Nat. Genet. 51, 414–430. doi: 10.1038/s41588-019-0358-2
Langfelder, P., and Horvath, S. (2008). WGCNA: an R package for weighted correlation network analysis. BMC Bioinformatics 9:559. doi: 10.1186/1471-2105-9-559
Langfelder, P., and Horvath, S. (2012). Fast R functions for robust correlations and hierarchical clustering. J. Stat. Softw. 46:i11. doi: 10.18637/jss.v046.i11
Lauriat, T. L., Dracheva, S., Kremerskothen, J., Duning, K., Haroutunian, V., Buxbaum, J. D., et al. (2006). Characterization of KIAA0513, a novel signaling molecule that interacts with modulators of neuroplasticity, apoptosis, and the cytoskeleton. Brain Res. 1121, 1–11. doi: 10.1016/j.brainres.2006.08.099
Leek, J. T., Johnson, W. E., Parker, H. S., Fertig, E. J., Jaffe, A. E., Storey, J. D., et al. (2019). sva: Surrogate Variable Analysis 2019 R Package Version 3.32.1.
Liang, W. S., Dunckley, T., Beach, T. G., Grover, A., Mastroeni, D., Ramsey, K., et al. (2008a). Altered neuronal gene expression in brain regions differentially affected by Alzheimer’s disease: a reference data set. Physiol. Genomics 33, 240–256. doi: 10.1152/physiolgenomics.00242.2007
Liang, W. S., Reiman, E. M., Valla, J., Dunckley, T., Beach, T. G., Grover, A., et al. (2008b). Alzheimer’s disease is associated with reduced expression of energy metabolism genes in posterior cingulate neurons. Proc. Natl. Acad. Sci. U.S.A. 105, 4441–4446. doi: 10.1073/pnas.0709259105
Liang, W. S., Dunckley, T., Beach, T. G., Grover, A., Mastroeni, D., Walker, D. G., et al. (2007). Gene expression profiles in anatomically and functionally distinct regions of the normal aged human brain. Physiol. Genomics 28, 311–322. doi: 10.1152/physiolgenomics.00208.2006
Luo, Z., Wang, W., Li, F., Songyang, Z., Feng, X., Xin, C., et al. (2019). Pan-cancer analysis identifies telomerase-associated signatures and cancer subtypes. Mol. Cancer 18:106. doi: 10.1186/s12943-019-1035-x
Marttinen, M., Paananen, J., Neme, A., Mitra, V., Takalo, M., Natunen, T., et al. (2019). A multiomic approach to characterize the temporal sequence in Alzheimer’s disease-related pathology. Neurobiol. Dis. 124, 454–468. doi: 10.1016/j.nbd.2018.12.009
McKay, E. C., Beck, J. S., Khoo, S. K., Dykema, K. J., Cottingham, S. L., Winn, M. E., et al. (2019). Peri-infarct upregulation of the oxytocin receptor in vascular dementia. J. Neuropathol. Exp. Neurol. 78, 436–452. doi: 10.1093/jnen/nlz023
Mootha, V. K., Lindgren, C. M., Eriksson, K. F., Subramanian, A., Sihag, S., Lehar, J., et al. (2003). PGC-1alpha-responsive genes involved in oxidative phosphorylation are coordinately downregulated in human diabetes. Nat. Genet. 34, 267–273. doi: 10.1038/ng1180
Neuner, S. M., Tcw, J., and Goate, A. M. (2020). Genetic architecture of Alzheimer’s disease. Neurobiol. Dis. 143:104976. doi: 10.1016/j.nbd.2020.104976
Newell-Litwa, K., Salazar, G., Smith, Y., and Faundez, V. (2009). Roles of BLOC-1 and adaptor protein-3 complexes in cargo sorting to synaptic vesicles. Mol. Biol. Cell 20, 1441–1453. doi: 10.1091/mbc.e08-05-0456
Patel, H., Hodges, A. K., Curtis, C., Lee, S. H., Troakes, C., Dobson, R. J. B., et al. (2019). Transcriptomic analysis of probable asymptomatic and symptomatic alzheimer brains. Brain Behav. Immun. 80, 644–656. doi: 10.1016/j.bbi.2019.05.009
Pey, P., Pearce, R. K., Kalaitzakis, M. E., Griffin, W. S., and Gentleman, S. M. (2014). Phenotypic profile of alternative activation marker CD163 is different in Alzheimer’s and Parkinson’s disease. Acta Neuropathol. Commun. 2:21. doi: 10.1186/2051-5960-2-21
Piras, I. S., Krate, J., Delvaux, E., Nolz, J., Mastroeni, D. F., Persico, A. M., et al. (2019). Transcriptome changes in the Alzheimer’s Disease middle temporal gyrus: importance of RNA metabolism and mitochondria-associated membrane genes. J. Alzheimers Dis. 70, 691–713. doi: 10.3233/jad-181113
Radulescu, E., Jaffe, A. E., Straub, R. E., Chen, Q., Shin, J. H., Hyde, T. M., et al. (2018). Identification and prioritization of gene sets associated with schizophrenia risk by co-expression network analysis in human brain. Mol. Psychiatry 25, 791–804. doi: 10.1038/s41380-018-0304-1
Readhead, B., Haure-Mirande, J. V., Funk, C. C., Richards, M. A., Shannon, P., Haroutunian, V., et al. (2018). Multiscale analysis of independent Alzheimer’s cohorts finds disruption of molecular, genetic, and clinical networks by human herpesvirus. Neuron 99, 64.e7–82.e7. doi: 10.1016/j.neuron.2018.05.023
Ritchie, M. E., Phipson, B., Wu, D., Hu, Y., Law, C. W., Shi, W., et al. (2015). Limma powers differential expression analyses for RNA-sequencing and microarray studies. Nucleic Acids Res. 43:e47. doi: 10.1093/nar/gkv007
Serrano-Pozo, A., Frosch, M. P., Masliah, E., and Hyman, B. T. (2011). Neuropathological alterations in Alzheimer disease. Cold Spring Harb. Perspect. Med. 1:a006189. doi: 10.1101/cshperspect.a006189
Solarski, M., Wang, H., Wille, H., and Schmitt-Ulms, G. (2018). Somatostatin in Alzheimer’s disease: a new role for an old player. Prion 12, 1–8. doi: 10.1080/19336896.2017.1405207
Song, L., Tang, S., Dong, L., Han, X., Cong, J., Han, X., et al. (2019a). The neuroprotection of KIBRA in promoting neuron survival and against amyloid beta-induced Apoptosis. Front. Cell Neurosci. 13:137. doi: 10.3389/fncel.2019.00137
Song, L., Tang, S., Han, X., Jiang, Z., Dong, L., Liu, C., et al. (2019b). KIBRA controls exosome secretion via inhibiting the proteasomal degradation of Rab27a. Nat. Commun. 10:1639. doi: 10.1038/s41467-019-09720-x
Sood, S., Gallagher, I. J., Lunnon, K., Rullman, E., Keohane, A., Crossland, H., et al. (2015). A novel multi-tissue RNA diagnostic of healthy ageing relates to cognitive health status. Genome Biol. 16:185. doi: 10.1186/s13059-015-0750-x
Subramanian, A., Tamayo, P., Mootha, V. K., Mukherjee, S., Ebert, B. L., Gillette, M. A., et al. (2005). Gene set enrichment analysis: a knowledge-based approach for interpreting genome-wide expression profiles. Proc. Natl. Acad. Sci. U.S.A. 102, 15545–15550. doi: 10.1073/pnas.0506580102
Sutton, L. P., Orlandi, C., Song, C., Oh, W. C., Muntean, B. S., Xie, K., et al. (2018). Orphan receptor GPR158 controls stress-induced depression. eLife 7:e33273. doi: 10.7554/eLife.33273
Tanzi, R. E. (2012). The genetics of Alzheimer disease. Cold Spring Harb. Perspect. Med. 2:a006296. doi: 10.1101/cshperspect.a006296
Tracy, T. E., Sohn, P. D., Minami, S. S., Wang, C., Min, S. W., Li, Y., et al. (2016). Acetylated tau obstructs KIBRA-mediated signaling in synaptic plasticity and promotes tauopathy-related memory loss. Neuron 90, 245–260. doi: 10.1016/j.neuron.2016.03.005
Vagnoni, A., Perkinton, M. S., Gray, E. H., Francis, P. T., Noble, W., and Miller, C. C. (2012). Calsyntenin-1 mediates axonal transport of the amyloid precursor protein and regulates Abeta production. Hum. Mol. Genet. 21, 2845–2854. doi: 10.1093/hmg/dds109
Wall, L., Christiansen, T., and Orwant, J. (2000). Programming Perl. Newton, MA: O’Reilly Media, Inc.
Wall, L. (1994). The Perl programming language. Prentice Hall Software Series. Available online at: http://citebay.com/how-to-cite/perl/
Walter, W., Sanchez-Cabo, F., and Ricote, M. (2015). GOplot: an R package for visually combining expression data with functional analysis. Bioinformatics 31, 2912–2914. doi: 10.1093/bioinformatics/btv300
Whissell, P. D., Avramescu, S., Wang, D. S., and Orser, B. A. (2016). deltaGABAA receptors are necessary for synaptic plasticity in the hippocampus: implications for memory behavior. Anesth. Analg. 123, 1247–1252. doi: 10.1213/ane.0000000000001373
Xu, M., Zhang, D. F., Luo, R., Wu, Y., Zhou, H., Kong, L. L., et al. (2018). A systematic integrated analysis of brain expression profiles reveals YAP1 and other prioritized hub genes as important upstream regulators in Alzheimer’s disease. Alzheimers Dement. 14, 215–229. doi: 10.1016/j.jalz.2017.08.012
Xu, Y., Du, S., Marsh, J. A., Horie, K., Sato, C., Ballabio, A., et al. (2020). TFEB regulates lysosomal exocytosis of tau and its loss of function exacerbates tau pathology and spreading. Mol. Psychiatry [Epub ahead of print]. doi: 10.1038/s41380-020-0738-0
Keywords: Alzheimer disease, dementia, gene expression, hub genes, weighted gene coexpression network analysis
Citation: Zhu M, Jia L, Li F and Jia J (2020) Identification of KIAA0513 and Other Hub Genes Associated With Alzheimer Disease Using Weighted Gene Coexpression Network Analysis. Front. Genet. 11:981. doi: 10.3389/fgene.2020.00981
Received: 18 April 2020; Accepted: 03 August 2020;
Published: 28 August 2020.
Edited by:
Siu Sylvia Lee, Cornell University, United StatesReviewed by:
Erich Marquard Schwarz, Cornell University, United StatesSrinivas Ayyadevara, Central Arkansas Veterans Healthcare System Eugene J. Towbin Healthcare Center, United States
Copyright © 2020 Zhu, Jia, Li and Jia. This is an open-access article distributed under the terms of the Creative Commons Attribution License (CC BY). The use, distribution or reproduction in other forums is permitted, provided the original author(s) and the copyright owner(s) are credited and that the original publication in this journal is cited, in accordance with accepted academic practice. No use, distribution or reproduction is permitted which does not comply with these terms.
*Correspondence: Jianping Jia, jjp@ccmu.edu.cn
 Min Zhu