 Minji Kang
 Sangseon Lee
 Dohoon Lee
 Sun Kim
- 1Bioinformatics Institute, Seoul National University, Seoul, South Korea
- 2Interdisciplinary Program in Bioinformatics, Seoul National University, Seoul, South Korea
- 3Department of Computer Science and Engineering, Institute of Engineering Research, Seoul National University, Seoul, South Korea
Epigenetic gene regulation is a major control mechanism of gene expression. Most existing methods for modeling control mechanisms of gene expression use only a single epigenetic marker and very few methods are successful in modeling complex mechanisms of gene regulations using multiple epigenetic markers on transcriptional regulation. In this paper, we propose a multi-attention based deep learning model that integrates multiple markers to characterize complex gene regulation mechanisms. In experiments with 18 cell line multi-omics data, our proposed model predicted the gene expression level more accurately than the state-of-the-art model. Moreover, the model successfully revealed cell-type-specific gene expression control mechanisms. Finally, the model was used to identify genes enriched for specific cell types in terms of their functions and epigenetic regulation.
1. Introduction
Epigenetic gene regulation is a major control mechanism of gene expression. Histone modifications one of the most versatile modes of chromatin regulation among diverse epigenetic regulatory mechanisms are defined as covalent modifications of a set of specific amino acids at N-terminal tails of histone proteins. Combinations of the type of amino acids and their modifications constitute “histone codes” that are distributed across the genome and are known to regulate overall chromatin states. On the other hand, DNA methylation occurs directly at the cytosine bases of DNA and regulates gene expression in part by altering the binding affinity of most of the transcription factors. Besides the individual effect of each epigenetic modification, the complexity of epigenetic gene regulation mostly arises from the crosstalk between the different types of epigenetic modifications. For example, positive interplay between histone marks (1) H2BK120u1 and H3K4me3, and (2) H3K4me3 and H3/H4 acetylation (Zhang et al., 2015) is an example of the complex epigenetic regulation. Furthermore, some histone modifications are known to be associated with DNA methylation (Cedar and Bergman, 2009). De novo DNA methyltransferases, DNMT3A and DNMT3B, are known to physically interact with specific histone marks, H3K36me3 and H3K4me0, through their internal PWWP and ADD domain, respectively. Methyl-CpG-binding domain (MBD) proteins have been reported to “read” methylated CpG, and recruit chromatin-modifying complexes such as SWI/SNF components (Fatemi and Wade, 2006). Subtle epigenetic interactions between different types of histone modifications and DNA methylation can therefore be regarded as a major determinant of the general chromatin structure of cells that govern the accessibility of transcription factors to the chromatin.
Given the essential role of epigenetic alterations in regulating gene expression, a number of studies on modeling the regulatory effects of these epigenetic markers have been performed. However, existing modeling methods utilize only a single epigenetic marker. Some studies have investigated the role of histone marks in the context of gene regulation. DeepChrome (Singh et al., 2016) used a Convolutional Neural Network based model to model gene regulation. It was the first deep learning approach to predict the gene expression level, and it captured local characteristics of histone marks. Another study, AttentiveChrome (Singh et al., 2017), proposed a hierarchy of multiple Long Short-Term Memory modules with an attention mechanism to predict gene expression levels. AttentiveChrome predicted gene expression more accurately than DeepChrome, and it showed which histone marks or which gene loci were used, using an attention mechanism. Both studies used individual deep learning approaches to understand gene regulation but utilized histone marks only. There have also been studies to identify relationships between genome-wide DNA methylation and gene expression. Wagner et al. (2014) investigated the relationships between DNA methylation and the gene expression profile of primary fibroblast samples from 62 individuals. More recently, Zhong et al. (2019) predicted gene expression using DNA methylation in human populations, using linear regression-based methods. Recent studies investigated the relationships between mutation and gene expression. Zeng et al. (2017) used a linear regression-based model to predict gene expression with cis-SNPs. Xie et al. (2017) examined the effectiveness of a deep auto-encoder to predict the gene expression profile measured in yeast with SNP. These prior studies on gene expression prediction revealed relationships between gene expression and a single epigenetic marker of histone marks, DNA methylation, or SNP. However, these studies were not designed to model complex transcriptional control mechanisms involving the interplay of various epigenetic regulatory modules.
We therefore introduce an explainable deep learning model with a multi-attention network for epigenetic regulation mechanisms. Our model integrates multiple markers such as histone marks, DNA methylation, and transcription factors and explains the complex interactions between the molecular regulators. The attention network modules of our model allow human experts to understand the gene regulation mechanisms. Moreover, the model characterizes cell-type-specific gene regulation mechanisms for 18 cell lines, based on the weights of the Multi-Attention network. In summary, the proposed model provides a better understanding of cell-type-specific gene regulation.
2. Materials and Methods
We propose a two-step ensemble deep learning model for gene expression prediction and the architecture is illustrated in Figure 1. At the first layer of the model, separate neural networks vectorize epigenetic and transcriptional markers with different strategies, and then at the second layer, output vectors from the first layer are integrated by a Multi-Attention network. To predict gene expression, we used the same outputs previously used in DeepChrome (Singh et al., 2016) and AttentiveChrome (Singh et al., 2017). All genes are divided into highly expressed genes (HEG) and lowly expressed genes (LEG) according to their expression levels, which formulates the problem as a binary classification task.
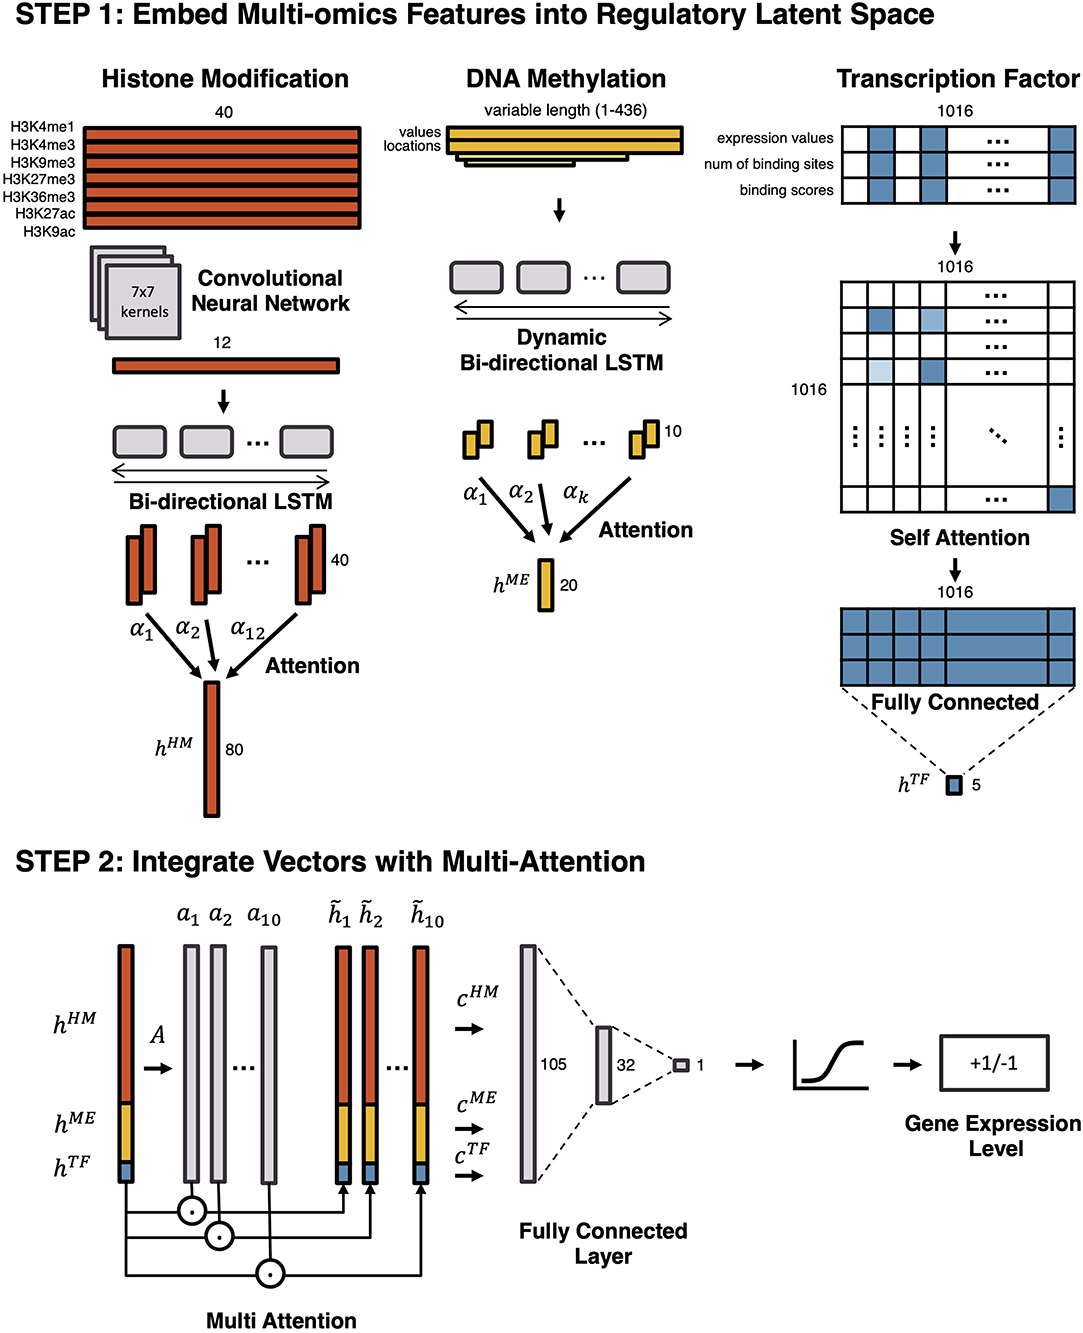
Figure 1. An overview of the proposed model. To predict gene expression level and to model the regulation mechanism, a Multi-Attention based deep learning model with regulatory latent space is designed. It consists of two steps: (1) embedding multi-omics features into a regulatory latent space, and (2) integrating latent vectors with a Multi-Attention network. In the first step, different deep learning architectures are utilized to reflect the characteristics of each omics feature. By omics-specific layers, multi-omics features are transformed into latent vectors in the regulatory latent space. In the second step, the latent vectors are integrated by a Multi-Attention network. The attention weights of multi-omics features represent their effects on the gene regulation.
To begin, separate models embed histone marks, DNA methylation, and transcription factors into a regulatory latent space. First, histone marks are embedded into the latent space by a Convolutional Neural Network (CNN) followed by a Bi-directional Long Short-Term Memory (LSTM) network with attention. Second, DNA methylation is vectorized by a Dynamic Bi-directional LSTM with attention. Lastly, a Self-Attention Network (SAN) embeds the transcription factors. After embedding features in three vectors, a Multi-Attention network combines these vectors to predict whether a gene would be highly expressed or lowly expressed. While the end-to-end model predicts the gene expression level as a whole, the Multi-Attention network determines which types of epigenetic markers are most influential for controlling gene expression and how epigenetic features interact with each other in each cell type.
We used datasets from the Roadmap Epigenomics Projects (Kundaje et al., 2015) to predict the gene expression level of 18 cell lines, for which data measuring levels of histone marks, DNA methylation, and transcription factors are available (Table 1, Supplementary Figure 1). The epigenetic and transcriptional markers near the transcription start site (TSS) mainly involve in gene expression. We therefore focused on the gene region of 4,000 base-pair (bp) around the TSS for histone markers or DNA methylation and 200 bp around the TSS for transcription factors. To implement the model, we used Pytorch, an open-source machine learning library based on Python. Implementation of our model can be found at Github (https://github.com/pptnz/deeply-learning-regulatory-latent-space).
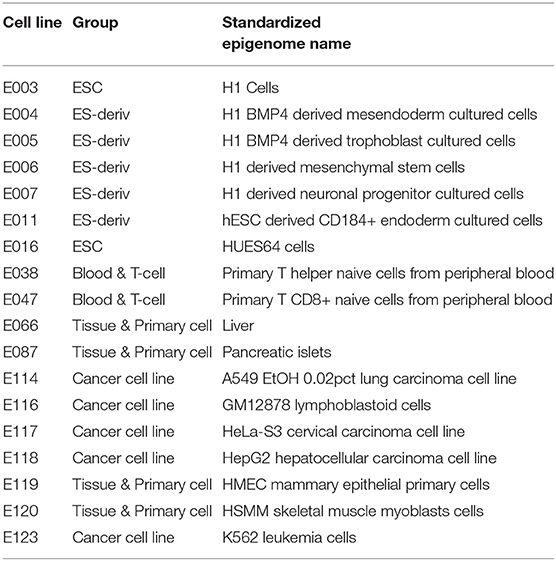
Table 1. Cell line data used in this study.
In the following sections, deep learning models for each of the epigenetic and transcriptional markers are explained.
2.1. Embedding Histone Marks
We used seven core histone marks: H3K4me1, H3K4me3, H3K9me3, H3K27me3, H3K36me3, H3K27ac, and H3K9ac. Among 31 histone marks in the Roadmap Epigenomics Projects, the seven core histone marks had been profiled and investigated the most. Each of the seven histone marks were profiled for more than 62 cell lines, whereas other histone marks were profiled for less than 24 cell lines (Supplementary Figure 2). To investigate cell-type-specific gene regulation mechanisms, we used the seven histone marks with abundant cell line data.
To vectorize the histone marks, we used CNN, followed by Bi-directional LSTM with an attention mechanism. CNN is a deep learning architecture proposed for extracting local features of various sizes in two-dimensional images (Min et al., 2016). In this model, CNN captures local patterns of the seven histone marks. RNN is a deep learning architecture with a cyclic structure, which has caught the limelight in natural language processing fields (Min et al., 2016). LSTM is one of the architectures of the Recurrent Neural Network, proposed for considering long-term dependencies (Gers et al., 2000). Unlike other RNN architectures, LSTM has a forget gate, which allows the model to forget irrelevant parts of a sequence and deal with a long sequence. In our model, LSTM captures sequential patterns. The attention mechanism reveals important gene loci.
The histone marks in a gene region of 4,000 bp around TSS are divided into 40 bins with a bin size of 100 bp. On each bin, log read counts are calculated for each histone mark, respectively. The preprocessed histone mark matrix of size 7 × 40 is fed into a CNN that consists of a convolutional layer, a batch normalization layer, and a 1D max-pooling layer. In the convolutional layer, 100 kernels of size 7 × 7 are used, so that a vector of size 1 × 34 is produced. In the max-pooling layer, a kernel with size 3 and stride 3 is used with left and right padding. Afterward, the output vector of the CNN is fed into the Bi-directional Long Short-Term Memory (LSTM) with attention, producing a hHM of size 80.
2.2. Embedding DNA Methylation
We used methylation values at all CpG sites within up/down-stream of 2,000 bp from TSS. DNA methylation is vectorized by a Dynamic Bi-directional LSTM with attention. The number of CpG sites vary for different genes. Thus, the “Dynamic” LSTM deals with the variable number of CpGs, and the “Bi-directional” LSTM considers both directions of the DNA strands. Dynamic Bi-directional LSTM produces the output vector hME of a fixed size 20.
2.3. Embedding Transcription Factors
We first selected candidate binding transcription factors (TFs) for each gene, based on prior knowledge of human transcription factors in Lambert et al. (2018), and the motif detection tool, HOMER (Heinz et al., 2010). We utilized TFs that have their binding sites within the region of 200 bp around the TSS. Based on this configuration, an input matrix for TFs is processed as a matrix of size 3 x 10¹⁶. Three rows of an input matrix represent TF expression values, the number of binding sites, and the binding scores of TFs by HOMER. One-thousand-and-sixteen columns of the matrix represent human transcription factors. Except for the candidate binding transcription factors, all columns are masked to zero.
Since the data of transcription factors are discrete rather than sequential, CNN or LSTM cannot be employed. Thus, a Self-Attention Network (SAN) is used to embed the input matrix in vector a hTF of size 5. As a result of SAN, the attention weight matrix is produced, providing vital information about relationships and interactions between transcription factors.
2.4. Integrating Latent Vectors
To integrate latent vectors, we used the Multi-Attention Block from the Multi-Attention Recurrent Network (MARN) (Zadeh et al., 2018). MARN was proposed for the comprehension of human communication with multi-modal data (language modality, vision modality, and acoustic modality). As it was designed to deal with data with different characteristics, MARN is suitable for dealing with three latent vectors from different multi-omics data.
First, all three latent vectors hHM, hME, and hTF are concatenated. The concatenated vector h is fed into a fully connected layer A. Multiple attention weights a1, a2, ..., ak are then produced, where k is the number of attentions. The k attention weights are multiplied to the concatenated vector, the vectors are produced by element-wise multiplication of the concatenation and the k attention weights as .
Finally, a fully connected layer produces the predicted labels, which represents whether a gene is highly expressed (HEG, +1) or lowly expressed (LEG, -1).
3. Results
To evaluate our proposed model, we split 18,070 genes into four-folds for each cell line. The first and second folds were used as a test and validation set, respectively, and the remaining two folds were used as a training set. Every result is averaged from a 4-fold cross-validation.
3.1. Performance Evaluation of Models With Histone Modification Only
We set a baseline with the state-of-the-art method for gene expression level prediction, AttentiveChrome (Singh et al., 2017). As AttentiveChrome was designed for histone marks only, instead of multiple epigenetic features, we trained both our model and AttentiveChrome using only seven histone marks for a fair comparison. We evaluated them with two metrics. (1) First, we performed a classification task on whether a gene is highly or lowly expressed in that cell line. (2) Second, gene expression value prediction was performed in terms of rank concordance between the gene expression values and the final output values of the model.
In terms of AUC, rank concordance, and AUPR, our model outperformed AttentiveChrome for every cell line (Figure 2, Supplementary Figure 3). On average, the proposed model achieved 91.05% of AUC, while AttentiveChrome achieved 89.72%. Moreover, the model demonstrated its robustness by showing higher rank concordances between the gene expression value and the final output of the model. Our model showed 56.83% of rank concordance on average, while AttentiveChrome showed only 53.85%. We conjecture that the performance difference is due to the difference in model architectures. AttentiveChrome first uses an individual LSTM structure for each histone mark, and then integrates histone marks with an additional LSTM. On account of the individual LSTM, the interactions of numerous types of histone marks are likely to be neglected. Consequently, AttentiveChrome was not successful in capturing the local characteristics of seven histone marks. On the other hand, our model used both CNN and LSTM to capture local and sequential features of histone marks in a single model. Our model is therefore suitable for modeling not only the roles of histone marks but also interactions among them.
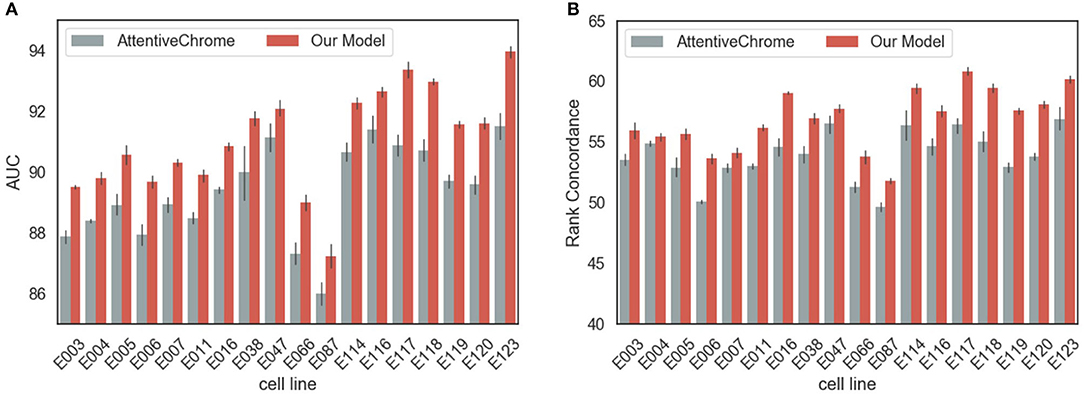
Figure 2. Performance evaluation of models in predicting the gene expression levels. The performance of our model surpassed that of a baseline model, AttentiveChrome, in both criteria of (A) AUC and (B) Rank Concordance for two models for every cell line.
3.2. Performance Evaluation of Models With Multi-Omics Markers
Since our model is designed to utilize multi-omics biomarkers, we measured performance in terms of the average AUC and AUPR of our models that were trained on all possible combinations of multi-omics features (Figure 3, Supplementary Figure 4). The average AUC of the model improved when adding and integrating multi-omics features. In particular, the model with histone marks (HM, TF+HM, ME+HM, and TF+ME+HM) showed remarkable levels of AUC, exceeding the AUC of AttentiveChrome. This result is attributed to the fact that genes can be expressed if chromatins are opened, and thus histone marks are a major determinant of chromatin regulation.
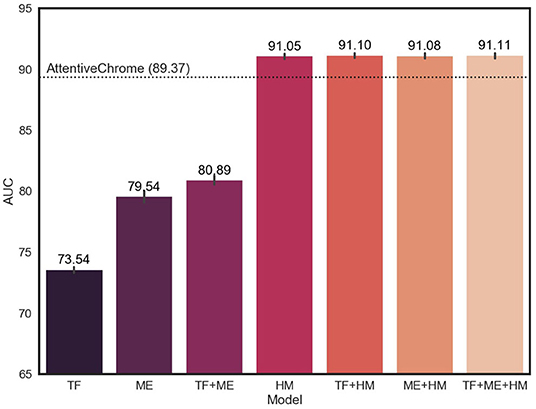
Figure 3. Average AUC of 18 cell lines for different subsets of multi-omics features. TF, ME, and HM stand for transcription factors, DNA methylation, and histone marks, respectively. The model showed improvement in AUC, adding multiple epigenetic markers.
3.3. Modeling Gene Regulation Mechanisms Using Multi-Omics Markers
Multi-omics markers are required to model gene regulation mechanisms. We focused on HeLa cell since its accuracy has been improved significantly by adding multiple markers (Supplementary Figure 5). In the HeLa cell, genes exist that cannot be predicted correctly using histone modification marks alone. Figure 4 shows the average ChIP-seq reads of histone modification marks of genes with the same labels and predictions of the HM model. The model prediction is consistent: genes with the same prediction curves have common characteristics regardless of their true labels.
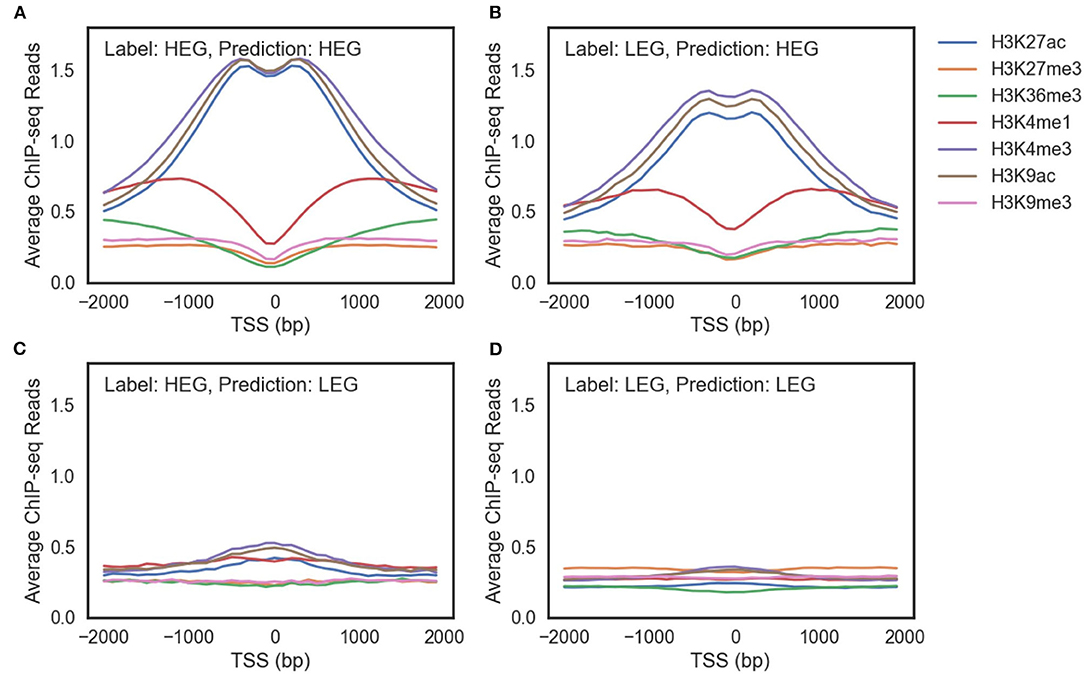
Figure 4. The average ChIP-seq reads of seven histone modification marks of (A) highly expressed genes (HEG) predicted as HEG. (B) lowly expressed genes (LEG) predicted as HEG. (C) HEG predicted as LEG. (D) LEG predicted as LEG.
There were three differences between genes predicted as highly expressed genes (HEG) (Figures 4A,B) and genes predicted as lowly expressed genes (LEG) (Figures 4C,D). First, ChIP-seq reads of the genes predicted as HEG had a larger scale than the genes predicted as LEG. Second, the genes predicted as HEG had a noticeable peak around TSS for each histone mark associated with the activation of genes (H3K27ac, H3K4me3, and H3K9ac). Third, the genes predicted as HEG had a higher value of H3K4me1 around TSS, which is related to enhancers.
There are LEG even with an open chromatin state (Figure 4B) and HEG with weak signals of activation histone marks (Figure 4C). A model that only uses histone marks is limited in both predicting the gene expression level and characterizing the gene regulation mechanisms. In other words, multiple epigenetic markers such as DNA methylation and transcription factors are required to understand the complex gene regulation mechanisms.
RNF212, one of the enriched genes in the HeLa cell, epitomizes a gene that can be fully understood only by the multi-omics model, especially the TF+ME+HM model. The gene is a highly expressed gene but the model with histone marks alone failed to predict the gene expression level. This is due to the weak activation of histone marks. The intensities of histone marks associated with the activation of genes (H3K27ac, H3K4me3, and H3K9ac) were much smaller than those of other HEGs (i.e., SLF1) (Figure 5A). However, the gene was predicted correctly by the model with three epigenetic markers (TF+ME+HM). This is because the model could learn the regulation mechanisms of DNA methylation and transcription factors. Figure 5B illustrates the DNA methylation levels of RNF212 and the attention weights of Dynamic LSTM. Surprisingly, the attention weight near TSS was high, and the region was unmethylated. The unmethylated promoter region enabled transcription factors to bind to the gene. Figure 5C shows all the possible binding transcription factors of the promoter region. These transcription factors were up-regulated especially in the HeLa cell compared to the other 17 cell lines (Figure 5D). Therefore, we can infer that RNF212 could be highly expressed, despite weak signals of activation marks, thanks to the help of the “highly expressed” transcription factors, which bound to the unmethylated promoter region. As shown in the example, our multi-omics model reflected the multiple gene regulation mechanisms of histone marks, DNA methylation, and transcription factors.
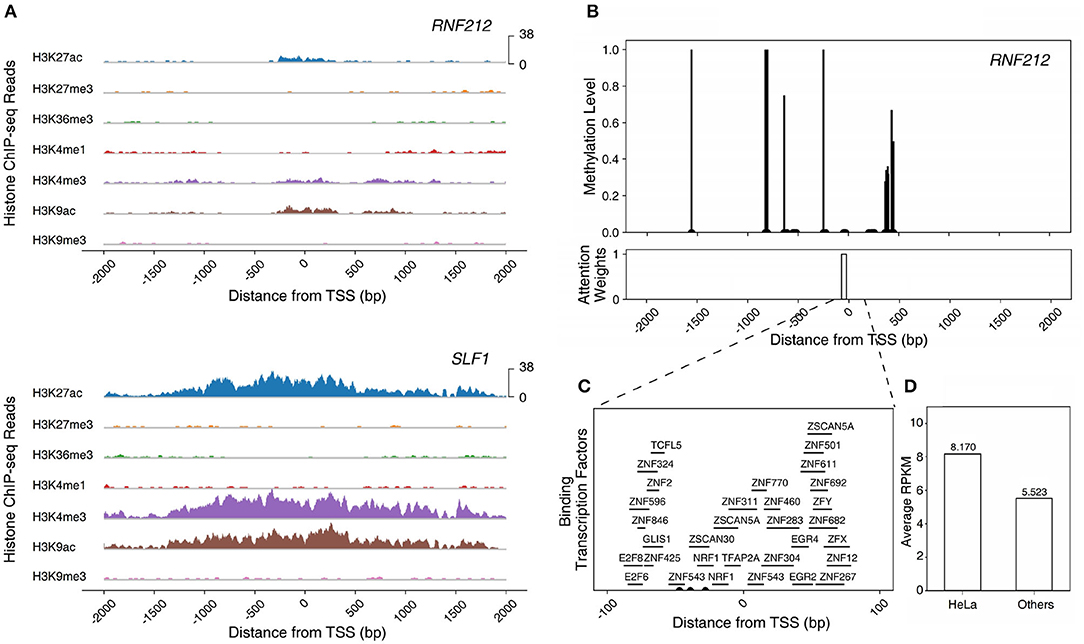
Figure 5. Modeling the epigenetic regulation mechanism of RNF212 in HeLa cell line. (A) The ChIP-seq reads of histone modification marks of RNF212 and SLF1. (B) The DNA methylation levels and attention weights of RNF212. (C) The candidate binding transcription factors of the promoter region of RNF212. (D) The average expression value of the binding transcription factors of RNF212 in HeLa cell line and other cell lines.
3.4. Characterizing Cell-Type-Specific Gene Regulation Mechanisms
Figure 6 demonstrates the weights of the Multi-Attention Block in 18 cell lines. Every weight is normalized by the average weight of 18 cell-lines in order to compare the importance of markers in each cell line. The attention weight of each feature shows how the model attends to the feature to predict gene expression level. The attention weight of each epigenetic marker therefore represents the importance of the markers in gene regulation. We compared the attention weights to reveal the important regulatory mechanisms in 18 cell lines and 5 cell types: ESC, ES-deriv, Blood & T-cell, Tissue & Primary Cell, and Cancer Cell Line.
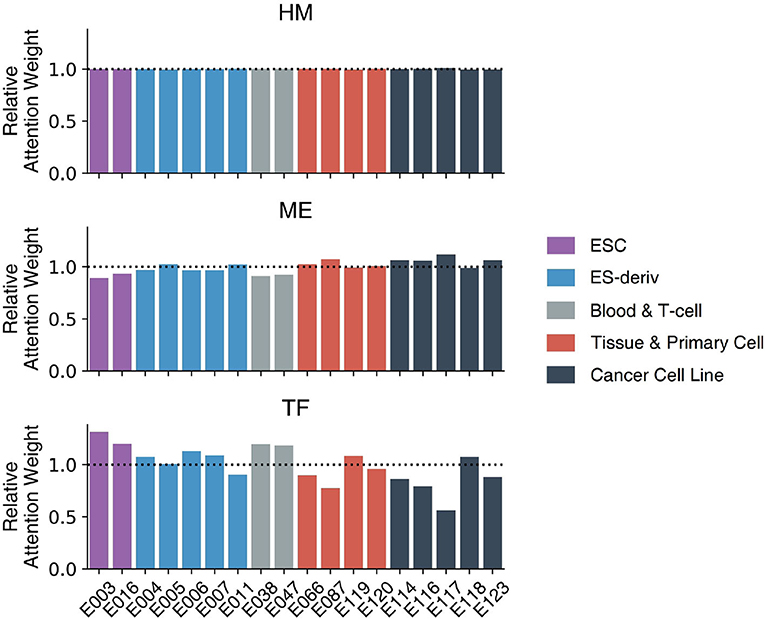
Figure 6. The weights of the Multi-Attention Block in 18 cell lines. Based on relative attention weights, the importance of histone marks was not significantly different among cell lines. Moreover, methylation and transcription factors showed quite different weights among each cell line. In case of methylation, cancer cell lines were more focused on methylation compared to other cell lines. In case of transcription factor, ESC type cell lines had higher attention weights than those of others.
There was no big difference in the weights of histone marks between the 18 cell lines. This is because histone modification plays a key role in the activation of genes, irrespective of cell type. Only after the chromatin structure of the gene is opened, can the gene be expressed. The higher AUC of the HM model (91.05) compare to that of the TF model (73.54) or the ME model (79.54), supports the importance of histone marks.
In contrast, weights of DNA methylation or transcription factors vary among cell types. In other words, DNA methylation and transcription factors determine the cell-type-specific gene regulatory mechanism. In general, cancer cell lines showed high attention weights of DNA methylation. The result is intuitive because DNA methylation is important in the development of cancer (Wajed et al., 2001; Kulis and Esteller, 2010). The abnormal patterns of methylation can inhibit gene expression and increase the probability of mutation (Wajed et al., 2001; Kulis and Esteller, 2010). It is commonly known that the hypermethylation of CpG islands inactivates tumor suppressor genes. Moreover, global hypomethylation significantly contributes to genome instability and aberrant gene expression.
In addition, embryonic stem cells showed the high attention weights of transcription factors. This reflects the crucial role of transcription factors in determining the fate of stem cells between self-renewal and differentiation. Transcriptional circuitry involving transcription factors like OCT4, SOX2, and NANOG is well-known to be a core regulatory mechanism of stem cells to maintain their stemness (Pan et al., 2002; Li, 2010). Furthermore, the significance of transcriptional regulation in embryonic stem cells has been highlighted since the prominent discovery, showing that ectopic overexpression of four essential transcription factors (OCT4, SOX2, KLF4, MYC), which are often referred to as “Yamanaka factors,” are sufficient to induce the pluripotency of somatic cells.
Furthermore, we evaluated the cell-type-specificity and compatibility of our model, by training on one cell line and testing on other cell lines. For each cell line, the greatest AUC of the model was achieved when the model was trained on the cell line, demonstrating the cell-type-specificity. Moreover, it is notable that cell lines in the same group showed similar AUC patterns (Figure 7). By performing hierarchical clustering with the Euclidean distance, cell lines in the same group were clustered together. The result highlights the transferability between the models in the same group, i.e., transfer learning. In other words, each cell line can be explained well by the model of the other cell lines if they are in the same group. For instance, the blood and T-cell group, E038 and E047, showed the best AUC for each other's model. This is probably because the cell lines in the same group tend to have similar gene regulation mechanisms.
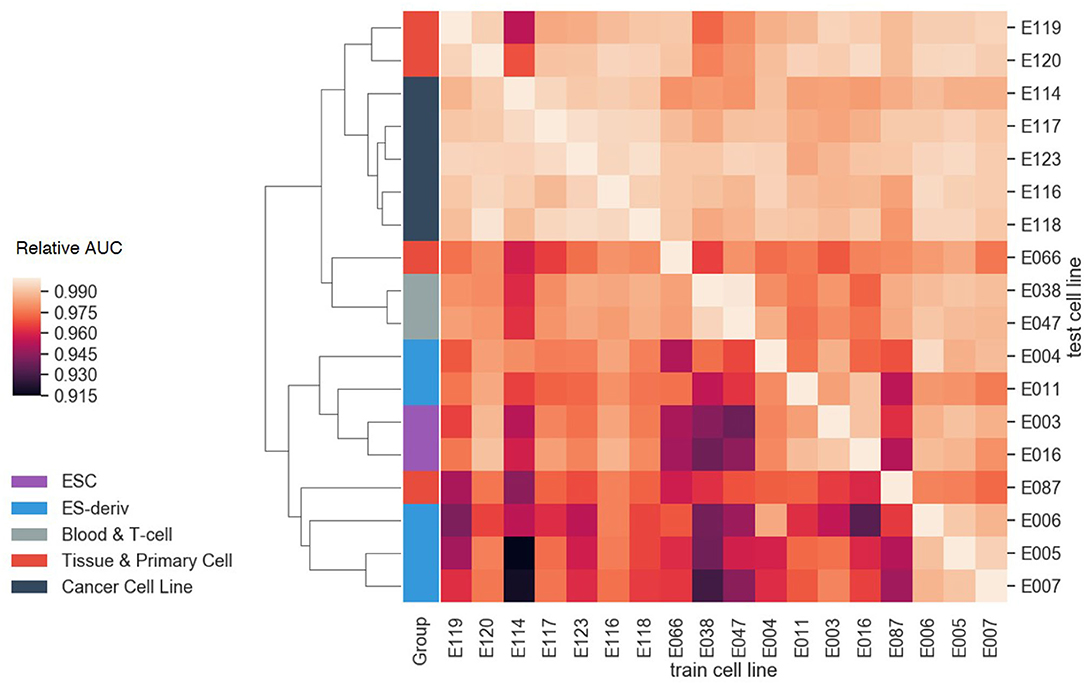
Figure 7. The compatibility test results between cell lines. The AUC values of each test cell line were normalized with the AUC value of the model trained on that cell line. As a result of hierarchical clustering, cell lines in the same group showed similar AUC patterns. This result highlights the transferability between the models in the same group.
3.5. Identification of Enriched Genes: Case Studies on HeLa and K562
Performances of the multi-omics model on the HeLa cell line and K562 cell line were quite improved compared to AttentiveChrome (Supplementary Figure 5). In addition, the multi-omics model better captured cell line enriched genes that were obtained from the Human Protein Atlas (http://www.proteinatlas.org; Uhlen et al., 2017). In the case of the HeLa cell line, the multi-omics model predicted 12 genes correctly among 20 enriched genes, while 9-10 genes were predicted correctly by the HM, TF+HM, and ME+HM models (Supplementary Table 1). On the other hand, in the case of the K562 cell line, 38 out of 62 genes were predicted correctly with the multi-omics model. Similar to the HeLa cell case, other models showed poor performances (34-37 genes, Supplementary Table 2). The number of correctly predicted HEG by each model is summarized in Supplementary Figures 6, 7 for HeLa and K562, respectively.
We further investigated functions and epigenetic regulation mechanisms of cell-type enriched genes on the HeLa and K562 cell lines (Figure 8). RNF212 was one of the HeLa cell enriched genes and was predicted correctly with the multi-omics only model. RNF212 creates a cellular memory of DNA damage by tagging the lingering breaks (Qiao et al., 2018) and is known as a prognostic marker in cervical cancer in The Human Protein Atlas http://www.proteinatlas.org. The TF+HM and ME+HM model failed to predict the expression level of RNF212, while the TF+ME+HM model predicted it as an expressed gene. This result therefore implies that the expression of RNF212 may be modulated by DNA methylation and transcription factors. It is also shown in the weights of the Multi-Attention Block in Figure 8.
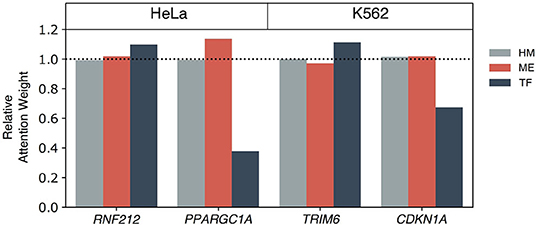
Figure 8. The epigenetic mechanisms of highly expressed genes in the HeLa and K562 cell lines. Among correctly predicted highly expressed genes by the TF+ME+HM model, four genes are selected for a further case study of epigenetic gene regulation mechanism: RNF212 and PPARGC1A for HeLa, and TRIM6 and CDKN1A for the K562 cell line. To elucidate the importance of each omics on the gene regulation, the relative attention weights of the Multi-Attention Block were used.
PPARGC1A was also predicted correctly by the multi-omics model of the HeLa cell line. PPARGC1A belongs to the PCG-1 family that is associated with the regulation of mitochondrial biogenesis, promoting cell growth, proliferation, and evasion of the apoptosis signal (Lin et al., 2005; Jones et al., 2012). In particular, PPARGC1A modulates telomere function and the DNA damage mechanism in diabetes and cardiovascular disease (Lai et al., 2008; Xiong et al., 2015). Interestingly, the TF+ME+HM and ME+HM model, but not the TF+HM model, correctly predicted expression of the gene. In Figure 8, methylation was relatively more highlighted than other omics data. According to this observation, we speculated that methylation is one of the main regulators of PPARGC1A. This epigenetic regulation was already reported in other tissues such as brown adipose tissue or skeletal muscle tissue (Gillberg et al., 2013, 2014; Gill and La Merrill, 2017).
In the case of the K562 cell line, the TRIM6 gene was captured by the multi-omics model. It belongs to the Tripartite motif (TRIM) family which is related to the cancer stem cell self-renewal process. TRIM6, more specifically, directly interacts with the MYC gene to modulate stem cell differentiation (Jaworska et al., 2019). Attention weights of TF were relatively higher than the weights of ME. Besides the TF+ME+HM model, the TF+HM only model predicted the activation of genes correctly. Therefore, it is thought that HM and TF co-regulate the expression of TRIM6.
Lastly, CDKN1A, also known as p21, is a kind of tumor suppressor gene. CDKN1A plays a crucial role in regulating cell cycles to prevent cancer progression. In Figure 8, histone and methylation were relatively highlighted. Based on this observation, we thought that methylation might be a key factor in epigenetic regulation of CDKN1A. In addition to the TF+ME+HM model, the ME+HM model also predicted correctly. From previous studies, expression of DNMT1 and CDKN1A showed a negative regulation mechanism on chronic myelogenous leukemia (Kaufman-Szymczyk et al., 2019). It was also reported that DNMT3B knock-down induced up-regulation of a number of tumor suppressor genes including CDKN1A (Poole et al., 2017).
Based on the case study of enriched genes of the HeLa and K562 cell line, we could investigate the epigenetic regulatory mechanisms of gene expressions by the weights of the Multi-Attention Blocks. Although it was possible to infer the involvement of histone marks, DNA methylation, and transcription factor for each gene, and to analyze their importance, there are other epigenetic and transcriptional factors that regulate gene expression. MicroRNA (miRNA) is one of the famous epigenetic factors that was not included in the model. MiRNAs are actually genes that are controlled by epigenetic mechanisms and TFs. For example, EWS is known to regulate Drosha, which controls biogenesis of miRNA (Kim et al., 2014). miRNA can then affect the transcription and translation of genes. To study the effects of miRNAs, we collected the genes that were correctly predicted by the TF+ME+HM model, not by the HM model in the HeLa cell line and 275 genes were selected as candidate genes. Using a biomedical literature search platform, BEST (Lee et al., 2016), 14 genes were related to miRNA in the context of the HeLa cell line, cervical cancer, or ovarian cancer (Supplementary Table 3). For example, the expression of LPAR2 was repressed by miR-377, and oncogenic processes such as cell proliferation or migration are known to be repressed by that inhibition mechanism (Zhang et al., 2020). As another example, ITGB1 was targeted by miR-183. It is known that miR-183 may play a role in tumor suppressors, such as the inhibition of cell invasion or the decrease of migration capacities of HeLa cells (Li et al., 2010). Incorporation of miRNA in our deep learning model can certainly be helpful in understanding complex gene regulation mechanisms. We plan to investigate how roles of miRNA can be seamlessly integrated into our deep learning model.
4. Conclusion
In summary, the proposed model learned cell-type-specific gene regulation mechanisms through Multi-Attention based deep learning strategies. To the best of our knowledge, the model is the first of its kind to use multiple epigenetic and transcriptional markers for predicting gene expressions. Our model achieved higher prediction accuracy than the state-of-the-art model. Additionally, the proposed method provided useful insight into cell-type-specific gene regulation mechanisms. Specifically, the weights of the Multi-Attention Block revealed the relative importance of each marker in the specific cell line. Lastly, we identified the mechanism of enriched genes in HeLa and K562 cell lines.
Our model investigated the roles of three markers: histone marks, DNA methylation, and transcription factors. However, the gene regulatory network may also involve additional epigenetic and transcriptional markers such as microRNA, competing endogenous RNA, or long non-coding RNA. Thus, future studies on other epigenetic markers need to be conducted.
Data Availability Statement
Publicly available datasets were analyzed in this study. This data can be found here: https://egg2.wustl.edu/roadmap/data/byDataType/rna/expression/, https://egg2.wustl.edu/roadmap/data/byDataType/dnamethylation/, and https://egg2.wustl.edu/roadmap/data/byFileType/alignments/consolidated/.
Author Contributions
SK conceived the experiment. MK and SL conducted the experiment and drafted the manuscript. MK, SL, and DL processed data and analyzed results. All authors read and approved the final manuscript.
Funding
This research is supported by the Next-Generation Information Computing Development Program through the National Research Foundation of Korea (NRF) funded by the Ministry of Science, ICT (No.NRF-2017M3C4A7065887), the Collaborative Genome Program for Fostering New Post-Genome Industry of the NRF funded by the Ministry of Science and ICT (No.NRF2014M3C9A3063541), the Bio & Medical Technology Development Program of the NRF funded by the Ministry of Science & ICT (NRF-2019M3E5D307337511), the Bio & Medical Technology Development Program of the NRF funded by the Ministry of Science & ICT (NRF-2019M3E5D4065965), and a grant of the Korea Health Technology R&D Project through the Korea Health Industry Development Institute (KHIDI), funded by the Ministry of Health & Welfare, Republic of Korea (grant number: HI15C3224).
Conflict of Interest
The authors declare that the research was conducted in the absence of any commercial or financial relationships that could be construed as a potential conflict of interest.
Supplementary Material
The Supplementary Material for this article can be found online at: https://www.frontiersin.org/articles/10.3389/fgene.2020.00869/full#supplementary-material
References
Cedar, H., and Bergman, Y. (2009). Linking dna methylation and histone modification: patterns and paradigms. Nat. Rev. Genet. 10, 295–304. doi: 10.1038/nrg2540
Fatemi, M., and Wade, P. A. (2006). Mbd family proteins: reading the epigenetic code. J. Cell Sci. 119, 3033–3037. doi: 10.1242/jcs.03099
Gers, F. A., Schmidhuber, J., and Cummins, F. (2000). Learning to forget: continual prediction with lstm. Neural Comput. 12, 2451–2471. doi: 10.1162/089976600300015015
Gill, J., and La Merrill, M. A. (2017). An emerging role for epigenetic regulation of pgc-1α expression in environmentally stimulated brown adipose thermogenesis. Environ. Epigenet. 3:dvx009. doi: 10.1093/eep/dvx009
Gillberg, L., Jacobsen, S., Ribel-Madsen, R., Gjesing, A. P., Boesgaard, T. W., Ling, C., et al. (2013). Does DNA methylation of ppargc1a influence insulin action in first degree relatives of patients with type 2 diabetes? PLoS ONE 8:e58384. doi: 10.1371/journal.pone.0058384
Gillberg, L., Jacobsen, S. C., Rönn, T., Brøns, C., and Vaag, A. (2014). Ppargc1a dna methylation in subcutaneous adipose tissue in low birth weight subjects impact of 5 days of high-fat overfeeding. Metabolism 63, 263–271. doi: 10.1016/j.metabol.2013.10.003
Heinz, S., Benner, C., Spann, N., Bertolino, E., Lin, Y. C., Laslo, P., et al. (2010). Simple combinations of lineage-determining transcription factors prime cis-regulatory elements required for macrophage and b cell identities. Mol. Cell 38, 576–589. doi: 10.1016/j.molcel.2010.05.004
Jaworska, A., Wlodarczyk, N., Mackiewicz, A., and Czerwinska, P. (2019). The role of trim family proteins in the regulation of cancer stem cell self-renewal. Stem Cells 38, 165–173. doi: 10.1002/stem.3109
Jones, A. W., Yao, Z., Vicencio, J. M., Karkucinska-Wieckowska, A., and Szabadkai, G. (2012). Pgc-1 family coactivators and cell fate: roles in cancer, neurodegeneration, cardiovascular disease and retrograde mitochondria–nucleus signalling. Mitochondrion 12, 86–99. doi: 10.1016/j.mito.2011.09.009
Kaufman-Szymczyk, A., Majda, K., Szuławska-Mroczek, A., Fabianowska-Majewska, K., and Lubecka, K. (2019). Clofarabine-phytochemical combination exposures in cml cells inhibit dna methylation machinery, upregulate tumor suppressor genes and promote caspase-dependent apoptosis. Mol. Med. Rep. 20, 3597–3608. doi: 10.3892/mmr.2019.10619
Kim, K. Y., Hwang, Y. J., Jung, M.-K., Choe, J., Kim, Y., Kim, S., et al. (2014). A multifunctional protein ews regulates the expression of drosha and micrornas. Cell Death Diff. 21, 136–145. doi: 10.1038/cdd.2013.144
Kulis, M., and Esteller, M. (2010). DNA methylation and cancer. Adv. Genet. 70, 27–56. doi: 10.1016/B978-0-12-380866-0.60002-2
Kundaje, A., Meuleman, W., Ernst, J., Bilenky, M., Yen, A., Heravi-Moussavi, A., et al. (2015). Integrative analysis of 111 reference human epigenomes. Nature 518, 317–330. doi: 10.1038/nature14248
Lai, C.-Q., Tucker, K. L., Parnell, L. D., Adiconis, X., García-Bailo, B., Griffith, J., et al. (2008). Ppargc1a variation associated with dna damage, diabetes, and cardiovascular diseases: the boston puerto rican health study. Diabetes 57, 809–816. doi: 10.2337/db07-1238
Lambert, S. A., Jolma, A., Campitelli, L. F., Das, P. K., Yin, Y., Albu, M., et al. (2018). The human transcription factors. Cell 172, 650–665. doi: 10.1016/j.cell.2018.01.029
Lee, S., Kim, D., Lee, K., Choi, J., Kim, S., Jeon, M., et al. (2016). Best: next-generation biomedical entity search tool for knowledge discovery from biomedical literature. PLoS ONE 11:e0164680. doi: 10.1371/journal.pone.0164680
Li, G., Luna, C., Qiu, J., Epstein, D. L., and Gonzalez, P. (2010). Targeting of integrin β1 and kinesin 2α by microrna 183. J. Biol. Chem. 285, 5461–5471. doi: 10.1074/jbc.M109.037127
Li, Y.-Q. (2010). Master stem cell transcription factors and signaling regulation. Cell. Reprogramming 12, 3–13. doi: 10.1089/cell.2009.0033
Lin, J., Handschin, C., and Spiegelman, B. M. (2005). Metabolic control through the pgc-1 family of transcription coactivators. Cell Metab. 1, 361–370. doi: 10.1016/j.cmet.2005.05.004
Min, S., Lee, B., and Yoon, S. (2016). Deep learning in bioinformatics. Brief. Bioinform. 18, 851–869. doi: 10.1093/bib/bbw068
Pan, G. J., Chang, Z. Y., Schöler, H. R., and Duanqing, P. (2002). Stem cell pluripotency and transcription factor oct4. Cell Res. 12, 321–329. doi: 10.1038/sj.cr.7290134
Poole, C. J., Zheng, W., Lodh, A., Yevtodiyenko, A., Liefwalker, D., Li, H., et al. (2017). Dnmt3b overexpression contributes to aberrant dna methylation and myc-driven tumor maintenance in t-all and burkitt's lymphoma. Oncotarget 8:76898. doi: 10.18632/oncotarget.20176
Qiao, H., Rao, H. P., Yun, Y., Sandhu, S., Fong, J. H., Sapre, M., et al. (2018). Impeding dna break repair enables oocyte quality control. Mol. Cell 72, 211–221. doi: 10.1016/j.molcel.2018.08.031
Singh, R., Lanchantin, J., Robins, G., and Qi, Y. (2016). Deepchrome: deep-learning for predicting gene expression from histone modifications. Bioinformatics 32, i639–i648. doi: 10.1093/bioinformatics/btw427
Singh, R., Lanchantin, J., Sekhon, A., and Qi, Y. (2017). “Attend and predict: Understanding gene regulation by selective attention on chromatin,” in Advances in Neural Information Processing Systems, 6785–6795.
Uhlen, M., Zhang, C., Lee, S., Sjöstedt, E., Fagerberg, L., Bidkhori, G., et al. (2017). A pathology atlas of the human cancer transcriptome. Science 357:eaan2507. doi: 10.1126/science.aan2507
Wagner, J. R., Busche, S., Ge, B., Kwan, T., Pastinen, T., and Blanchette, M. (2014). The relationship between dna methylation, genetic and expression inter-individual variation in untransformed human fibroblasts. Genome Biol. 15:R37. doi: 10.1186/gb-2014-15-2-r37
Wajed, S. A., Laird, P. W., and DeMeester, T. R. (2001). Dna methylation: an alternative pathway to cancer. Ann. Surg. 234:10. doi: 10.1097/00000658-200107000-00003
Xie, R., Wen, J., Quitadamo, A., Cheng, J., and Shi, X. (2017). A deep auto-encoder model for gene expression prediction. BMC Genomics 18:845. doi: 10.1186/s12864-017-4226-0
Xiong, S., Patrushev, N., Forouzandeh, F., Hilenski, L., and Alexander, R. W. (2015). Pgc-1α modulates telomere function and dna damage in protecting against aging-related chronic diseases. Cell Rep. 12, 1391–1399. doi: 10.1016/j.celrep.2015.07.047
Zadeh, A., Liang, P. P., Poria, S., Vij, P., Cambria, E., and Morency, L.-P. (2018). “Multi-attention recurrent network for human communication comprehension,” in Thirty-Second AAAI Conference on Artificial Intelligence.
Zeng, P., Zhou, X., and Huang, S. (2017). Prediction of gene expression with cis-snps using mixed models and regularization methods. BMC Genomics 18:368. doi: 10.1186/s12864-017-3759-6
Zhang, T., Cooper, S., and Brockdorff, N. (2015). The interplay of histone modifications–writers that read. EMBO Rep. 16, 1467–1481. doi: 10.15252/embr.201540945
Zhang, Y., Liu, Y., Guo, X., Hu, Z., and Shi, H. (2020). Interfering human papillomavirus e6/e7 oncogenes in cervical cancer cells inhibits the angiogenesis of vascular endothelial cells via increasing mir-377 in cervical cancer cell-derived microvesicles. Oncotargets Ther. 13:4145. doi: 10.2147/OTT.S239979
Keywords: gene regulation mechanism, gene regulatory network, multi-omics, deep learning, cell-type-specific
Citation: Kang M, Lee S, Lee D and Kim S (2020) Learning Cell-Type-Specific Gene Regulation Mechanisms by Multi-Attention Based Deep Learning With Regulatory Latent Space. Front. Genet. 11:869. doi: 10.3389/fgene.2020.00869
Received: 07 February 2020; Accepted: 16 July 2020;
Published: 30 September 2020.
Edited by:
Jiajie Peng, Northwestern Polytechnical University, ChinaReviewed by:
Eunhee Choi, Harvard Medical School, United StatesTianyi Zhao, Harbin Institute of Technology, China
Copyright © 2020 Kang, Lee, Lee and Kim. This is an open-access article distributed under the terms of the Creative Commons Attribution License (CC BY). The use, distribution or reproduction in other forums is permitted, provided the original author(s) and the copyright owner(s) are credited and that the original publication in this journal is cited, in accordance with accepted academic practice. No use, distribution or reproduction is permitted which does not comply with these terms.
*Correspondence: Sun Kim, c3Vua2ltLmJpb2luZm8mI3gwMDA0MDtzbnUuYWMua3I=
†These authors share first authorship