 Joana Stock
 Jörn Bennewitz
 Dirk Hinrichs2
 Robin Wellmann
94% of researchers rate our articles as excellent or good
Learn more about the work of our research integrity team to safeguard the quality of each article we publish.
Find out more
REVIEW article
Front. Genet., 26 June 2020
Sec. Livestock Genomics
Volume 11 - 2020 | https://doi.org/10.3389/fgene.2020.00568
This article is part of the Research TopicAdvances in Genomics of Crossbred Farm AnimalsView all 26 articles
Livestock breeding has shifted during the past decade toward genomic selection. For the estimation of breeding values in purebred breeding schemes, genomic best linear unbiased prediction has become the method of choice. Systematic crossbreeding with the aim to utilize heterosis and breed complementary effects is widely used in livestock breeding, especially in pig and poultry breeding. The goal is to improve the performance of the crossbred animals. Due to genotype-by-environment interactions, imperfect linkage disequilibrium, and the existence of dominance and imprinting, purebred and crossbred performances are not perfectly correlated. Hence, more complex genomic models are required for crossbred populations. This study reviews and compares such models. Compared to purebred genomic models, the reviewed models were of much higher complexity due to the inclusion of dominance effects, breed-specific effects, imprinting effects, and the joint evaluation of purebred and crossbred performance data. With the model assessment work conducted until now, it is not possible to come to a clear recommendation as to which existing method is most suitable for a specific breeding program and a specific genetic trait architecture. Since it is expected that a superior method includes all the different genetic effects in a single model, a dominance model with imprinting and breed-specific SNP effects is proposed. Further progress could be made by assuming realistic covariance structures between the genetic effects of the different breeding lines, and by using larger marker panels and mixture distributions for the SNP effects.
The crossing of different lines or breeds is widely used in animal breeding with the main aim to produce superior offspring. This superiority results from heterosis and from breed complementary effects. Continuous and discontinuous crossbreeding schemes have been designed and are implemented in various livestock species (Lopez-Villalobos et al., 2000; Samorè and Fontanesi, 2016). In discontinuous schemes, crossbred animals are used solely for production and are not selected as parents of the next generation. Breeding takes place in the parental breeds and the breeding goal is usually to improve crossbred performance. The level of organization in such a system is high and it is sometimes difficult to utilize by-products, such as male offspring of mother lines. These schemes can be predominantly found in livestock species with a high female reproduction rate such as pigs and poultry. In continuous breeding schemes, the female crossbreds are used as parents to breed the next generation. These systems are sometimes implemented in livestock species with a low female reproduction rate such as cattle. Since there are substantial non-additive effects for reproduction traits in dairy cattle (Jiang et al., 2017), the aims of crossbreeding in dairy cattle are to improve reproduction traits and other functional traits by exploiting heterosis and imprinting and by removing inbreeding depression (Sørensen et al., 2008; Buckley et al., 2014).
A further form of crossbreeding is the upgrading of low-performance breeds with high-yielding breeds. This introgression of genes from high-yielding breeds increases the production level in subsequent generations and reduces inbreeding depression by increasing the genetic diversity of the low-performance breed. This breeding system has frequently been applied to local breeds, such as the German Vorderwald cattle (Hartwig et al., 2014, 2015). However, if upgrading is repeated over several generations, then the breed eventually goes extinct because the native alleles are removed from its gene pool. The formation of a synthetic breed can also be seen as a special form of crossbreeding. A well-known example is the establishment of the so-called Schwarzbuntes Milchrind in the former East Germany (Freyer et al., 2008).
Livestock breeding has shifted toward genomic selection, which is now frequently implemented in large pure breeds. The core of the system that has been implemented in pure breeds is a reference population that consists of genotyped and phenotyped animals. The phenotypes are either the animal's own performance records, or deregressed conventional breeding values. The reference population is needed for the prediction of marker effects. The marker effects are then used for predicting genomic breeding values of the genotyped selection candidates. The reliability of genomic breeding values depends on the size of the reference population, on the effective number of chromosome segments, and on the method used for the prediction of marker effects (Goddard, 2009).
Extensive research has been dedicated to develop statistical models for the prediction of marker effects. These statistical models include the SNP-BLUP model that assumes normally distributed SNP effects, various Bayesian models that assume more heavy-tailed distributions, as well as non-parametric and semi-parametric models (Meuwissen et al., 2001; Gianola, 2013). More complex models assume different SNP variances, depending on the type of control region the SNP belongs to MacLeod et al. (2016). Some models avoid the prediction of marker effects by building a genomic relationship matrix based on SNP genotypes. The most prominent method based on genomic relationships is GBLUP, which is an equivalent model to SNP-BLUP (VanRaden, 2008; Goddard, 2009). The genotyped selection candidates are included in the model, and their genomic breeding values are calculated by utilizing their genomic relationships with the reference population. GBLUP assumes that all animals are genotyped, which is in general not the case. Therefore, the genomic breeding values are blended in a second step with pedigree-based breeding values to obtain genomically enhanced breeding values on which selection decisions are based. This two-step procedure can be avoided with so-called single-step GBLUP models (ssGBLUP). They were developed as extensions of GBLUP. Single-step models include genotyped and non-genotyped animals simultaneously (Legarra et al., 2009, 2014; Aguilar et al., 2010; Christensen and Lund, 2010) and assume a particular covariance structure for the breeding values that is computed from genomic and pedigree-based relationships. Fernando et al. (2014) extended the single step model toward non-normally distributed marker effects. In purebred routine application mostly additive effects are considered, with dominance being an integral part of the estimated breeding values. Some genomic models were extended toward accounting for dominance explicitly, but this increased the realibilities of the breeding values only slightly (Su et al., 2012; Wellmann and Bennewitz, 2012; Azevedo et al., 2015).
To summarize, it seems that in practical purebred genomic evaluations, GBLUP and ssGBLUP have and will become the models of choice, and non-additive gene effects are usually not an issue. The picture is however somewhat different if data from crossbred animals in combination with the parental purebred data is analyzed. The potential applications of genomic models with non-additive genetic effects have been reviewed by Varona et al. (2018). The main breeding goal is in this case to improve the performance of the crossbred animals. Due to genotype-by-environment interaction, imperfect LD, and the existence of dominance, epistasis and imprinting, purebred and crossbred performances (PP and CP, respectively) are not perfectly correlated (e.g., Wei and van der Werf, 1995; Dekkers, 2007; Zumbach et al., 2007; Duenk et al., 2019). Wientjes and Calus (2017) reviewed existing literature about purebred-crossbred correlations in pigs. The average from 201 reported correlation coefficients was 0.63 with 50% of the reported coefficients being between 0.45 and 0.87. The purebred-crossbred correlation affects the optimal design of the reference population (van Grevenhof and van der Werf, 2015) and the choice of an appropriate genomic model.
While genomic models are well-established for pure breeds, much research has been conducted in the recent years to develop genomic models for the analysis of crossbred data. The aim of this study is to review genomic models for the prediction of crossbred performance that were recently developed and were evaluated either using simulated or real crossbred data.
Genomic models for crossbred data are extensions of purebred models. The extensions were made in several directions. Most genomic models for the analysis of crossbred data are developed for two-way crosses. A two-way cross is created from a sire line and a dam line , which are usually not inbred. The pure lines have breeding values and for PP, and breeding values and for CP. Typically, some animals are genotyped, whereas others are not. The goal is to obtain accurate predictions of the breeding values for CP by utilizing phenotypic information from genotyped and ungenotyped purebred and crossbred animals. An overview over the considered models is given in Table 1.
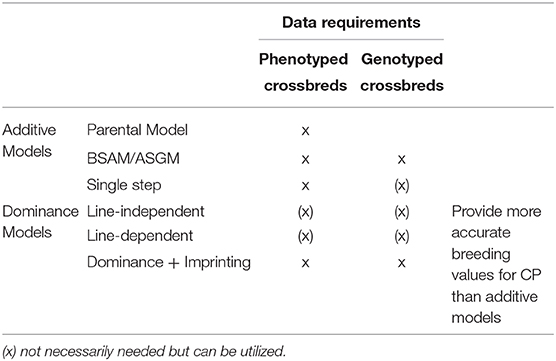
Table 1. Additive and dominance models for the prediction of crossbred performance.
The SNP alleles are usually assumed to be biallelic, so they may be coded as alleles 1 and 2. Most authors use centered allele content matrices as proposed by VanRaden (2008). The centering does not affect the predictions, but affects the model-based reliabilities (Strandén and Christensen, 2011). We denote with
the centered allele content matrix for the genotyped animals from line , whereby the allele content of animal i from line A is the number of copies of allele 2, animal i has at SNP m, and is the frequency of allele 2 of SNP m in line . Moreover, we denote with
the centered allele origin matrix for alleles from cross that originate from line . That is, is the number of copies of allele 2, crossbred animal i has obtained from sire line at SNP m. These matrices are needed to define genetic values of purebred and crossbred animals. The vector with breeding values for CP for animals from line has the representation
where is the vector with allele substitution effects for CP. The vector with breeding values for PP has the representation
where is the vector with allele substitution effects for PP. The equations for and are similarly.
Most genomic models for two-way crosses utilize, that the vector with additive genetic values of the crossbred animals can be decomposed into a contribution that comes from sire line , and a contribution that comes from dam line . That is,
where
The contribution from line can be further decomposed into a contribution that comes from the breeding values for CP, and into a vector that contains the Mendelian sampling terms of the transmitted gametes (Wei and van der Werf, 1994). That is,
where matrix assigns animals from line to their crossbred offspring.
Different models have been developed for predicting CP, which can broadly be classified into additive models and dominance models. While some models predict the breeding values for CP directly with Equation (5), others predict the vector with allele substitution effects for CP. In the latter case, the estimated breeding values for CP in line are obtained by substituting with the prediction in Equation (1).
Different additive models have been proposed in the literature. Some models assume that the crossbred animals are genotyped, whereas others do not. The general additive model for a two-way cross is a trivariate model that has two equations for the parental lines, and one equation for the cross. It has the general representation
where are vectors with phenotypic records of the respective subpopulation, are vectors of fixed effects with design matrices , and are vectors of non-genetic random effects with design matrices . Finally, are the breeding values for PP, and are the residual terms. The term “…” in the third equation depends on the respective model.
The first two model equations are needed because PP and CP are genetically correlated (Wientjes and Calus, 2017), so phenotypic records of purebred animals increase the reliabilities of the breeding values for CP.
The parental additive model is based on Equations (2), (3), and (5), and is suitable when the crossbred animals are not genotyped. The model assumes that the Mendelian sampling terms are part of the residuals, so the model equations become
where , , , and .
The model with breed-specific allele effects (BSAM) and the model with breed-independent allele effects, which is also called the across-breed SNP genotype model (ASGM) are based on Equations (2–4), and require that the crossbred animals are genotyped. While the ASGM model predicts one effect per SNP, the BSAM model predicts one effect for the paternal allele, and one for the maternal allele of the crossbred animals. Origin-specific allele effects may occur e.g., due to a different LD pattern between the marker and the QTL, different gene frequencies at the QTL, imprinting effects, or the epistatic effects may be different in the pure breeds. This results in different effects of the marker alleles and thus affects the estimated breeding values.
The first two equations of the BSAM and ASGM model are as above, whereas the third model equation becomes for the BSAM
An equivalent representation for the ASGM model is
Ibánez-Escriche et al. (2009) predicted CP of the parental lines from genotyped crossbred animals with BSAM and ASGM, whereby the breed-specific allele substitution effects of the BSAM model were a priori independent. The allele substitution effects were estimated with BayesB, which is a method that assumes that many of them are actually zero. An oligogene trait was simulated with breed-independent QTL effects. Although the SNP effects are expected to be breed-specific due to differences in LD between markers and QTL, the authors found that the BSAM model outperformed ASGM only if the number of markers was low, the number of records for training was high, and if the parental breeds were distantly related.
Lopes et al. (2017) used the BSAM model with normally distributed SNP effects to predict breeding values for CP from crossbred data, and compared the results with conventional GBLUP. The model provided similar prediction accuracies as conventional GBLUP for the traits litter size and gestation length in pigs. It may be not superior to GBLUP because the allele substitution effects of the different breeds were implicitly assumed to be uncorrelated, which is an assumption that is not likely to be fulfilled.
Sevillano et al. (2019) extended the BSAM and ASGM model toward a three-way cross and distinguished SNP that showed a strong trait association from all remaining SNP. For the trait associated SNP breed-specific effects were estimated, whereas for the remaining SNP one effect was estimated, regardless of the allele origin. This model was compared with the BSAM model and with the ASGM model for the trait daily gain by assuming normally distributed SNP effects. Purebred as well as crossbred data was used for training. The results showed a superiority of their method only if the estimated genetic correlations between PP and CP for the trait associated SNPs and the remaining SNPs were unequal.
Vandenplas et al. (2017) derived equations for predicting the reliability of genomic breeding values for CP for BSAM and ASGM models and assumed normally distributed SNP effects. The authors found that BSAM outperformed ASGM for a specific parental line, if the effective number of chromosome segments in the crossbred reference animals that originate from the parental line is less than half the effective number of all chromosome segments that are independently segregating.
While BSAM has the disadvantage that all crossbred animals have to be genotyped, the parental additive model has the disadvantage, that the information provided by the Mendelian sampling terms cannot be utilized for prediction. These problems could be resolved by using a trivariate model of the form
that includes both, genotyped and phenotyped animals. Christensen et al. (2014) derived the joint covariance matrix of , , and by using the pedigree-based model of Wei and van der Werf (1994) as a starting point. The authors derived the covariance matrix from pedigree relationships, and replaced it in a subsequent step by a covariance matrix that combines pedigree and genotype information.
Xiang et al. (2016a) validated the model of Christensen et al. (2014) in a two-way pig cross for the trait number of piglets born. The authors found that the inclusion of crossbred genomic information improved the model-based reliabilities for CP and reduced to some extent the bias of prediction.
Tusell et al. (2016) used a single-step model for two-way crossbred pigs and the sire line , so the model reduced to a bivariate model. The purebred animals were partly genotyped. Since the crossbred animals were not genotyped, the third equation in the model of Christensen et al. (2014) was replaced by a parental additive model equation, i.e., the Mendelian sampling terms were part of the residual. This resulted in a model equation of the form
The authors evaluated six growth and meat traits and found that the genetic correlations between purebred and CP were larger than 0.69 for all traits. The accuracies of the genomic breeding values were higher than those obtained from univariate single-step models that took either purebred or CP into account, and also higher than those obtained with pedigree-based models.
Crossbreeding utilizes heterosis and breed complementarity. A widely accepted hypothesis is that heterosis arises predominantly from dominance effects. An animal carries a dominance effect only if it is heterozygous at a particular QTL. We denote with
the centered indicator matrix for heterozygosity. That is, equals one, if animal i is heterozygous at SNP m, and is the heterozygosity of SNP m in line . The dominance model assumes that the vector with genotypic values of the crossbred animals has the representation
where is the population mean, is the vector with population-dependent additive effects, and is vector with population-dependent dominance effects. The genotypic values of purebred animals are defined accordingly. The trivariate dominance model for a two-way cross and the parental lines has therefore the representation
which we call the dominance model with line-dependent effects. The vector with breeding values for CP from breed has the representation given in Equation (1), but the vector with allele substitution effects for CP is
where is vector with allele frequencies in the opposite line, and the Hadamard product “∘″ is the component-wise product. The breeding values and allele substitution effects for line are defined accordingly. Predictions and of and are needed to get predictions of the allele substitution effects for CP in line with equation
Some solvers are unable to account for the fact that for most traits. As shown by Xiang et al. (2016b), one may write such that . Then, the term in Equation (7) equals where is treated as an additional fixed effect. The same needs to be done for the parental lines. We can write , where M is the number of SNPs, is the vector with heterozygosities of the crossbred animals, and is the average heterozygosity of the crossbred animals. Hence, the value quantifies the inbreeding depression per unit of genomic inbreeding.
Vitezica et al. (2016) demonstrated how dominance models with normally distributed SNP effects can be transformed into equivalent dominance models with animal effects, whereby different covariance matrices are needed for the additive component and the dominance component of the animal effects. That is, if all SNP effects are normally distributed, then the SNP effects model can be replaced by the equivalent animal effects model
from which the SNP effects can be backsolved. Thereby, the animal effects satisfy , and , and so on. The joint covariance matrices of the animal effects are given in Christensen et al. (2019).
The SNP effects in Equation (7) were assumed to be line-dependent, which may be the case because the LD between SNP and QTL differs between lines. This may be neglected if the marker panel is sufficiently large. In this case, the SNP effects can assumed to be line-independent, and we obtain the simplified model
which we call the dominance model with line-independent effects.
Vitezica et al. (2013) emphasized that two different parameterizations of the dominance model exist. The first parameterization, which is given by Equation (6), is suitable for two-way crosses, and includes the additive and dominant SNP effects. In contrast, the second parameterization includes the allele substitution effects and the dominance deviations of the SNP. Both parameterizations are equivalent, but their interpretation is different.
Zeng et al. (2013) compared a Bayesian dominance model with the corresponding BSAM model and the corresponding ASGM model. A BayesCπ type method was used to estimate the marker effects, so the prior assumption was that the SNP effects are either zero, or come from a normal distribution. The comparison was done for a simulated two-way crossbreeding program. A number of 20 generations of selection was simulated with the aim to improve CP in both parental lines. The marker effects were estimated only once in generation one from crossbred animals and used in all subsequent generations. The simulated traits showed a different degree of dominance variance, ranging from “large” to “realistic,” or null. The dominance model was superior to the BSAM model and to the ASGM model. This superiority depended on the fraction of dominance and thus heterosis in the data, but even for situations where no dominance was simulated, the accuracy of the dominance model was similar to the additive model, indicating the robustness of the model. It can tentatively be concluded, that the use of a dominance model is in general advisable, even if dominance is not an important source of trait variability.
Xiang et al. (2016b) used a dominance model with line-dependent effects for a two-way cross and the parental breeds. The SNP effects were normally distributed, and the additive and dominance effects of the three different populations were correlated. The authors found that the increased predictive ability of the dominance model arose solely from capturing inbreeding depression. This suggests that dominance effects of individual QTL have not been captured. The reason may be that a 60K SNP panel is not sufficient for achieving high LD between markers and QTL, and that the normality assumption is unlikely to be fulfilled.
Esfandyari et al. (2016) compared a Bayesian dominance model with the corresponding Bayesian ASGM model at the example of litter size in a two-way pig cross, whereby BayesC of Habier et al. (2011) was used for prediction. Training was on the parental lines. The prediction accuracies for PP and CP obtained with the dominance model were both higher than those for PP obtained with the ASGM model.
All additive models for predicting CP rely on phenotypic data collected from crossbred animals. This can be problematic in situations where the crossbred animals are not individually identified and thus such data collection pipeline is not implemented. This is likely the case on many farms housing crossbred animals. While additive models require phenotypes from crossbred animals, this is not the case for dominance models because the breeding values for CP can be derived from additive and dominance effects that are predicted in the pure breed, and from the allele frequencies in the opposite breed. Esfandyari et al. (2015a) proposed therefore to use dominance models for selecting purebred animals for CP based on purebred phenotypic and genotypic information only. They did a simulation study and estimated the marker effects with Bayesian LASSO (Park and Casella, 2008; los Campos et al., 2009). The results showed that the gain in CP was higher when the purebreds were selected for CPs, which demonstrated the feasibility of the method even when no crossbred data is available. Moreover, combining several related lines into a single reference population increased the prediction accuracy. However, as shown by Esfandyari et al. (2015b), training on crossbred animals leads to a higher selection response than training on purebred animals. A likely explanation is, that the level of heterozygosity was higher than in the purebred data.
Although genomic selection for CP is a promising strategy to increase selection response for CP in the short and medium term, Esfandyari et al. (2018) found that genomic selection for CP leads eventually to lower CP in the long term than genomic selection on PP. This hold regardless of whether training was on purebred or crossbred animals.
Dominance effects, as well as additive effects may depend on the breed of origin, which may be due to imprinting or breed complementarity. It could therefore be advantageous to account for imprinting explicitly. A dominance model with imprinting needs to distinguish between the paternal and the maternal allele. If an animal has received allele A1 from line and allele A2 from line , then we denote its genotype as A1A2. The centered indicator matrix for genotype A1A2 is given by
where equals one, if animal i from cross has genotype A1A2 at SNP m, and is the proportion of animals from cross that have this genotype at SNP m.
The dominance model with imprinting assumes that the vector with genotypic values of the crossbred animals has the representation
where is the population mean, vectors and contain breed-of-origin dependent additive effects, and vectors and contain breed-of-origin dependent dominance effects. The model equation for the crossbred animals becomes
If imprinting in the parental lines is neglected, then the model equations for the parental lines remain as in Equation (7). The vector with allele substitution effects for CP of line is in this case
where is the vector with allele frequencies in the opposite line. The proof is given in the Supplementary Material. When the SNP effects in the cross do not depend on the breed of origin, then the model simplifies, and becomes identical to the dominance model with line-dependent effects.
Nishio and Satoh (2015) proposed two alternative parameterizations for models with dominance and imprinting and fitted them by assuming normally distributed SNP effects. Their first model includes an additive effect, a dominance effect, and an imprinting effect for the heterozygous genotype, while their second model includes a paternal and a maternal gametic effect, and a dominance effect. The models provided in a simulation study more accurate estimates of genotypic values than GBLUP. While the models of Nishio and Satoh (2015) have the advantage that only 3 effects are needed in the equivalent SNP model for modeling the contribution of each SNP to the genotypic value of an animal, the model in Equation (9) has the advantage that more rigorous prior assumptions can be made for the joint distribution of the effects. That is, if the paternal lines are closely related, then the additive effects and could assumed to be a priori highly correlated, as well as the dominance effects and . However, the parameterization does not allow to predict the vectors and individually.
Esfandyari et al. (2015b) compared in a simulation study a Bayesian dominance model with imprinting with the corresponding dominance model with line-independent effects, but used a different parameterization. The model considered imprinting because it included a separate effect for each phased genotype. Compared to the model proposed above, it has the disadvantage that the effects have no direct interpretation as additive and dominance effects. The genetic effects of the parental breeds were a priori independent. Even though the authors did not simulate imprinting, they found that the dominance model with imprinting was superior, if the reference population was sufficiently large, and if both lines were not closely related. The reason may be that the LD between markers and QTL was different in the cross and in the parental lines, so the additive effects and dominance effects were population-dependent.
In this paper, genomic models for the analysis of discontinuous crossbred data were reviewed. Compared to purebred genomic models, the reviewed models were of much higher complexity due to the inclusion of dominance effects, breed-specific effects, imprinting effects, and the use of PP and/or CP data. In the following some additional aspects regarding the distribution of the SNP effects and the model choice are considered.
The normal distribution is the most common assumption about the distribution of SNP effects. Such models have the advantage, that they have an equivalent representation as animal models with genomic covariance matrices for which fast solvers exist, such as DMU (Madsen et al., 2010), WOMBAT (Meyer, 2007), ASReml (Gilmour et al., 2009), blupf90 (Misztal, 1999), or MiX99 (Vuori et al., 2006). Although the assumption of a normal distribution is not likely to be fulfilled when large marker panels are used, the experience with purebred data suggest that the reliabilities of the breeding values are only slightly worse than those obtained with non-normally distributed marker effects. However, the situation in crossbreeding is different because the parental lines are commonly distantly related, and it may be envisaged to evaluate all lines simultaneously in order to increase the reliabilities of the breeding values. This requires that all QTL are in high LD with at least one marker, which implies the necessity to use a large marker panel. However, if the marker panel is large, then only few markers are needed to capture the effect of any QTL. Consequently, the true effects of most markers are actually zero. The model for genomic selection should account for this and assume as a prior distribution for the SNP effects a mixture of two distributions. One component provides the distribution for markers that are in strong LD with a QTL, and the other one is actually zero. In this case, a random-variable γm is commonly introduced, which indicates whether the effects of an SNP m are different from zero. Well-known examples are BayesB (Meuwissen et al., 2001), BayesC (Habier et al., 2011), and BayesR (Erbe et al., 2012). Such algorithms are usually implemented with MCMC algorithms, which results in long computation times. However, alternative and faster implementations are available for some models (e.g., Meuwissen, 2009; Shepherd et al., 2010).
For models with additive and dominance effects, an important aspect is, whether these effects are a priori independent or not. It may be advantageous to assume that all effects of a particular SNP m are of the same order of magnitude. This is possible if all effects of a particular SNP m have conditionally on the common covariance matrix a normal distribution, where -χ2(v, s) and Σ is an appropriately chosen covariance matrix. For the dominance model with line-dependent effects, this means that
It can be shown that in this case, all effects of SNP m would have for γm = 1 a t-distribution with v degrees of freedom, and are for γm = 0 equal to zero. Moreover, the magnitude of the effect size would be similar for all effects of a given SNP m, which reduces the proportion of overdominant SNP. Developing a fast algorithm for such a model is an area for future research.
The most suitable model for a breeding program depends on the achievable accuracies for the breeding values of the selection candidates, and on the available data. Among the additive models, the parental model provided the least accurate predictions for CP, which is because the Mendelian sampling terms are part of the residual and can therefore not be utilized for prediction. It has, however, the advantage that the crossbred animals do not need to be genotyped and may therefore be suitable for animals with low economic value.
The BSAM and ASGM models provided similar results in most cases. The BSAM model, however, needs the trace of the alleles from the purebred parent breed to the crossbred end product, which is a source of potential errors. This might even be more a problem when more complex crossbred structures are involved, e.g., three- or four-way crossbred data. Vandenplas et al. (2016) and Sevillano et al. (2016) developed a statistical pipeline for this purpose and applied it to a three-way crossbred pig data set.
The reviewed papers suggest that the dominance models provide more accurate genomic breeding values for CP than the additive models. Although Xiang et al. (2016b) showed that this gain in accuracy results in the case of normally distributed SNP effects almost solely from capturing inbreeding depression, this may be not the case when large marker panels and appropriate Bayesian models are used for evaluation. Dominance models have the additional advantage that breeding values for crossbred performance can be obtained from purebred animals, so phenotyping and genotyping crossbred individuals may not be necessary. However, as shown by Esfandyari et al. (2015b), the accuracy of the breeding values can be increased when phenotyped and genotyped crossbred individuals are included in the reference population.
Three different dominance models have been applied to crossbred data, which are the dominance model with line-independent effects, the dominance model with line-dependent effects, and the dominance model with imprinting. The dominance model with line-dependent effects is likely to be inferior to the model with line-independent effects if the SNP effects of the different lines are falsely assumed to be statistically independent, the reference population is small, and the lines are closely related. This could be avoided by specifying a covariance between the SNP effects of the different lines.
When imprinting is relevant, then a dominance model with imprinting is of interest. For example, Jiang et al. (2017) found that there is substantial imprinting for reproduction traits in dairy cattle. The application of imprinting models requires that the crossbred animals are genotyped and that the alleles are traced from the parental lines to the crossbred animals. Unfortunately, to the best of our knowledge, these models are not well-analyzed yet. More research should be done in this area, which includes to analyze all models with common data sets.
Genomic models for crossbred data are of much higher complexity than models for purebred data, which results from the inclusion of dominance effects, breed-specific effects, imprinting effects, and from the joint evaluation of PP and CP. Although much research has already been done to develop genomic models for crossbred data, it can be expected that further progress can be made by developing statistical models that include all the different genetic effects in a single model, assume realistic covariance structures between the genetic effects of different breeding lines, use large marker panels, and assume realistic distributions for the SNP effects. The comparisons made in the reviewed papers are not sufficiently comprehensive to come to a clear recommendation as to which existing method is most suitable for a specific breeding program and a specific genetic trait architecture. Some papers suggested a superiority of dominance models. In the reviewed papers, the focus was on discontinuous crossbreeding schemes. This was because, to our best knowledge, no genomic models have been published that are specifically designed for continuous crossbreeding schemes.
RW did the formal model comparison. JS, RW, and JB wrote the paper. DH contributed to the writing. All authors contributed to the article and approved the submitted version.
This work was financially supported by the German Federal Ministry of Food and Agriculture (BMEL) through the Federal Office for Agriculture and Food (BLE), grant number 2817ERA10D. The project has received funding from the European Union's Horizon 2020 Research and Innovation Program under grant agreement no. 696231 - ReDiverse (Biodiversity within and between European Red Dairy Breeds). JS was partly supported by the H. Wilhelm Schaumann Foundation, Hamburg, Germany, which is gratefully acknowledged.
The authors declare that the research was conducted in the absence of any commercial or financial relationships that could be construed as a potential conflict of interest.
The manuscript has benefitted from the critical and helpful comments of the reviewers.
The Supplementary Material for this article can be found online at: https://www.frontiersin.org/articles/10.3389/fgene.2020.00568/full#supplementary-material
Aguilar, I., Misztal, I., Johnson, D. L., Legarra, A., Tsuruta, S., and Lawlor, T. J. (2010). Hot topic: a unified approach to utilize phenotypic, full pedigree, and genomic information for genetic evaluation of Holstein final score. J. Dairy Sci. 93, 743–752. doi: 10.3168/jds.2009-2730
Azevedo, C. F., de Resende, M. D. V., E Silva, F. F., Viana, J. M. S., Valente, M. S. F., Resende, M. F. R., et al. (2015). Ridge, lasso and bayesian additive-dominance genomic models. BMC Genet. 16:105. doi: 10.1186/s12863-015-0264-2
Buckley, F., Lopez-Villalobos, N., and Heins, B. J. (2014). Crossbreeding: implications for dairy cow fertility and survival. Anim. Int. J. Anim. Biosci. 8(Suppl. 1), 122–133. doi: 10.1017/S1751731114000901
Christensen, O. F., and Lund, M. S. (2010). Genomic prediction when some animals are not genotyped. Genet. Sel. Evol. 42:2. doi: 10.1186/1297-9686-42-2
Christensen, O. F., Madsen, P., Nielsen, B., and Su, G. (2014). Genomic evaluation of both purebred and crossbred performances. Genet. Sel. Evol. 46:23. doi: 10.1186/1297-9686-46-23
Christensen, O. F., Nielsen, B., Su, G., Xiang, T., Madsen, P., Ostersen, T., et al. (2019). A bivariate genomic model with additive, dominance and inbreeding depression effects for sire line and three-way crossbred pigs. Genet. Sel. Evol. 51:45. doi: 10.1186/s12711-019-0486-2
Dekkers, J. C. M. (2007). Marker-assisted selection for commercial crossbred performance. J. Anim. Sci. 85, 2104–2114. doi: 10.2527/jas.2006-683
Duenk, P., Calus, M. P. L., Wientjes, Y. C. J., Breen, V. P., Henshall, J. M., Hawken, R., et al. (2019). Estimating the purebred-crossbred genetic correlation of body weight in broiler chickens with pedigree or genomic relationships. Genet. Sel. Evol. 51:6. doi: 10.1186/s12711-019-0447-9
Erbe, M., Hayes, B. J., Matukumalli, L. K., Goswami, S., Bowman, P. J., Reich, C. M., et al. (2012). Improving accuracy of genomic predictions within and between dairy cattle breeds with imputed high-density single nucleotide polymorphism panels. J. Dairy Sci. 95, 4114–4129. doi: 10.3168/jds.2011-5019
Esfandyari, H., Berg, P., and Sørensen, A. C. (2018). Balanced selection on purebred and crossbred performance increases gain in crossbreds. Genet. Sel. Evol. 50:8. doi: 10.1186/s12711-018-0379-9
Esfandyari, H., Bijma, P., Henryon, M., Christensen, O. F., and Sørensen, A. C. (2016). Genomic prediction of crossbred performance based on purebred landrace and yorkshire data using a dominance model. Genet. Sel. Evol. 48:40. doi: 10.1186/s12711-016-0220-2
Esfandyari, H., Sørensen, A. C., and Bijma, P. (2015a). Maximizing crossbred performance through purebred genomic selection. Genet. Sel. Evol. 47:16. doi: 10.1186/s12711-015-0099-3
Esfandyari, H., Sørensen, A. C., and Bijma, P. (2015b). A crossbred reference population can improve the response to genomic selection for crossbred performance. Genet. Sel. Evol. 47:76. doi: 10.1186/s12711-015-0155-z
Fernando, R. L., Dekkers, J. C., and Garrick, D. J. (2014). A class of bayesian methods to combine large numbers of genotyped and non-genotyped animals for whole-genome analyses. Genet. Sel. Evol. 46:50. doi: 10.1186/1297-9686-46-50
Freyer, G., König, S., Fischer, B., Bergfeld, U., and Cassell, B. G. (2008). Invited review: crossbreeding in dairy cattle from a German perspective of the past and today. J. Dairy Sci. 91, 3725–3743. doi: 10.3168/jds.2008-1287
Gianola, D. (2013). Priors in whole-genome regression: the bayesian alphabet returns. Genetics 194, 573–596. doi: 10.1534/genetics.113.151753
Gilmour, A. R., Gogel, B. J., Cullis, B. R., and Thompson, R. (2009). AS-Reml User Guide. Release 3.0. VSN International. Hemel Hempstead.
Goddard, M. E. (2009). Genomic selection: prediction of accuracy and maximisation of long term response. Genetica 136, 245–257. doi: 10.1007/s10709-008-9308-0
Habier, D., Fernando, R. L., Kizilkaya, K., and Garrick, D. J. (2011). Extension of the bayesian alphabet for genomic selection. BMC Bioinformatics 12:186. doi: 10.1186/1471-2105-12-186
Hartwig, S., Wellmann, R., Emmerling, R., Hamann, H., and Bennewitz, J. (2015). Short communication: importance of introgression for milk traits in the German vorderwald and hinterwald cattle. J. Dairy Sci. 98, 2033–2038. doi: 10.3168/jds.2014-8571
Hartwig, S., Wellmann, R., Hamann, H., and Bennewitz, J. (2014). The contribution of migrant breeds to the genetic gain of beef traits of German vorderwald and hinterwald cattle. J. Anim. Breed. Genet. 131, 496–503. doi: 10.1111/jbg.12099
Ibánez-Escriche, N., Fernando, R. L., Toosi, A., and Dekkers, J. C. M. (2009). Genomic selection of purebreds for crossbred performance. Genet. Sel. Evol. 41:12. doi: 10.1186/1297-9686-41-12
Jiang, J., Shen, B., O'Connell, J. R., VanRaden, P. M., Cole, J. B., and Ma, L. (2017). Dissection of additive, dominance, and imprinting effects for production and reproduction traits in holstein cattle. BMC Genomics 18:425. doi: 10.1186/s12864-017-3821-4
Legarra, A., Aguilar, I., and Misztal, I. (2009). A relationship matrix including full pedigree and genomic information. J. Dairy Sci. 92, 4656–4663. doi: 10.3168/jds.2009-2061
Legarra, A., Christensen, O. F., Aguilar, I., and Misztal, I. (2014). Single Step, a general approach for genomic selection. Livest. Sci. 166, 54–65. doi: 10.1016/j.livsci.2014.04.029
Lopes, M. S., Bovenhuis, H., Hidalgo, A. M., van Arendonk, J. A. M., Knol, E. F., and Bastiaansen, J. W. M. (2017). Genomic selection for crossbred performance accounting for breed-specific effects. Genet. Sel. Evol. 49:51. doi: 10.1186/s12711-017-0328-z
Lopez-Villalobos, N., Garrick, D. J., Holmes, C. W., Blair, H. T., and Spelman, R. J. (2000). Profitabilities of some mating systems for dairy herds in New Zealand. J. Dairy Sci. 83, 144–153. doi: 10.3168/jds.S0022-0302(00)74865-X
los Campos, G., de, Naya, H., Gianola, D., Crossa, J., Legarra, A., Manfredi, E., et al. (2009). Predicting quantitative traits with regression models for dense molecular markers and pedigree. Genetics 182, 375–385. doi: 10.1534/genetics.109.101501
MacLeod, I. M., Bowman, P. J., Vander Jagt, C. J., Haile-Mariam, M., Kemper, K. E., Chamberlain, A. J., et al. (2016). Exploiting biological priors and sequence variants enhances QTL discovery and genomic prediction of complex traits. BMC Genom. 17:144. doi: 10.1186/s12864-016-2443-6
Madsen, P., Su, G., Labouriau, R., and Christensen, F. (2010). “DMU-a package for analyzing multivariate mixed models,” in Proceedings of 9th World Congress on Genetics Applied to Livestock Production (Leipzig: Gesellschaft für Tierzuchtwissenschaft e.V). 137
Meuwissen, T. H., Hayes, B. J., and Goddard, M. E. (2001). Prediction of total genetic value using genome-wide dense marker maps. Genetics 157, 1819–1829.
Meuwissen, T. H. E. (2009). Accuracy of breeding values of 'unrelated' individuals predicted by dense SNP genotyping. Genet. Sel. Evol. 41:35. doi: 10.1186/1297-9686-41-35
Meyer, K. (2007). WOMBAT-A tool for mixed model analyses in quantitative genetics by restricted maximum likelihood (REML). J. Zhejiang Univ. Sci. B 8, 815–821. doi: 10.1631/jzus.2007.B0815
Misztal, I. (1999). “Complex models, more data: simpler programming?,” in Interbull Proceedings of the Interbull Workshop Computers and Cattle Breeds (Tuusala: Interbull Bulletin 20), 33–42.
Nishio, M., and Satoh, M. (2015). Genomic best linear unbiased prediction method including imprinting effects for genomic evaluation. Genet. Sel. Evol. 47:32. doi: 10.1186/s12711-015-0091-y
Park, T., and Casella, G. (2008). The bayesian lasso. J. Am. Stat. Assoc. 103, 681–686. doi: 10.1198/016214508000000337
Samorè, A. B., and Fontanesi, L. (2016). Genomic selection in pigs: state of the art and perspectives. Ital. J. Anim. Sci. 15, 211–232. doi: 10.1080/1828051X.2016.1172034
Sevillano, C. A., Bovenhuis, H., and Calus, M. P. L. (2019). Genomic evaluation for a crossbreeding system implementing breed-of-origin for targeted markers. Front. Genet. 10:418. doi: 10.3389/fgene.2019.00418
Sevillano, C. A., Vandenplas, J., Bastiaansen, J. W. M., and Calus, M. P. L. (2016). Empirical determination of breed-of-origin of alleles in three-breed cross pigs. Genet. Sel. Evol. 48:55. doi: 10.1186/s12711-016-0234-9
Shepherd, R. K., Meuwissen, T. H. E., and Woolliams, J. A. (2010). Genomic selection and complex trait prediction using a fast EM algorithm applied to genome-wide markers. BMC Bioinformatics 11:529. doi: 10.1186/1471-2105-11-529
Sørensen, M. K., Norberg, E., Pedersen, J., and Christensen, L. G. (2008). Invited review: crossbreeding in dairy cattle: a danish perspective. J. Dairy Sci. 91, 4116–4128. doi: 10.3168/jds.2008-1273
Strandén, I., and Christensen, O. F. (2011). Allele coding in genomic evaluation. Genet. Sel. Evol. 43:25. doi: 10.1186/1297-9686-43-25
Su, G., Christensen, O. F., Ostersen, T., Henryon, M., and Lund, M. S. (2012). Estimating additive and non-additive genetic variances and predicting genetic merits using genome-wide dense single nucleotide polymorphism markers. PLoS ONE 7:e45293. doi: 10.1371/journal.pone.0045293
Tusell, L., Gilbert, H., Riquet, J., Mercat, M.-J., Legarra, A., and Larzul, C. (2016). Pedigree and genomic evaluation of pigs using a terminal-cross model. Genet. Sel. Evol. 48:32. doi: 10.1186/s12711-016-0211-3
van Grevenhof, I. E. M., and van der Werf, J. H. J. (2015). Design of reference populations for genomic selection in crossbreeding programs. Genet. Sel. Evol. 47:14. doi: 10.1186/s12711-015-0104-x
Vandenplas, J., Calus, M. P. L., Sevillano, C. A., Windig, J. J., and Bastiaansen, J. W. M. (2016). Assigning breed origin to alleles in crossbred animals. Genet. Sel. Evol. 48:61. doi: 10.1186/s12711-016-0240-y
Vandenplas, J., Windig, J. J., and Calus, M. P. L. (2017). Prediction of the reliability of genomic breeding values for crossbred performance. Genet. Sel. Evol. 49:43. doi: 10.1186/s12711-017-0318-1
VanRaden, P. M. (2008). Efficient methods to compute genomic predictions. J. Dairy Sci. 91, 4414–4423. doi: 10.3168/jds.2007-0980
Varona, L., Legarra, A., Toro, M. A., and Vitezica, Z. G. (2018). Non-additive effects in genomic selection. Front. Genet. 9:78. doi: 10.3389/fgene.2018.00078
Vitezica, Z. G., Varona, L., Elsen, J.-M., Misztal, I., Herring, W., and Legarra, A. (2016). Genomic BLUP including additive and dominant variation in purebreds and F1 crossbreds, with an application in pigs. Genet. Sel. Evol. 48:6. doi: 10.1186/s12711-016-0185-1
Vitezica, Z. G., Varona, L., and Legarra, A. (2013). On the additive and dominant variance and covariance of individuals within the genomic selection scope. Genetics 195, 1223–1230. doi: 10.1534/genetics.113.155176
Vuori, K., Strandén, I., Lidauer, M., and Mäntysaari, E. A. (2006). “MiX99 - effectivesolver for large and complex linear mixed models,” in Proceedings of 8th World Congress on Genetics Applied to Livestock Production (Belo Horizonte: Instituto Prociência), 27–33.
Wei, M., and van der Werf, J. H. (1995). Genetic correlation and heritabilities for purebred and crossbred performance in poultry egg production traits. J. Anim. Sci. 73, 2220–2226. doi: 10.2527/~(1995).7382220x
Wei, M., and van der Werf, J. H. J. (1994). Maximizing genetic response in crossbreds using both purebred and crossbred information. Anim. Sci. 59, 401–413. doi: 10.1017/S0003356100007923
Wellmann, R., and Bennewitz, J. (2012). Bayesian models with dominance effects for genomic evaluation of quantitative traits. Genet. Res. 94, 21–37. doi: 10.1017/S0016672312000018
Wientjes, Y. C. J., and Calus, M. P. L. (2017). Board invited review: the purebred-crossbred correlation in pigs: a review of theory, estimates, and implications. J. Anim. Sci. 95, 3467–3478. doi: 10.2527/jas2017.1669
Xiang, T., Christensen, O. F., Vitezica, Z. G., and Legarra, A. (2016b). Genomic evaluation by including dominance effects and inbreeding depression for purebred and crossbred performance with an application in pigs. Genet. Sel. Evol. 48:92. doi: 10.1186/s12711-016-0271-4
Xiang, T., Nielsen, B., Su, G., Legarra, A., and Christensen, O. F. (2016a). Application of single-step genomic evaluation for crossbred performance in pig. J. Anim. Sci. 94, 936–948. doi: 10.2527/jas.2015-9930
Zeng, J., Toosi, A., Fernando, R. L., Dekkers, J. C. M., and Garrick, D. J. (2013). Genomic selection of purebred animals for crossbred performance in the presence of dominant gene action. Genet. Sel. Evol. 45:11. doi: 10.1186/1297-9686-45-11
Keywords: genomic selection, genomic models, livestock, crossbreeding, heterosis
Citation: Stock J, Bennewitz J, Hinrichs D and Wellmann R (2020) A Review of Genomic Models for the Analysis of Livestock Crossbred Data. Front. Genet. 11:568. doi: 10.3389/fgene.2020.00568
Received: 19 February 2020; Accepted: 11 May 2020;
Published: 26 June 2020.
Edited by:
Xiao-Lin Wu, University of Wisconsin-Madison, United StatesReviewed by:
Fabyano Fonseca Silva, Universidade Federal de Viçosa, BrazilCopyright © 2020 Stock, Bennewitz, Hinrichs and Wellmann. This is an open-access article distributed under the terms of the Creative Commons Attribution License (CC BY). The use, distribution or reproduction in other forums is permitted, provided the original author(s) and the copyright owner(s) are credited and that the original publication in this journal is cited, in accordance with accepted academic practice. No use, distribution or reproduction is permitted which does not comply with these terms.
*Correspondence: Robin Wellmann, ci53ZWxsbWFubkB1bmktaG9oZW5oZWltLmRl
Disclaimer: All claims expressed in this article are solely those of the authors and do not necessarily represent those of their affiliated organizations, or those of the publisher, the editors and the reviewers. Any product that may be evaluated in this article or claim that may be made by its manufacturer is not guaranteed or endorsed by the publisher.
Research integrity at Frontiers
Learn more about the work of our research integrity team to safeguard the quality of each article we publish.