 Haritha Bollinedi1
 Ashutosh Kumar Yadav1
 K. K. Vinod1
 S. Gopala Krishnan1
 Prolay Kumar Bhowmick1
 M. Nagarajan2
 C. N. Neeraja3
 Ranjith Kumar Ellur1
 Ashok Kumar Singh1*
- 1Division of Genetics, ICAR-Indian Agricultural Research Institute, New Delhi, India
- 2ICAR-Indian Agricultural Research Institute, Rice Breeding and Genetics Research Centre, Aduthurai, India
- 3ICAR-Indian Institute of Rice Research, Hyderabad, India
Micronutrient malnutrition due to Fe and Zn, affects around two billion people globally particularly in the developing countries. More than 90% of the Asian population is dependent on rice-based diets, which is low in these micronutrients. In the present study, a set of 192 Indian rice germplasm accessions, grown at two locations, were evaluated for Fe and Zn in brown rice (BR) and milled rice (MR). A significant variation was observed in the rice germplasm for these micronutrients. The grain Fe concentration was in the range of 6.2–23.1 ppm in BR and 0.8–12.3 ppm in MR, while grain Zn concentration was found to be in the range of 11.0–47.0 ppm and 8.2–40.8 ppm in the BR and MR, respectively. Grain Fe exhibited maximum loss upon milling with a mean retention of 24.9% in MR, while Zn showed a greater mean retention of 74.2% in MR. A genome-wide association study (GWAS) was carried out implementing the FarmCPU model to control the population structure and kinship, and resulted in the identification of 29 marker-trait associations (MTAs) with significant associations for traits viz. FeBR (6 MTAs), FeMR (7 MTAs), ZnBR (11 MTAs), and ZnMR (5 MTAs), which could explain the phenotypic variance from 2.1 to as high as 53.3%. The MTAs governing the correlated traits showed co-localization, signifying the possibility of their simultaneous improvement. The robust MTAs identified in the study could be valuable resource for enhancing Fe and Zn concentration in the rice grain and addressing the problem of Fe and Zn malnutrition among rice consumers.
Introduction
In the human body, iron (Fe) and zinc (Zn) are the two most abundant trace minerals. An average adult human with a body weight of 65 kg has about 3–4 g of Fe and 1.5–2.5 g of Zn (King et al., 2006; Wood et al., 2006). Fe is essential for the synthesis of oxygen-transporting proteins viz. hemoglobin and myoglobin and is also an integral part of the enzymes involved in energy production and the maintenance of immune functions (Roeser, 1986; Stoltzfus, 2001). Zn is a pre-requisite for biological functions like gene expression, cell division, cell development, reproduction, and immunity (Brown et al., 2001, 2004). Fe and Zn are commonly viewed together in human nutrition, as they can be obtained through common dietary sources, and their absorption or inhibition is believed to be affected by similar factors (Lim et al., 2013). Fe deficiency in humans is related to increased risk of maternal mortality, anemia, premature births, low birth weight, and impaired cognitive and motor development (Bouis, 2003). Severe or clinical Zn deficiency is a condition associated with short stature, immune system dysfunction, hypogonadism, skin disorders, anorexia, delayed wound healing, skeletal abnormalities, and cognitive dysfunction (Prasad, 1991; Salgueiro et al., 2000).
Micronutrient malnutrition popularly known as “hidden hunger,” primarily attributed to Zn and Fe deficiency, is evolving as a global pandemic with serious health effects. The situation is more grim in developing countries and has become a fundamental limitation in achieving the Sustainable Development Goals (SDGs) in these countries. Mineral deficiency disorders caused by Fe and Zn deficiency are the primary reasons for the reduced work productivity in developing countries, which further affects the gross national product. Fe deficiency is recognized as the most widespread nutritional disorder with about 1.6 billion people suffering from iron deficiency anemia (IDA) globally. Additionally, Zn deficiency is ranked as the 5th major health risk factor in developing countries, affecting nearly two billion people worldwide (Zhang et al., 2018). The loss incurred due to Zn deficiency amounts to almost 16 million global disability-adjusted life years (DALYs) (Caulfield et al., 2004; Black et al., 2008).
The dietary habit of the majority of the population in developing countries as well as of a significant portion of the world populace is cereal based. In general, cereal foods are low in micronutrient content, especially when grains are consumed after extensive processing. Further, when cereal based diets are not balanced with other supplementary food items, there can be a severe deficiency of micronutrient nutrition leading to hidden hunger. Although the grain Fe and Zn concentrations in the brown rice (BR) of the modern-day high yielding rice cultivars are in the range of 6.3–24.4 mg/kg and 15.3–58.4 mg/kg, respectively (Gregorio et al., 2000), much of which are lost upon polishing, retaining a maximum of 2 mg/kg of Fe and 12 mg/kg of Zn in the grains that are consumed (Pradhan et al., 2020). Therefore, genetic fortification of rice grain becomes the most viable solution to address the challenge of micronutrient malnutrition. To begin with, identification of molecular players affecting the mineral uptake and transport, and understanding the genes and pathways governing mineral homeostasis and localization, would assist in devising targeted breeding strategies for biofortification.
A genome-wide association study (GWAS) provides an opportunity to utilize the tremendous genetic diversity of rice preserved among the landraces, to unravel the molecular mechanisms of complex traits, like mineral uptake and their grain accumulation. The method uses numerous historic recombination in a large natural population that offers the potential to localize the trait genetic determinants effectively to a narrower region. Further, application of single nucleotide polymorphism (SNP) in a GWAS study provides dense coverage of the entire genome, which would help identify the functional variation governing the trait. We used a diverse set of 192 rice germplasm accessions including landraces, popular varieties, Basmati accessions, and breeding lines collected from all over India in a GWAS to analyze the morphological variation for grain Fe and Zn content across two diverse locations, and to identify the marker-trait associations (MTAs)/genomic regions associated with Fe and Zn content in rice grain, and elite parents that can serve as donors in rice biofortification programs.
Materials and Methods
Plant Material and Field Experiment
The study comprised of an association mapping panel of 192 rice accessions collected from different parts of India and maintained at the Division of Genetics, ICAR-Indian Agricultural Research Institute (ICAR-IARI), New Delhi, India. The complete set of genotypes were evaluated at two locations viz. the ICAR-IARI farm (28.04°N; 77.12°E, 228 m) in New Delhi during the wet season (WS) of 2017, and the Rice Breeding and Genetics Research Centre (RBGRC) farm (11° 00′N; 79° 28′E, 19.5 m) in Aduthurai, Tamil Nadu during the dry season (DS) of 2017–2018. The soils from the IARI farm are of a sandy loam type with a pH of 7.4–7.8 with an average available Fe and Zn content of 12.3 and 3.3 mg/kg, respectively, while the soils from Aduthurai are typical haplusterts with a pH of 7.2 and mean available Fe and Zn content of 12.5 and 0.7 mg/kg, respectively. An augmented randomized complete block design was adopted for field evaluation. Similar agronomic practices were followed at both locations. The seeds were germinated on a raised seedbed to ensure uniform germination, and 28-day old seedlings were transplanted into a puddled rice field. Each genotype was planted in two rows of 3 m length with a 20 cm spacing between rows and 15 cm between plants. The recommended package of practices was adopted to ensure good crop stand. At maturity, plants were selected from the middle of the rows, and the grains were harvested, threshed, and dried to a moisture content of ≤13% and stored in zip lock bags at room temperature until analysis.
Analysis of Grain Fe and Zn Concentration
Fe and Zn content of the samples was estimated in parts per million units (mg/kg) from both BR and milled rice (MR) using an energy dispersive X-ray fluorescence spectrometer (ED-XRF) (X-Supreme 8000, Oxford Instruments, CA, USA). Grain samples from each genotype was dehusked using a palm de-husker, and the BR was cleaned thoroughly and analyzed directly in ED-XRF. The samples were further milled in a non-ferrous, non-zinc rice polisher (Mini Lab Rice Polisher Model K-710, Krishi International, Hyderabad, India) to avoid contamination with the metals during polishing. The milled samples were further cleaned with a non-shredding tissue paper to remove all the residual bran, and whole grains were used for analysis in ED-XRF. Three independent samples drawn from the bulk sample were analyzed for Fe and Zn.
DNA Isolation and SNP Genotyping
Genomic DNA was isolated from the 192 germplasm accessions using young leaves at 30 days after transplanting by adopting the CTAB method (Murray and Thompson, 1980). The quality of the DNA was assessed on a 0.8% agarose gel and was further quantified using a nano-drop spectrophotometer (NanoDropTM 2000/2000c, Thermo Fisher Scientific, DE, United States). High throughput genotyping was carried out using a custom-designed 50 K SNP chip. The chip was based on single-copy genes, covering all 12 rice chromosomes with an average interval of fewer than 1 kb between adjacent SNP markers (Singh et al., 2015). DNA amplification, fragmentation, chip hybridization, single-base extension through DNA ligation, and signal amplification were carried out as detailed in Singh et al. (2015).
Population Structure and Linkage Disequilibrium Analyses
The number of subgroups in the association mapping panel was estimated using both a model-based approach using STRUCTURE 2.3.4 software (Pritchard et al., 2000) and principal component (PC) analysis. For the model-based analysis, a Bayesian model approach using an ancestry model of ADMIXTURE (Alexander et al., 2009) and a frequency model assuming correlated allele frequencies among the sub-populations was used. For this, a subset of 5,000 genome-wide SNP markers with minor allele frequency (MAF) ≥0.05 and missing data <20% was used. The analysis was run with an assumed number of subgroups (K) ranging from 1 to 10 and with each K replicated 10 times. For each run, 100,000 burn-in steps followed by 100,000 Markov Chain Monte Carlo simulations were implemented. The optimum number of K was determined according to Evanno et al. (2005) embedded in STRUCTURE HARVESTER (Earl and vonHoldt, 2012) by plotting the ad hoc statistic ΔK against the natural logarithms of probability data [LnP(K)]. PCA analysis, which was incorporated in the package “GAPIT” (genomic association and prediction integrated tool) running under R environment (Lipka et al., 2012) was used. A significant number of PCs that are adequate to explain the population structure were determined based on the scree plot generated by GAPIT. Tukey’s multiple comparison test was implemented to assess the significance of the difference in means of sub-populations. The extent of linkage disequilibrium between the SNP markers was analyzed by calculating the r2 values in TASSEL v5.2.20 (Bradbury et al., 2007). Only r2 values with p < 0.05 within each chromosome were considered for linkage disequilibrium (LD) decay analysis. Marker pairs were clustered into 5 kb bins, and the average r2 value of each bin was estimated and plotted against the distance. The physical distance at which the r2 value dropped to half of its average maximum value was considered an LD decay rate (Huang et al., 2010).
GWAS Analysis
For GWAS analysis, the data obtained from 50,000 SNP markers was filtered for MAF ≥0.05 and maximum missing sites per SNP <20% and maximum missing sites per genotype <20%. A total of 31,132 SNPs remained after filtering, and were used for further analysis. One accession was dropped from the analysis due to the poor quality of the genotypic data. The data was analyzed using multiple statistical models viz. general linear model (GLM), mixed linear model (MLM), and fixed and random model circulating probability unification (FarmCPU; Liu, 2015; Liu et al., 2016). The efficiency of these models in controlling the familial relatedness and population structure was assessed by comparing the quantile–quantile (Q–Q) plots obtained through plotting observed p-values against the expected values. In each case, significant MTAs were identified after a modified Bonferroni multiple test correction calculated from the reciprocal of total number of markers used for analysis [p < 3.21E-05; -log10(p) > 5.79]. The percentage of phenotypic variance explained (PVE) by individual SNP was calculated through the single-marker analysis.
Assessment of the Novelty of Identified MTAs
The novelty of MTAs identified in the study was determined through the comparison of the physical positions, with those of previously reported quantitative trait loci (QTLs) for Fe and Zn. In addition to the literature survey, the gramene QTL database1 and QTL annotation rice online database (QTARO)2 were searched to identify the physical locations of the previously reported QTLs. The candidate genes in the vicinity of the MTA region were determined using the genome browser of the Rice Annotation Project Database (RAP-DB)3.
Results
Population Structure
Model-based simulation of population structure showed a sharp peak at K = 3 when the number of clusters was plotted against ΔK, depicting the presence of three sub-populations in the panel (Figure 1A). The sub-populations are denoted as POP1, POP2, and POP3. Figure 1B shows a representative picture of the population structure in which each individual is indicated by a vertical bar, which is divided into segments based on its estimated membership fractions in sub-populations. POP2 was the largest and constituted 73.5% of the panel numbering 139 accessions, of which 74 were pure types (includes accessions with <5% of admixture) and 65 were admixture types. POP1 consisted of 35 accessions including 13 pure types and 22 admixture types. Unique landraces from the Jammu and Kashmir region like Begum, BalaKoan, Buta Baber, Mehvan, etc., were all included in POP1. In addition, it also consisted of aromatic rice accessions including the traditional Basmati varieties like Basmati 370, Super Basmati, Type 3 and short grain aromatic accessions like Kalanamak, Chittimutyalu, etc. All the evolved varieties like MTU1001, ADT 39, IR 70, MAS946-1, Improved Sabarmati, and breeding lines like PRR 109, PRR 127, etc., were grouped into POP2. POP3 is the smallest, with 15 accessions, of which six were pure types and the rest were admixture types. Two accessions, PDKV-Chinoor 2 and SAF 1221-83, were admixtures and were therefore not included in any of the sub-groups. The fixation index (Fst) was 0.74, 0.74, and 0.68 for the sub-populations POP1, POP2, and POP3, respectively, and the expected heterozygosity or the average distance between individuals within a sub-population was 0.15, 0.18, and 0.17. The allelic frequency divergence of POP1 from POP2 was 0.42, and from POP3 was 0.34, while between POP2 and POP3 it was 0.39. The PCA based lookout for the presence of structure in the population also indicated significance of three PCs in the population, explaining about 39.6% of total variation (Figure 1C). The scree plot (Figure 1D) showed that the first PC explained the highest variation of 26.7% followed by second and third PCs explaining 6.8 and 6.0% of the total variation, respectively. Admixture analysis revealed that about 53.60% of the accessions (103/192) showed 0–5% of admixture, 12% of the accessions (23/191) showed 5–20% of the admixture, while the remaining 34% of the accessions depicted >20% of the admixture. LD analysis in the association panel revealed a highest average r2 of 0.7 at shorter distance of 5 kb, and it decreased to half its value at around 350 kb (Figure 2).
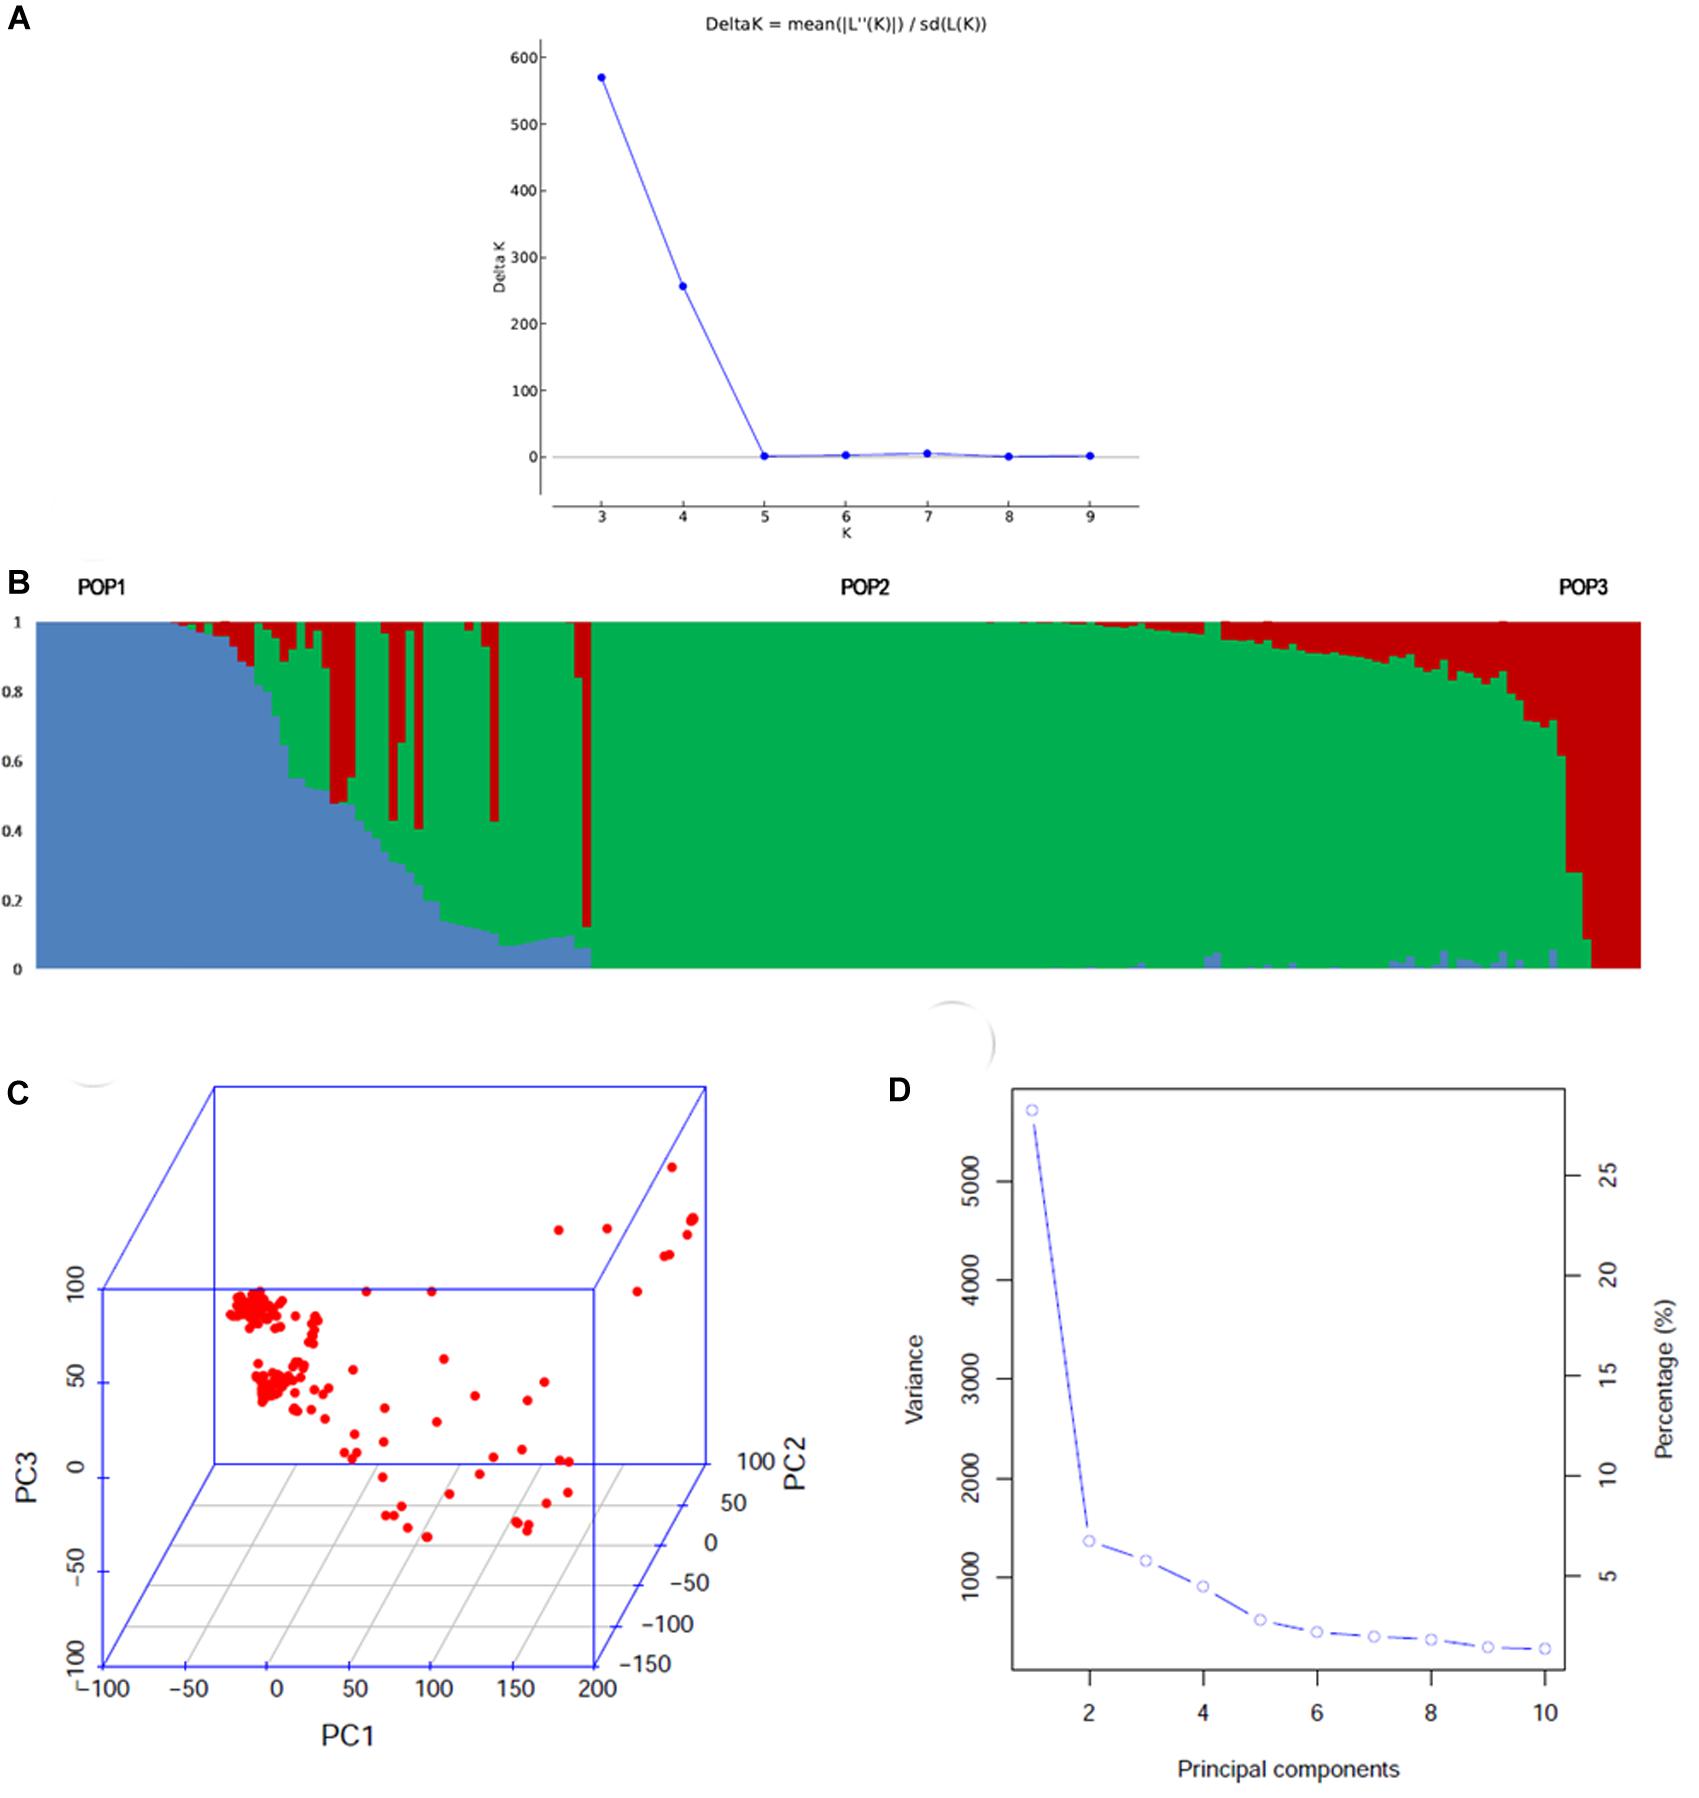
Figure 1. Population structure of the association mapping panel comprising of 192 genotypes analyzed by model based and PCA based approaches. (A) ΔK plot depicting three subgroups in the population by Evanno’s method. The highest ΔK was 580 at K = 3, (B) the bar plot showing the three sub-populations identified. POP2 was the largest and showed remarkable admixture with POP1. POP3 was the smallest group, which showed less admixing with POP1 (C) 3D graph depicting the distribution of accessions along the three PCs (D) scree plot depicting the number of significant PCs. There were three PCs that explained a cumulative variation of ∼40%.
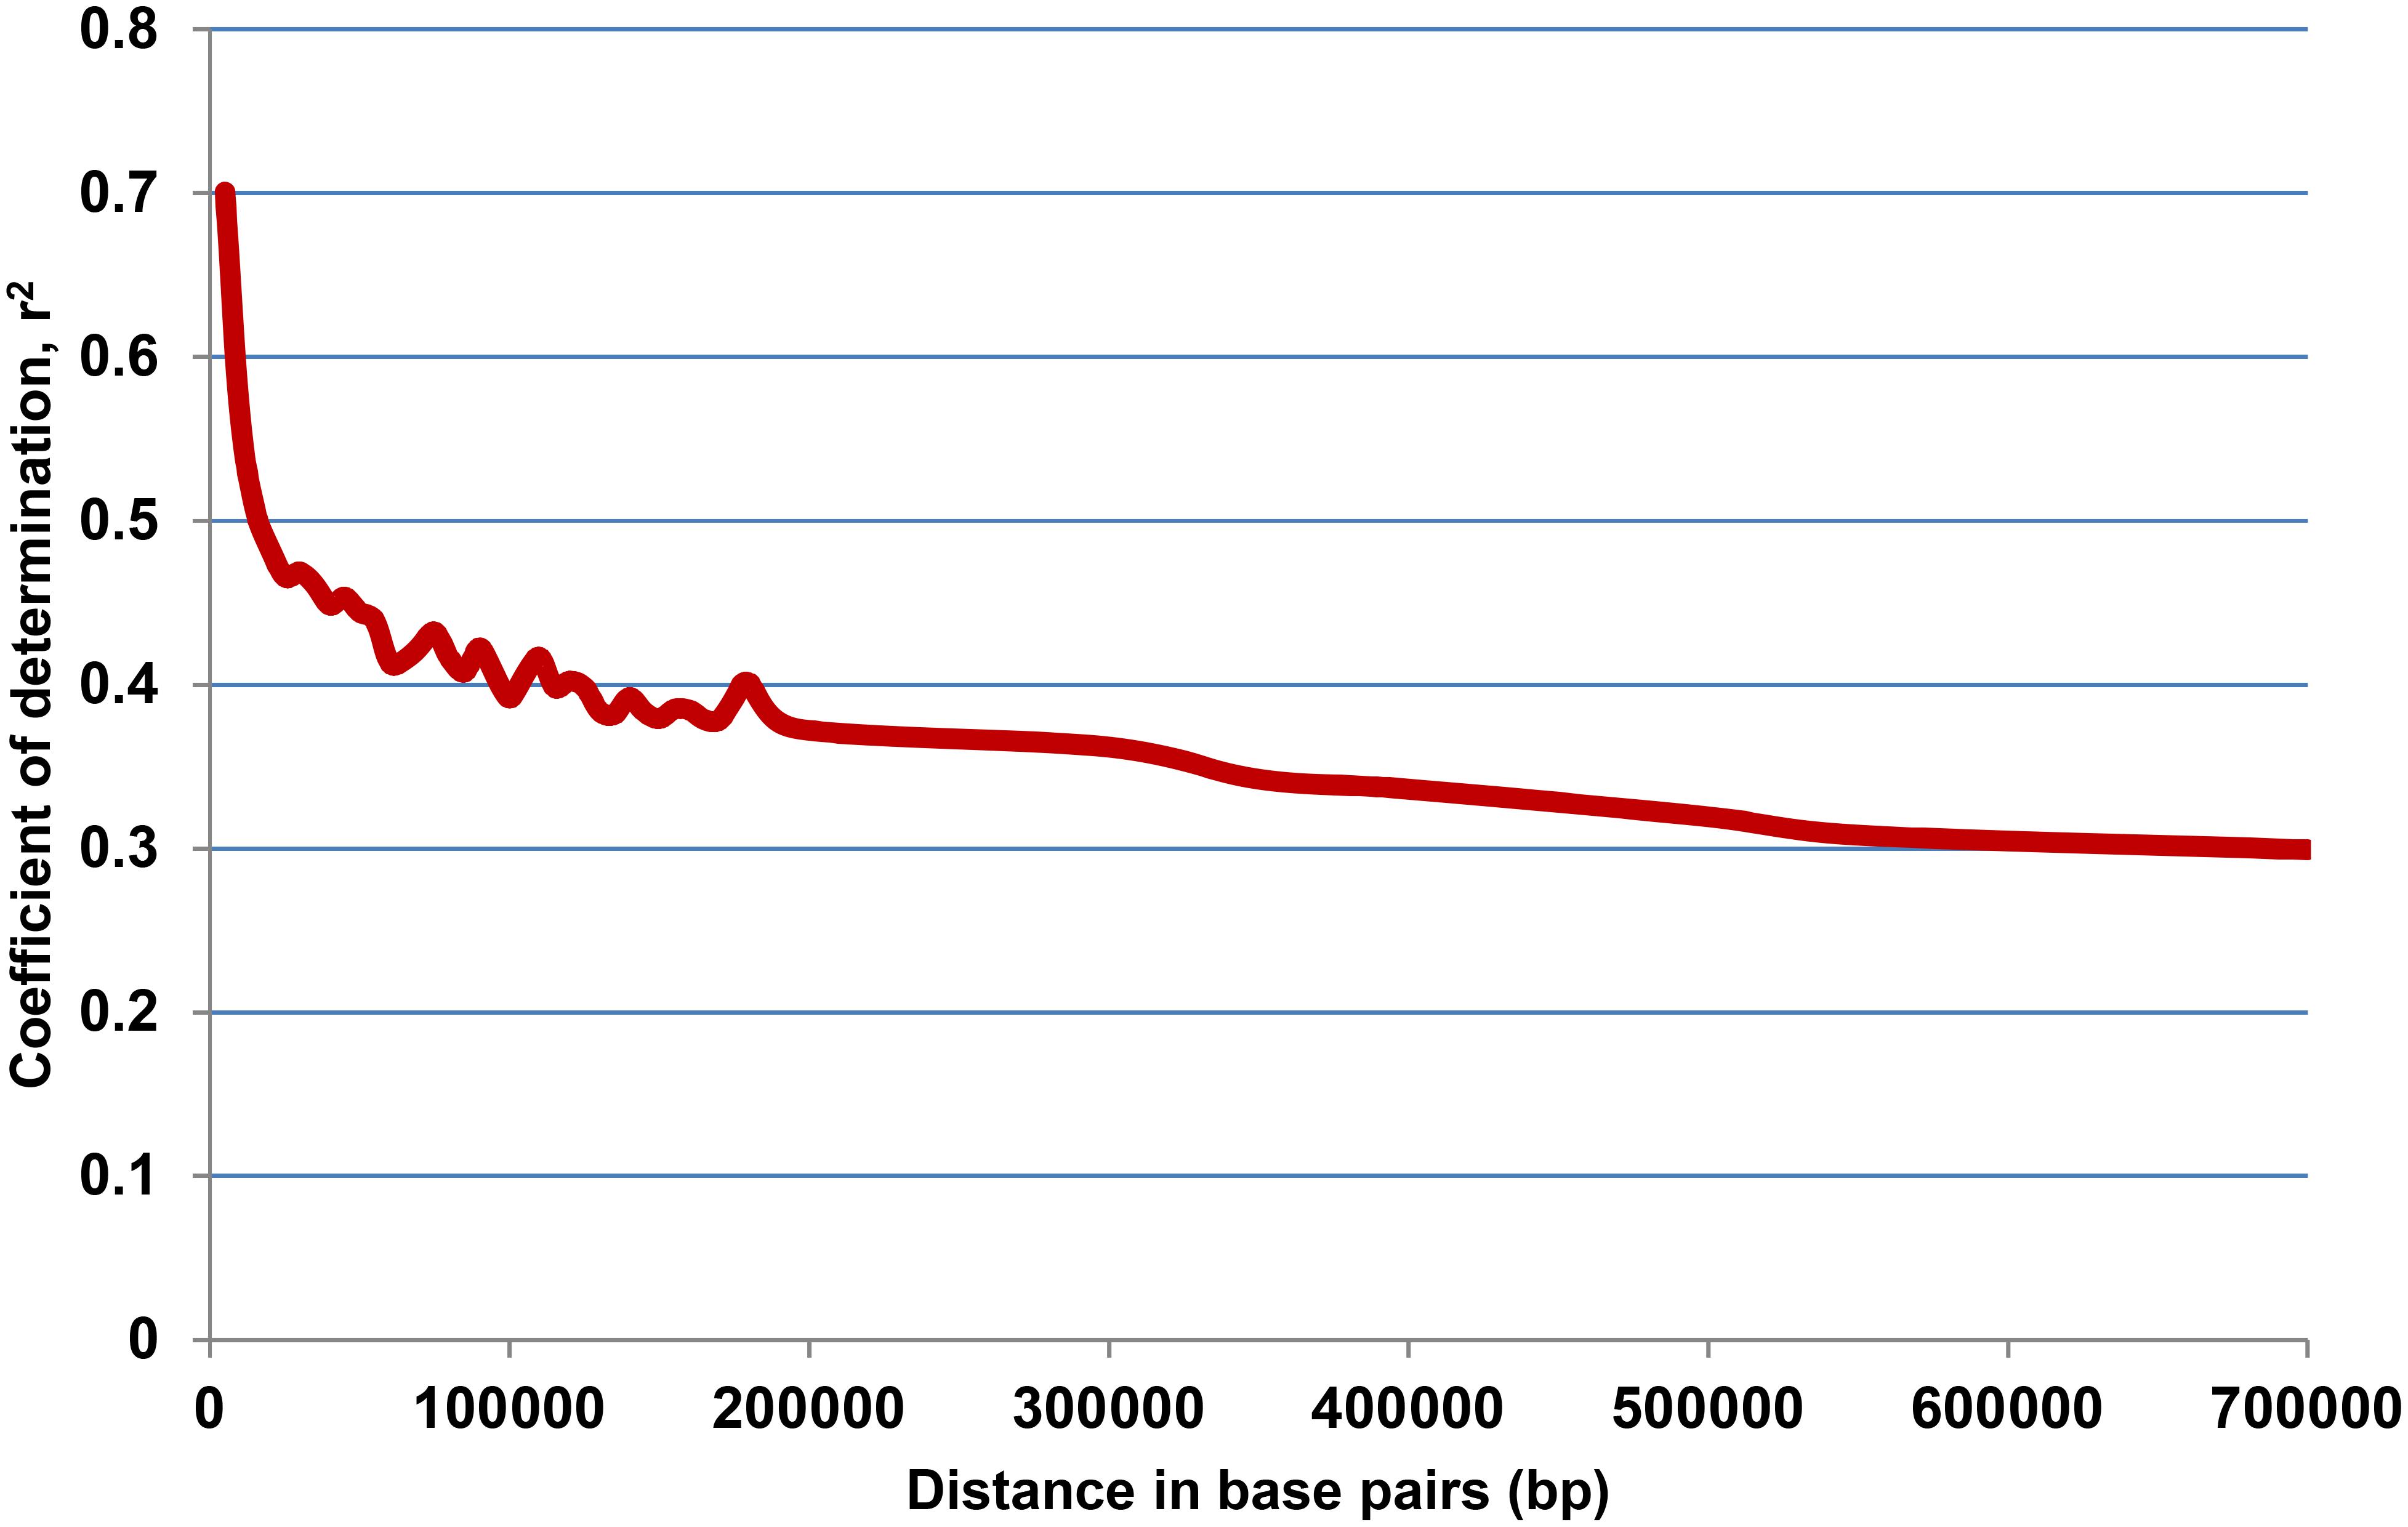
Figure 2. Linkage disequilibrium (LD) decay plot of the association mapping panel derived from 31,132 SNPs, plotted against physical distance in base pairs (bp) and co-efficient of determination (r2).
Variation for Grain Mineral Micronutrients in the Association Panel
The grain Fe and Zn contents exhibited significant variation in the association panel (Table 1). In New Delhi, during WS 2017, Fe concentration in BR (FeBR) varied from 6.5 (Jayati) to 23.1 (Shah Pasand) mg/kg with a mean of 12.7 ± 0.2 mg/kg, while in milled rice (FeMR) it ranged from 0.8 (Arupathaam Kuruvai) to 12.3 (IC-2127) mg/kg with an average of 3.6 ± 0.1 mg/kg. In Aduthurai, the variation for FeBR was similar to that of New Delhi and ranged from 6.2 (Khara Munga) to 21.4 (PRR 109) mg/kg with a mean value of 10.6 ± 0.2 mg/kg. The FeMR exhibited a comparatively narrow range of 0.9 (Ramachandi) to 5.6 (PRR 109) mg/kg with a mean of 2.6 ± 0.1 mg/kg. Alternatively, grain Zn content in BR (ZnBR) varied from 13.0 (Sagar samba) to 46.2 (Karuppunel) mg/kg in the New Delhi location, while in Aduthurai its range was 11.0 (Samanta and OYR 128) to 47 (Karuppunel) mg/kg. In MR, however, the mean value for grain Zn (ZnMR) was 18.0 ± 0.4 mg/kg in New Delhi with a range between 8.2 (Sagar Samba) and 40.9 (Karuppunel) mg/kg, while in Aduthurai, it varied between 8.5 (Bhadrakali) and 40.8 (Karuppunel). The average grain ZnMR in Aduthurai was 16.5 ± 0.4 mg/kg, which was much closer to that observed in the New Delhi conditions.
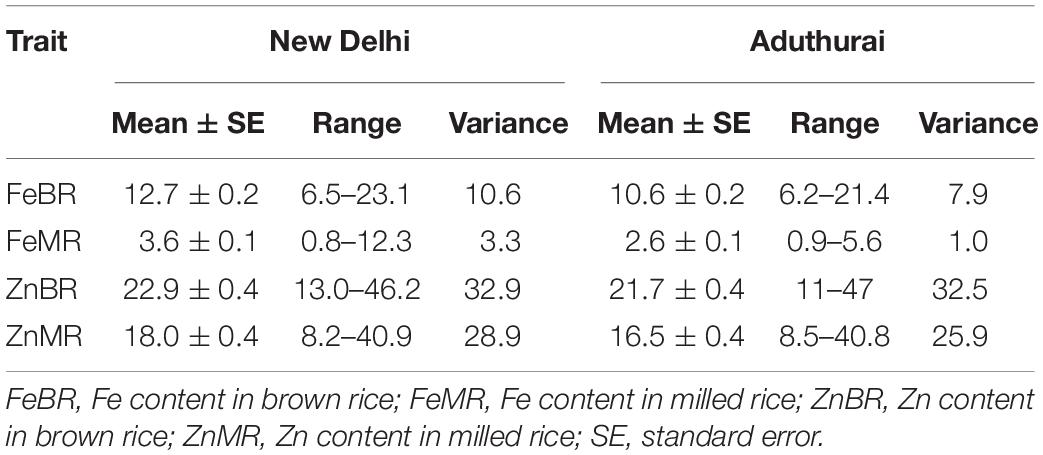
Table 1. Basic statistics of the grain Fe and Zn content in the association mapping panel used in the study, at two diverse locations, New Delhi and Aduthurai.
The association panel depicted significant variation for percent retention of mineral micronutrients upon polishing. A substantial quantity of Fe was lost upon polishing and its retention on milling ranged from as low as 5.4% (Aziz Beoul) to 89.1% (OYR 128) with a mean retention of 24.9% in the MR. When compared to grain Fe, less polishing loss of grain Zn was evident with a retention ranging from 45.8% (OYC 183) to as high as 97.3% (Kalanamak). Of the 192 accessions analyzed, as many as 75 genotypes exhibited a retention of ≥80% of grain Zn.
The sub-populations do not differ significantly for grain Fe and Zn concentration except for the POP2 having slightly lower mean values than POP1 and POP3 (Table 2). POP3 showed a significant difference for the traits between the locations with highest values recorded at the New Delhi location (Figure 3). Population structure accounted for a variation in Fe and Zn concentration ranging from 2.7 (FeMR) to 34.2% (ZnBR) at the New Delhi location and 2.1 (FeBR) to 32.4% (ZnMR) at the Aduthurai location.
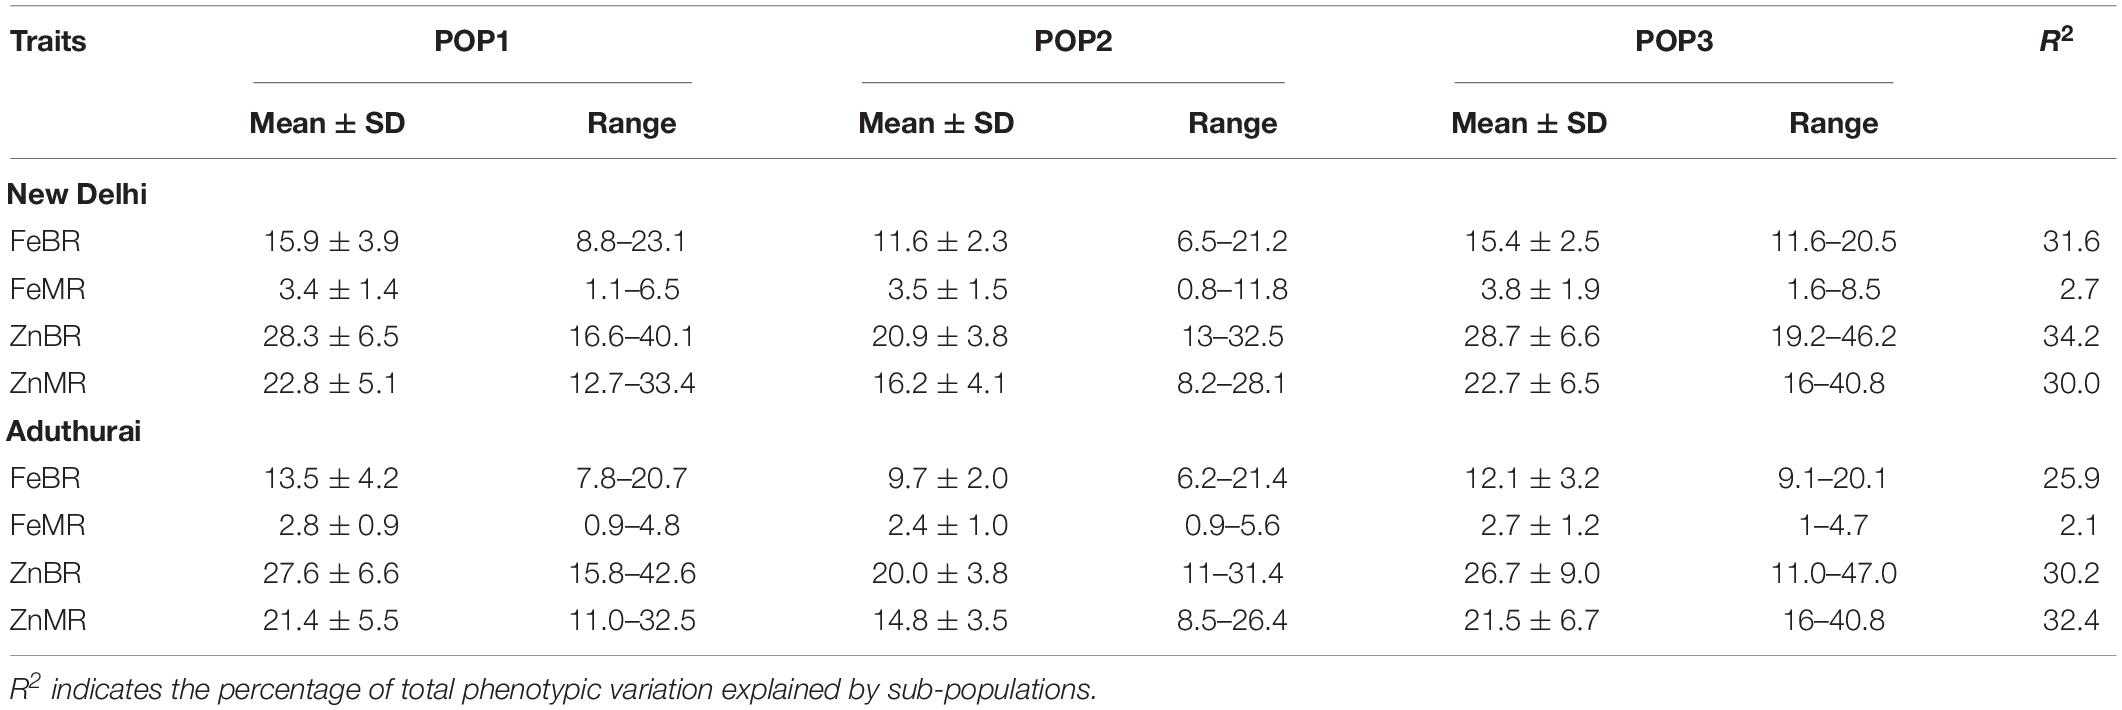
Table 2. Mean and range values for Fe and Zn content among the three sub-populations of the association mapping panel for the two locations, New Delhi and Aduthurai.
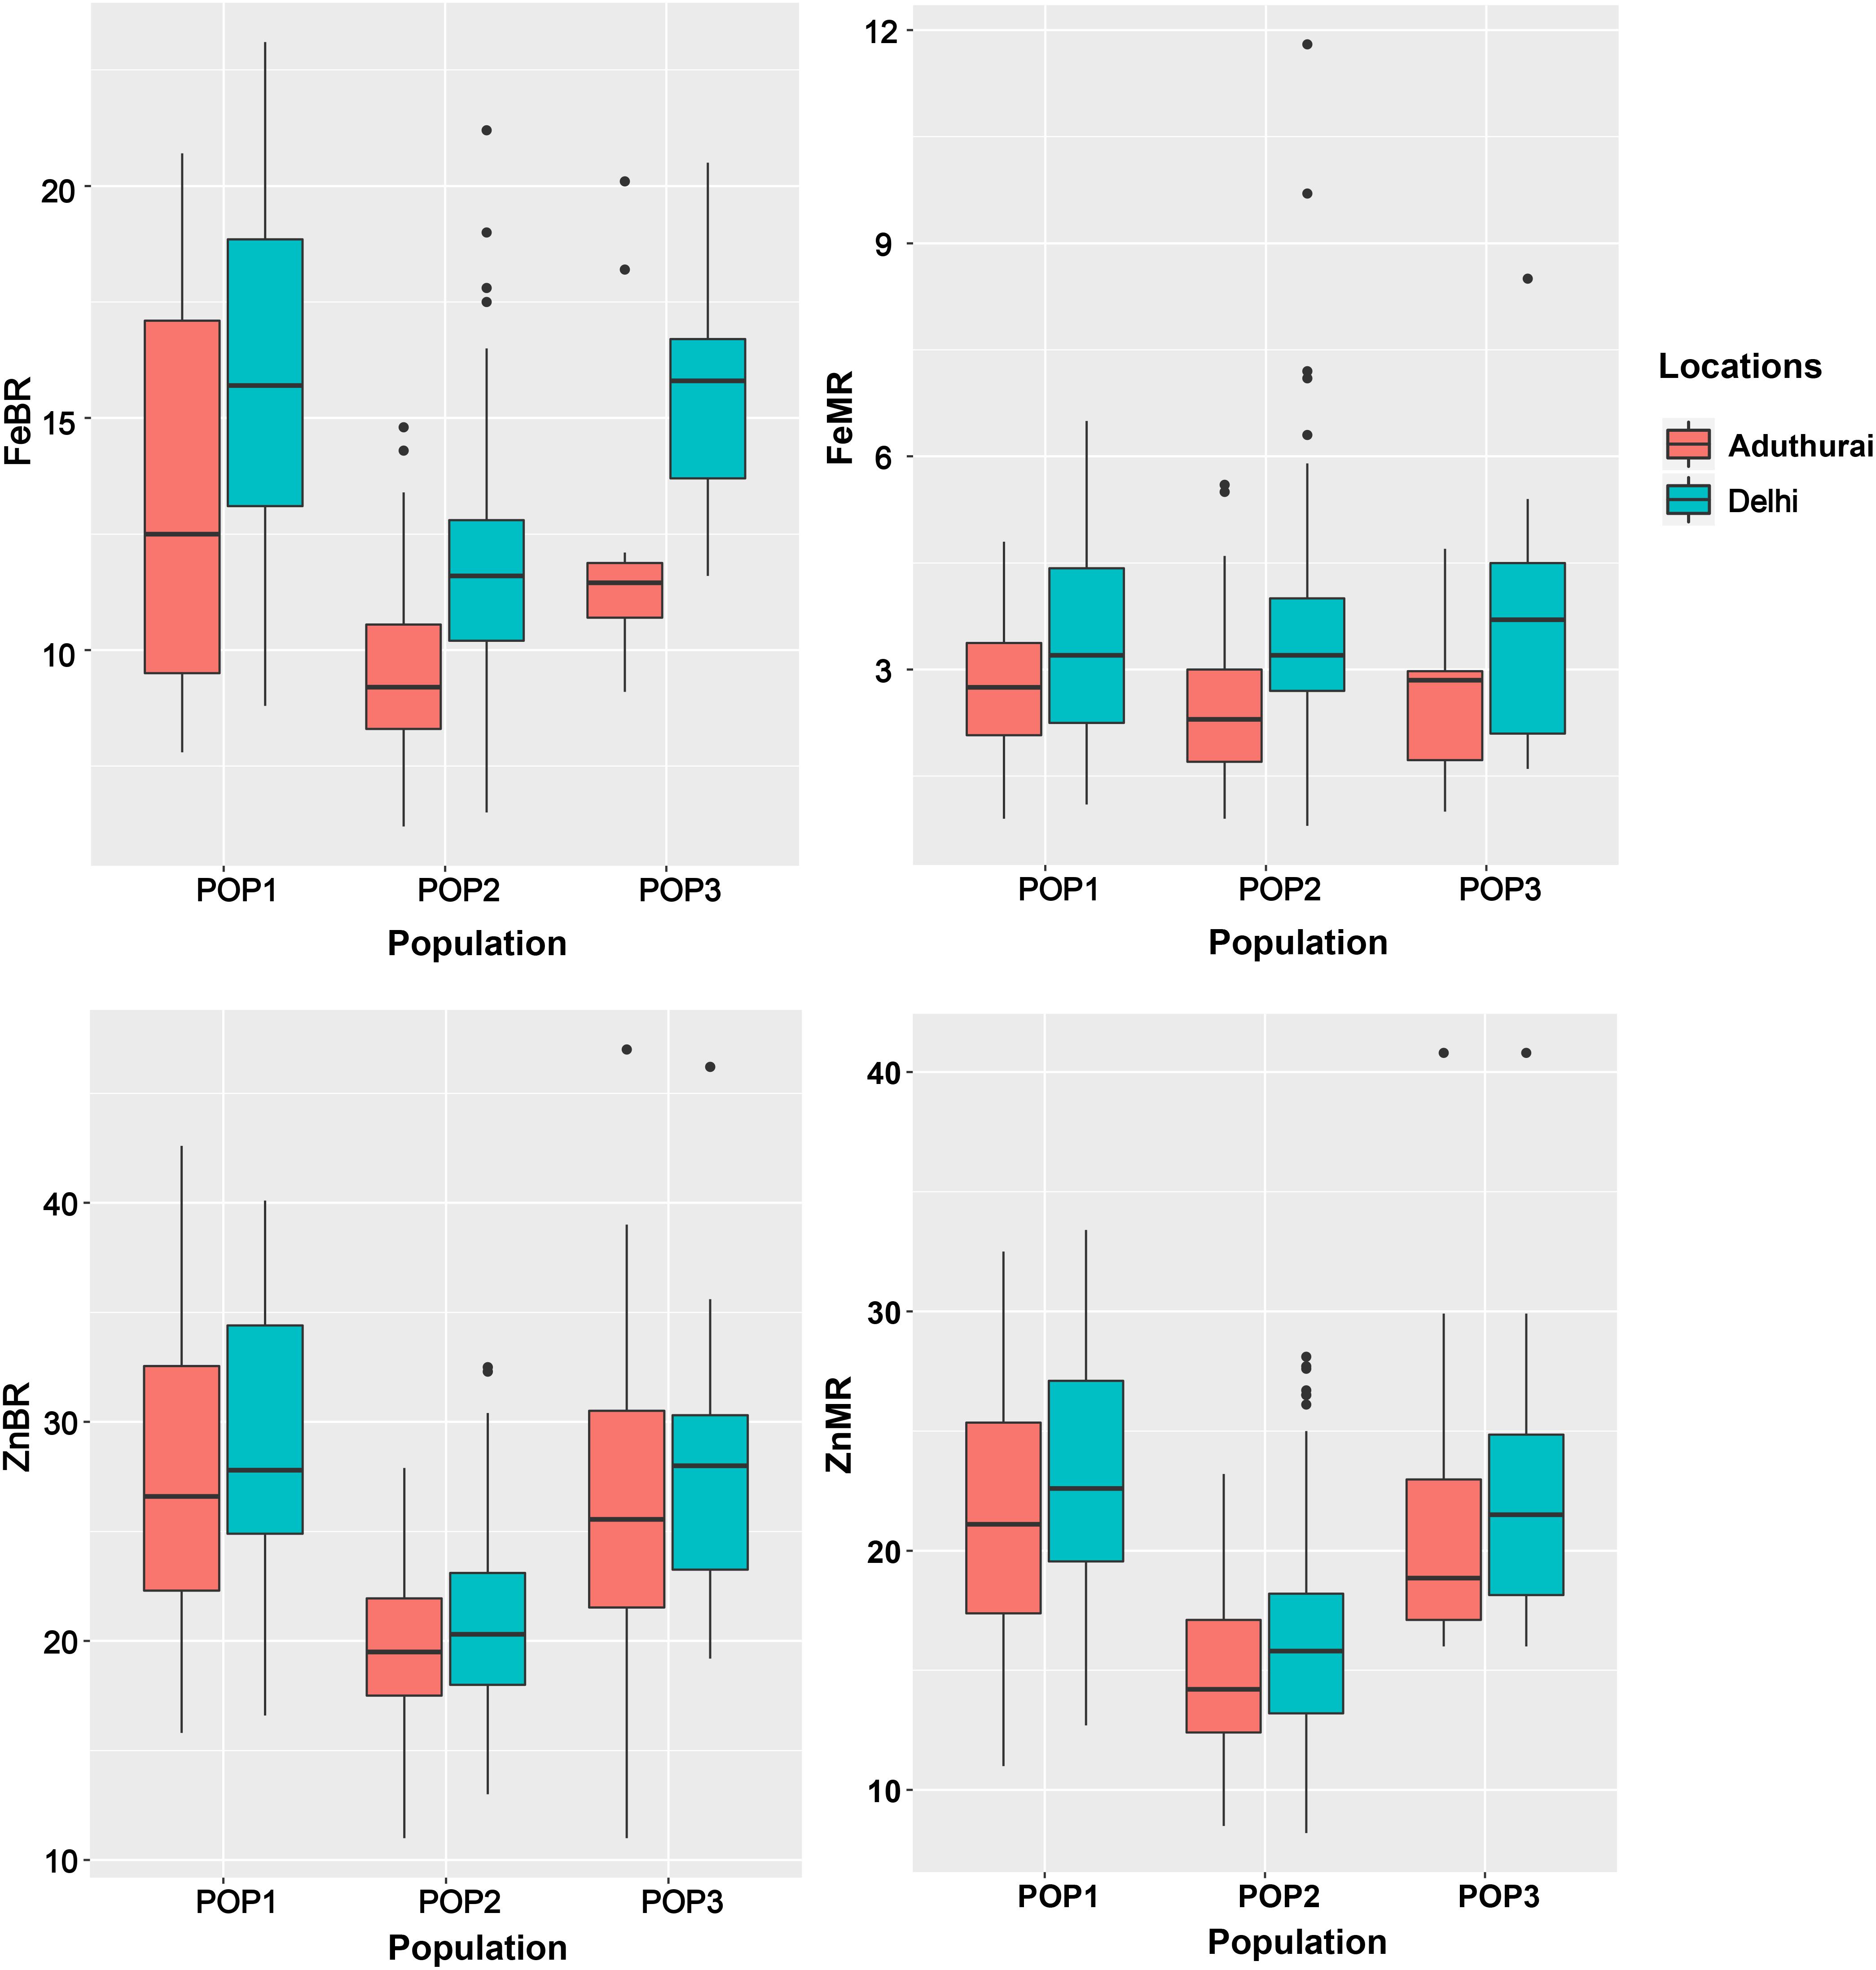
Figure 3. Boxplots showing distribution of grain Fe and Zn content among the sub-populations POP1, POP2, and POP3. FeBR, Fe concentration in brown rice; FeMR, Fe concentration in milled rice; ZnBR, Zn concentration in brown rice; ZnMR, Zn concentration in milled rice.
Associations Among the Mineral Micronutrients
Grain mineral micronutrient content between two locations were significantly correlated (p > 0.001). Strong positive correlations were observed for ZnMR (r = 0.78), ZnBR (r = 0.77), and FeBR (r = 0.67) while FeMR (r = 0.30) indicated a moderate association. Trait wise within location correlation analysis indicated that grain Zn in BR was significantly correlated with Zn concentration in MR with high positive values in both New Delhi (r = 0.95; p > 0.0001) and Aduthurai (r = 0.90; p > 0.0001). However, FeBR showed non-significant association with FeMR. Nevertheless, FeBR exhibited significant positive correlation with ZnBR as well as with ZnMR (Figure 4).
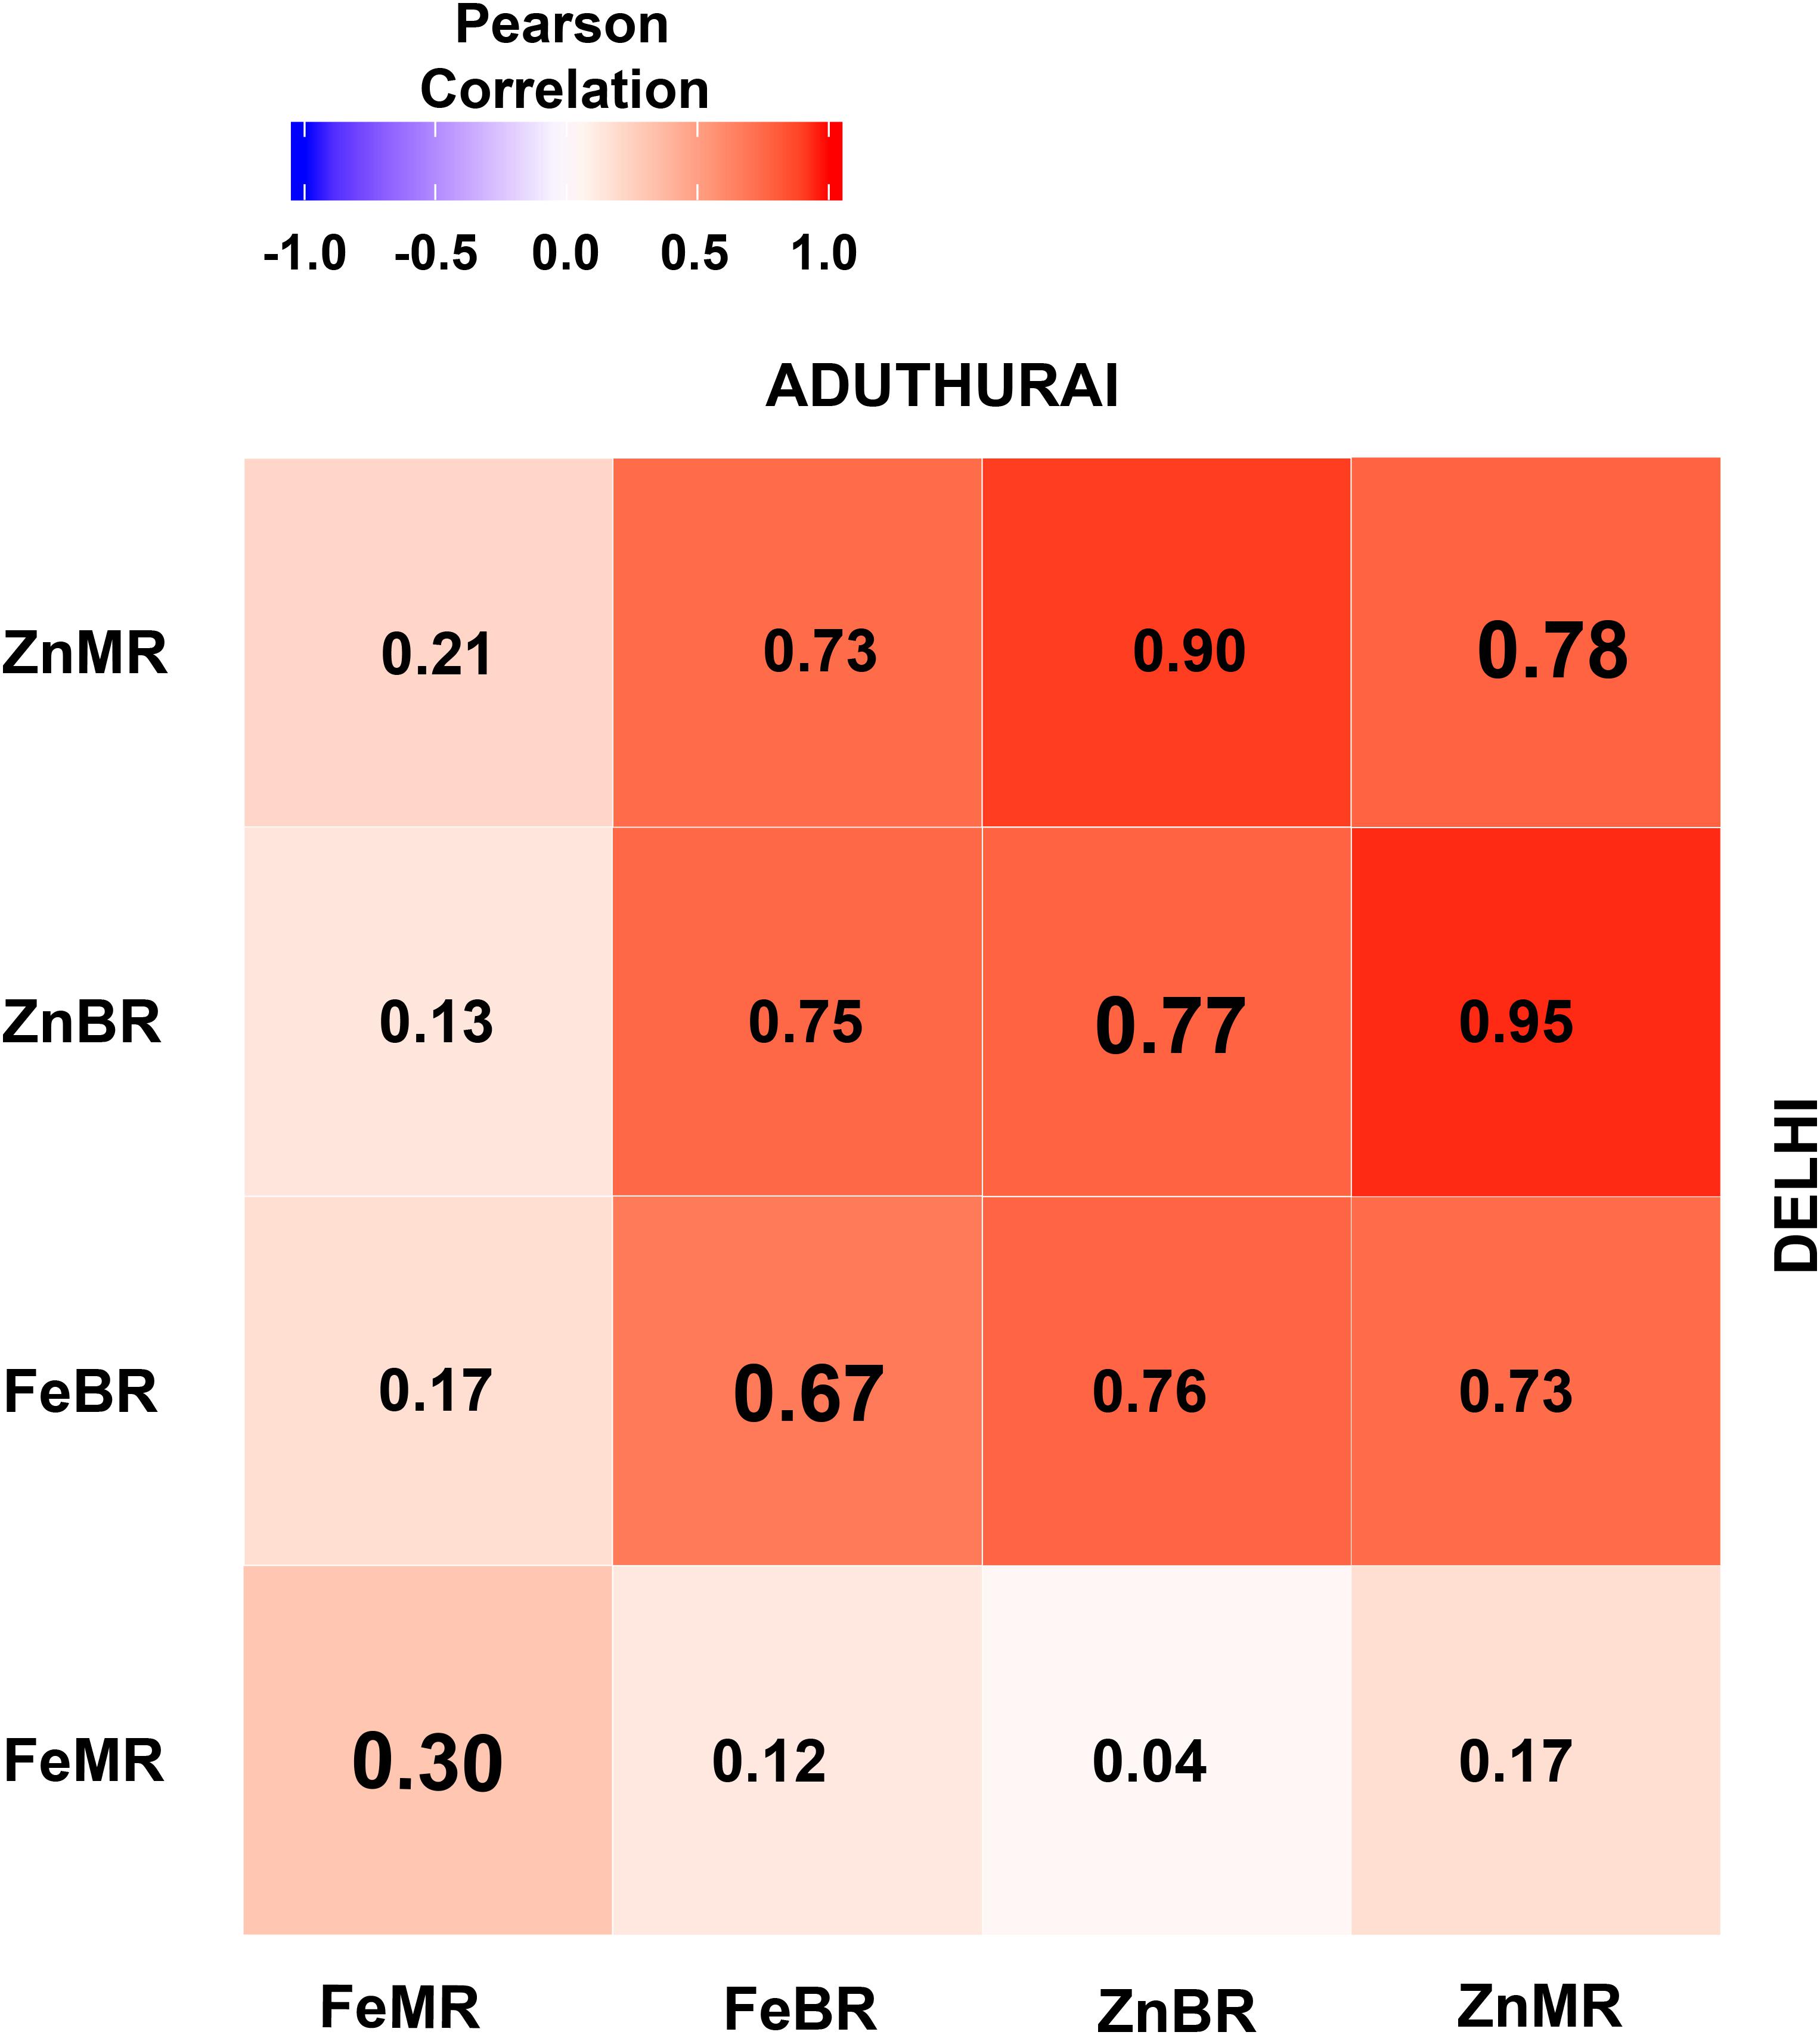
Figure 4. Correlations of Fe and Zn between the locations (diagonal elements) and independent locations at New Delhi (upper diagonal) and Aduthurai, Tamil Nadu (lower diagonal). FeBR, Fe concentration in brown rice; FeMR, Fe concentration in milled rice; ZnBR, Zn concentration in brown rice; ZnMR, Zn concentration in milled rice.
Detection of Stable and Environment-Specific MTAs by GWAS
Association analysis was performed separately for the two locations. The Q–Q plots generated through the FarmCPU model depicted less deviation of the observed p-values from the expected p-values and was therefore chosen as the best fit (Figure 5). A total of 29 QTLs located along 9 out of 12 chromosomes were identified for the four traits analyzed in two environments (Table 3). Eleven were major effect QTLs with a PVE more than 20%, 10 were moderate effect QTLs (PVE 20–10%), while the remaining seven were minor effect QTLs (PVE < 10%). One MTA, qZnMR1.1 showed moderate effect at the New Delhi location and minor effect at the Aduthurai location. Chromosome 3 had the highest number of 11 MTAs, followed by chromosome 1 (six MTAs), chromosomes 2, 6, and 7 (two MTAs each), and chromosomes 8, 9, and 10 (one MTA each). No MTAs affecting Fe and/or Zn concentration in rice grains were found on chromosome 5, 11, and 12. Manhattan plots depicting the significant SNP markers above the modified Bonferroni threshold are provided in Figure 5.
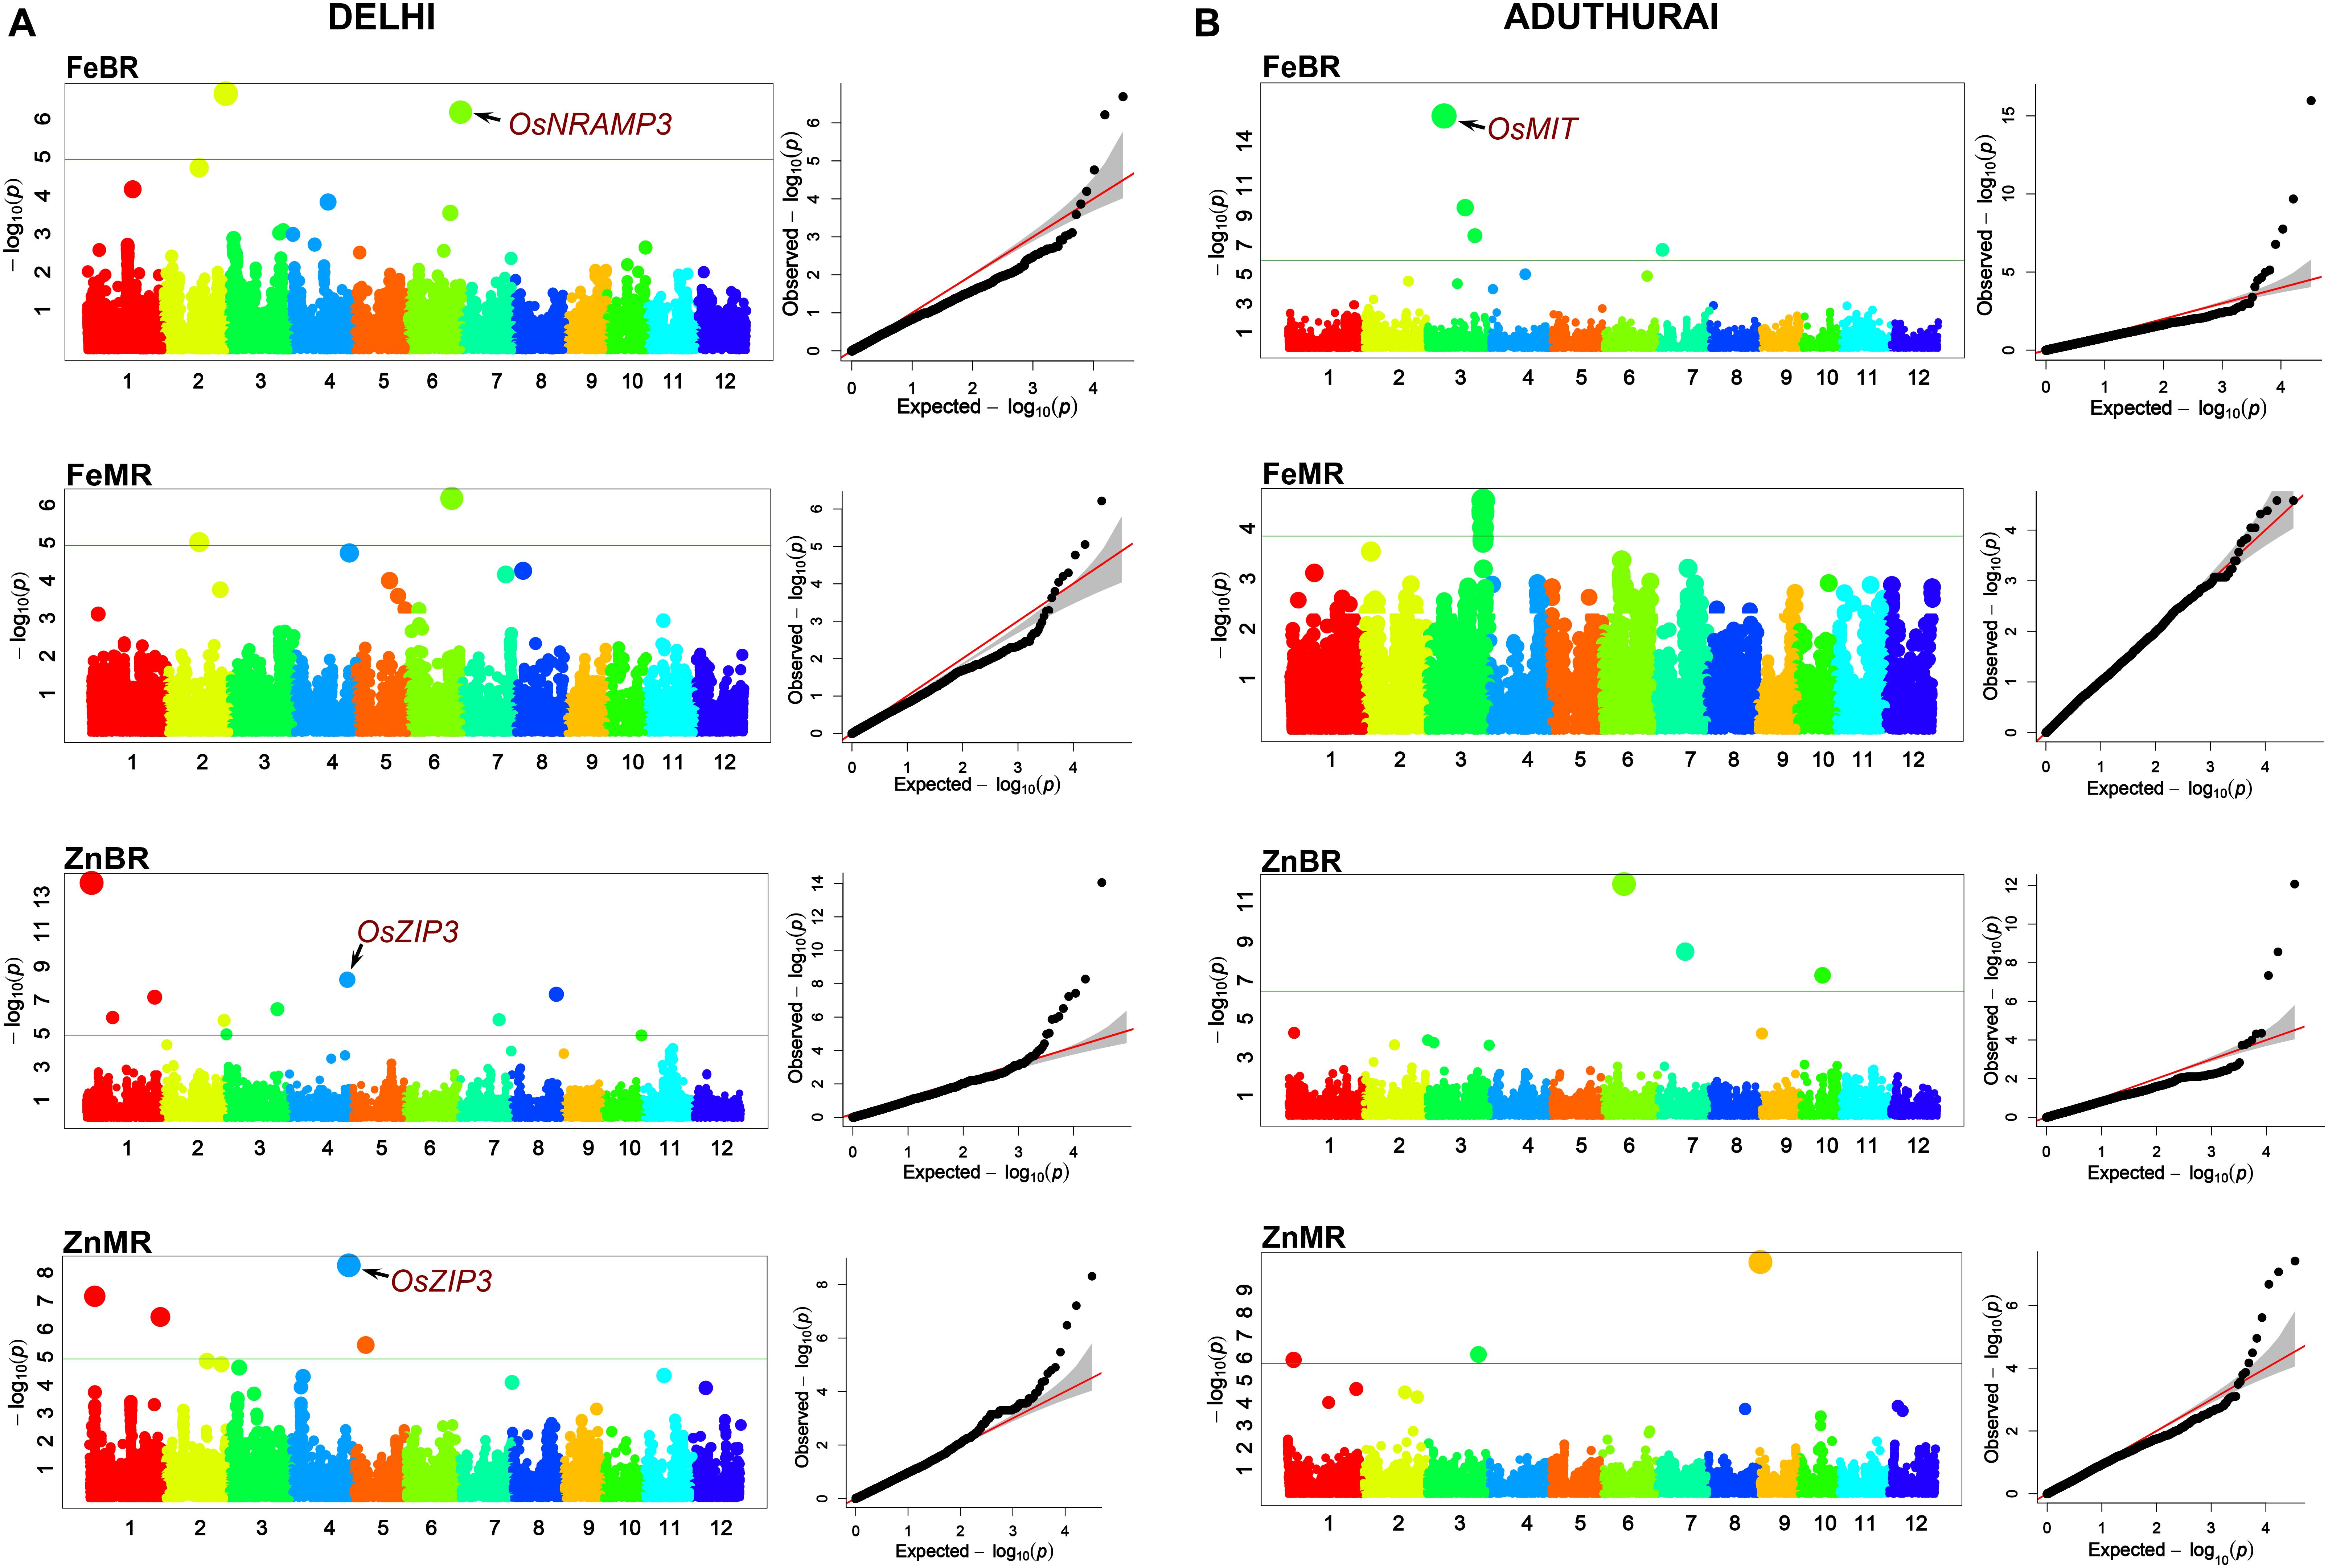
Figure 5. Manhattan plots and Q–Q plots derived through FarmCPU model depicting the significant marker trait associations on 12 chromosomes of rice for the traits analyzed at New Delhi (A) and Aduthurai (B) locations.
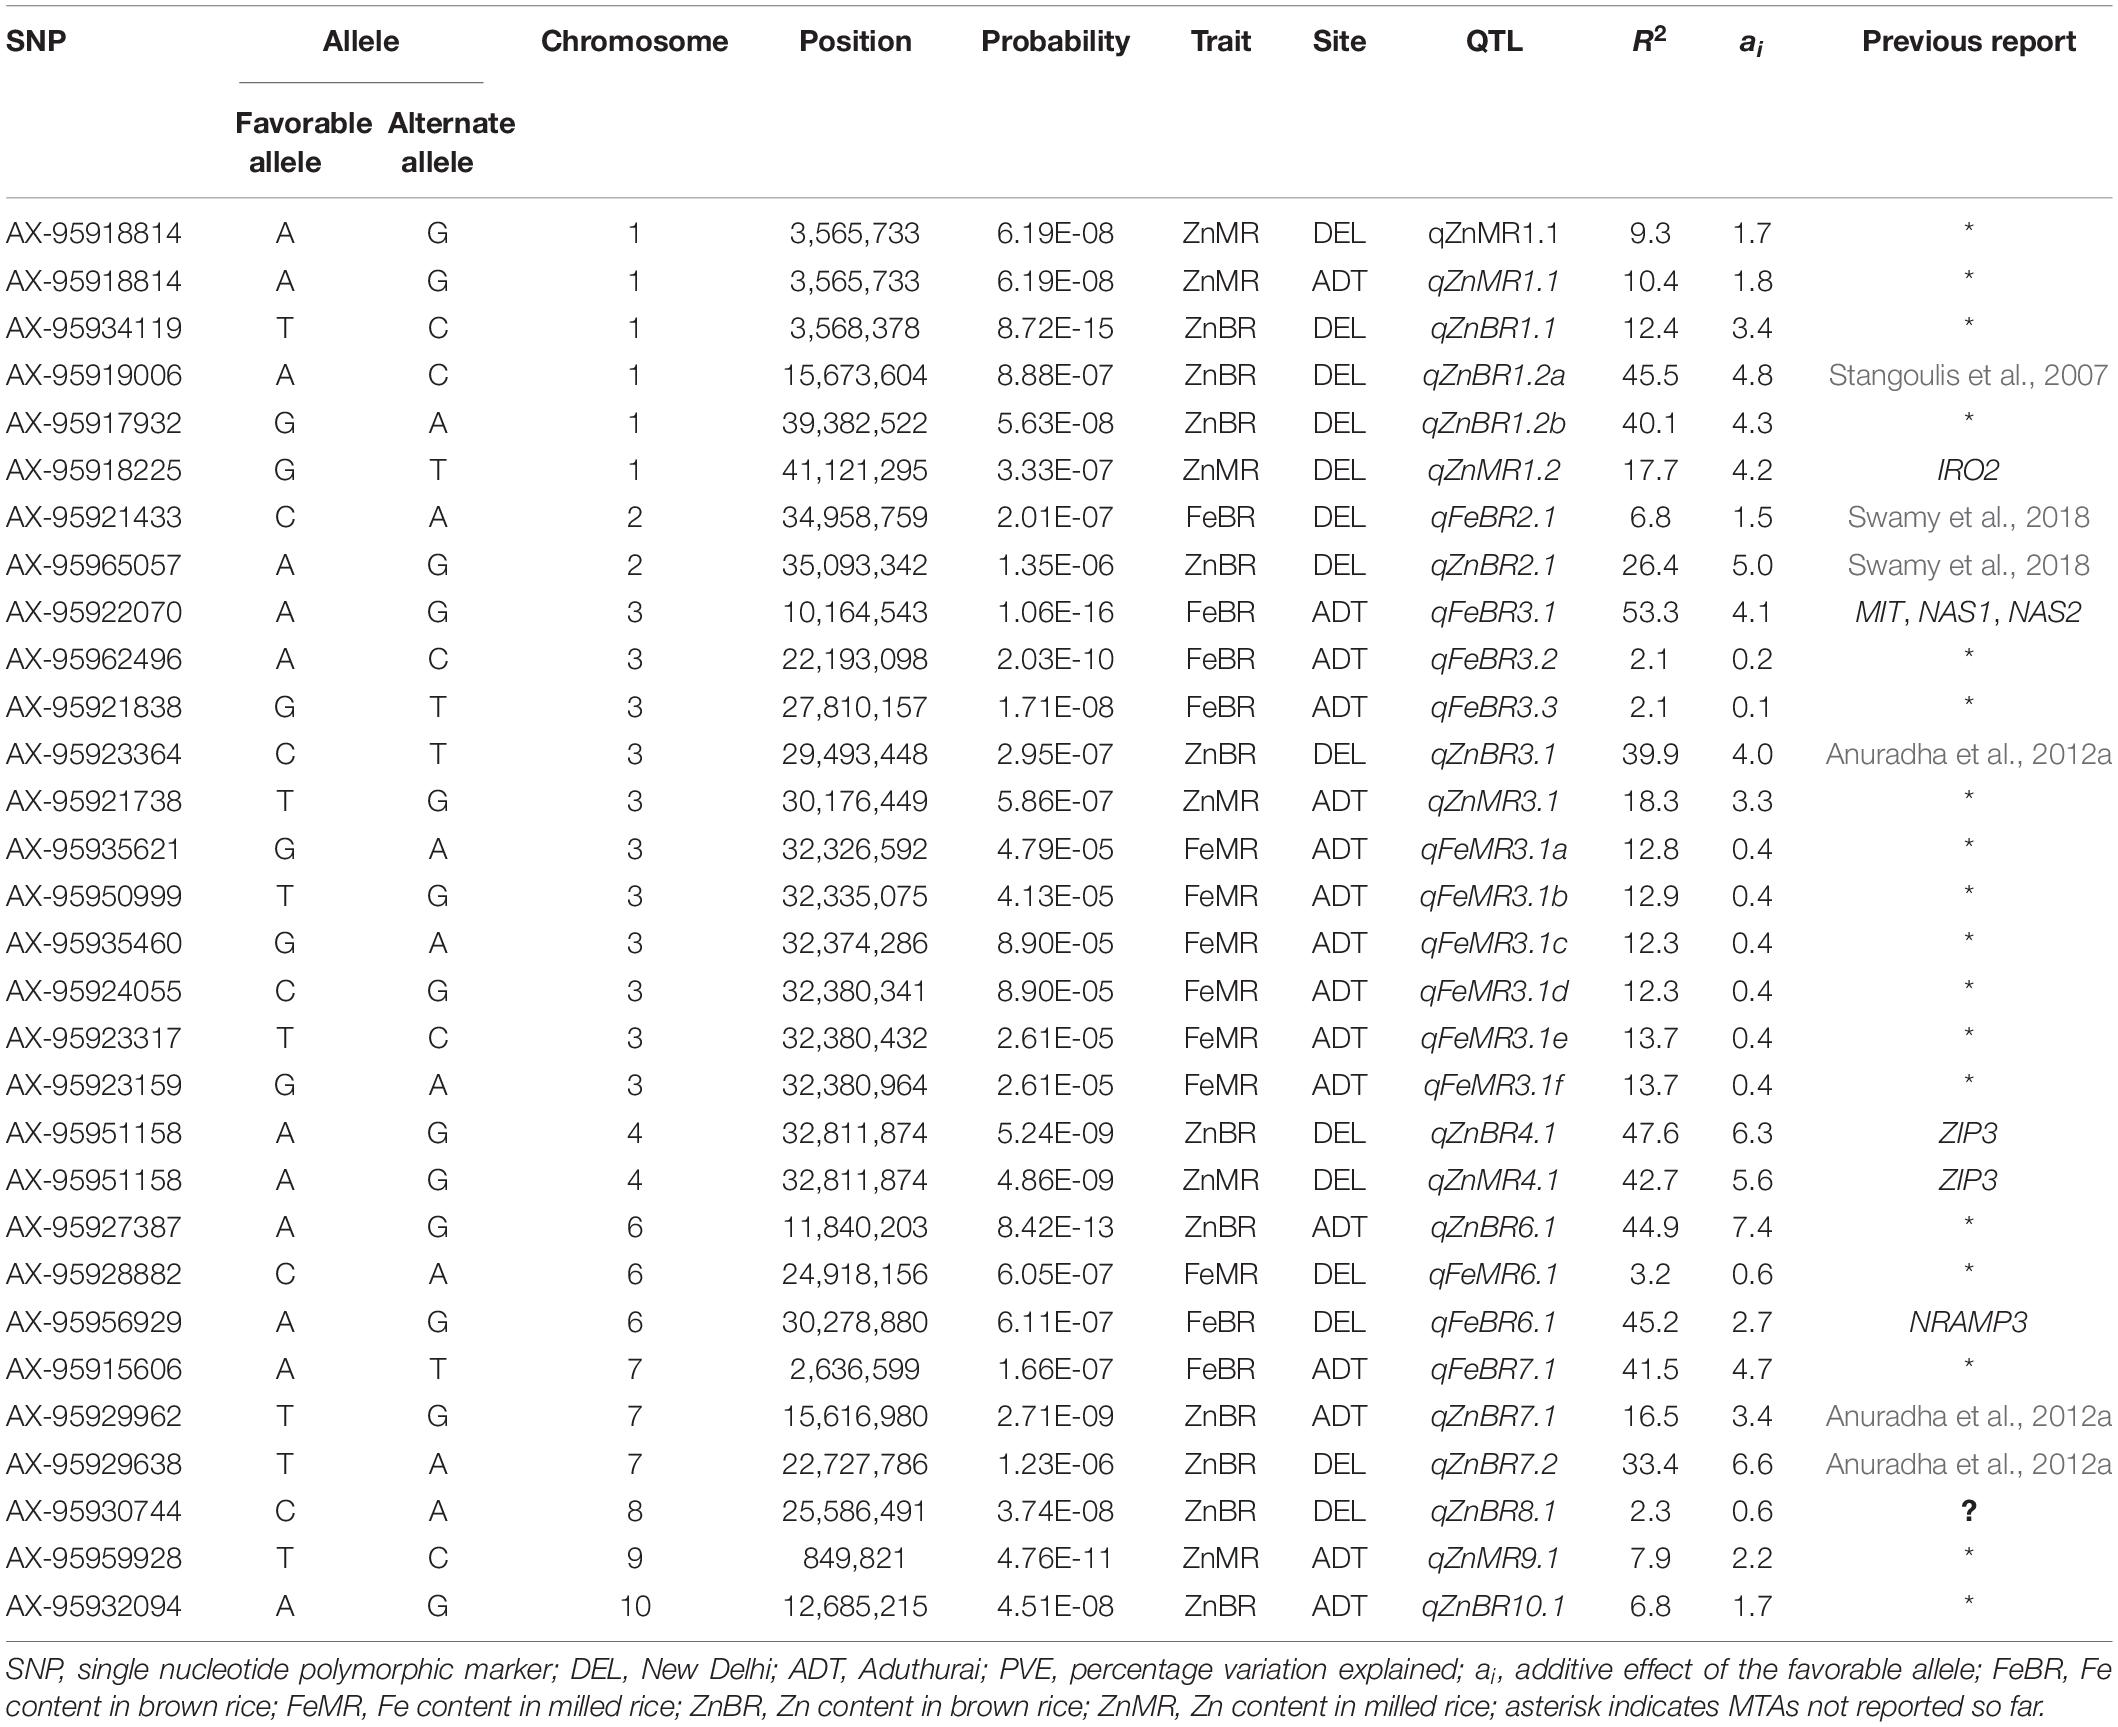
Table 3. Details of the marker-trait associations (MTAs) mapped for grain Fe and Zn content at two different locations, New Delhi and Aduthurai.
FeBR: A total of six MTAs affecting FeBR were identified in the study. Two MTAs were identified at the New Delhi location one each on chromosomes 2 and 6. The MTA on chromosome 6 had a major effect with a PVE of 45.2%, and its favorable allele A at the SNP marker locus AX-95956929 had an additive effect of 2.7 mg/kg on the trait. The MTA on chromosome 2 was a minor effect one with a PVE of only 6.8%. Four MTAs for FeBR were identified at the Aduthurai location, two of them were major effect associations with a PVE as high as 53.3% (qFeBR3.1) and 41.5% (qFeBR7.1) and an additive effect of 4.1 and 4.7, respectively.
FeMR: For FeMR, no MTAs were detected at Bonferroni threshold. However, by adopting a false discovery rate (FDR) threshold, seven MTAs were identified across two locations, of which six were moderate effect MTAs with a PVE ranging from 12.3 to 13.6%. All of these were detected at the Aduthurai location and were found clustered around the 32 Mb physical location on chromosome 3. Only one minor effect MTA was identified at the New Delhi location which explained 5.3% variation.
ZnBR: For this trait, a total of 11 MTAs were identified across two locations, eight under New Delhi conditions and three under Aduthurai conditions. The MTAs detected in New Delhi explained a PVE ranging between 12.4 (qZnBR1.1) and 47.6% (qZnBR4.1), of which six were major MTAs. The additive effect described by the favorable alleles of the MTAs was in the range of 3.4 to 6.6 mg/kg. At Aduthurai, three MTAs were recorded for ZnBR, one each on chromosomes 6, 7, and 10. The MTA on chromosome 6 was a major effect MTA and explained a PVE of 44.9%, which also recorded the highest additive effect of 7.4 mg/kg. Of the remaining two MTAs, the MTA on chromosome 7 was a moderate effect MTA with a PVE of 16.5%, while the one on chromosome 10 was a minor MTA with a PVE of 6.8%.
ZnMR: For the Zn concentration in MR, a total of five MTAs were identified, two each in the New Delhi and Aduthurai locations. One MTA, qZnMR1.1 was commonly detected in both the sites with a PVE of 9.3 and 10.3% in New Delhi and Aduthurai, respectively. The PVE explained by the MTAs identified under the New Delhi condition ranged between 42.7 (qZnMR4.1) and 9.3% (qZnMR1.1), while those at the Aduthurai location explained a PVE between 18.3 (qZnMR3.1) and 7.9% (qZnMR9.1).
Co-localization of MTAs
The MTAs, qZnBR1.2a and qZnBR1.2b identified for ZnBR at the New Delhi location were located in the same LD block and were co-localized on chromosome 1 at the Aduthurai location, six MTAs for FeMR namely qFeMR3.1a, qFeMR3.1b, qFeMR3.1c, qFeMR3.1d, qFeMR3.1e, and qFeMR3.1f were found to be in tight linkage on chromosome 3. Further, for the highly correlated traits such as ZnBR and ZnMR, co-localized MTAs were detected on chromosome 4 (qZnBR4.1 and qZnMR4.1) as well as on chromosome 1 (qZnBR1.1 and qZnMR1.1) under the New Delhi environment. Besides, qZnBR4.1 and qZnMR4.1 were found to share a common peak SNP. Between the environments, qZnBR3.1 identified under New Delhi conditions for the trait ZnBR was found co-localized with eight other MTAs affecting the traits ZnMR (qZnMR3.1), FeBR (qFeBR3.1), and FeMR (qFeMR3.1a, qFeMR3.1b, qFeMR3.1c, qFeMR3.1d, qFeMR3.1e, and qFeMR3.1f) identified under Aduthurai conditions. Further, the qFeBR6.1 identified at the New Delhi location was found co-localized with the qZnBR6.1 identified at the Aduthurai location for the trait ZnBR. Additionally, the MTAs governing ZnBR, qZnBR7.1 from the Aduthurai location and qZnBR7.2 from the New Delhi location have also appeared co-localized on chromosome 7.
It was interesting to note that 12 of the 29 MTAs identified in this study were found to be in the vicinity of previously reported QTL regions and candidate genes. The MTA, qFeBR3.1 was in close proximity to the known candidate genes OsMIT, OsNAS1, and OsNAS2 on chromosome 3 and were located on the same LD block. Further, qZnBR4.1 and qZnMR4.1, the co-localized MTAs associated with grain Zn concentration, were found linked to the reported candidate gene OsZIP3, while qFeBR6.1 was found to be near the gene OsNRAMP3 on chromosome 6.
Discussion
Mineral micronutrient malnutrition is a widespread malady among the rice-eating populations, particularly in developing nations who cannot afford dietary diversity. Biofortification of popular rice varieties with mineral micronutrients, especially Fe and Zn, is a sustainable solution to tackle hidden hunger. However, polygenic inheritance of grain micronutrient accumulation in rice (Huang et al., 2015; Descalsota et al., 2018; Swamy et al., 2018) makes it relatively difficult to map multiple genes using a biparental population, when the genes have low individual effects and are sparsely distributed in the gene pool. A GWAS therefore offers a dual advantage of analyzing the extensive trait variation among the germplasm lines and identifying several genomic regions affecting the trait. In the present study, we analyzed a set of 192 rice germplasm accessions indigenous to different parts of India, for two important mineral micronutrients viz. Fe and Zn, in both BR and MR grown at two different locations, and found that the accessions possessed more extensive genetic diversity for both traits. Wide variability in rice accessions especially involving several landraces, has previously been reported particularly in BR (Anuradha et al., 2012b; Maganti et al., 2019). In this study, additionally, we demonstrated the existence of variation in MR which is more commonly consumed. In this case also, as reported earlier, we observed a pattern of polygenic inheritance of the Fe and Zn concentration from their normal distribution under both locations. This is in line with previous studies that demonstrated complex and multi-factorial inheritance of Fe and Zn in rice grain (Huang et al., 2015; Descalsota et al., 2018; Swamy et al., 2018).
A significant positive correlation between Fe and Zn in BR had been reported earlier (Stangoulis et al., 2007; Anuradha et al., 2012a) and together this study affirms the possibility of the simultaneous improvement of Fe and Zn in rice grain. As mentioned earlier, in rice grains, Fe and Zn are accumulated in the bran to the tune of about 30 and 6 mg/g, respectively (Bhosale and Vijayalakshmi, 2015), which accounts for the significant proportion of the mineral content in the grain. Additionally, the study also depicted strong association between Zn concentrations in BR and MR. It ascertains that the Zn concentration in BR is a fair indicator of its level in MR and can therefore be used as a selection criterion for the quick and non-destructive evaluation of Zn in the breeding populations targeted to improve Zn content in MR. In contrast, Fe concentration in BR was not found to be associated with Fe concentration in MR, signifying the practical need for enriching the Fe concentration of endosperm independent of its BR Fe concentration. When quantified, the percent retention upon polishing was found to be significantly low for Fe, in line with the previous reports that established localization of Fe in the embryo and aleurone layer (Prom-u-Thai et al., 2003; Choi et al., 2007; Kyriacou et al., 2014). Conversely, retention of Zn was significantly higher in the endosperm with moderate to minimal losses on polishing. However, examining carefully on an individual basis, the retention level varied across the genotypes, opening up the possibility of identifying genotypes with better nutrient retention in milled grains. Further studies are needed to investigate if this variation in percent retention upon polishing is due to differences in the ability of genotypes to translocate the mineral elements from aleurone to endosperm, or due to differences in the thickness of the aleurone layer.
GWAS Identified Significant MTAs for Biofortification
Assessment of genetic diversity and population structure is an important pre-requisite in a GWAS and the presence of three sub-populations in our panel has been depicted by both PCA and STRUCTURE analyses. Variations observed among the three sub-populations for the Fe and Zn in both BR and MR at two locations, implied that grain micronutrients can only be subtly influenced by genetic grouping. The genotypes in the POP3 showed specific adaptation to location, with higher mean values recorded at the New Delhi location compared to the Aduthurai location. Huang et al. (2015) also reported the importance of population structure in determining the variation for the mineral micronutrients Fe and Zn and heavy metals like Pb, Cd, and Se in whole grain rice.
It has been proven that the GWAS accelerated the speed and accuracy of detecting QTLs and candidate genes in comparison to biparental linkage mapping. Several statistical models like GLM and MLM have been developed to control false positives and false negatives that arise due to familial relatedness and population structure. Ever since the publication of MLM, it has been popularly adopted for GWAS in crops, particularly, in rice (Zhang et al., 2014; Ya-fang et al., 2015; Wang et al., 2016). Nevertheless, MLM being a single locus method that allows testing of one marker locus at a time, had an inherent limitation in matching the real genetic architecture of the complex traits that are under the influence of multiple loci acting simultaneously (Kaler and Purcell, 2019). Multi-locus models like FASTmrEMMAa (Zhang et al., 2018), LASSO (Xu et al., 2017), BLASSO (Tamba et al., 2017), FarmCPU, pLARmEB (Zhang et al., 2018), and pKWmEB (Ren et al., 2018) are being used to overcome the limitation above. A few recent studies on plant height and flowering time (Wallace et al., 2016), ear traits (Zhu et al., 2018), and starch pasting properties (Xu et al., 2018) in maize, yield-related features in wheat (Ward et al., 2019), stem rot resistance in soybean (Wei et al., 2017), agronomic traits in foxtail millet (Jaiswal et al., 2019), and panicle architecture in sorghum (Zhou et al., 2019), have demonstrated the power of the FarmCPU model that uses both fixed effect and random effect models iteratively to effectively control the false discovery. In the present study, a comparison of Q–Q plots obtained through different models revealed FarmCPU as a best-fit model with improved power of test statistics. Our research forms the first report in rice that demonstrates the power of the FarmCPU over MLM.
Population size is another critical factor that determines the power of detection of QTLs in a GWAS (Garcia et al., 2005). In the present study, we identified significant MTAs even after adopting the highly stringent Bonferroni threshold, implying that the population size of 192 individuals is just enough for a GWAS in rice. Hoang et al. (2019) used a set of 180 individuals in a GWAS to identify QTLs affecting tolerance to water deficit while Descalsota et al. (2018) used a set of 144 MAGIC lines as a GWAS panel and mapped significant QTLs for agronomic and biofortification traits in rice. As rice is an autogamous species, it carries haplotype blocks larger than allogamous crops like corn. Yonemaru et al. (2012) demonstrated that size of the haplotype blocks in rice could vary widely, with a mean of ∼50 kb, while in corn it was ∼1 kb (Maldonado et al., 2019). Because of this, in crops like rice, a relatively smaller number of genotypes are required to cover a more significant proportion of the evolutionarily conserved genomic regions. Throughout the current decade, the use of GWAS has been particularly widespread in rice, helping to map QTLs related to traits such as agronomic characters (Zhang et al., 2014), plant height and grain yield (Ma et al., 2016), grain traits (Edzesi et al., 2016; Feng et al., 2016; Wang et al., 2016), panicle traits (Zhang et al., 2014), and milling quality (Qiu et al., 2015) to mention a few. Nevertheless, only a couple of studies reported a GWAS for mineral elements either in BR (Norton et al., 2014; Yang et al., 2018) or in MR (Descalsota et al., 2018).
In the present study, we have identified a total of 29 QTLs affecting Fe and Zn concentration in both BR and MR, holding significance in rice biofortification programs. Interestingly, 18 of the 29 MTAs were different from previous reports and can therefore be considered novel MTAs. The correlated traits like FeBR, ZnBR, and ZnMR shared common MTAs while uncorrelated features such as FeBR and FeMR did not share any co-localized MTAs. These co-localized MTAs can be targeted for the simultaneous improvement of Fe and Zn in rice grain. Further, the MTA, qFeBR3.1 reported in this study on chromosome 3 was found in close proximity (222 kb) to the candidate gene, the mitochondrial iron transporter (OsMIT). Using knockdown mutants, MIT gene expression was shown to affect Fe localization in rice seeds (Bashir et al., 2013). Additionally, qFeBR3.1 also shares the same LD block with the nicotianamine synthase (NAS) family protein OsNAS1 (760 Kb) and OsNAS2 (763 Kb). NAS family members catalyze the biosynthesis nicotinamine (NA) that acts a chelator of metal cations like Fe2+ and Fe3+ and play an essential role in both the short-distance as well as long-distance transport of metal cations (von Wiren et al., 1999; Takahashi et al., 2003). Overexpression of NAS genes resulted in several folds increase in Fe, Zn, and NA in rice grain (Lee et al., 2009; Johnson et al., 2011). The MTAs, qZnBR4.1, and qZnMR4.1 on chromosome 4 were found to be co-localized with the OsZIP3 gene, one of the members of the Zn-regulated transporter family proteins in rice. Initially, it was reported that the cation transporter proteins ZIP1 and ZIP3 might be involved in the uptake of Zn from soil (Ramesh et al., 2003; Bashir et al., 2012). Subsequently, Sasaki et al. (2015) observed that OsZIP3 is localized in the nodes, and they further demonstrated that the OsZIP3 protein is responsible for unloading the Zn from the xylem of enlarged vascular bundles in nodes. In addition to these vital candidate genes, 7 of the 29 MTAs were within the intervals of previously mapped QTLs (Table 3).
Potential Donor Germplasm Identified
We have identified four accessions (Table 4) with grain Zn concentration in MR > 28 mg/kg, a target set by the HarvestPlus program for rice bio-fortification (Bouis and Saltzman, 2017). These accessions showed consistent high grain Zn in both the environments tested. Additionally, several specifically adapted germplasm were also identified in the study. However, for the Fe concentration in MR, only one accession (IC-2127) showed >12 mg/kg Fe, as per the HarvestPlus target, specifically in the New Delhi location. Our data is in agreement with the previous studies that reported an average of only 2 mg/kg Fe in MR (Johnson et al., 2011; Yuan et al., 2013), indicating the limited scope for the improvement of Fe concentration in rice using conventional breeding approaches. Genetic engineering, especially the recent techniques of genome editing like CRISPR/Cas9 and transcription activator-like effector nucleases, offers viable alternatives to traditional methods for Fe bio-fortification in rice grain (Goto et al., 1999; Wirth et al., 2009; Masuda et al., 2012; Trijatmiko et al., 2016).
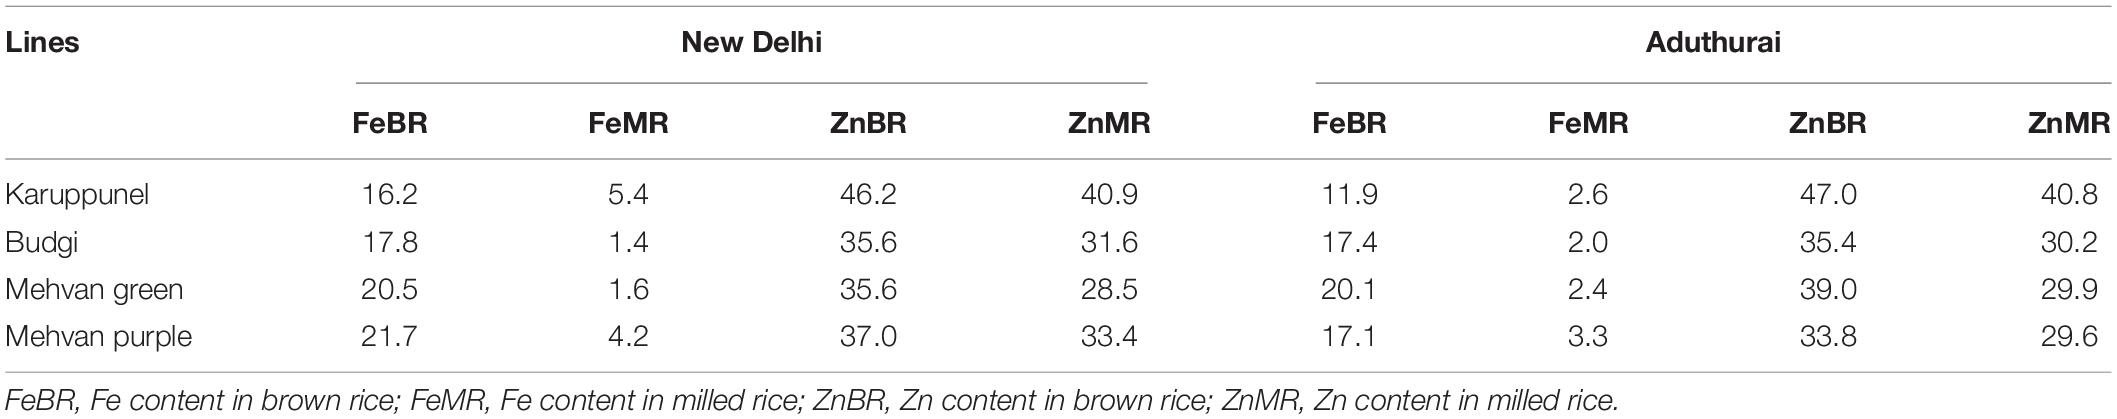
Table 4. The average grain content (both brown and milled rice) of Fe and Zn (mg/kg) in elite accessions identified from the association mapping panel to be used as donors in bio-fortification programs.
Data Availability Statement
The SNP data has been deposited into a publicly accessible repository held under ICAR: https://krishi.icar.gov.in/jspui/handle/123456789/31947.
Author Contributions
AS conceptualized the idea. HB, PB, SG, MN, and RE conducted the field experiments. HB, AY, and CN carried out phenotyping of the germplasm accessions. HB and KV carried out the data analysis. HB and KV prepared the manuscript. HB, AS, KV, and SG edited the manuscript.
Funding
The authors acknowledge the Indian Council of Agricultural Research (ICAR) for funding and supporting the work under the CRP-Biofortification project.
Conflict of Interest
The authors declare that the research was conducted in the absence of any commercial or financial relationships that could be construed as a potential conflict of interest.
Footnotes
References
Alexander, D. H., Novembre, J., and Lange, K. (2009). Fast model-based estimation of ancestry in unrelated individuals. Genome Res. 19, 1655–1664. doi: 10.1101/gr.094052.109
Anuradha, K., Agarwal, S., Batchu, A. K., Babu, P. A., Swamy, B. P. M., Longvah, T., et al. (2012a). Evaluating rice germplasm for iron and zinc concentration in brown rice and seed dimensions. J. Phytol. 4, 19–25.
Anuradha, K., Agarwal, S., Rao, Y. V., Rao, K. V., Viraktamath, B. C., and Sarla, N. (2012b). Mapping QTLs and candidate genes for iron and zinc concentrations in unpolished rice of Madhukar× Swarna RILs. Gene 508, 233–240. doi: 10.1016/j.gene.2012.07.054
Bashir, K., Ishimaru, Y., and Nishizawa, N. K. (2012). Molecular mechanisms of zinc uptake and translocation in rice. Plant Soil 361, 189–201. doi: 10.1007/s11104-012-1240-5
Bashir, K., Nozoye, T., Ishimaru, Y., Nakanishi, H., and Nishizawa, N. K. (2013). Exploiting new tools for iron bio-fortification of rice. Biotechnol. Adv. 31, 1624–1633. doi: 10.1016/j.biotechadv.2013.08.012
Bhosale, S., and Vijayalakshmi, D. (2015). Processing and nutritional composition of rice bran. Curr. Res. Nutr. Food Sci. 3, 74–80. doi: 10.12944/CRNFSJ.3.1.08
Black, R. E., Allen, L. H., Bhutta, Z. A., Caulfield, L. E., de Onis, M., Ezzati, M., et al. (2008). Maternal and child undernutrition: global and regional exposures and health consequences. Lancet 371, 243–260. doi: 10.1016/S0140-6736(07)61690-0
Bouis, H. E. (2003). Micronutrient fortification of plants through plant breeding: can it improve nutrition in man at low cost? Proc. Nutr. Soc. 62, 403–411. doi: 10.1079/pns2003262
Bouis, H. E., and Saltzman, A. (2017). Improving nutrition through biofortification: a review of evidence from HarvestPlus, 2003 through 2016. Glob. Food. Sec. 12, 49–58. doi: 10.1016/j.gfs.2017.01.009
Bradbury, P. J., Zhang, Z., Kroon, D. E., Casstevens, T. M., Ramdoss, Y., and Buckler, E. S. (2007). TASSEL: software for association mapping of complex traits indiverse samples. Bioinformatics 23, 2633–2635. doi: 10.1093/bioinformatics/btm308
Brown, K. H., Rivera, J. A., Bhutta, Z., Gibson, R. S., King, J. C., Lönnerdal, B., et al. (2004). International Zinc Nutrition Consultative Group (IZiNCG). Assessment of the risk of zinc deficiency in populations and options for its control. Food Nutr. Bull. 25(Suppl.2), S99–S203.
Brown, K. H., Wuehler, S. E., and Peerson, J. M. (2001). The importance of zinc in human nutrition and estimation of the global prevalence of zinc deficiency. Food Nutr. Bull. 22, 113–125. doi: 10.1177/156482650102200201
Caulfield, L. E., Richard, S. A., and Black, R. E. (2004). Under nutrition as an underlying cause of malaria morbidity and mortality in children less than five years old. Am. J. Trop. Med. Hyg. 71, S55–S63.
Choi, E. Y., Graham, R., and Stangoulis, J. (2007). Semi-quantitative analysis for selecting Fe-andZn-dense genotypes of staple food crops. J. Food Compos. Anal. 7, 496–505. doi: 10.1016/j.jfca.2007.01.004
Descalsota, G. I. L., Swamy, M., Zaw, H., Asilo, M. A., Amparado, A., Mauleon, R. P., et al. (2018). Genome-wide association mapping in a rice MAGIC plus population detects QTLs and genes useful for biofortification. Front. Plant Sci. 9:1347. doi: 10.3389/fpls.2018.01347
Earl, D. A., and vonHoldt, B. (2012). Structure harvester: a website and program for visualizing structure output and implementing the Evanno method. Cons. Genet. Res. 4, 359–361. doi: 10.1007/s12686-011-9548-7
Edzesi, W. M., Dang, X., Liang, L., Liu, E., Zaid, I. U., and Hong, D. (2016). Genetic diversity and elite allele mining for grain traits in rice (Oryza sativa L.) by association mapping. Front. Plant Sci. 7:787. doi: 10.3389/fpls.2016.00787
Evanno, G., Regnaut, S., and Goudet, J. (2005). Detecting the number of clusters of individuals using the software structure: a simulation study. Mol. Ecol. 14, 2611–2620. doi: 10.1111/j.1365-294x.2005.02553.x
Feng, Y., Lu, Q., Zhai, R., Zhang, M., Xu, Q., Yang, Y., et al. (2016). Genome wide association mapping for grain shape traits in indica rice. Planta 244, 819–830. doi: 10.1007/s00425-016-2548-9
Garcia, F. S. A., Thuillet, A. C., Yu, J., Pressoir, G., Romero, S. M., Mitchell, S. E., et al. (2005). Maize association population: a high-resolution platform for quantitative trait locus dissection. Plant J. 44, 1054–1064. doi: 10.1111/j.1365-313X.2005
Garcia-Oliveira, A. L., Tan, L., Fu, Y., and Sun, C. (2009). Genetic identification of quantitative trait loci for contents of mineral nutrients in rice grain. J. Integr. Plant Biol. 51, 84–92. doi: 10.1111/j.1744-7909.2008.00730.x
Goto, F., Yoshihara, T., Shigemoto, N., Toki, S., and Takaiwa, F. (1999). Iron fortification of rice seed by the soybean ferritin gene. Nat. Biotechnol. 17, 282–286. doi: 10.1038/7029
Gregorio, G. B., Senadhira, D., Htut, H., and Graham, R. D. (2000). Breeding for trace mineraldensity in rice. Food Nutr. Bull. 21, 382–386. doi: 10.1177/156482650002100407
Hoang, G. T., Gantet, P., Nguyen, K. H., Phung, N. T. P., Ha, L. T., Nguyen, T. T., et al. (2019). Genome-wide association mapping of leaf mass traits in a Vietnamese rice landrace panel. PLoS One 14:e0219274. doi: 10.1371/journal.pone.0219274
Huang, X., Wei, X., Sang, T., Zhao, Q., Feng, Q., Zhao, Y., et al. (2010). Genome-wide association studies of 14 agronomic traits in rice landraces. Nat. Genet. 42, 961–967. doi: 10.1038/ng.695
Huang, Y., Sun, C., Min, J., Chen, Y., Tong, C., and Bao, J. (2015). Association mapping of quantitative trait loci for mineral element contents in whole grain rice (Oryza sativa L.). J. Agric. Food. Chem. 63, 10885–10892. doi: 10.1021/acs.jafc.5b04932
Jaiswal, V., Bandyopadhyay, T., Gahlaut, V., Gupta, S., Dhaka, A., Ramchiary, N., et al. (2019). Genome-wide association study (GWAS) delineates genomic loci for ten nutritional elements in foxtail millet (Setariaitalica L.). J. Cereal Sci. 85, 48–55. doi: 10.1016/j.jcs.2018.11.006
Johnson, A. A., Kyriacou, B., Callahan, D. L., Carruthers, L., Stangoulis, J., Lombi, E., et al. (2011). Constitutive overexpression of the OsNAS gene family reveals single-gene strategies for effective iron- and zinc-biofortification of rice endosperm. PLoS One 6:e24476. doi: 10.1371/journal.pone.0024476
Kaler, A. S., and Purcell, L. C. (2019). Estimation of a significance threshold for genome-wide association studies. BMC Genomics 20:618. doi: 10.1186/s12864-019-5992-7
King, J., Cousins, R., and Shils, M. (eds) (2006). Modern Nutrition in Health and Disease, 10th Edn. Philadelphia, PA: Lippincott Williams and Wilkins, 271–285.
Kyriacou, B., Alexander, J. A. T., Howard, L. D., Paterson, D., Lombi, E., Stangoulis, J., et al. (2014). Localization of iron in rice grain using synchrotron X-ray fluorescence microscopy and high resolution secondary ion mass spectrometry. J. Cereal Sci. 59, 173–180. doi: 10.1016/j.jcs.2013.12.006
Lee, S., Jeon, U. S., Lee, S. J., Kim, Y. K., Persson, D. P., Husted, S., et al. (2009). Iron fortification of rice seeds through activation of the nicotianamine synthase gene. Proc. Natl. Acad. Sci. U.S.A. 106, 22014–22019. doi: 10.1073/pnas.0910950106
Lim, K., Riddell, L., Nowson, C., Booth, A., and Szymlek-Gay, E. (2013). Iron and zinc nutrition in the economically-developed world: a review. Nutrients 5, 3184–3211. doi: 10.3390/nu5083184
Lipka, A. E., Tian, F., Wang, Q., Peiffer, J., Li, M., Bradbury, P. J., et al. (2012). GAPIT: genome association and prediction integrated tool. Bioinformatics 28, 2397–2399. doi: 10.1093/bioinformatics/bts444
Liu, X., Huang, M., Fan, B., Buckler, E. S., and Zhang, Z. (2016). Iterative usage of fixed and random effect models for powerful and efficient genome-wide association studies. PLoS Genet. 12:e1005767. doi: 10.1371/journal.pgen.1005767
Liu, X. L. (2015). Development of an Iterative Usage of Fixed Effect and Random Effect Models for Powerful and Efficient Genome-Wide Association Studies. Master’s thesis, Huazhong agricultural University, Wuhan.
Ma, X., Feng, F., Wei, H., Mei, H., Xu, K., Chen, S., et al. (2016). Genome-wide association study for plant height and grain yield in rice under contrasting moisture regimes. Front. Plant Sci. 7:1801. doi: 10.3389/fpls.2016.01801
Maganti, S., Swaminathan, R., and Parida, A. (2019). Variation in Iron and Zinc content in traditional rice genotypes. Agric. Res. doi: 10.1007/s40003-019-00429-3
Maldonado, C., Mora, F., Scapim, C. A., and Coan, M. (2019). Genome-wide haplotype-based association analysis of key traits of plant lodging and architecture of maize identifies major determinants for leaf angle: hapLA4. PLoS One 14:e0212925. doi: 10.1371/journal.pone.0212925
Masuda, H., Ishimaru, Y., Aung, M. S., Kobayashi, T., Kakei, Y., Takahashi, M., et al. (2012). Iron biofortification in rice by the introduction of multiple genes involved in iron nutrition. Sci. Rep. 2:543. doi: 10.1038/srep00543
Murray, M. G., and Thompson, W. F. (1980). Rapid isolation of high molecular weight plant DNA. Nucleic Acids Res. 8, 4321–4325. doi: 10.1093/nar/8.19.4321
Norton, G. J., Douglas, A., Lahner, B., Yakubova, E., Guerinot, M. L., Pinson, S. R., et al. (2014). Genome wide association mapping of grain Arsenic, Copper, Molybdenum and Zinc in rice (Oryza sativa L.) grown at four international field sites. PLoS One 9:e89685. doi: 10.1371/journal.pone.0089685
Pradhan, S. K., Pandit, E., Pawar, S., Naveenkumar, R., Barik, S. R., Mohanty, S. P. et al. (2020). Linkage disequilibrium mapping for grain Fe and Zn enhancing QTLs useful for nutrient dense rice breeding. BMC Plant Biol. 20:57. doi: 10.1186/s12870-020-2262-4
Prasad, A. S. (1991). Discovery of human zinc deficiency and studies in an experimental human model. Am. J. Clin. Nutr. 53, 403–412. doi: 10.1093/ajcn/53.2.403
Pritchard, J. K., Stephens, M., and Donnelly, P. (2000). Inference of population structure using multilocus genotype data. Genetics 155, 945–959.
Prom-u-Thai, C., Dell, B., Thomson, G., and Rerkasem, B. (2003). Easy and rapid detection of iron in rice grain. Sci. Asia 29, 203–207. doi: 10.2306/scienceasia1513-1874
Qiu, C., Zhao, M., Decker, E. A., and McClements, D. J. (2015). Influence of anionic dietary fibers (xanthan gum and pectin) on oxidative stability and lipid digestibility of wheat protein-stabilized fish oil-in-water emulsion. Food Res. Int. 74, 131–139. doi: 10.1016/j.foodres.2015.04.022
Ramesh, S. A., Shin, R., Eide, D. J., and Schachtman, D. P. (2003). Differential metal selectivity and gene expression of two zinc transporters from rice. Plant Physiol. 133, 126–134. doi: 10.1104/pp.103.026815
Ren, W. L., Wen, Y. J., Dunwell, J. M., and Zhang, Y. M. (2018). pKWmEB: integration of Kruskal-Wallis test with empirical Bayes under polygenic background control for multi-locus genome-wide association study. Heredity 120, 208–218. doi: 10.1038/s41437-017-0007-4
Salgueiro, M. J., Zubillaga, M., Lysionek, A., Sarabia, M. I., Caro, R., De Paoli, T., et al. (2000). Zinc as an essential micronutrient: a review. Nutr. Res. 20, 737–755. doi: 10.1016/S0271-5317(00)00163-9
Sasaki, A., Yamaji, N., Mitani-Ueno, N., Kashino, M., and Ma, J. F. (2015). A node-localized transporter OsZIP3 is responsible for the preferential distribution of Zn to developing tissues in rice. Plant J. 84, 374–384. doi: 10.1111/tpj.13005
Singh, N., Jayaswal, P. K., Panda, K., Mandal, P., Kumar, V., Singh, B., et al. (2015). Single-copy gene based 50 K SNP chip for genetic studies and molecular breeding in rice. Sci. Rep. 5:11600. doi: 10.1038/srep11600
Stangoulis, J. C., Huynh, B. L., Welch, R. M., Choi, E. Y., and Graham, R. D. (2007). Quantitative trait loci for phytate in rice grain and their relationship with grain micronutrient content. Euphytica 154, 289–294. doi: 10.1007/s10681-006-9211-7
Stoltzfus, R. J. (2001). Iron-deficiency anemia: reexamining the nature and magnitude of the public health problem Summary: implications for research and programs. J. Nutr. 131, 697S–700S. doi: 10.1093/jn/131.2.697S
Swamy, B. P. M., Kaladhar, K., Anuradha, K., Batchu, A. K., Longvah, T., and Sarla, N. (2018). QTL analysis for grain iron and zinc concentrations in two O. nivara derived backcross populations. Rice Sci. 25, 197–207. doi: 10.1016/j.rsci.2018.06.003
Takahashi, M., Terada, Y., Nakai, I., Nakanishi, H., Yoshimura, E., Mori, S., et al. (2003). Role of nicotianamine in the intracellular delivery of metals and plant reproductive development. Plant Cell 15, 1263–1280. doi: 10.1105/tpc.010256
Tamba, C. L., Ni, Y. L., and Zhang, Y. M. (2017). Iterative sure independence screening M-Bayesian LASSO algorithm for multi-locus genome-wide association studies. PLoS Comput. Biol. 13:e1005357. doi: 10.1371/journal.pcbi.1005357
Trijatmiko, K. R., Dueñas, C., Tsakirpaloglou, N., Torrizo, L., Arines, F. M., Adeva, C., et al. (2016). Biofortifiedindica rice attains iron and zinc nutrition dietary targets in the field. Sci. Rep. 6:19792. doi: 10.1038/srep19792
von Wiren, N., Klair, S., Bansal, S., Briat, J. F., Khodr, H., Shioiri, T., et al. (1999). Nicotianamine chelates both FeIII and FeII. Implications for metal transport in plants. Plant Physiol. 119, 1107–1114. doi: 10.1104/pp.119.3.1107
Wallace, J. G., Zhang, X., Beyene, Y., Semagn, K., Olsen, M., Prasanna, B. M., et al. (2016). Genome-wide association for plant height and flowering time across 15 tropical maize populations under managed drought stress and well-watered conditions in Sub-Saharan Africa. Crop Sci. 56, 2365–2378. doi: 10.2135/cropsci2015.10.0632
Wang, Y., Zheng, Y., Cai, Q., Liao, C., Mao, X., Xie, H., et al. (2016). Population structure and association analysis of yield and grain quality traits in hybrid rice primal parental lines. Euphytica 212, 261–273. doi: 10.1007/s10681-016-1766-3
Ward, B. P., Brown-Guedira, G., Kolb, F. L., Van Sanford, D. A., Tyagi, P., Sneller, C. H., et al. (2019). Genome-wide association studies for yield-related traits in soft red winter wheat grown in Virginia. PLoS One 14:e0208217. doi: 10.1371/journal.pone.0208217
Wei, W., Mesquita, A. C. O., Figueiró, A. D. A., Wu, X., Manjunatha, S., Wickland, D. P., et al. (2017). Genome-wide association mapping of resistance to a Brazilian isolate of Sclerotinia sclerotiorum in soybean genotypes mostly from Brazil. BMC Genomics 18:849. doi: 10.1186/s12864-017-4160-1
Wirth, J., Poletti, S., Aeschlimann, B., Yakandawala, N., Drosse, B., Osorio, S., et al. (2009). Rice endosperm iron biofortification by targeted and synergistic action of nicotianamine synthase and ferritin. Plant Biol. J. 7, 631–644. doi: 10.1111/j.1467-7652.2009.00430.x
Wood, R., Ronnenberg, A., and Shils, M. (eds) (2006). Modern nutriTion in Health and Disease, 10th Edn. Philadelphia, PA: Lippincott Williams and Wilkins, 248–270.
Xu, Y., Xu, C., and Xu, S. (2017). Prediction and association mapping of agronomic traits in maize using multiple omic data. Heredity 119, 174–184. doi: 10.1038/hdy.2017.27
Xu, Y., Yang, T., Zhou, Y., Yin, S., Li, P., Liu, J., et al. (2018). Genome-wide association apping of starch pasting properties in maize using single-locus and multi-locus models. Front. Plant Sci. 9:1311. doi: 10.3389/fpls.2018.01311
Ya-fang, Z., Yu-yin, M. A., Zong-xiang, C., Jie, Z., Tian-xiao, C., Qian-qian, L., et al. (2015). Genome-wide association studies reveal new genetic targets for five panicle traits of international rice varieties. Rice Sci. 22, 217–226. doi: 10.1016/j.rsci.2015.07.001
Yang, M., Lu, K., Zhao, F. J., Xie, W., Ramakrishna, P., Wang, G., et al. (2018). Genome-wide association studies reveal the genetic basis of ionomic variation in rice. Plant Cell 30, 2720–2740. doi: 10.1105/tpc.18.00375
Yonemaru, J. I., Yamamoto, T., Ebana, K., Yamamoto, E., Nagasaki, H., Shibaya, T., et al. (2012). Genome-wide haplotype changes produced by artificial selection during modern rice breeding in Japan. PLoS One 7:e32982. doi: 10.1371/journal.pone.0032982
Yuan, L., Wu, L., Yang, C., and Lv, Q. (2013). Effects of iron and zinc foliar applications on rice plants and their grain accumulation and grain nutritional quality. J. Sci. Food Agric. 93, 254–261. doi: 10.1002/jsfa.5749
Zhang, C. M., Zhao, W. Y., Gao, A. X., Su, T. T., Wang, Y. K., Zhang, Y. Q., et al. (2018). How could agronomic biofortification of rice be an alternative strategy with higher cost-effectiveness for human iron and zinc deficiency in China? Food Nutr. Bull. 39, 246–259. doi: 10.1177/0379572117745661
Zhang, P., Liu, X., Tong, H., Lu, Y., and Li, J. (2014). Association mapping for important agronomic traits in core collection of rice (Oryza sativa L.) with SSR markers. PLoS One 9:e111508. doi: 10.1371/journal.pone.0111508
Zhou, B., Zhao, H., Puig, X., Xiao, T., Fidler, S., Barriuso, A., et al. (2019). Semantic understanding of scenes through the ade20k dataset. Int. J. Comput. Vis. 127, 302–321. doi: 10.1007/s11263-018-1140-0
Keywords: Fe, Zn, biofortification, GWAS, donors, rice, milled rice, brown rice
Citation: Bollinedi H, Yadav AK, Vinod KK, Gopala Krishnan S, Bhowmick PK, Nagarajan M, Neeraja CN, Ellur RK and Singh AK (2020) Genome-Wide Association Study Reveals Novel Marker-Trait Associations (MTAs) Governing the Localization of Fe and Zn in the Rice Grain. Front. Genet. 11:213. doi: 10.3389/fgene.2020.00213
Received: 12 September 2019; Accepted: 24 February 2020;
Published: 22 April 2020.
Edited by:
Balram Marathi, Professor Jayashankar Telangana State Agricultural University, IndiaReviewed by:
Jieyun Zhuang, Zhejiang University, ChinaZhao Hu, Huazhong Agricultural University, China
Copyright © 2020 Bollinedi, Yadav, Vinod, Gopala Krishnan, Bhowmick, Nagarajan, Neeraja, Ellur and Singh. This is an open-access article distributed under the terms of the Creative Commons Attribution License (CC BY). The use, distribution or reproduction in other forums is permitted, provided the original author(s) and the copyright owner(s) are credited and that the original publication in this journal is cited, in accordance with accepted academic practice. No use, distribution or reproduction is permitted which does not comply with these terms.
*Correspondence: Ashok Kumar Singh, YWtzX2dlbmVAeWFob28uY29t