 Elena Flavia Mouresan1
 Aldemar González-Rodríguez1
 Jhon Jacobo Cañas-Álvarez2Sebastián Munilla1,3Juan Altarriba1Clara Díaz4Jesús A. Baró5Antonio Molina6Pascual Lopez-Buesa1Jesús Piedrafita2
 Luis Varona1*
- 1Departamento de Anatomía, Embriología y Genética Animal, Universidad de Zaragoza, Zaragoza, Spain
- 2Departament de Ciència Animal i dels Aliments, Universitat Autònoma de Barcelona, Barcelona, Spain
- 3Departamento de Producción Animal, Facultad de Agronomía, Universidad de Buenos Aires, CONICET, Buenos Aires, Argentina
- 4Departamento de Mejora Genética Animal, Instituto Nacional de Investigación y Tecnología Agraria y Alimentaria (INIA), Madrid, Spain
- 5Instituto Agroalimentario de Aragón (IA2), Zaragoza, Spain
- 6Departamento de Ciencias Agroforestales, Universidad de Valladolid, Valladolid, Spain
- 7Departamento de Genética, Universidad de Córdoba, Córdoba, Spain
- 8Departamento de Producción Animal y Ciencia de los Alimentos, Universidad de Zaragoza, Zaragoza, Spain
In organisms with sexual reproduction, genetic diversity, and genome evolution are governed by meiotic recombination caused by crossing-over, which is known to vary within the genome. In this study, we propose a simple method to estimate the recombination rate that makes use of the persistency of linkage disequilibrium (LD) phase among closely related populations. The biological material comprised 171 triplets (sire/dam/offspring) from seven populations of autochthonous beef cattle in Spain (Asturiana de los Valles, Avileña-Negra Ibérica, Bruna dels Pirineus, Morucha, Pirenaica, Retinta, and Rubia Gallega), which were genotyped for 777,962 SNPs with the BovineHD BeadChip. After standard quality filtering, we reconstructed the haplotype phases in the parental individuals and calculated the LD by the correlation -r- between each pair of markers that had a genetic distance < 1 Mb. Subsequently, these correlations were used to calculate the persistency of LD phase between each pair of populations along the autosomal genome. Therefore, the distribution of the recombination rate along the genome can be inferred since the effect of the number of generations of divergence should be equivalent throughout the genome. In our study, the recombination rate was highest in the largest chromosomes and at the distal portion of the chromosomes. In addition, the persistency of LD phase was highly heterogeneous throughout the genome, with a ratio of 25.4 times between the estimates of the recombination rates from the genomic regions that had the highest (BTA18-7.1 Mb) and the lowest (BTA12-42.4 Mb) estimates. Finally, an overrepresentation enrichment analysis (ORA) showed differences in the enriched gene ontology (GO) terms between the genes located in the genomic regions with estimates of the recombination rate over (or below) the 95th (or 5th) percentile throughout the autosomal genome.
Introduction
Recombination caused by crossing-over during meiosis play a crucial role in the genetic diversity and the genome evolution of organisms with sexual reproduction (Arnheim et al., 2007). It creates new genetic variation by generating novel combinations of grand-paternal and grand-maternal genetic information, and it helps to remove deleterious mutations that might otherwise accumulate (Tiemann-Boege et al., 2017).
In most studies of genome-wide association or genomic selection, the distribution of crossing-over events had been considered uniform, although there is strong evidence that recombination rate is heterogeneous along the genome (Myers et al., 2005; Stapley et al., 2017). In general, recombination is higher in the regions of the telomeres and smaller near the centromere (Coop and Przeworski, 2007; Ma et al., 2015). Due to recombination, the genome is organized into haplotype blocks of varying lengths, as described in humans (Gabriel et al., 2002) and other species as rat and mouse (Guryev et al., 2006) and cattle (Mokry et al., 2014). The reason of this structure is the presence of small genomic regions that have a higher rate of recombination, known as recombination hotspots (Paigen and Petkov, 2010).
In addition, patterns of the recombination rate throughout the genome vary among species, populations, or even within individuals in different environments (Stapley et al., 2017). The evolution of the distribution of the recombination rate along the genome is an active research field (Dapper and Payseur, 2017). In general, it differs according to the genomic scale in which the recombination rate is measured (Smukowski and Noor, 2011). In a very fine scale (few kb), a rapid divergence of the recombination rate between mammal populations is observed (Auton et al., 2012; Stevison et al., 2016), whereas greater correlations are observed between closely related populations when they are calculated through larger chromosomal segments (Smukowski and Noor, 2011; Shen et al., 2018).
Traditionally, the distribution of the crossing-overs or recombination events within the genome has been studied by counting the number of chiasmata during meiosis (Hulten et al., 1982) or from linkage maps created from a limited number of genetic markers or phenotypes (Sturtevant, 1913). In recent years, high-throughput sequencing and genotyping technologies have provided a valuable new tool for measuring recombination rates with two main group of methods. First, estimates of recombination rates are based on observations of recombination events in large pedigrees between pairs of parent-offspring genotypes (Kong et al., 2010; Ma et al., 2015; Shen et al., 2018) or in sperm typing (Sarbajna et al., 2012) and require genotypic information from a large number of families or sperm cells. Second, other methods are based on the identification of local patterns in linkage disequilibrium (LD) with coalescent methods (McVean et al., 2002; Li and Stephens, 2003; Wall and Stevison, 2016), which estimate the background recombination rate ρw=4Nwcw −, where Nw and cw are the indistinguishable effective population size and recombination rate for a specific window of the genome, respectively. The main limitation of the last approach is that the effective population size can vary dramatically over time. In fact, the decay of LD has been used to estimate past population history in humans (Hayes et al., 2003; Tenesa et al., 2007; Park, 2012) and livestock populations (Hayes et al., 2003; De Roos et al., 2008; Xu et al., 2019).
In addition, stratification of the population can severely distort the estimates of recombination rates because subdivisions of the population have a strong effect on LD estimates (Hinrichs et al., 2009). After reproductive isolation, the structure of LD tends to differ between subpopulations and the similarity (or persistency) of those LD patterns depends on the number of generations of divergence and the recombination rate plus other evolutionary events such as admixture or variations on the effective size of the populations (Hill and Robertson, 1968). For this reason, if genotypic information is available for closely related populations, measures of genome-wide persistency of LD phase among populations throughout the genome can be used to infer the distribution of recombination rate. The rationale of this approach is that genetic drift, admixture, or variations of the effective size should affect the entire genome with similar intensity and the heterogeneity of the persistency of LD phase is linked to variations on the recombination rate.
Therefore, the objective of this study was to develop a procedure to infer the distribution of the recombination rate from the persistency of LD phase among closely related populations and to apply it to genotypic data from seven beef cattle populations in Spain.
Materials and Methods
The genomic data comprised the BovineHD Genotyping Beadchip (777,962 SNPs, Illumina) genotypes from 171 non-related triplets of sire, dam, and one offspring from seven breeds, being 25 Asturiana de los Valles (AV), 24 Avileña - Negra Ibérica (ANI), 25 Bruna dels Pirineus (BP), 25 Morucha (Mo), 24 Pirenaica (Pi), 24 Retinta (Re), and 24 Rubia Gallega (RG) triplets. This dataset has been used to analyze genetic differentiation (Cañas-Álvarez et al., 2015; Cañas-Álvarez et al., 2016; González-Rodríguez et al., 2017), signatures of selection (González-Rodríguez et al., 2016), and haplotype diversity (Mouresan et al., 2017). These breeds represent 72% of the total census of local beef breeds in Spain (Ministerio de Medio Ambiente y Medio Rural y Marino, 2010) and their production systems are extensive or semi-extensive. The populations are reared in mountainous regions near the Pyrenees (Pirenaica and Bruna dels Pirineus) in the humid regions in northwestern Spain (Rubia Gallega and Asturiana de los Valles) or in pastures in semi-arid zones of the west and southwest of Spain (Retinta, Avileña Negra-Ibérica, and Morucha). The breeds differ in production and carcass traits (Piedrafita et al., 2003) and in their meat quality (Gil et al., 2001).
The triplets were sampled by the breeders associations with the aim of capturing most of the genetic variability of each population. We used an ad-hoc procedure that started with one triplet and incorporated the new ones by minimizing the total coancestry between them. The SNP filtering process included the following: 1) Mendelian error < 0.05, 2) SNP and individual call rates > 95%, and 3) Minor allele frequency (MAF) > 0.05 in pairs of populations. Only the SNPs that were located on autosomal chromosomes were retained. The filtering process yielded approximately 550,000 segregating markers for each pair of populations (see Table 1).
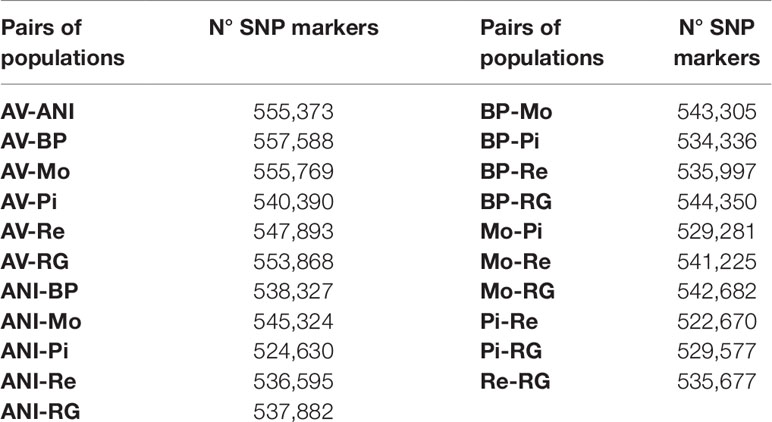
Table 1 Number of co-segregating SNP markers between all possible pairs of seven beef cattle populations in Spain [Asturiana de los Valles (AV), Avileña - Negra Ibérica (ANI), Bruna dels Pirineus (BP), Morucha (Mo), Pirenaica (P), Retinta (Re), Rubia Gallega (RG)].
The genomic information of the triplets was used to reconstruct the parental haplotypes with the TRIO option of the BEAGLE software (Browning and Browning, 2007), which were used to calculate the LD in each population and between each pair of markers (i.e. with alleles A and a, and B and b, respectively) that had a genomic distance < 1 Mb. LD was estimated as a correlation –r-, as follows:
where D = PABPabPAbPaB (Falconer and Mackay, 1996), PAB, Pab, PAb and Pab were the haplotype frequencies, and PA, Pa, PB, and Pb were the allelic frequencies.
To estimate the persistency of LD phase between pairs of populations, the Pearson correlations between LD estimates in each bin of 20 kb (0–20, 20–40, 40–60, 960–980, 980–1,000) within a 1 Mb window were calculated for each pair of populations. We obtained 50 correlation estimates (one per bin) between the LD estimates of each breed pair per window.
Under the assumption of constant variance of r (or effective population size) in both populations, the expectation of the correlation between LD estimates from a pair of SNP markers is e-2cT (Hill and Robertson, 1968; De Roos et al., 2008), where c is the recombination rate between the markers and T is the number of generations of divergence between populations. Initially, it was assumed that the recombination rate was 1.25 cM per Mb (Arias et al., 2009). The regression of the natural logarithm of the correlations on the genomic distance was calculated and the slope was equated to -2cT to estimate T between each pair of populations.
Once the numbers of generations of divergence (T) were estimated from all available SNP markers, they were assumed as known and replaced by their estimates. Subsequently, the same expression (-2cT) was used to estimate c, although the analysis was restricted only to the SNP markers within 1 Mb, which were centered every 0.1 Mb along the autosomal genome in sliding windows. Therefore, 25,098 estimates of c were calculated for each of the 21 population pairs.
Afterwards, the presence of a common pattern for the distribution of the recombination rate was checked calculating the correlation between the estimates from all population pairs. Next, the estimates of c were averaged by chromosome, relative position within the chromosome, and location within the genome to infer the distribution of the recombination rate (or the persistency of LD phase) throughout the bovine autosomal genome. The degree of inequality of the recombination rate along the autosomal genome was measured with the Gini index –G- (Ceriani and Verme, 2012) as:
Where ci and cj were the average estimates of the recombination rate for the 21 population pairs ad for the ith and jth genomic regions, ng was the total number of genomic regions (25,098) defined along the autosomal genome, and was the average of the 25,098 estimates of the recombination rate.
Finally, the 5th and 95th percentiles of the average recombination rates between pairs of populations in 0.1 Mb steps throughout the autosomal genome were calculated. Thereinafter, we prospected genes mapped within genomic regions falling out the 5–95th the percentile using the Biomart tool of Ensembl (Flicek et al., 2013) (www.ensembl.org). Further, we performed an Overrepresentation Enrichment Analysis (ORA) to determine if the overrepresentation of gene ontology (GO) terms differed between the two tails of the empirical distribution of recombination rates. We used the WEB-based Gene SeT AnaLysis Toolkit (www.webgestalt.org) using the Homo sapiens and Bos taurus annotation databases and with the complete genome as the reference set.
Results and Discussion
We have used the persistency of LD phase among seven closely related populations (Cañas-Álvarez et al., 2015) to infer the landscape of the recombination events in a sequential procedure that involved several steps. As in other studies in livestock populations (Brito et al., 2015; Biegelmeyer et al., 2016; Brito et al., 2017; Grossi et al., 2017), the similitude of LD among populations was very high between adjacent markers and decreased rapidly with genomic distance. In the first step, we used all the SNP markers to estimate the persistency of LD phase for each pair of populations as the slope of the regression analysis between the natural logarithm of the correlations between the r measures of LD in bins of 20 kb on the genomic distance. Theoretically, this relationship should be linear (Hill and Robertson, 1968; De Roos et al., 2008). However, the results varied according to the genomic distance evaluated (1 Mb, 500 Kb, 250 Kb, or 100 Kb). To illustrate this phenomenon, the results of the regression analysis between Re and RG are shown in Figure 1. The regression analysis of the data within a range of 250 Kb had the highest adjusted R2 (0.999) and the linear relationship between persistency of LD phase and genomic distance was evident only in those first 250 Kb. The results for the other population pairs were similar (Supplementary Information, Figures S1 to S20) and all of them had the highest adjusted R2 (> 0.998) with the first 250 Kb. In all population pairs, persistency of LD phase decayed rapidly over short distances, but in larger genomic distances remained > 0, as observed by De Roos et al. (2008). This is probably due to the fact that the populations were not totally divergent or due to the presence of some migration between them (De Roos et al., 2008) and consistent with a decrease in effective population size in cattle (Hayes et al., 2003).
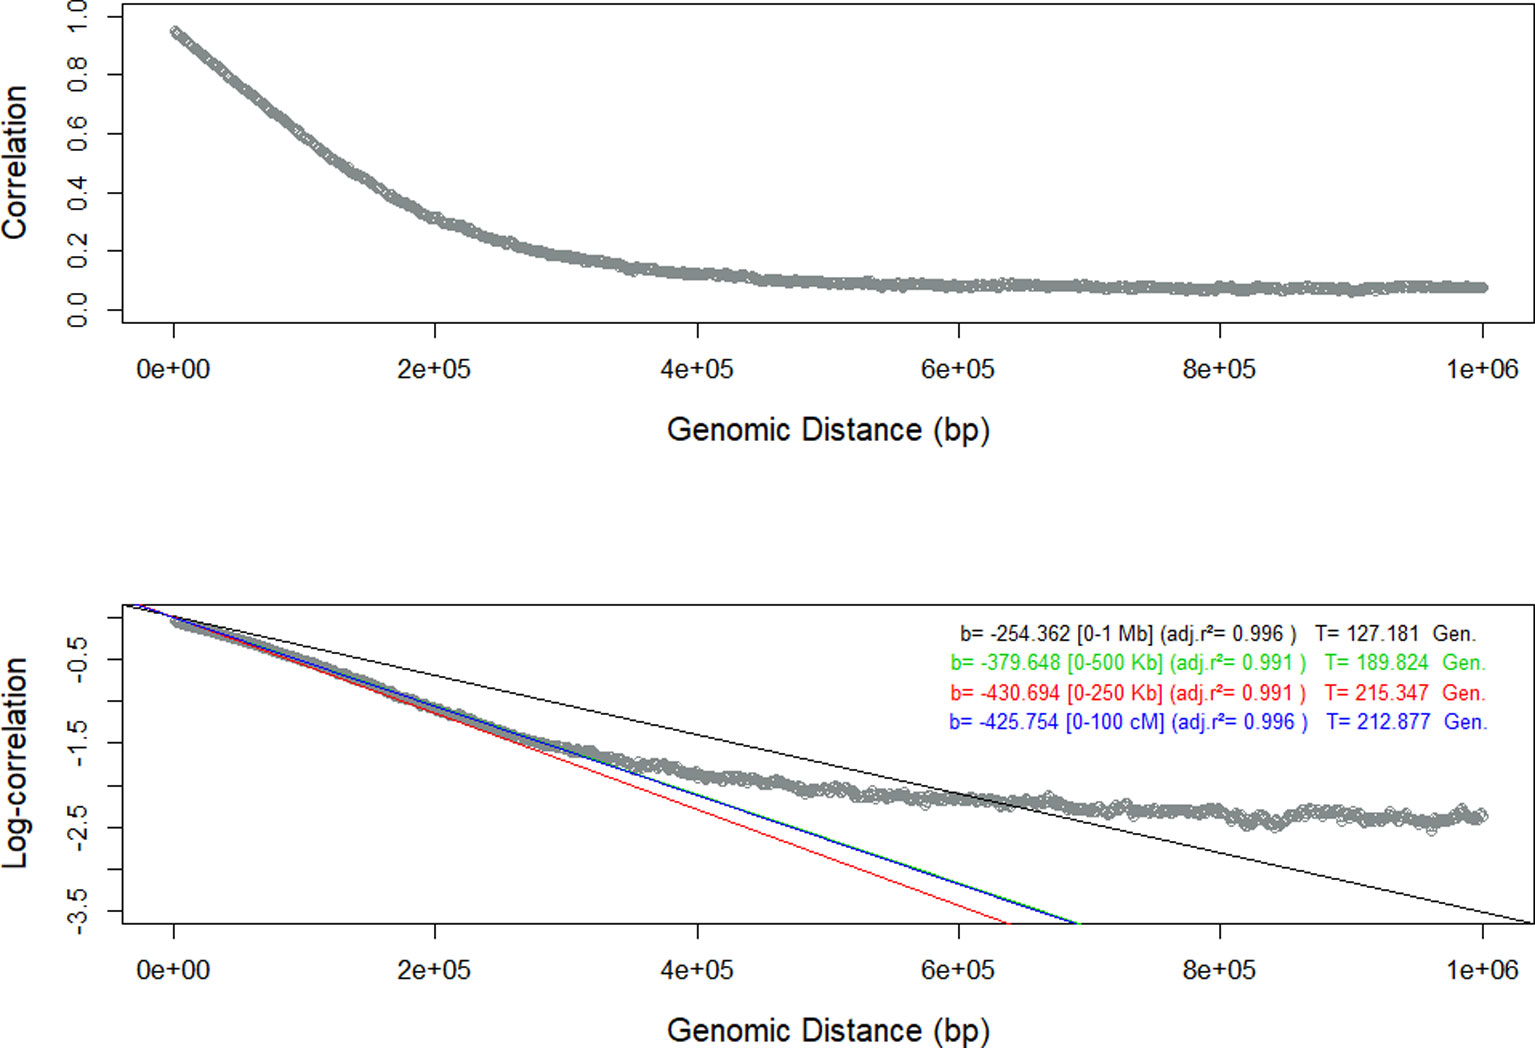
Figure 1 Persistency of Linkage Disequilibrium (LD) measured as the correlation and the log-correlation between the estimates of LD in Retinta (Re) and Rubia Gallega (RG) populations, and estimates of the slope of the regression with respect to the genomic distance for different ranges [0-1 Mb – black, 0-500 Kb-green, 0-250 Kb- red, and 0-100 Kb-blue].
In a second step, we restricted the analysis to the LD within 250 Kb and the slope of the regression analyses were equated to -2cT, with c set to 1.25 cM per Mb (Arias et al., 2009). We obtained 21 estimates of the number of generations of divergence (T) between populations (Table 2), that ranged from 132.3 (AV-BP) to 281.9 (Pi-Re). Estimates were in concordance with the results obtained by Cañas-Álvarez et al. (2016) for the same populations and dataset, and by De Roos et al. (2008) between two dairy populations (Holstein-Friesian and Jersey). However, the divergence times found in our study were lower than the observed between a dairy (Holstein) and beef (Angus) populations (De Roos et al., 2008).
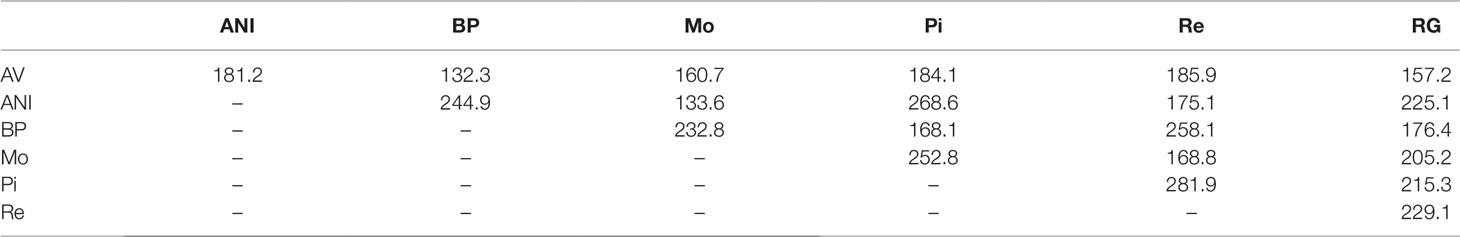
Table 2 Estimated number of generations of divergence between seven beef cattle populations in Spain [Asturiana de los Valles (AV), Avileña - Negra Ibérica (ANI), Bruna dels Pirineus (BP), Morucha (Mo), Pirenaica (P), Retinta (Re), Rubia Gallega (RG)] based on the architecture of Linkage Disequilibrium.
The estimates of T assumed that the variance of the LD (r) remained constant in each population and this is probably far from the truth. The effective size of the populations has decreased in the last generations (Cañas-Alvarez et al., 2016) and, thus, the estimates of T are probably overestimated. Nevertheless, the bias caused by the variations in the effective size should be similar throughout the autosomal genome and, therefore, local variations in the persistency of LD phase are informative for the inference of the recombination landscape along the autosomal genome.
After this preliminary step, we used the same expression (-2cT) to infer the distribution of the recombination rate c. Now, the numbers of generations of divergence (T) were assumed to be known and they were replaced by their estimates with all the SNP markers. In this case, we equated the slope of the regression of the persistency of LD phase on the genomic distance to -2cT, but the analysis was restricted to the SNP markers located within a sliding window of 1 Mb (500 kb downstream and 500 kb upstream) in steps of 0.1 Mb. We obtained as many as 25,098 estimates of c for each pair of populations (Figures S21 to S41). The rationale to this approach was that genetic drift and variations on the effective size of the populations should have affected the entire autosomal genome with the same intensity and, therefore, regional variation in the persistency of LD phase should reflect variations in the recombination rate. However, as in other LD-based procedures for estimating the recombination rate (Li and Stephens, 2003), it could also reflect differences in the intensity of the mutation rate or the occurrence of selection events.
Once the local estimates of c for the 21 pair of populations were available, we calculated the correlations between them (Figure 2). Values ranged from moderate (0.37) to strong (0.76), with an average of 0.55 and a standard deviation of 0.08. The results were consistent with the output of Table 2. The minimum correlation (0.37) was obtained between ANI-Mo and BP-Pi, which is consistent with the large number of generations of divergence between ANI and BP (244.9), ANI and Pi (268.6), Mo and BP (232.8), and Mo and Pi (252.8). In contrast, the greatest correlation was between ANI-BP and Mo-BP, given that the number of generations of divergence between ANI and Mo is only 133.6 generations. Therefore, given the noise in the LD estimates with small sample sizes, this average correlation and the consistency of estimates between pairs of populations should be considered very relevant. The similarity between estimates was within the same range than the reported between estimates of the recombination rate in human (Graffelman et al., 2007; Laayouni et al., 2011; Manu et al., 2018) and livestock (Petit et al., 2017; Shen et al., 2018) populations. Thus, somehow it confirms that similarities in the distribution of the recombination rate are achieved between closely related populations (Smukowski and Noor, 2011), such as the analyzed in this study (Cañas-Álvarez et al., 2015; González-Rodríguez et al., 2017). This similarity was even observed between pairs of populations that do not share any population (i. e. ANI-AV and BP-Pi), whose average correlation (0.52 ± 0.06) was only slightly lower than the average of the correlations between estimates from pairs that share (i.e. ANI-AV vs ANI-Mo) (0.58 ± 0.08). It reinforces the hypothesis that the similarity between persistence of LD phase at different locations of the genome and between pairs of populations is related with variations in the recombination rate throughout the genome.
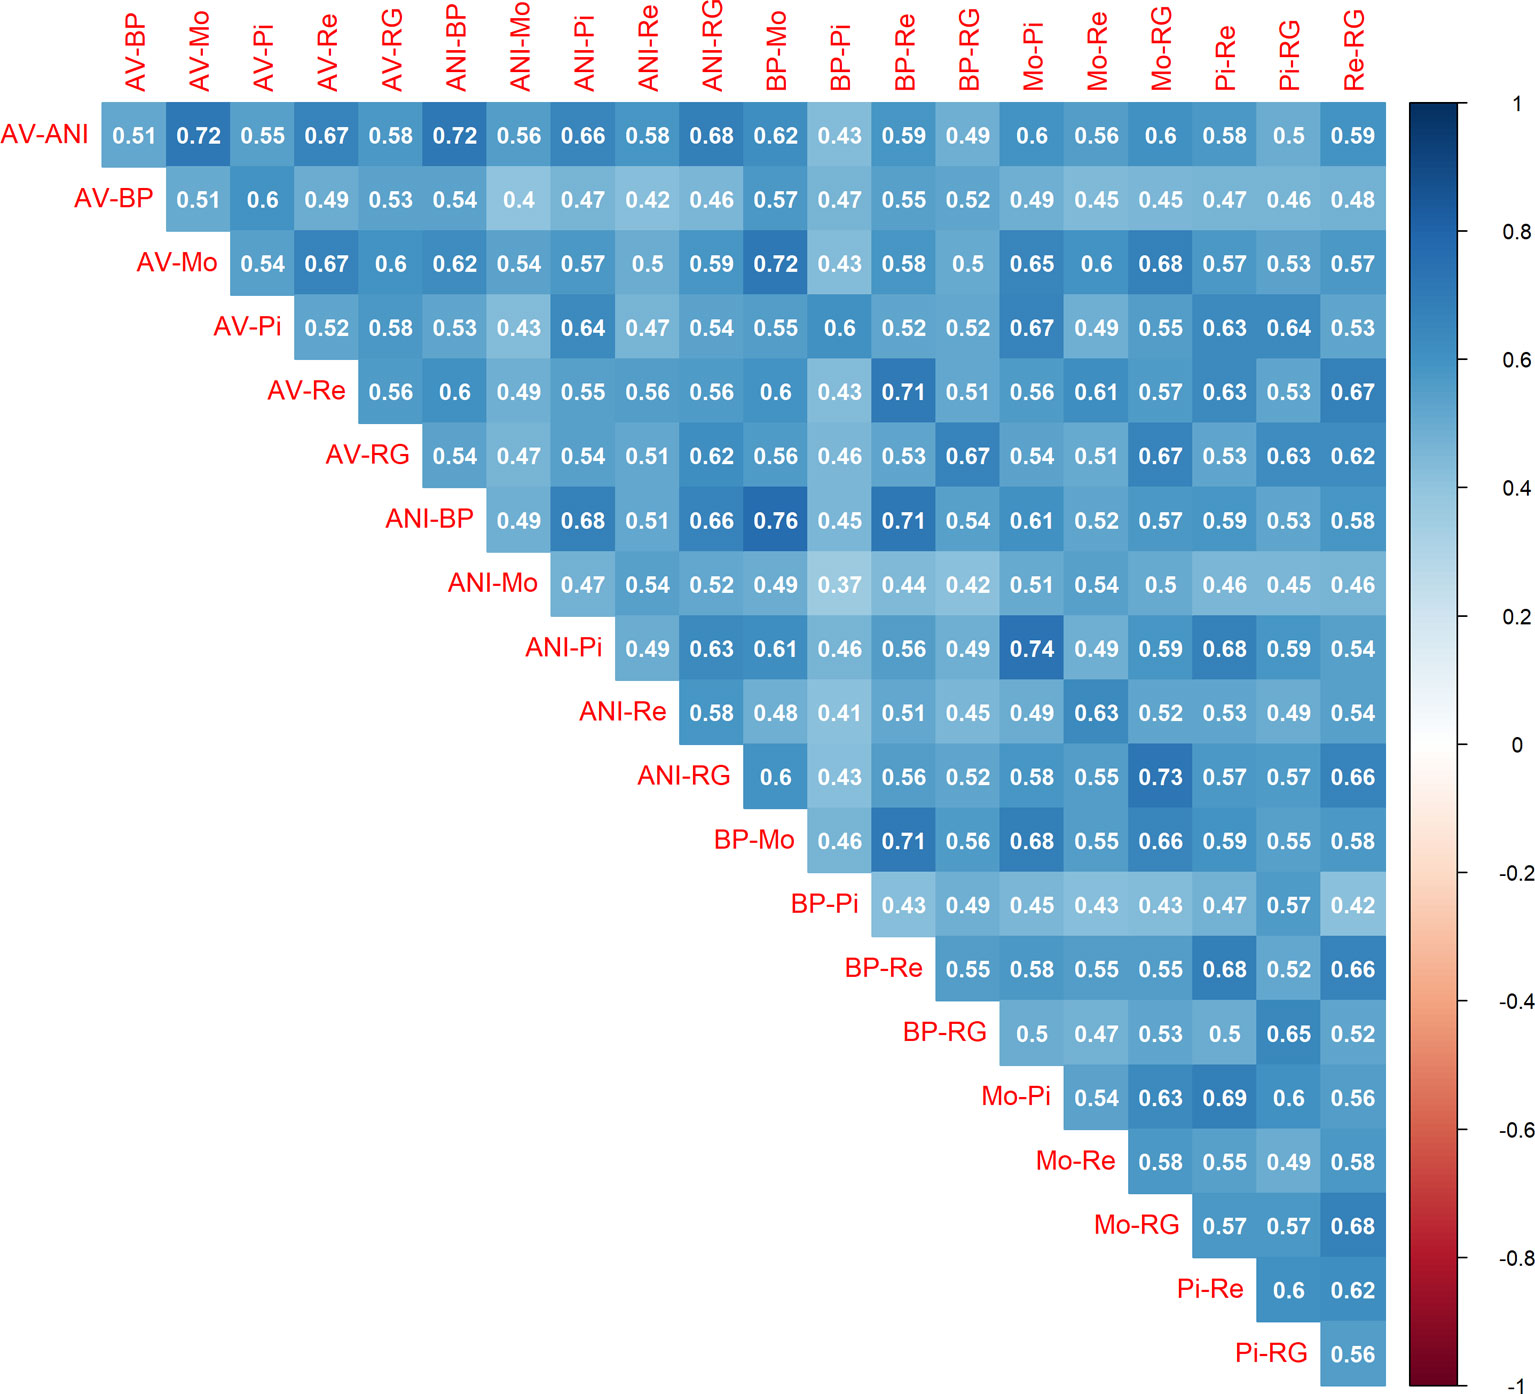
Figure 2 Correlations between the estimates of the recombination rate (c) in bins of 1 Mb between pairs of seven beef cattle populations in Spain [Asturiana de los Valles (AV), Avileña - Negra Ibérica (ANI), Bruna dels Pirineus (BP), Morucha (Mo), Pirenaica (P), Retinta (Re), Rubia Gallega (RG)].
Despite divergences associated with a specific population pair and possible selection events, the distribution of the persistency of LD phase appeared to follow a global pattern. Therefore, we used the estimates of c to describe the distribution of the recombination rate along the autosomal genome. Initially, we calculated an average of all of the estimates of c for each chromosome (Figure 3), which ranged from 1.12 cM per Mb in BTA9 to 1.50 cM per Mb in BTA25. In general, the largest chromosomes tended to have the lowest recombination rates. The relationship between recombination rate and chromosome length (Kaback et al., 1992; Jensen-Seaman et al., 2004; Li and Freudenberg, 2009) or genome length (Lynch, 2006) has been reported in several species and may be associated to the difficulties of small chromosomes to find their homologues during meiosis (Tiemann-Boege et al., 2017). In fact, Fledel-Alon et al. (2009) suggested that, in meiosis, each chromosome usually undergoes at least one crossing-over, which produces a very strong correlation between the average number of crossovers and chromosome length.
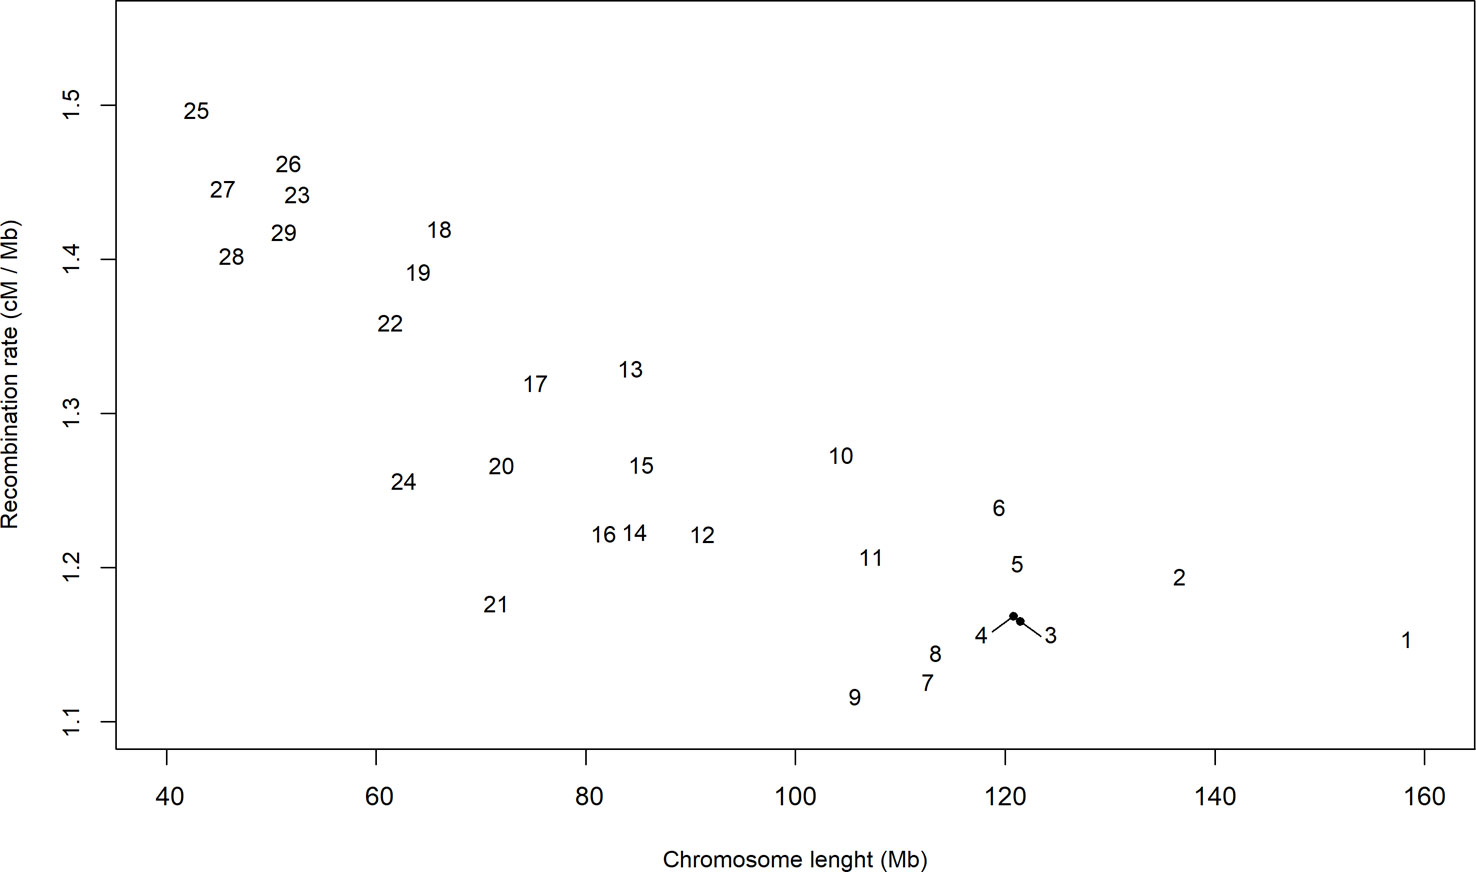
Figure 3 Average estimate per chromosome of the recombination rate (cM/Mb) in bins of 1 Mb and for all pairs of seven breeds of beef cattle populations in Spain.
Next, we evaluated the relationship between the recombination rate and the relative physical position within the chromosome by averaging the c estimates for each percentile along the length of each chromosome (Figure 4). The results were similar to those of Sandor et al. (2012); Ma et al. (2015), and Shen et al. (2018) in the bovine specie and to the results of haplotype diversity measured in the same populations (Mouresan et al., 2017). In cattle, all autosomal chromosomes are acrocentric (Popescu, 1990) and, in our study, the recombination rate was lowest at the beginning of the chromosome, near the centromere. Furthermore, a low recombination rate was evident at the middle of the chromosome, although the centromere of chromosomes in cattle is not located there. Ma et al. (2015) argued that the bimodal distribution of recombination rates might be caused by positive crossover interference. The highest recombination rate was at the distal portion of the chromosome (over the 95 % percentile of the relative position within chromosomes), in agreement with studies that have shown that recombination rate is highest at the telomeres (Nachman, 2002; Coop and Przeworski, 2007).
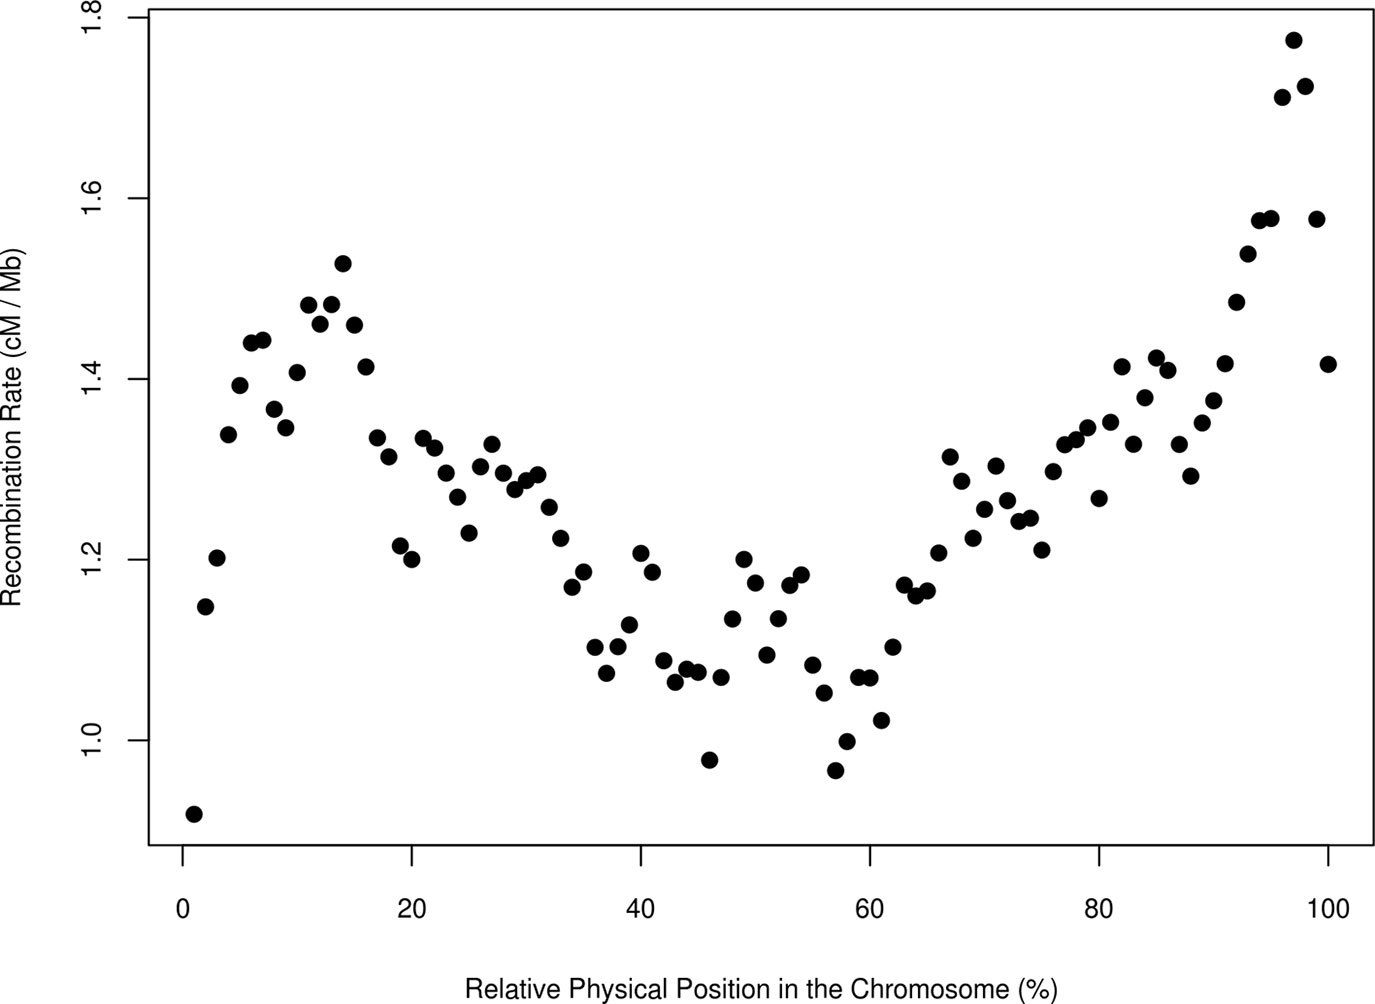
Figure 4 Average estimate of the recombination rate (cM/Mb) in bins of 1 Mb and for all pairs of populations and the relative physical position in the chromosome in seven breeds of beef cattle in Spain.
Additionally, a map of the recombination rates throughout the genome was calculated by averaging the estimates from the 21 pairs of populations in 0.1 Mb steps along the autosomal chromosomes (Figure 5). The average estimate of the recombination rate was 1.275 cM per Mb with a standard deviation of 0.381. As expected, the recombination rate was very similar to the rate assumed in the initial step of the study (1.25 cM per Mb). The estimated recombination rates within the genome were highly heterogeneous, and the ratio between the genomic regions that had the highest (BTA18-7.1 Mb) and the lowest (BTA12-42.4 Mb) estimated recombination rates was 25.37. To illustrate the differences between those two extreme regions of the genome, Figure 6 displays the average recombination rate and all specific persistencies of LD phase for each population pair.
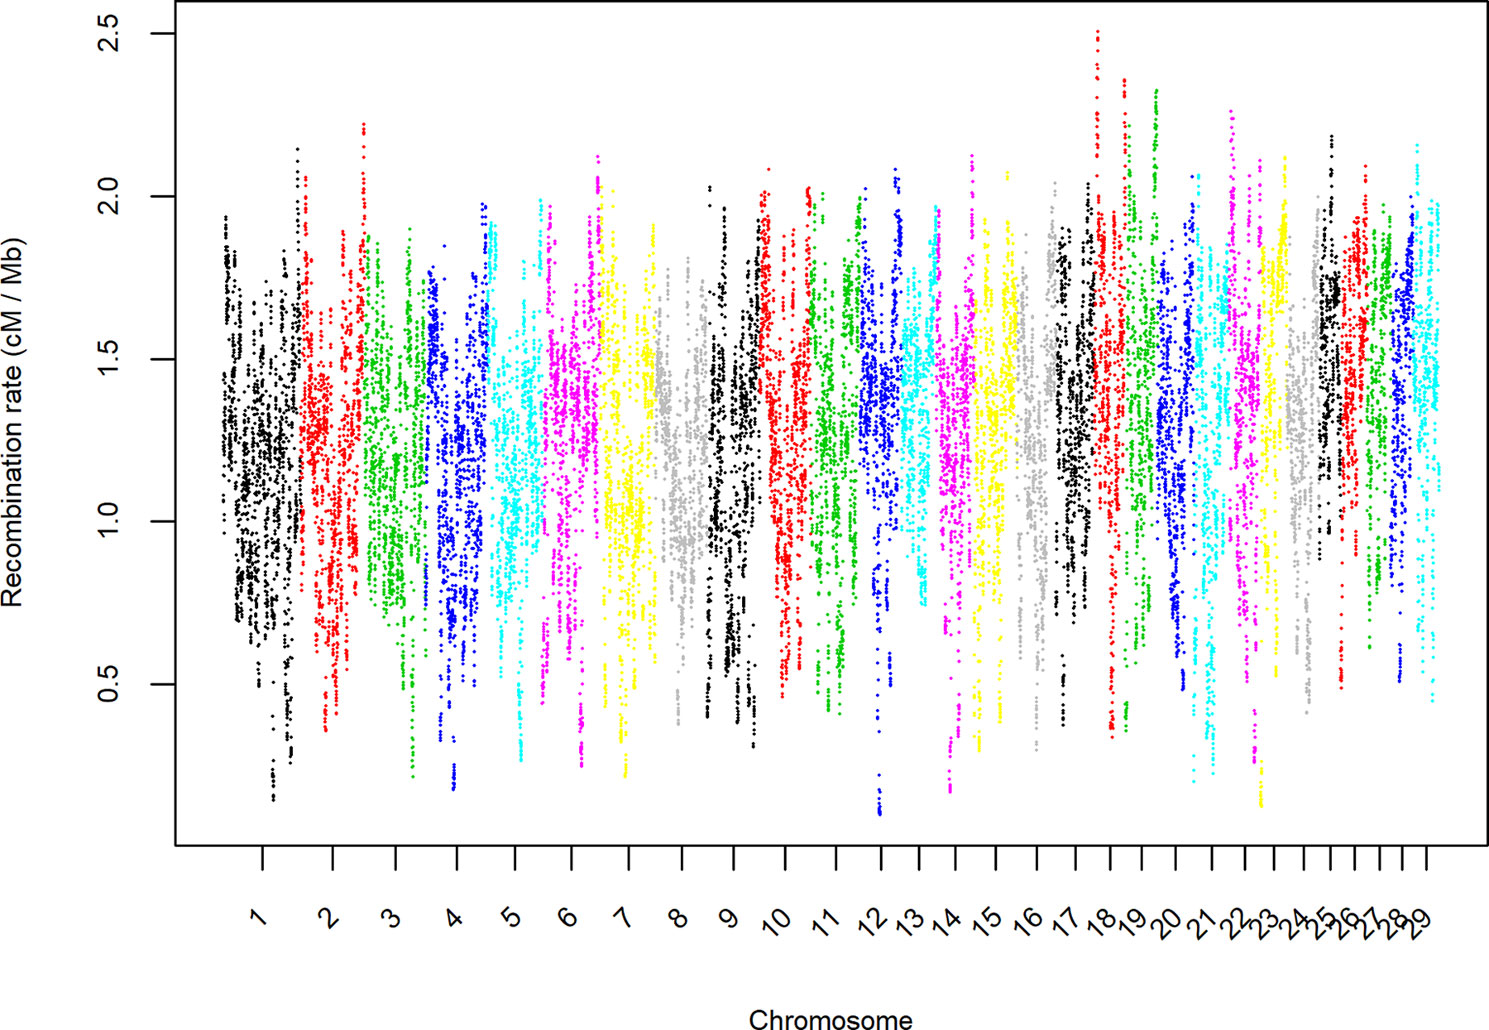
Figure 5 Average estimate of the recombination rate (cM/Mb) in bins of 1 Mb and throughout the autosomal genome for all pairs of seven beef cattle populations in Spain.
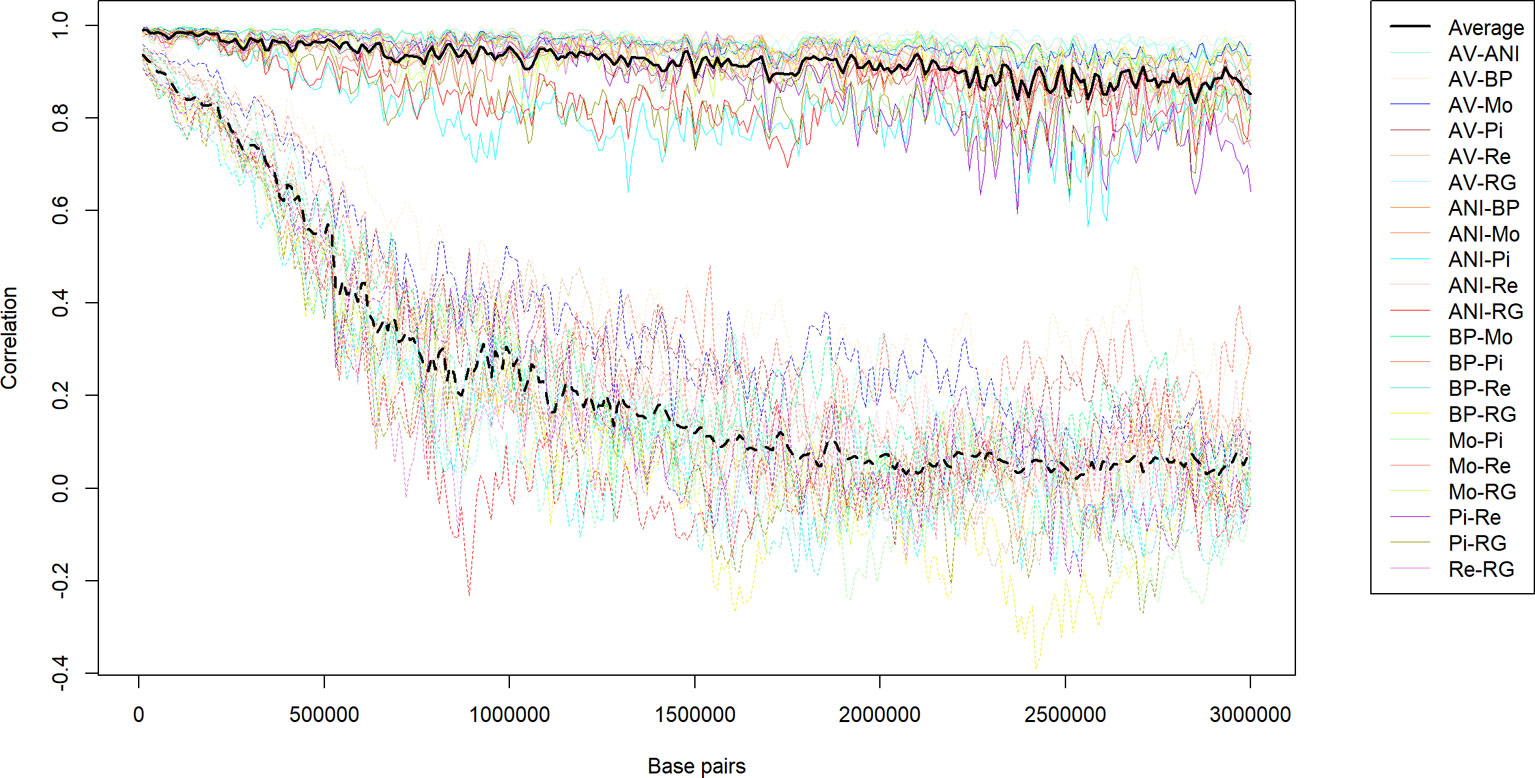
Figure 6 Average (bold lines) and specific population pair (transparent lines) persistency of LD (correlation between LD estimates in pairs of populations) in the genomic regions that had the highest (BTA12-42.4 Mb, continuous lines) or the lowest persistency (BTA18-7,1 Mb, dotted lines) among seven beef breeds in Spain.
The heterogeneity of the recombination rate reflected the presence of highly recombining genomic regions. Most of the recombination events may occur in a small portion of the genome, as observed in other species. However, the Gini index between the cumulative distributions of the recombination rate and the genetic distance was 0.1803, which is lower than others reported in human (Kong et al., 2002), apes (Stevison et al., 2016), and livestock (Petit et al., 2017) populations. It is likely that the Gini index was low because the method used in our study was only able to distinguish among the rates of recombination (as a measure of the persistency in LD phase) within relatively large genomic regions (1 Mb), and recombination hotspots often are restricted to 1–2 kb (Myers et al., 2005; Mancera et al., 2008).
The 5th and 95th percentiles of the recombination rate estimates were 0.593 and 1.856 cM per Mb, respectively, and we identified the genes within the genomic regions that had values that were either above or below those percentiles. The number of genes within the regions that were above the 95th (high recombination rate – HRR-) or below the 5th (low recombination rate –LRR-) percentiles were 665 and 669, respectively. Some studies have suggested that there is a negative correlation between gene density and the frequency of recombination hotspots (Myers et al., 2005; Freudenberg et al., 2009; Stapley et al., 2017), which was not detectable with the methods used in our study.
Furthermore, some authors (The International HapMap Consortium, 2007) have suggested that genes with highly conserved function are located surrounding regions with low recombination rate; on the other hand, HRR regions contains genes that are exposed to recurrent adaptive process to allow plasticity of organism to coming circumstances. In our study, we have tried to corroborate these statements using ORA with the GO terms for biological processes, cellular components, and molecular functions. The results are presented in Tables 3 to 5 (Homo sapiens annotation database) and in Supplementary Tables 1 to 3 (Bos taurus annotation database). In general, the results with the Homo sapiens database yielded results with lower FDR than with the Bos taurus database, probably because the human genome in notably more annotated than the bovine one.
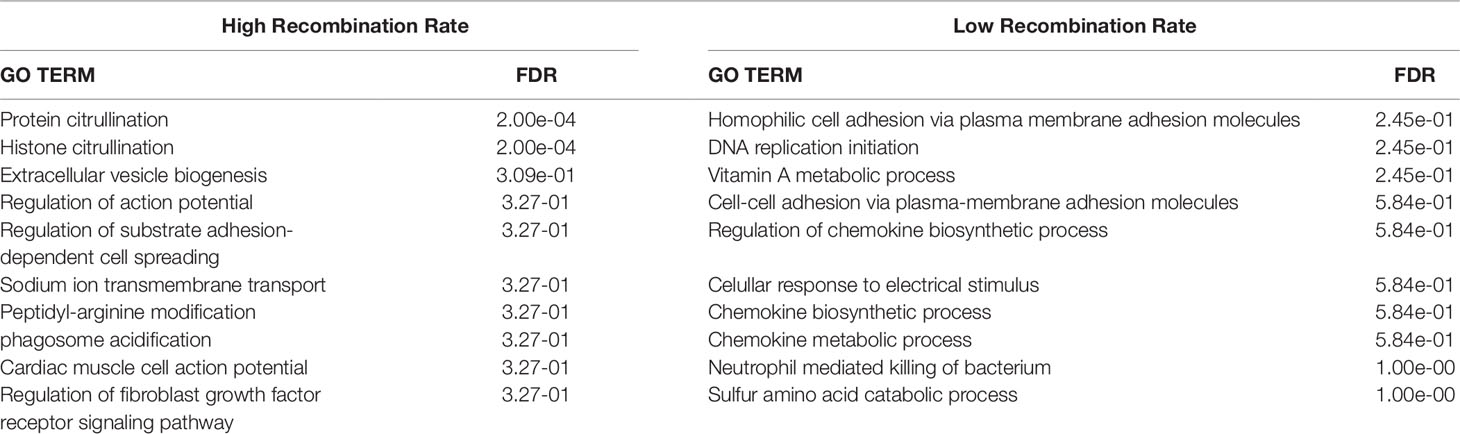
Table 3 False discovery rate (FDR) for the top 10 enriched Gene Ontology (GO) terms for Biological processes with the Homo sapiens database for genes within the genomic regions located over the 95th (high recombination rate) and below the 5th (low recombination rate) percentiles of the average recombination rates.
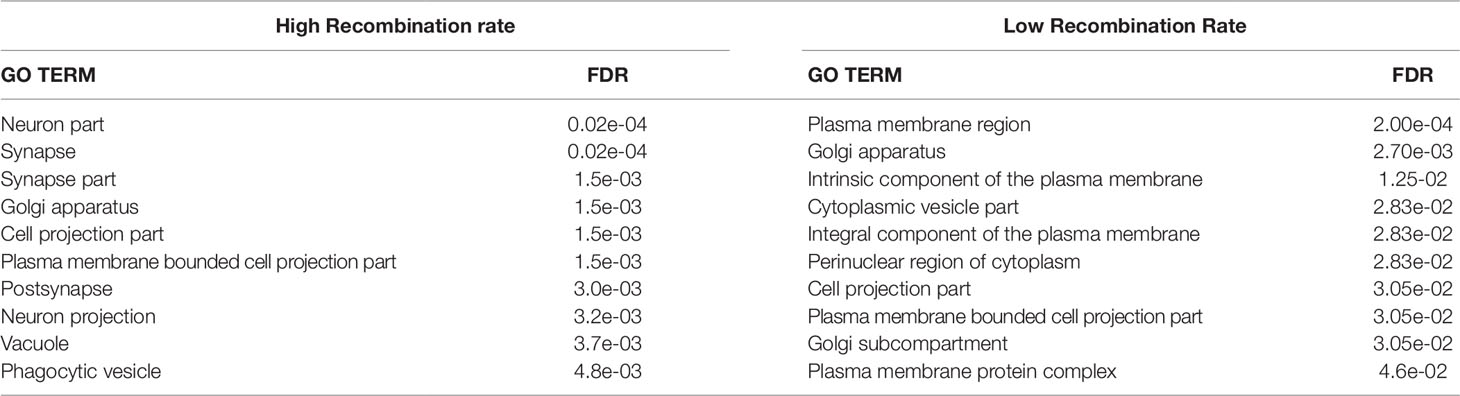
Table 4 False discovery rate (FDR) for the top 10 enriched Gene Ontology (GO) terms for Cellular Components with the Homo sapiens database for genes within the genomic regions located over the 95th (high recombination rate) and below the 5th (low recombination rate) percentiles of average recombination rates.
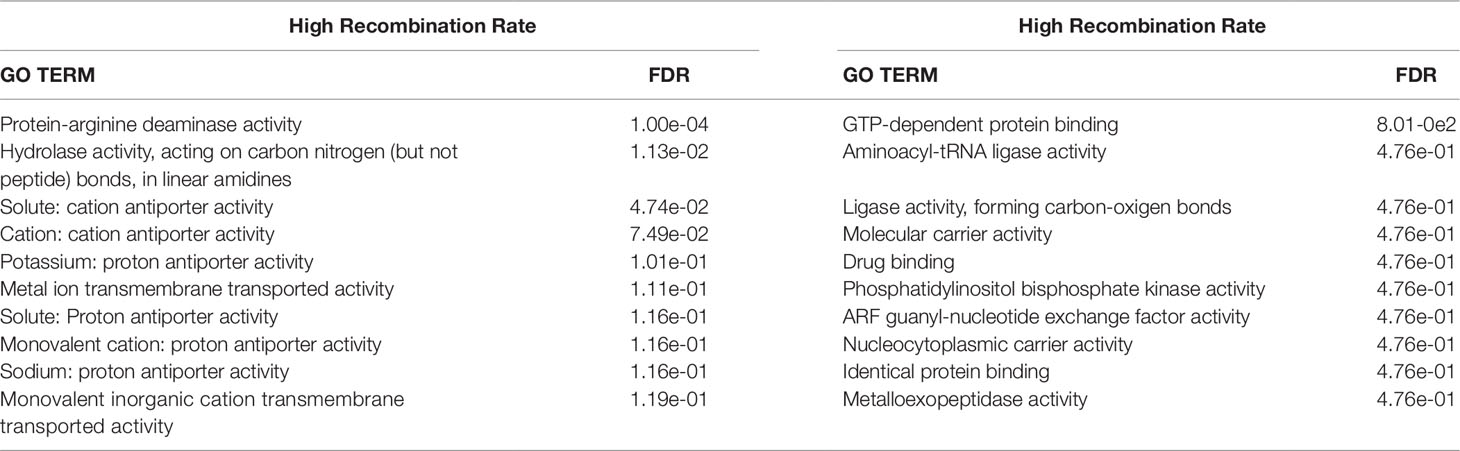
Table 5 False discovery rate (FDR) for the top 10 enriched Gene Ontology (GO) terms for Molecular Functions for genes with the Homo sapiens database within the genomic regions located over the 95th (high recombination rate) and below the 5th (low recombination rate) percentiles of the average recombination rates.
The results of the enrichment analysis for biological processes with the human database (Table 3) only provided enriched GO terms with a False Discovery Rate (FDR) lower than 0.05 with the genes present in the HRR genomic regions. The significant GO terms correspond to Protein citrullination and Histone citrullination. Citrullination, the conversion of the amino acid arginine in a protein into the amino acid citrulline, has been related to an increase in antigenic diversity (Nguyen and James, 2016). The higher recombination rate of those genomic regions might indicate that they have evolved to have high plasticity to adapt to changing environments (Charlesworth et al., 2009; Campos et al., 2014). Therefore, the generation of new genetic variants by recombination may help the antigen diversity from the perspective of the host. Thus, it works as a mechanism to adapt its immune response to fight against the ability of the pathogen to modify its antigenic targets. The results obtained from the Bos taurus database (Supplementary Table 1) were not significant (FDR < 0.05).
The top 10 enriched GO terms for cellular components for the genomic regions that had either high or low recombination rate are presented in Table 4 (Homo sapiens) and Supplementary Table 2 (Bos taurus). For Homo sapiens, the FDR was generally lower than it was for biological processes (FDR < 4.6e-02). Some cellular components (Golgi apparatus, Cell projection part, Plasma membrane bounded bell projection part) occurred in both types of genomic regions, but there were some important differences between them. The HRR genomic regions were enriched with genes whose expression is located at the extracellular space and related with neuronal interactions (neuron part, synapse, synapse part, postsynapse, or neuron projection). In contrast, the genes located at LRR regions were associated with very basic intracellular (Cytoplasmic vesicle part, Perinuclear region of the cytoplasm) or membrane components (Plasma membrane region, Intrinsic component of the plasma membrane Integral component of the plasma membrane, Plasma membrane protein complex). The results obtained from the Bos taurus database were significant (FDR < 0.05) only for cytosol and nuclear lumen in the LRR regions, confirming the results provided by the Homo sapiens database.
The enriched GO terms for molecular functions are presented in Table 5 (Homo sapiens) and Supplementary Table 3(Bos Taurus). The three significantly (FDR < 0.05) enriched GO terms for the HRR genomic regions were coherent with the enriched GO terms for biological processes. In fact, two of those were clearly associated with citrullination [Protein-arginine deiminase activity and Hydrolase activity, acting on carbon nitrogen (but not peptide) bonds, in linear amidines] and the other (Solute: cation antiporter activity) was linked to transmembrane transportation of solutes. In contrast, the only significantly enriched GO terms for LRR genomic regions was GTP-dependent protein binding (FDR = 8.01e-02), which was confirmed with the results from the Bos taurus database (FDR = 2.7e-02). The genes located in the LRR genomic regions should be more conserved, since they may be necessary for basic functions of the organism. In this sense, the genes belonging to the GTP-dependent protein GO term regulate guanine nucleotide-binding proteins that play a crucial role in signal transduction and in a large number of cellular processes (Zachariou et al., 2012).
The results of this study confirm that the genomic architecture of persistency of LD phase is well conserved among closely related populations, such as the Spanish autochthonous beef cattle breeds, and is heterogeneous within the autosomal genome and that this heterogeneity can be used to estimate the recombination rate. Several studies have estimated the persistency of LD phase between populations as a measure of genetic diversity (De Roos et al., 2008; Villa-Angulo et al., 2009; Cañas-Álvarez et al., 2016) and as a mean of predicting the marker density required for multi-breed genomic evaluation (De Roos et al., 2008; Cañas-Álvarez et al., 2016). Nevertheless, the genetic architecture of persistency of phase within the genome has received limited attention. In this study, we estimated the persistency of LD phase among seven beef cattle populations in Spain and its distribution within the genome, which has been related with the genetic architecture of the recombination rates. Even though the recombination rate varies among species, sex, and populations (Dapper and Payseur, 2017), some general patterns were described (Tiemann-Boege et al., 2017). The patterns were confirmed in our analysis by the similitude of our results with some studies in other species or populations (Ma et al., 2015; Shen et al., 2018).
Therefore, the main conclusion of this study is that the heterogeneity of persistency of LD phase between closely related populations can be used to estimate the recombination rate with the procedure developed here, which is simpler and brings similar results as more complex and coalescent dependent methods. This implies that it may help to identify regions related to hot and cold spots when data from several populations of the same ancestral origin are available. Nevertheless, our procedure has several limitations since differences in the mutation rate or selection events can locally affect the persistency of LD phase and it requires populations to be close enough that the recombination rate is well conserved.
Author Contributions
The study was conceived by LV. Preliminary data preparation was done by EM, AG-R, JC-Á, and SL. Data analysis was done by EM and LV. EM and LV produced the draft manuscript. JA, CD, AM, and JP collaborated in generating the data. SL, JA, CD, JB, AM, PL-B, and JP discussed the results. All authors reviewed and revised the manuscript.
Funding
We thank the AGL 2010-15903 grant from the Spanish government and the KBBE.2011.1.3-06 project from the European Union’s Seventh Framework. We also thank the Breed Societies for their collaboration in collecting samples. The support of FEAGAS is acknowledged. JC-Á acknowledges the COLCIENCIAS support by the Francisco José De Caldas Fellowship 497/2009, and AG-R acknowledges the financial support provided by the BES-2011-045434 fellowship.
Conflict of Interest
The authors declare that the research was conducted in the absence of any commercial or financial relationships that could be construed as a potential conflict of interest.
Acknowledgments
We thank Bruce Macwirther and María Martínez-Castillero for their help in the language editing. Preliminary results of this study were presented at the World Congress of Genetics Applied to Livestock Production, 11.285.
Supplementary Material
The Supplementary Material for this article can be found online at: https://www.frontiersin.org/articles/10.3389/fgene.2019.01170/full#supplementary-material
References
Arias, J. A., Keehan, M., Fisher, P., Coppieters, W., Spelman, R. (2009). A high density linkage map of the bovine genome. BMC Genet. 10, 18. doi: 10.1186/1471-2156-10-18
Arnheim, N., Calabrese, P., Tiemann-Boege, I. (2007). Mammalian meiotic recombination hot spots. Annu. Rev. Genet. 41, 369–399. doi: 10.1146/annurev.genet.41.110306.130301
Auton, A., Fledel-Alon, A., Pfeifer, S., Venn, O., Ségurel, L., Street, T., et al. (2012). A fine-scale chimpanzee genetic map from population sequencing. Science 13, 193–198. doi: 10.1126/science.1216872
Biegelmeyer, P., Gulias-Gomes, C. C., Caetano, A. R., Steibel, J. P., Cardoso, F. F. (2016). Linkage disequilibrium, persistence of phase and effective population size estimates in hereford and braford cattle. BMC Genet. 17 (1), 32. doi: 10.1186/s12863-016-0339-8
Brito, L. F., Jafarikia, M., Grossi, D. A., Kijas, J. W., Porto-Neto, L. R., Ventura, R. V., et al. (2015). Characterization of linkage disequilibrium, consistency of gametic phase and admixture in australian and canadian goats. BMC Genet. 16 (1), 67. doi: 10.1186/s12863-015-0220-1
Brito, L. F., McEwan, J. C., Miller, S. P., Pickering, N. K., Bain, W. E., Dodds, K. G., et al. (2017). Genetic diversity of a new zealand multi-breed sheep population and composite breeds’ history revealed by a high-density SNP chip. BMC Genet. 18 (1), 25. doi: 10.1186/s12863-017-0492-8
Browning, S. R., Browning, B. L. (2007). Rapid and accurate haplotype phasing and missing-data inference for whole-genome association studies by use of localized haplotype clustering. Am. J. Hum. Genet. 81, 1084–1097. doi: 10.1086/521987
Cañas-Álvarez, J. J., González-Rodríguez, A., Munilla, S., Varona, L., Díaz, C., Baro, J. A., et al. (2015). Genetic diversity and divergence among spanish beef cattle breeds assessed by a bovine high-density SNP chip. J. Anim. Sci. 93 (11), 5164–5174. doi: 10.2527/jas2015-9271
Cañas-Álvarez, J. J., Mouresan, E. F., Varona, L., Díaz, C., Molina, A., Baro, J. A., et al. (2016). Linkage disequilibrium, persistence of phase, and effective population size in spanish local beef cattle breeds assessed through a high-density single nucleotide polymorphism chip. J. Anim. Sci. 94 (7), 2779–2788. doi: 10.2527/jas2016-0425
Campos, J. L., Halligan, D. L., Haddrill, P. R., Charlesworth, B. (2014). The relation between recombination rate and patterns of molecular evolution and variation in drosophila melanogaster. Mol. Biol. Evol. 31 (4), 1010–1028. doi: 10.1093/molbev/msu056
Ceriani, L., Verme, P. (2012). The origins of the gini index: extracts from variabilità e mutabilità (1912) by corrado gini. J. Economic Inequality 10 (3), 421–443. doi: 10.1007/s10888-011-9188-x
Charlesworth, B., Betancourt, A. J., Kaiser, V. B., Gordo, I. (2009). Genetic recombination and molecular evolution. Cold Spring Harb. Symp. Quant. Biol. 74, 177–186. doi: 10.1101/sqb.2009.74.015
Coop, G., Przeworski, M. (2007). An evolutionary view of human recombination. Nat. Rev. Genet. 8 (1), 23–34. doi: 10.1038/nrg1947
Dapper, A. L., Payseur, B. A. (2017). Connecting theory and data to understand recombination rate evolution. Philos. Trans. R. Soc. B: Biol. Sci. 372 (1736), 20160469. doi: 10.1098/rstb.2016.0469
De Roos, A. P. W., Hayes, B. J., Spelman, R. J., Goddard, M. E. (2008). Linkage disequilibrium and persistence of phase in holstein-friesian, jersey and angus cattle. Genetics 179, 1503–1512. doi: 10.1534/genetics.107.084301
Falconer, D. S., Mackay, T. F. C. (1996). Introduction to Quantitative Genetics. Harlow, UK: Longman Group.
Fledel-Alon, A., Wilson, D. J., Broman, K., Wen, X., Ober, C. (2009). Broad-scale recombination patterns underlying proper disjunction in humans. PloS Genet. 5 (9), 1000658. doi: 10.1371/journal.pgen.1000658
Flicek, P., Ahmed, I., Ridwan Amode, M., Barrell, D., Beal, K., Brent, S., et al. (2013). Ensembl 2013. Nucleic Acids Res. 41, D48–D55. doi: 10.1093/nar/gks1236
Freudenberg, J., Wang, M., Yang, Y., Li, W. (2009). Partial correlation analysis indicates causal relationships between gc-content, exon density and recombination rate in the human genome. BMC Bioinf. 10, S66. doi: 10.1186/1471-2105-10-S1-S66
Gabriel, S. B., Schaffner, S. F., Nguyen, H., Moore, J. M., Roy, J., Blumenstiel, B., et al. (2002). The Structure of Haplotype Blocks in the Human Genome. Science 296 (5576), 2225–2229. doi: 10.1126/science.1069424
Gil, M., Serra, X., Gispert, M., Oliver, M.A.Á., SanÄ udo, C., Panea, B., et al. (2001). The effect of breed-production systems on the myosin heavy chain 1, the biochemical characteristics and the colour variables of longissimus thoracis from seven spanish beef cattle breeds. Meat Sci. 58, 181–188. doi: 10.1016/s0309-1740(00)00150-9
González-Rodríguez, A., Munilla, S., Mouresan, E. F., Cañas-Álvarez, J. J., Díaz, C., Piedrafita, J., et al. (2016). On the performance of tests for the detection of signatures of selection: a case study with the Spanish autochthonous beef cattle populations. Genet. Selection Evol. 48 (1). doi: 10.1186/s12711-016-0258-1
González-Rodríguez, A., Munilla, S., Mouresan, E. F., Cañas-Álvarez, J. J., Baro, J. A., Molina, A., et al. (2017). Genomic differentiation between asturiana de los valles, avileña-negra ibérica, bruna dels pirineus, morucha, pirenaica, retinta and rubia gallega cattle breeds. Animal 11 (10), 1667–1679. doi: 10.1017/S1751731117000398
Graffelman, J., Balding, D. J., Gonzalez-Neira, A., Bertranpetit, J. (2007). Variation in estimated recombination rates across human populations. Hum. Genet. 122 (3–4), 301–310. doi: 10.1007/s00439-007-0391-6
Grossi, D. A., Jafarikia, M., Brito, L. F., Buzanskas, M. E., Sargolzaei, M., Schenkel, F. S. (2017). Genetic diversity, extent of linkage disequilibrium and persistence of gametic phase in canadian pigs. BMC Genet. 18 (1), 6. doi: 10.1186/s12863-017-0473-y
Guryev, V., Smits, B. M. G., Belt, J. V. D., Verheul, M., Hubner, N., Cuppen, E. (2006). Haplotype block structure is conserved across mammals. PloS Genet. 7, 1111–1118. doi: 10.1371/journal.pgen.0020121
Hayes, B. J., Visscher, P. M., McPartlan, H. C., Goddard, M. E. (2003). Novel multilocus measure of linkage disequilibrium to estimate past effective population size. Genome Res. 13 (4), 635–643. doi: 10.1101/gr.387103
Hill, W. G., Robertson, A. (1968). Linkage disequilibrium in finite populations. Theor. Appl. Genet. 38 (6), 226–231. doi: 10.1007/BF01245622
Hinrichs, A. L., Larkin, E. K., Suarez, B. K. (2009). Population stratification and patterns of linkage disequilibrium. Genet. Epidemiol. 33, 88–92. doi: 10.1002/gepi.20478
Hulten, M. A., Palmer, R. W., Laurie, D. A. (1982). Chiasma derived genetic maps and recombination fractions: chromosome 1. Ann. Hum. Genet. 46 (2), 167–175. doi: 10.1111/j.1469-1809.1982.tb00707.x
Jensen-Seaman, M. I., Furey, T. S., Payseur, B. A., Lu, Y., Roskin, K. M., Chen, C.-F., et al. (2004). Comparative recombination rates in the rat, mouse, and human genomes. Genome Res. 14, 528–538. doi: 10.1101/gr.1970304
Kaback, D., Guacci, V., Barber, D., Mahon, J. (1992). Chromosome size-dependent control of meiotic recombination. Science 256 (5054), 228–232. doi: 10.1126/science.1566070
Kong, A., Gudbjartsson, D. F., Sainz, J., Jonsdottir, G. M., Gudjonsson, S. A., Richardsson, B., et al. (2002). A high-resolution recombination map of the human genome. Nat. Genet. 31 (3), 241–247. doi: 10.1038/ng917
Kong, A., Thorleifsson, G., Gudbjartsson, D. F., Masson, G., Sigurdsson, A., Jonasdottir, A., et al. (2010). Fine-scale recombination rate differences between sexes, populations and individuals. Nature 467 (7319), 1099–1103. doi: 10.1038/nature09525
Laayouni, H., Montanucci, L., Sikora, M., Melé, M., Dall’Olio, G. M., Lorente-Galdos, B., et al. (2011). Similarity in recombination rate estimates highly correlates with genetic differentiation in humans. Edited by Carles Lalueza-Fox. PloS One 6 (3), e17913. doi: 10.1371/journal.pone.0017913.
Li, W., Freudenberg, J. (2009). Two-parameter characterization of chromosome-scale recombination rate. Genome Res. 19 (12), 2300–2307. doi: 10.1101/gr.092676.109
Li, N., Stephens, M. (2003). Modeling linkage disequilibrium and identifying recombination hotspots using single-nucleotide polymorphism data. Genetics 165 (4), 2213–2233.
Lynch, M. (2006). The origins of eukaryotic gene structure. Mol. Biol. Evol. 23 (2), 450–468. doi: 10.1093/molbev/msj050
Ma, L., O’Connell, J. R., VanRaden, P. M., Shen, B., Padhi, A., Sun, C., et al. (2015). Cattle sex-specific recombination and genetic control from a large pedigree analysis. PloS Genet. 11 (11), e1005387. doi: 10.1371/journal.pgen.1005387. Edited by Adam J. Auton.
Mancera, E., Bourgon, R., Brozzi, A., Huber, W., Steinmetz, L. M. (2008). High-resolution mapping of meiotic crossovers and non-crossovers in yeast. Nature 454 (7203), 479–485. doi: 10.1038/nature07135
Manu, S., Acharya, K. K., Thiyagarajan, S. (2018). Systematic analyses of autosomal recombination rates from the 1000 genomes project uncovers the global recombination landscape in humans. BioRxiv, 246702. doi: 10.1101/246702
McVean, G., Awadalla, P., Fearnhead, P. (2002). A coalescent-based method for detecting and estimating recombination from gene sequences. Genetics 160 (3), 1231–1241.
Ministerio de Medio Ambiente y Medio Rural y Marino (2010). Razas de Ganado Del Catálogo Oficial En España. Madrid, Spain: Ministerio de Medio Ambiente y Medio Rural y Marino.
Mokry, F., Buzanskas, M., Mudadu, M. A., Grossi, D. A., Higa, R., Ventura, R., et al. (2014). Linkage disequilibrium and haplotype block structure in a composite beef cattle breed. BMC Genomics 15 (Suppl 7), S6. doi: 10.1186/1471-2164-15-S7-S6
Mouresan, E. F., González-Rodríguez, A., Cañas-Álvarez, J. J., Díaz, C., Altarriba, J., Baro, J. A., et al. (2017). On the haplotype diversity along the genome in spanish beef cattle populations. Livestock Sci. 201, 33–33. doi: 10.1016/j.livsci.2017.04.015
Myers, S., Bottolo, L., Freeman, C., McVean, G., Donnelly, P. (2005). A fine-scale map of recombination rates and hotspots across the human genome. Science 310 (5746), 321–324. doi: 10.1126/science.1117196
Nachman, M. W. (2002). Variation in recombination rate across the genome: evidence and implications. Curr. Opin. Genet. Dev. 12 (6), 657–663. doi: 10.1016/s0959-437x(02)00358-1
Nguyen, H., James, E. A. (2016). Immune recognition of citrullinated epitopes. Immunology 149 (2), 131–138. doi: 10.1111/imm.12640
Paigen, K., Petkov, P. (2010). Mammalian recombination hot spots: properties, control and evolution. Nat. Rev. Genet. 11 (3), 221–233. doi: 10.1038/nrg2712
Park, L. (2012). Linkage disequilibrium decay and past population history in the human genome. PloS One 7 (10), e46603. doi: 10.1371/journal.pone.0046603. Edited by Thomas Mailund.
Petit, M., Astruc, J.-M., Sarry, J., Drouilhet, L., Fabre, S., Moreno, C., et al. (2017). Variation in recombination rate and its genetic determinism in sheep populations. Genetics 207 (2). doi: 10.1534/genetics.117.300123
Piedrafita, J., Quintanilla, R., Sañudo, C., Olleta, J.-L., Campo, M.-M., Panea, B., et al, (2003). Carcass quality of 10 beef cattle breeds of the southwest of europe in their typical production systems. Livestock Prod. Sci. 82 (1), 1–13. doi: 10.1016/S0301-6226(03)00006-X
Popescu, P. C. (1990). Chromosomes of the cow and the bull. Adv. Vet. Sci. Comp. Med. 34, 41–71. doi: 10.1016/B978-0-12-039234-6.50007-0
Sandor, C., Li, W., Coppieters, W., Druet, T., Charlier, C., Georges, M. (2012). Genetic variants in REC8, RNF212, and PRDM9 influence male recombination in cattle. Edited by Kenneth Paigen. PloS Genet. 8 (7), e1002854. doi: 10.1371/journal.pgen.1002854
Sarbajna, S., Denniff, M., Jeffreys, A. J., Neumann, R., Artigas, M. S., Veselis, A., et al (2012). A major recombination hotspot in the xqyq pseudoautosomal region gives new insight into processing of human gene conversion events. Hum. Mol. Genet. 21 (9), 2029–2038. doi: 10.1093/hmg/dds019
Shen, B., Jiang, J., Seroussi, E., Liu, G. E., Ma, L. (2018). Characterization of recombination features and the genetic basis in multiple cattle breeds. BMC Genomics 19 (1), 1–10. doi: 10.1186/s12864-018-4705-y
Smukowski, C. S., Noor, M. A. F. (2011). Recombination rate variation in closely related species. Heredity 107 (6), 496–508. doi: 10.1038/hdy.2011.44
Stapley, J., Feulner, P. G. D., Johnston, S. E., Santure, A. W., Smadja, C. M. (2017). Variation in recombination frequency and distribution across eukaryotes: patterns and processes. Philos. Trans. R. Soc. B: Biol. Sci. 372 (1736), 20160455. doi: 10.1098/rstb.2016.0455
Stevison, L. S., Woerner, A. E., Kidd, J. M., Kelley, J. L., Veeramah, K. R., McManus, K. F., et al. (2016). The time scale of recombination rate evolution in great apes. Mol. Biol. Evol. 33 (4), 928–945. doi: 10.1093/molbev/msv331
Sturtevant, A. H. (1913). The linear arrangement of six sex-linked factors in drosophila, as shown by their mode of association. J. Exp. Zool. 14 (1), 43–59. doi: 10.1002/jez.1400140104
Tenesa, A., Navarro, P., Hayes, B. J., Duffy, D. L., Clarke, G. M., Goddard, M. E., et al. (2007). Recent human effective population size estimated from linkage disequilibrium. Genome Res. 17 (4), 520–526. doi: 10.1101/gr.6023607
The International HapMap Consortium (2007). A second generation human haplotype map of over 3.1 million SNPs. Nature 449 (7164), 851–861. doi: 10.1038/nature06258
Tiemann-Boege, I., Schwarz, T., Striedner, Y., Heissl, A. (2017). The consequences of sequence erosion in the evolution of recombination hotspots. Philos. Trans. R. Soc. B: Biol. Sci. 372 (1736), 20160462. doi: 10.1098/rstb.2016.0462
Villa-Angulo, R., Matukumalli, L. K., Gill, C. A., Choi, J., Tassell, C. P. V., Grefenstette, J. J. (2009). High-resolution haplotype block structure in the cattle genome. BMC Genet. 10 (1), 19. doi: 10.1186/1471-2156-10-19
Wall, J. D., Stevison, L. S. (2016). Detecting recombination hotspots from patterns of linkage disequilibrium. G3 (Bethesda) 6 (8), 2265–2271. doi: 10.1534/g3.116.029587
Xu, L., Zhu, B., Wang, Z., Xu, L., Liu, Y., Chen, Y., et al. (2019). Evaluation of linkage disequilibrium, effective population size and haplotype block structure in chinese cattle. Animals 9 (3), 83. doi: 10.3390/ani9030083
Keywords: recombination rate, linkage disequilibrium, beef cattle, multiple populations, gene ontology
Citation: Mouresan EF, González-Rodríguez A, Cañas-Álvarez JJ, Munilla S, Altarriba J, Díaz C, Baró JA, Molina A, Lopez-Buesa P, Piedrafita J and Varona L (2019) Mapping Recombination Rate on the Autosomal Chromosomes Based on the Persistency of Linkage Disequilibrium Phase Among Autochthonous Beef Cattle Populations in Spain. Front. Genet. 10:1170. doi: 10.3389/fgene.2019.01170
Received: 16 November 2018; Accepted: 23 October 2019;
Published: 20 November 2019.
Edited by:
Francesca Bertolini, Technical University of Denmark, DenmarkReviewed by:
Alessandro Bagnato, University of Milan, ItalyDiercles Francisco Cardoso, São Paulo State University, Brazil
Andressa Oliveira De Lima, Federal University of São Carlos, Brazil
Christos Palaiokostas, Swedish University of Agricultural Sciences, Sweden
Copyright © 2019 Mouresan, González-Rodríguez, Cañas-Álvarez, Munilla, Altarriba, Díaz, Baró, Molina, Lopez-Buesa, Piedrafita and Varona. This is an open-access article distributed under the terms of the Creative Commons Attribution License (CC BY). The use, distribution or reproduction in other forums is permitted, provided the original author(s) and the copyright owner(s) are credited and that the original publication in this journal is cited, in accordance with accepted academic practice. No use, distribution or reproduction is permitted which does not comply with these terms.
*Correspondence: Luis Varona, bHZhcm9uYUB1bml6YXIuZXM=