
94% of researchers rate our articles as excellent or good
Learn more about the work of our research integrity team to safeguard the quality of each article we publish.
Find out more
ORIGINAL RESEARCH article
Front. Genet. , 14 March 2019
Sec. Evolutionary and Genomic Microbiology
Volume 10 - 2019 | https://doi.org/10.3389/fgene.2019.00207
The incidence, distribution, and variation of simple sequence repeats (SSRs) in viruses is instrumental in understanding the functional and evolutionary aspects of repeat sequences. Full-length genome sequences retrieved from NCBI were used for extraction and analysis of repeat sequences using IMEx software. We have also developed two MATLAB-based tools for extraction of gene locations from GenBank in tabular format and simulation of this data with SSR incidence data. Present study encompassing 147 Mycobacteriophage genomes revealed 25,284 SSRs and 1,127 compound SSRs (cSSRs) through IMEx. Mono- to hexa-nucleotide motifs were present. The SSR count per genome ranged from 78 (M100) to 342 (M58) while cSSRs incidence ranged from 1 (M138) to 17 (M28, M73). Though cSSRs were present in all the genomes, their frequency and SSR to cSSR conversion percentage varied from 1.08 (M138 with 93 SSRs) to 8.33 (M116 with 96 SSRs). In terms of localization, the SSRs were predominantly localized to coding regions (∼78%). Interestingly, genomes of around 50 kb contained a similar number of SSRs/cSSRs to that in a 110 kb genome, suggesting functional relevance for SSRs which was substantiated by variation in motif constitution between species with different host range. The three species with broad host range (M97, M100, M116) have around 90% of their mono-nucleotide repeat motifs composed of G or C and only M16 has both A and T mononucleotide motifs. Around 20% of the di-nucleotide repeat motifs in the genomes exhibiting a broad host range were CT/TC, which were either absent or represented to a much lesser extent in the other genomes.
Phages are the most abundant organisms in the biosphere; the entire population turns over every few days (Brüssow and Hendrix, 2002; Comeau et al., 2008; Hatfull, 2015). Diversity of the bacteriophage population at the genetic level is highly dynamic due to horizontal exchange of segments between genomes (Wommack and Colwell, 2000; Hendrix, 2004; Suttle, 2007). Furthermore, virion structures suggest that bacteriophages are extremely old (Krupovič and Bamford, 2010). In spite of their age, diversity and ubiquity, bacteriophage comparative genomics has not attracted as much attention relative as has that of other microbial genomes. One reason may be the lack of individual isolates for genomic analyses (Hatfull and Hendrix, 2011). However, due to advancements in sequencing and analysis techniques, over 2000 completely sequenced bacteriophage genomes are now available in the GenBank database1.
Important feature of the genomes, which have been extensively served as a tools for comparative and evolutionary genomics, are the SSRs. The SSRs are tandem repetitions of relatively short DNA motifs present in interrupted; pure; compound; interrupted-compound; complex or interrupted-complex forms (Table 1; Chambers and MacAvoy, 2000). They are present in diverse taxa across viruses, prokaryotes, and eukaryotes (Gur-Arie et al., 2000; Kofler et al., 2008; Chen et al., 2012). Functionally, these sequences are associated with gene regulation, transcription, and protein function in prokaryotes and eukaryotes (Kashi and King, 2006; Usdin, 2008), though the presence and role of SSR in viruses (Ouyang et al., 2012) remains to be exhaustively studied. Genome features including size and GC content influence the occurrence and complexity of SSRs (Dieringer and Schlötterer, 2003; Coenye and Vandamme, 2005; Kelkar et al., 2008). However, this correlation is not universal and therefore a single rule for their incidence cannot be forged.
Phages replicates through lytic and lysogenic cycles depending on the benefit of being virulent versus temperate. In M13 bacteriophages, it has been reported that two-triplet repeats can impede DNA replication not by means of hairpin structures, but due to increased free energy on interaction with flanking DNA sequences and unique secondary structure (Pan, 2004). Till now there is no report of any repeat sequence present in specific protein of phages which is responsible for function of that particular protein. Microsatellites have been extensively used for DNA fingerprinting, forensics and evolution studies (Queller et al., 1993); however, their role in genomes as a whole remains to be ascertained. Here, we focus on viruses belonging to 15 Genera of Mycobacteriophages as an attempt to understand the evolution of microsatellites and their host viral genomes.
Complete genome sequences of 147 Mycobacteriophages from 15 genomes were retrieved from NCBI2 and analyzed for simple and compound SSRs (cSSRs). These included the following genera, the numbers in parentheses representing the number of species in the genus: Barnyardlikevirus (4), Bignuzlikevirus (2), Bronlikevirus (4), Charlielikevirus (2), Che8likevirus (28), Che9clikevirus (3), Cjwunalikevirus (9), Corndoglikevirus (2), Halolikevirus (2), Omegalikevirus (6), Pbiunalikevirus (1), Pgonelikevirus (12), Reylikevirus (2), Tm4likevirus (9), and L5likevirus (61). The species included in the study and their genome features have been summarized in Supplementary Table 1.
Searches for microsatellites were carried out using the “Advance-Mode” of IMEx with the parameters reported for HIV (Mudunuri and Nagarajaram, 2007; Chen et al., 2012): Type of Repeat, perfect; Repeat Size, all; Minimum Repeat Number 6(mono-), 3(di-), 3(tri-), 3(tetra), 3(penta-), 3(hexa); Maximum distance allowed between any two SSRs (dMAX), 10. Two SSRs separated by a distance of less than 10 bp were thus treated as a single cSSR. Other parameters were set to the defaults.
Microsoft Office Excel 2007 was used to perform all statistical analyses. Linear regression was used to reveal the correlation between the RA, RD of microsatellites with genome size.
Compound microsatellite statistical significance in each genome was assessed using Z-scores which is defined as (O–E)/√E (Mrázek, 2006). Z-scores were calculated using equations:
Where count of individual microsatellite being part of compound microsatellite is represented by CcSSR, “O” is the cSSR observed in each genome (cSSRobs) and “E” is the cSSR expected in each genome (cSSRexp).
GraphPad prism 7 was used to do Chi-square test. Restricted host range and broad host range were chosen as two category and different repeat sequence were taken as groups.
Imperfect microsatellite extractors (IMEx) is widely used to find SSRs in genomes. However, connecting these SSRs to associated gene has remained a manual process. In order to expedite the process, we have developed two MATLAB-based tools: Identification of Gene Location from NCBI Nucleotide File (IGLNNF) and Incorporation of Gene Location in SSR File (IGLSF). IGLNNF obtains gene locations from GenBank directly and saves them into.xlsx format. IGLNNF requires two inputs: accession number (of the sequence to be analyzed); filename (where extracted gene locations will be stored). The IGLNNF tool will be made available for research and teaching purposes at our website: www.pirotechnologies.com/cmdownloads/identification-of-gene-location-from-ncbi-nucleotide-file/.
IGLSF incorporates the gene location into the SSR file. IGLSF requires two inputs: gene file; SSR file, into which locations will be incorporated. Both the inputs must be in.xlsx format and can be uploaded by clicking on “Upload Gene File” and “Upload SSR File” respectively. The output can be obtained by clicking on Simulate button. The IGLSF tool will be available for research and teaching purposes at our website:
www.pirotechnologies.com/cmdownloads/incorporation-of-gene-location-in-SSR-file/.
Dot matrix analysis is used to compare two nucleic acid or protein sequences. Dot plots for representative genomes was developed using Genome Pair Rapid Dotter (GEPARD) (Krumsiek et al., 2007) to highlight the presence of SSRs within the genomes. The graphical results of dot matrix analysis is known as dot plot which is used to examine the evolutionary relationships of the sequences by analyzing repeats, reverse matches, and conserved domains.
Pearson Chi-squared test was performed to ascertain the significance of SSR motif distribution with reference to host range as in to check whether the observations were a chance occurrence as per standard protocols (Pearson, 1900; Oliveira et al., 2018).
Genome-wide searches for microsatellites across 147 mycobacteriophage genomes revealed 25,284 SSRs and 1,127 cSSRs (Supplementary Tables 1–3). The SSR count per genome ranged from 78 (M100 – Mycobacterium phage D29) to 342 (M58 – Mycobacterium phage courthouse) (Figure 1A). The genome sizes in the studied species ranges from 41,650 to 111,688 bp, while the GC content ranges from 50.3 (M3) to 69.1 (M66, M67) (Supplementary Table 1). The genome size range can account for variation in the SSR incidence in principle: To uncover the actual scenario, we plotted genome size with SSR and cSSR incidence. As evident from the Figure 2, there are multiple examples of smaller genomes with disproportionately many SSRs and vice versa. For instance, the smallest genome, that of M56 (41,650 bp) has 184 SSRs, which more than twice the least number of SSRs present in another genome (M100, 49,136 bp). Also, M76, with 181 SSRs, a number similar to that in M46, has a much larger genome at 80,228 bp (Figure 2).
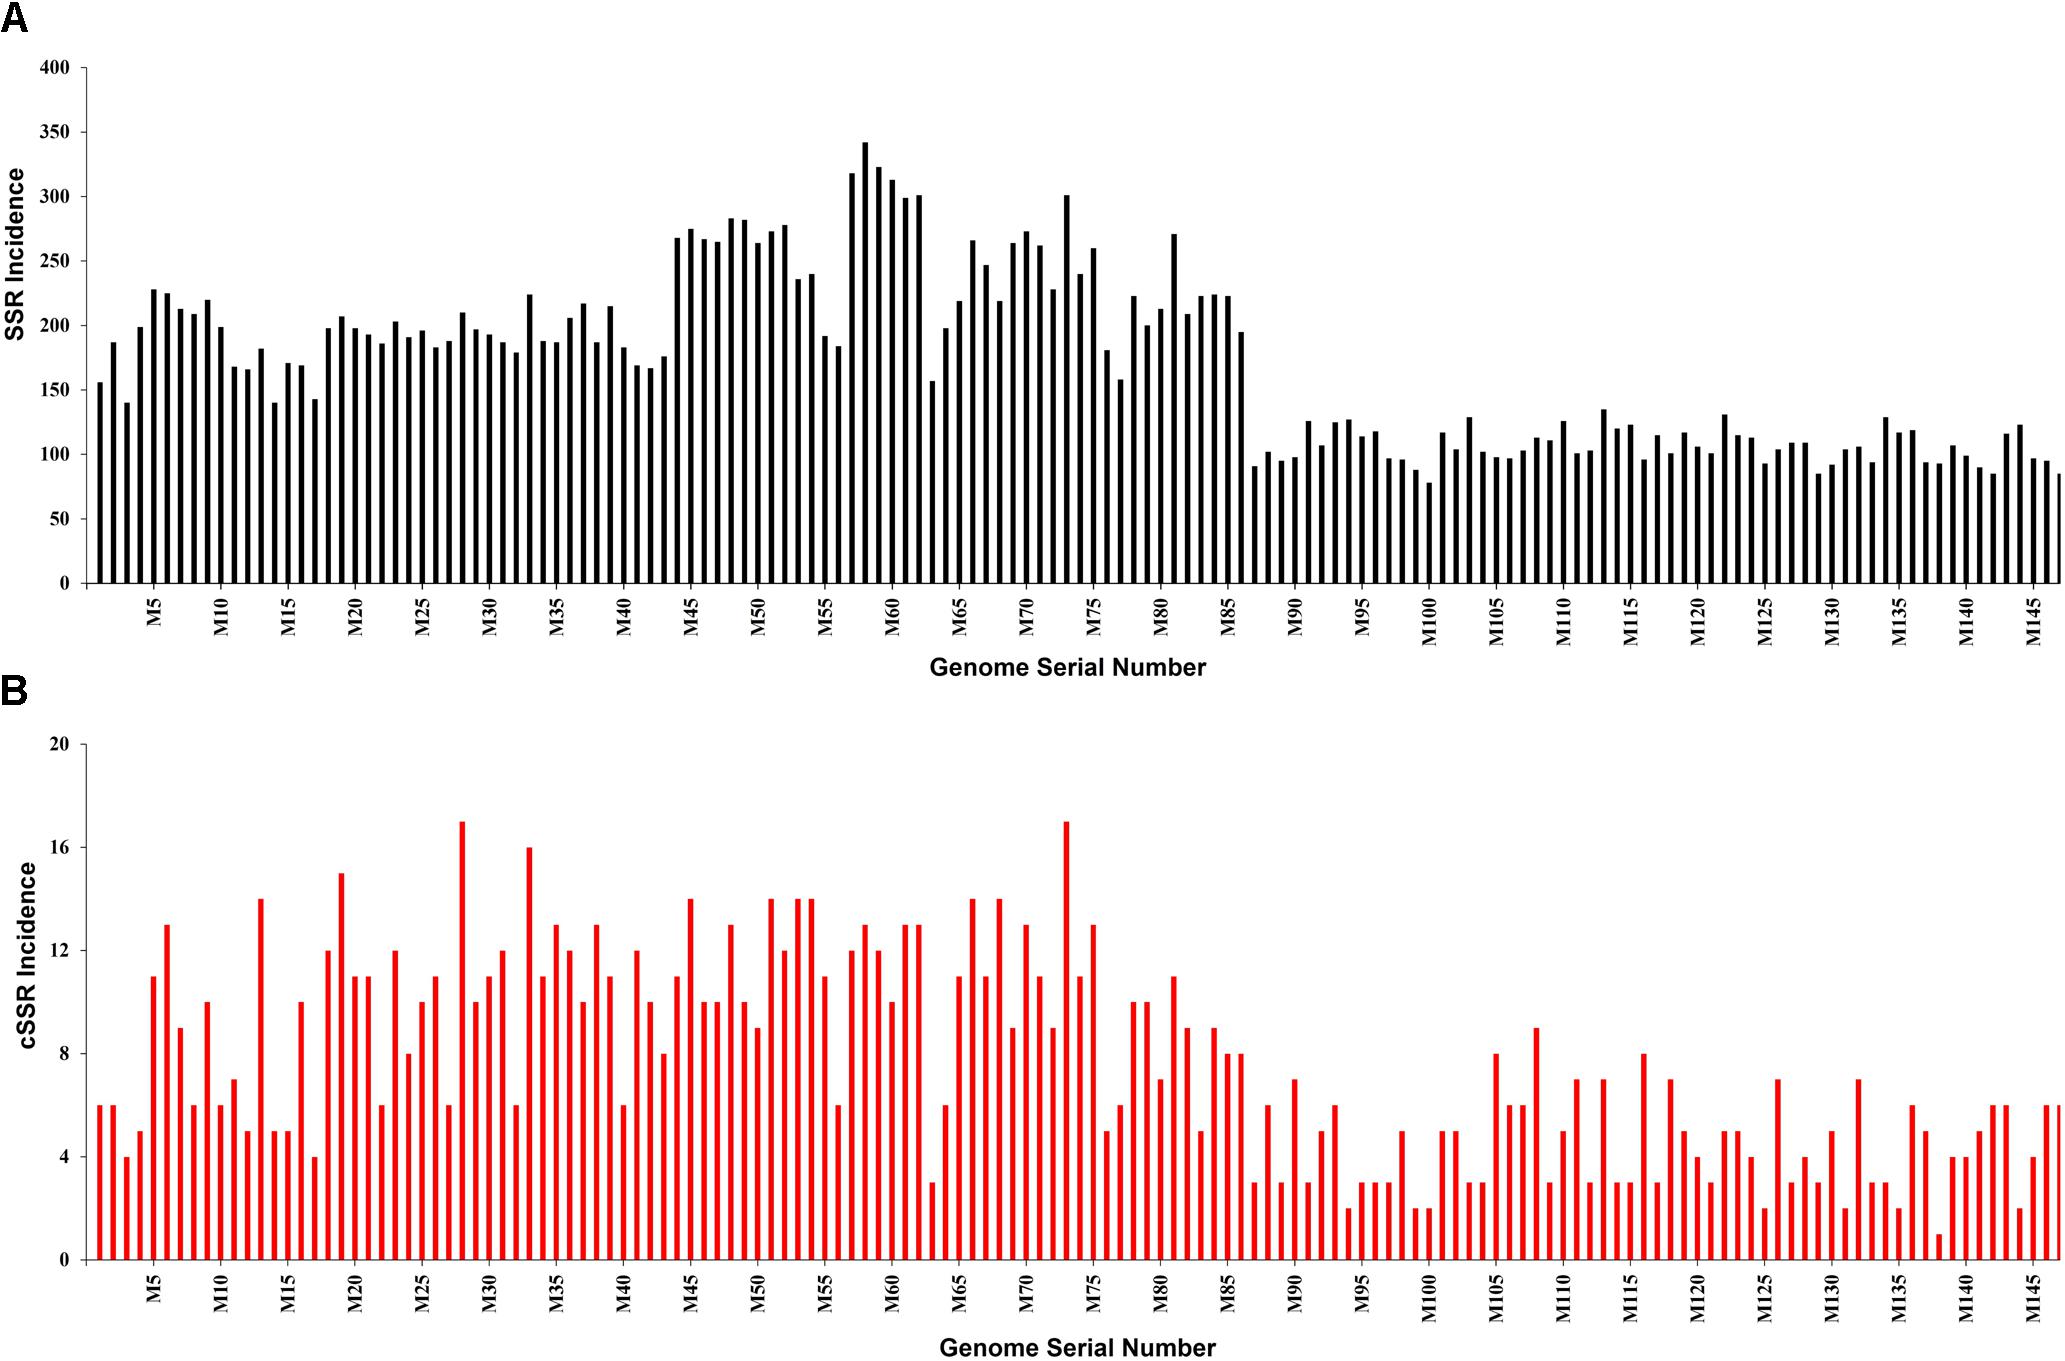
Figure 1. (A) Incidence of SSRs and (B) cSSRs in the studied Mycobacteriophage genomes. Note the highest SSR and cSSR incidence of 342 (M58) and 78 (M100) whereas corresponding values for cSSR are 17 (M28) and 1 (M138) respectively.
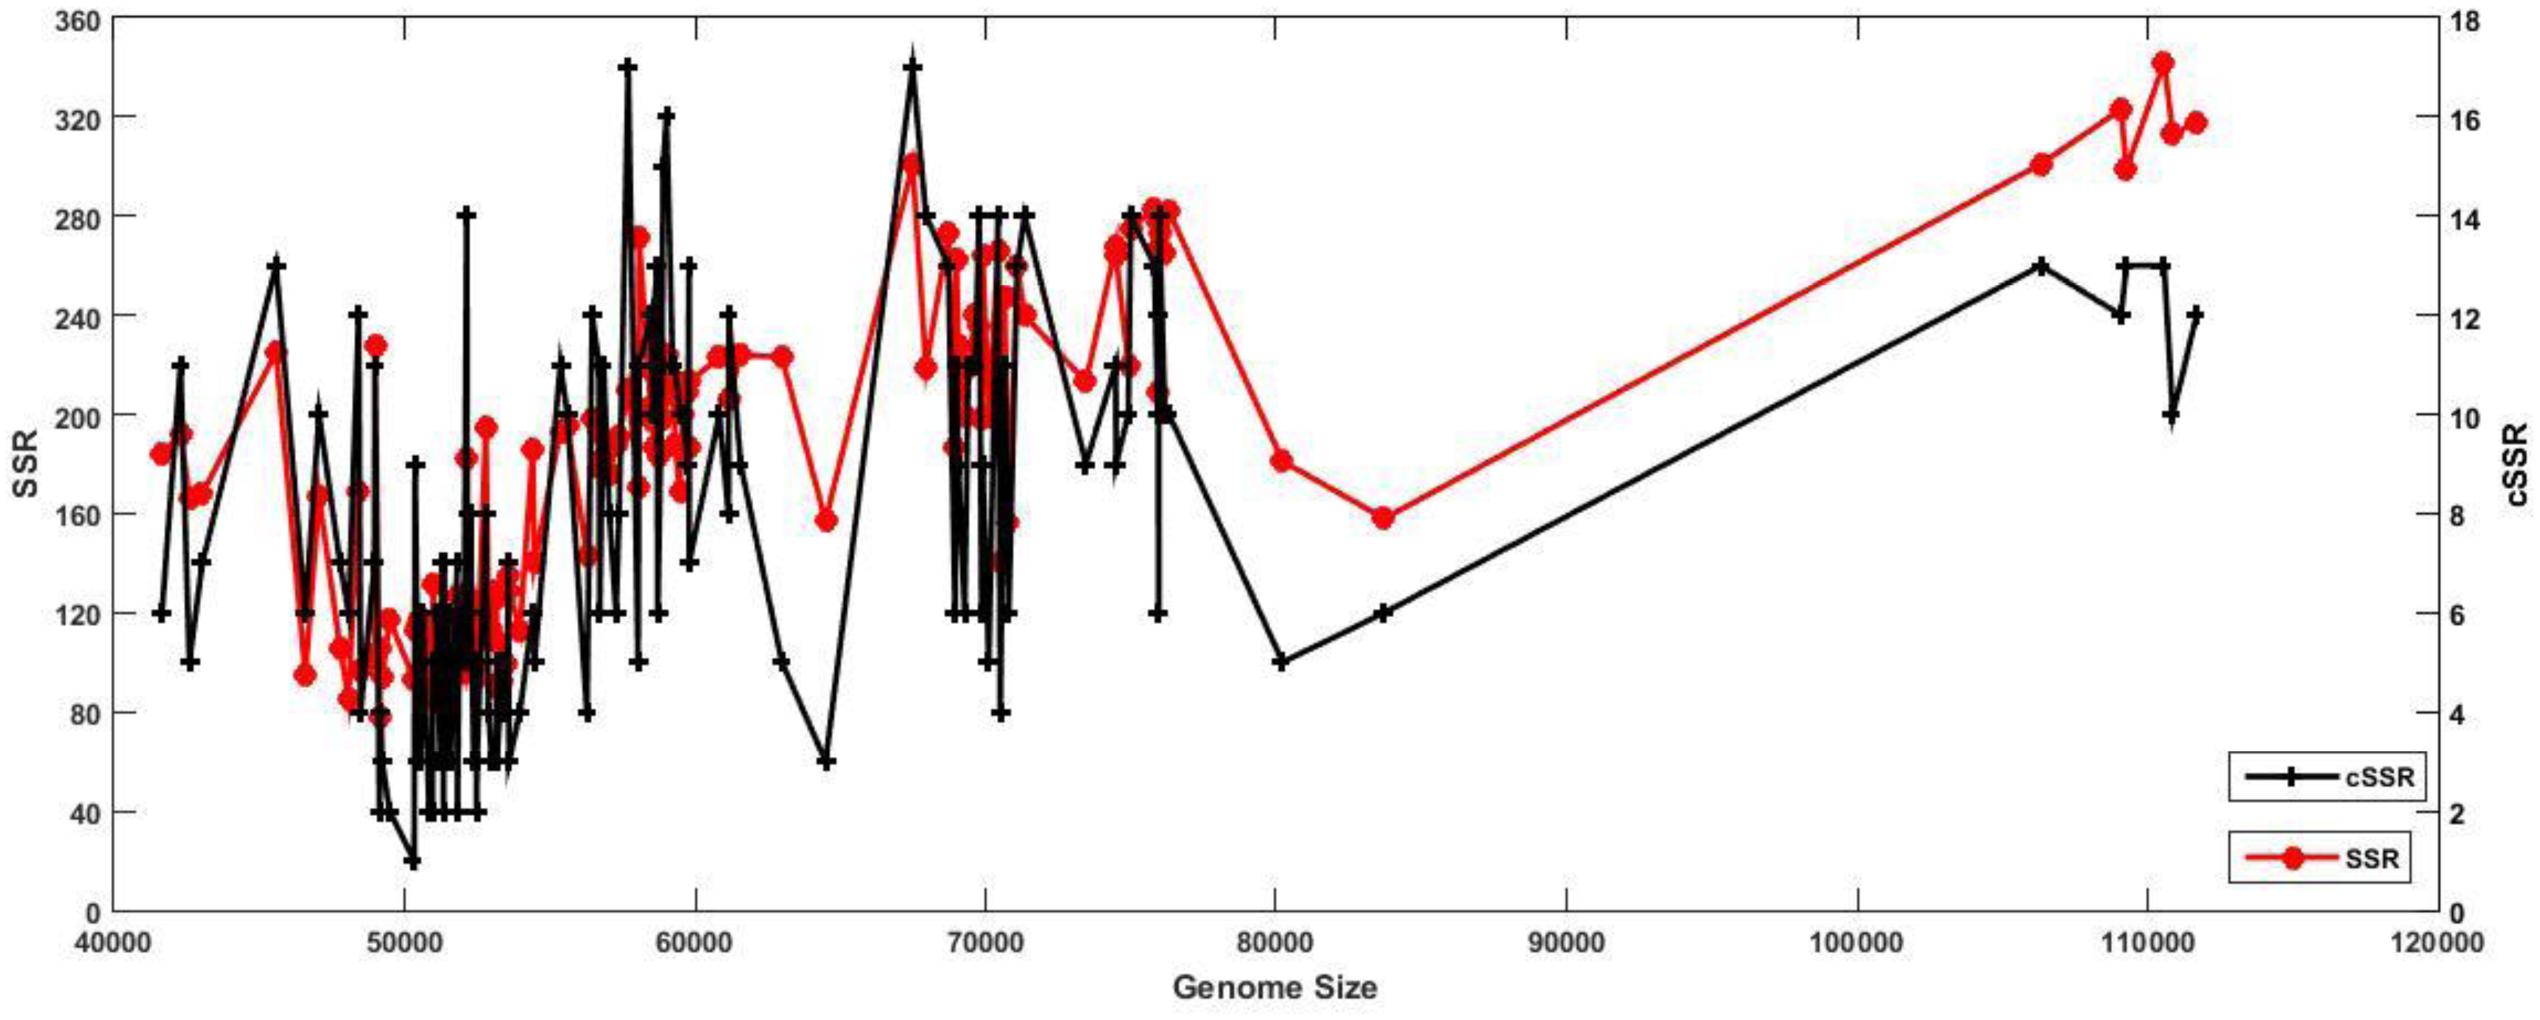
Figure 2. Relation between genome size and SSR/cSSR incidence. The presence of some of the highest peaks (SSR/cSSR incidence) on the far left of the X-axis (smaller genome size) are a clear indication of comparable SSR incidences across varying length of genomes, thus implying their functional significance.
The incidence of cSSRs ranged from 1 (M138) to 17 (M28, M73) (Figure 1B and Supplementary Tables 1–3). The analyses reveal that a higher incidence of SSR doesn’t necessarily correlate with a higher number of cSSRs. For instance, Mycobacterium phage tiger (M138), with 93 SSRs, has a single cSSR, whereas Mycobacterium phage L5 (M116), with 96 SSRs has 8 cSSRs (Figure 1 and Supplementary Tables 1–3). Furthermore, we looked into cSSR percentage, which is the percentage of SSRs in a genome present as cSSRs (Figure 3); this ranged from 1.08 (M138 with 93 SSRs) to 8.33 (M116 with 96 SSRs) (Supplementary Table 1).
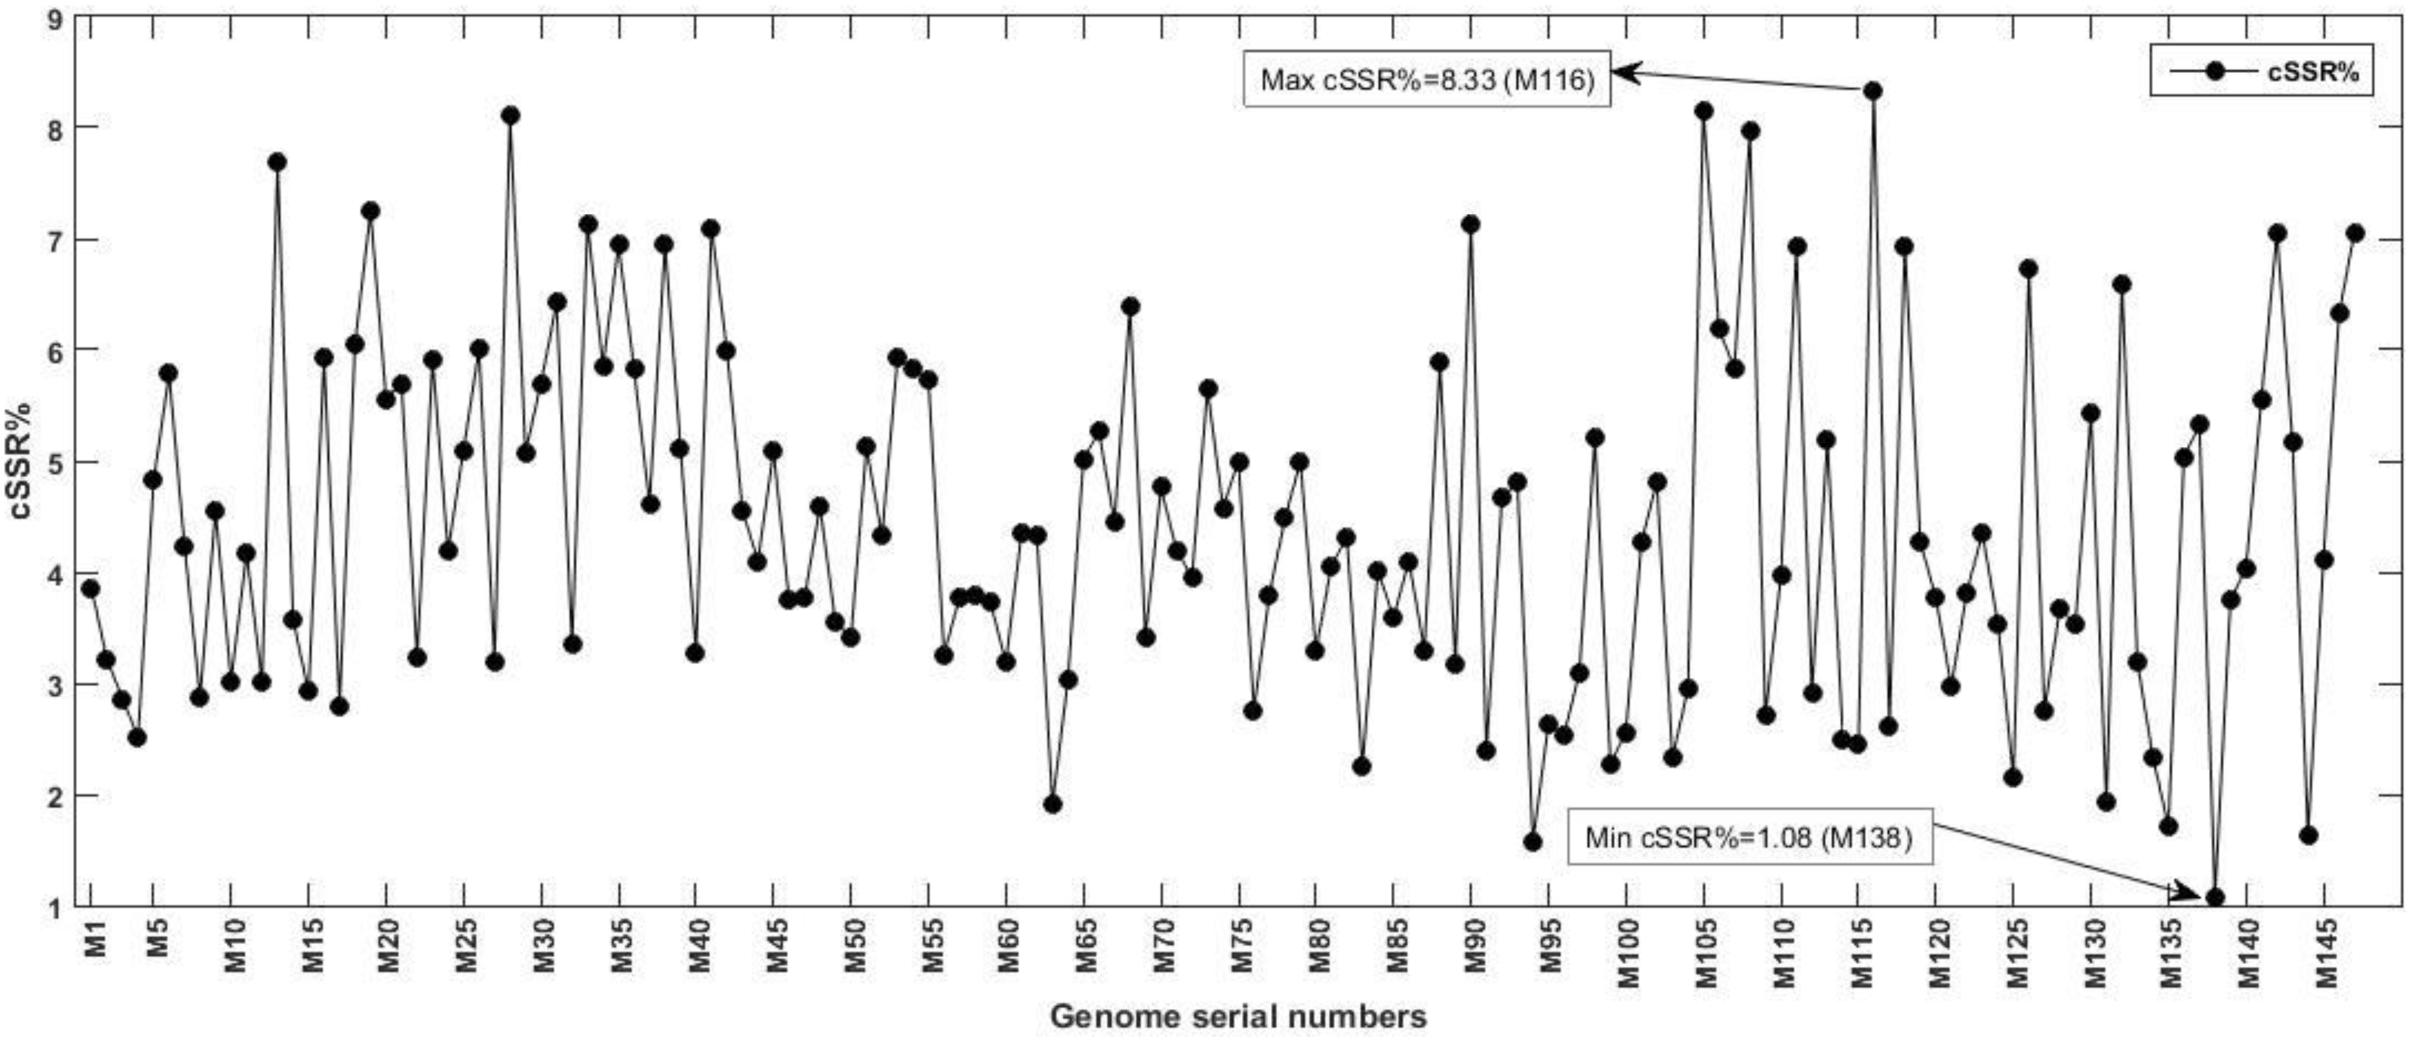
Figure 3. Compound SSRs % in the studied Mycobacteriophage genomes. The percentage of individual microsatellites that are part of a compound microsatellite is represented by cSSR %. Note the presence of highest cSSR% of 8.33 in M116 with just 96 SSRs (Supplementary Table 1), representing uneven distribution of SSRs, suggestive of functional relevance.
Owing to the variable SSR and cSSR frequencies, we looked into their RA and RD. The RA is the number of microsatellites present per kb of the genome whereas RD is the sequence space composed of SSRs per kb of the genome. The RA of SSRs ranged from “1.59 (M100) to 4.94 (M6)” and for cSSRs from “0.02 (M138) to 0.29 (M6)” (Supplementary Table 1 and Figures 4, 5). The RD of SSRs ranged from “11.21 (M147) to 35.65 (M6)” and for cSSR from “0.36 (M138) to 5.13 (M28)” (Supplementary Table 1 and Figures 4, 5). The count of SSR in compound microsatellite (cSSR) ranged from 36 in M73 (Mycobacterium phage rosebush) to 2 in M138 (Mycobacterium phage tiger). The cSSR%, which is percentage of individual microsatellite being part of compound microsatellite was (18.4%) highest for M105 (Mycobacterium phage gladiator) and (2.2%) lowest for M138 (Supplementary Table 1).
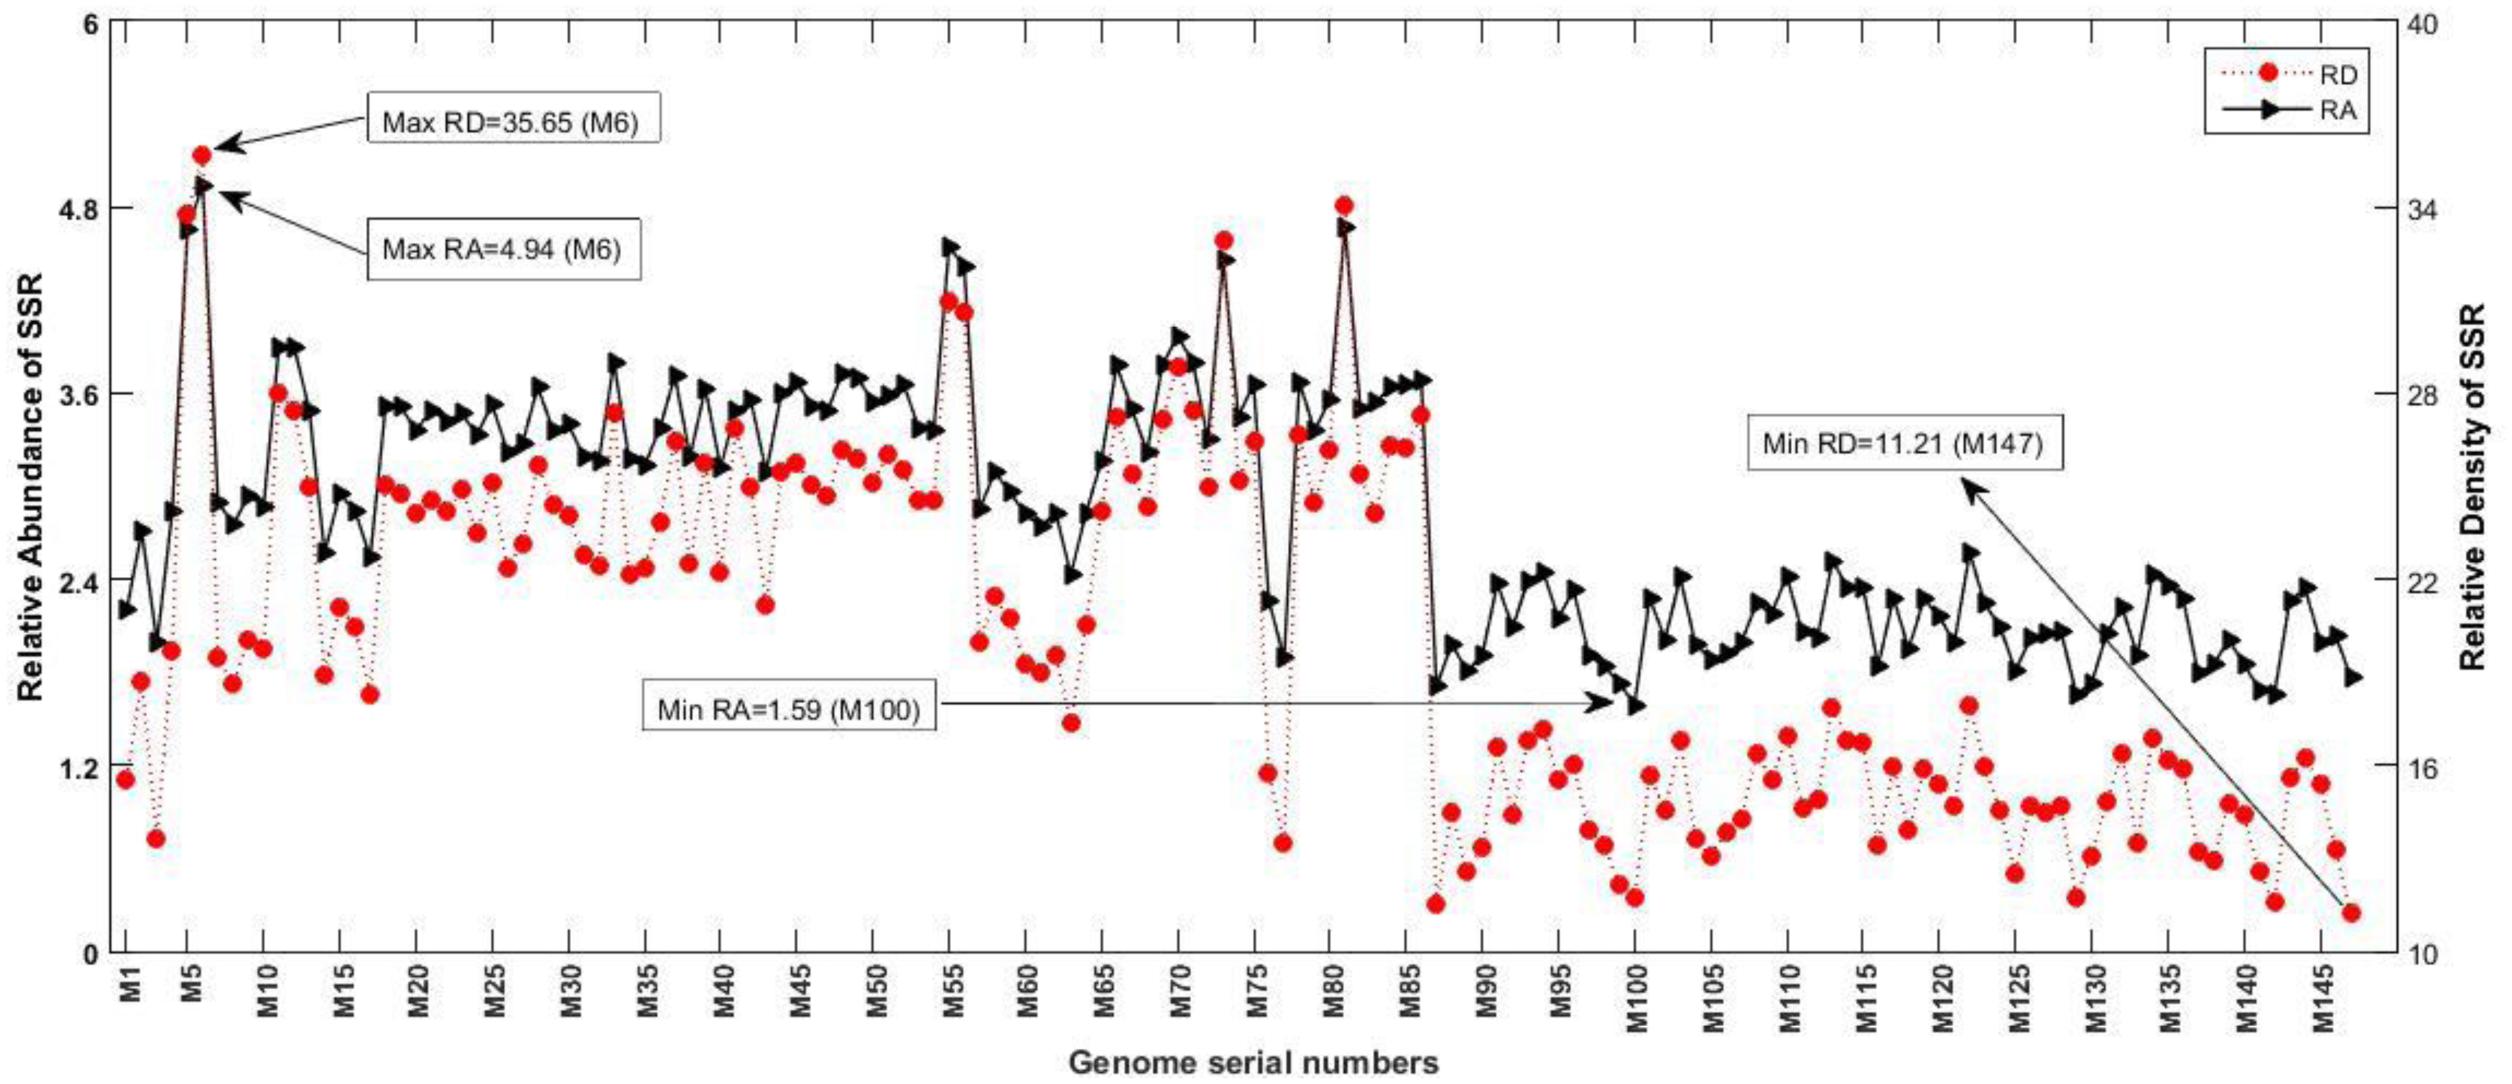
Figure 4. Relative abundance (RA) and relative density (RD) of SSRs. RA is the number of microsatellites present per kb of the genome whereas RD is the sequence space composed of SSRs of microsatellites per kb of the genome. The variations in these variables represent incidence and distribution of these sequences across genomes.
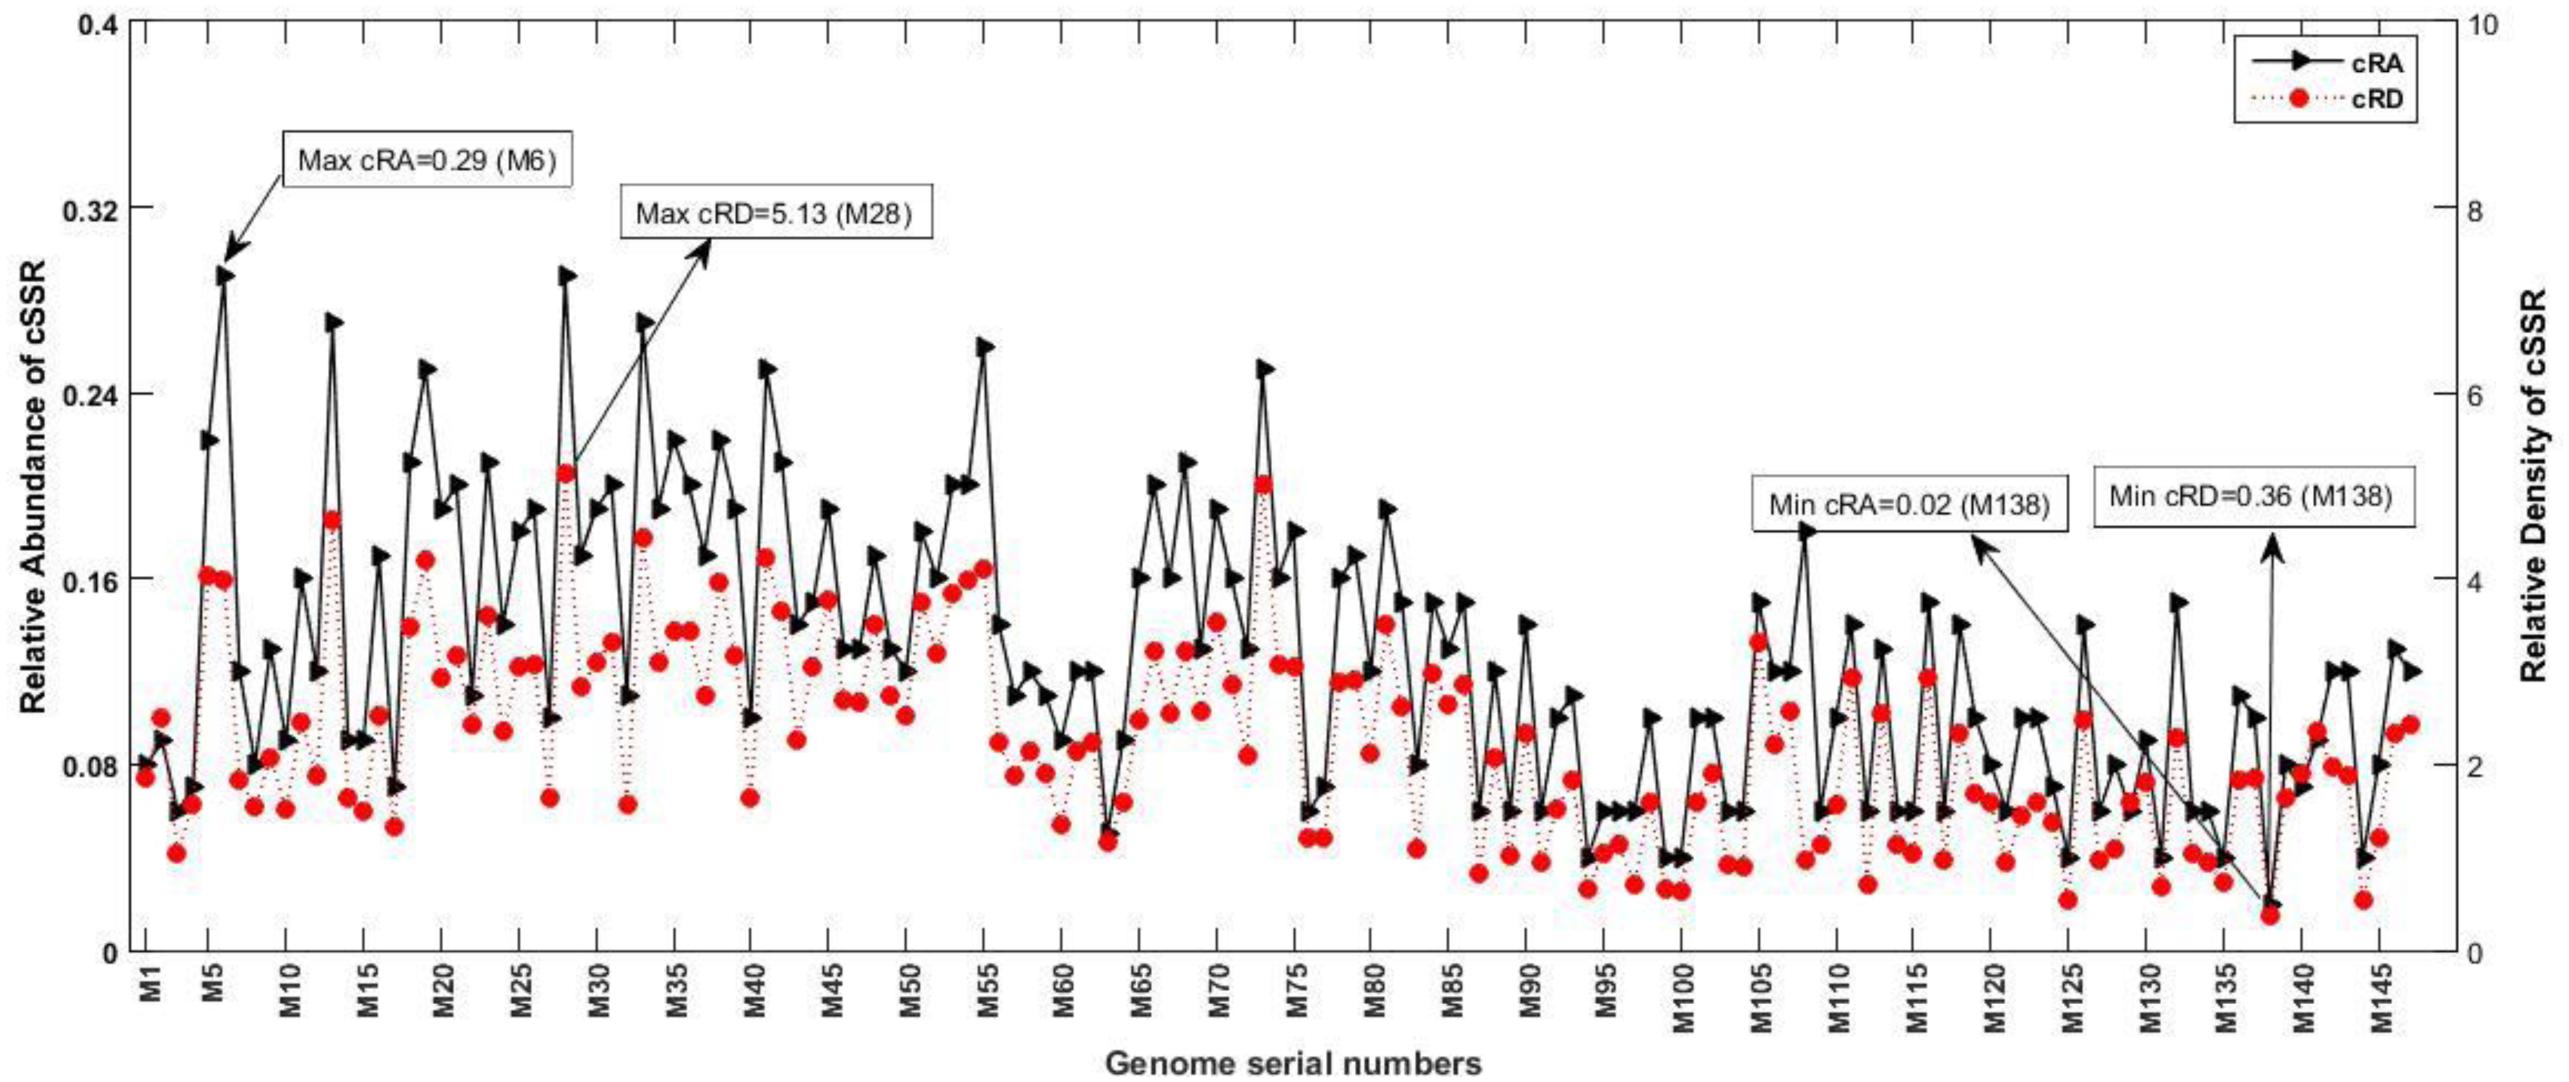
Figure 5. Relative abundance (cRA) and relative density (cRD) of cSSRs. cRA is the number of compound microsatellites present per kb of the genome whereas cRD is the sequence space composed of cSSRs per kb of the genome.
We also looked into the divergence of repeat motifs extracted from the Mycobacteriophage genomes. The SSRs repeat motifs ranged from mononucleotides to hexanucleotides. Of the observed mononucleotides, the most prevalent one was a C repeat, with an average distribution of over six across the studied genomes, followed by T as shown in Figure 6A. The A and G mononucleotide motifs were least represented (average distribution 1.5 each). Among the dinucleotide repeats, the CG/GC repeat motif was the most prevalent with an average distribution of ∼62 across studied genomes, with GT/TG a distant second and having an average distribution of 13 (Figure 6B). The CGG/GGC motif was the highest incident trinucleotide repeat. The distribution of these repeats has been illustrated in Figure 6A. Regarding the number of iterations present at a stretch, a maximum of 12 repeats were present for mono-nucleotide C and G each in M129 and M139 respectively. The dinucleotide repeat motifs AC had the highest iteration of 9 observed in M2. The trinucleotides had a higher iteration than the dinucleotides and most of them are coding for amino acids. The AAG motif was present with 9 repeats in M1.
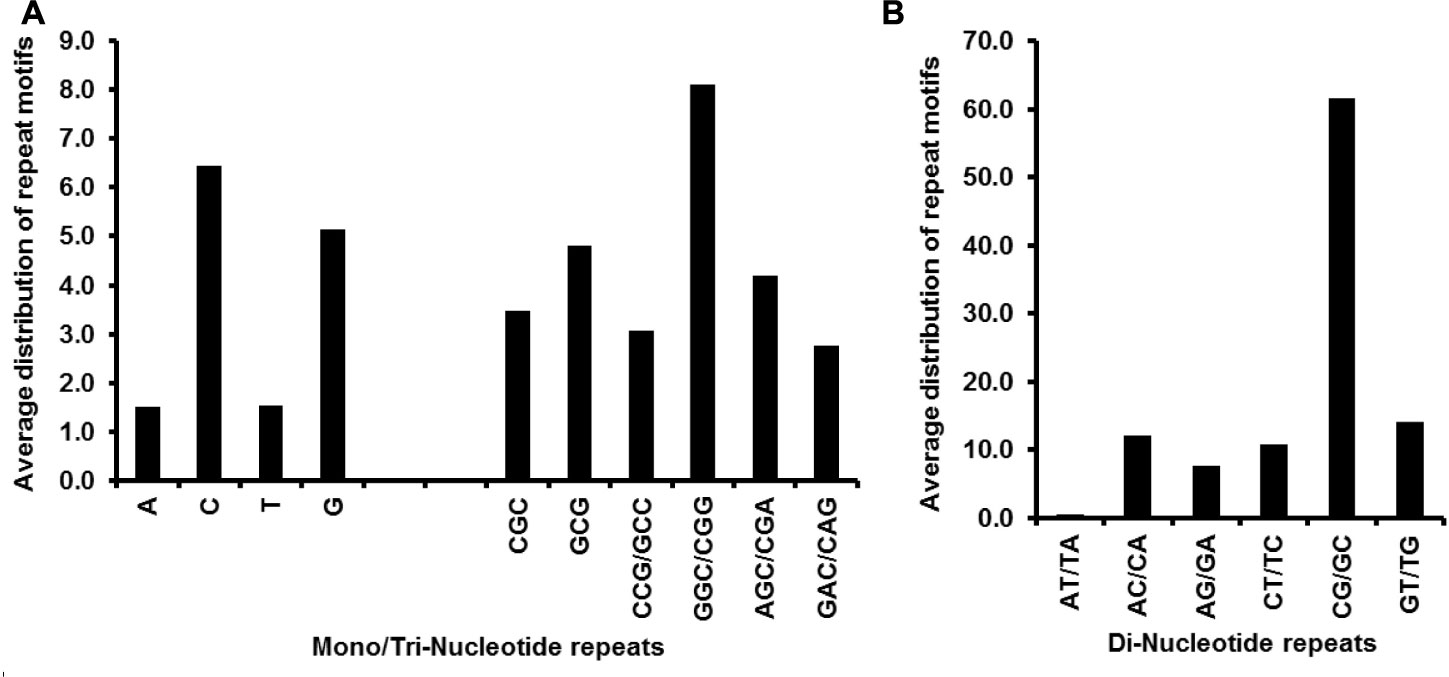
Figure 6. (A) Average distribution of mono- and tri-nucleotide repeat motifs and (B) di-nucleotide repeat motifs. The most prevalent mono-, di- and tri-nucleotide repeat motifs are “C”, “CG/GC,” and “GGC/CGG” respectively, which corroborates with the GC rich nature of the studied genomes.
dMAX is defined as the maximum permissible distance between any two adjacent microsatellites for them to be classified as compound microsatellite (Kofler et al., 2008). The cSSRs described above have a dMAX value of 10. To determine the impact of varying dMAX on cSSR incidence, five genomes, M87, M101, M116, M131, and M146, were chosen at random and the cSSRs were extracted with increasing dMAX. The dMAX value can be set only between 0 and 50 for IMEx (Mudunuri and Nagarajaram, 2007). As expected, there was an increase in cSSR with higher dMAXs in the studied Mycobacteriophage genomes (Figure 7). However, the increase was neither linear nor uniformly proportional across species. For instance, there was no increase in cSSR percentage in M87, M116, or M146 when the dMAX increased from 20 to 30, 10 to 20, and 40 to 50 respectively (Figure 7). This variation is indicative of the differential distribution of SSRs; the motifs are much closely packed in M146 as compared to M116. This is significant as the ability of motifs to induce variations is often dependent on their proximity with other motifs.
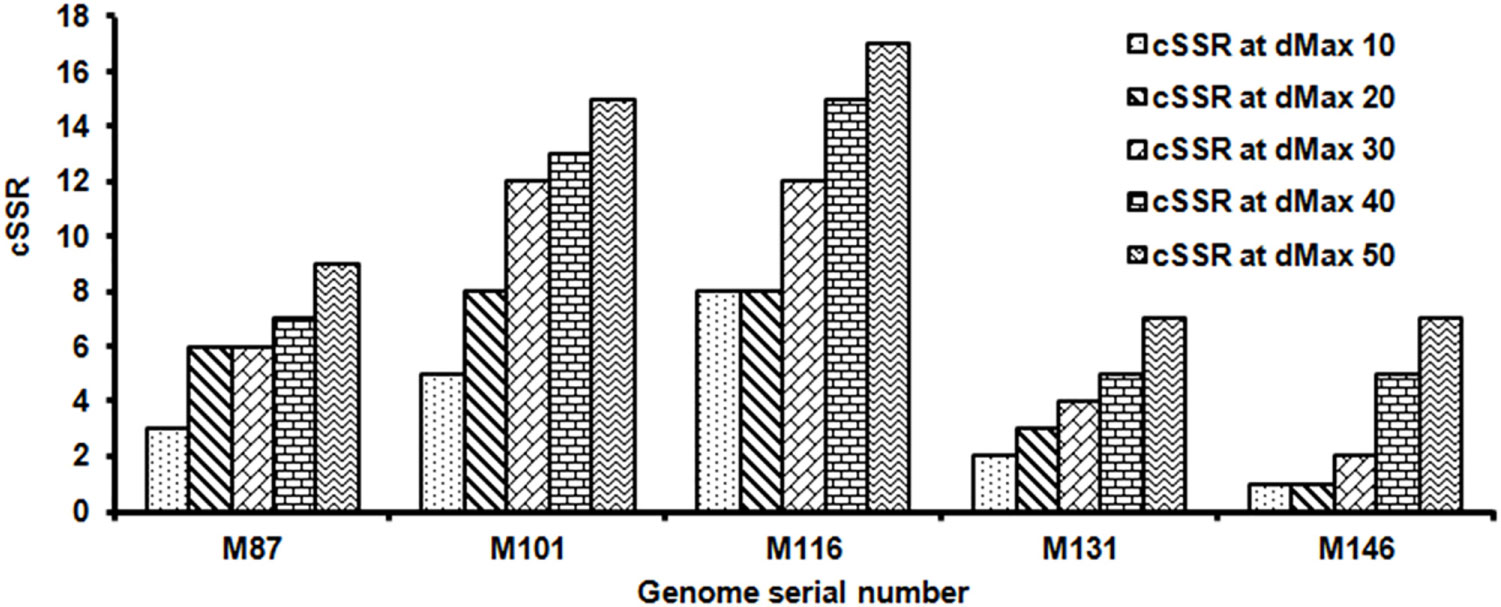
Figure 7. Frequency of cSSR in relation to varying dMAX (10–50) across five randomly selected Mycobacteriophage genomes. A higher cSSR incidence with increasing dMAX in the genomes is along expected lines but the non-linearity of the increase across species is suggestive of genome specific clustering of SSRs.
We also explored the distribution of SSRs across coding and non-coding regions of the genome. This was accomplished by first extracting the genome locations of genes or putative genes into excel format using IGLNNF. The CDS sequence represents the coding part of a gene. A total of 194 coding sequences (CDS) were thus obtained. Generally, these sequences have not been annotated or their function further studied. Subsequently, this data was simulated with the SSR data through IGLSF to get the distribution across coding and non-coding regions. The SSRs distribution across coding and non-coding region was approximately 78 and 22% respectively (Supplementary Table 2). For our analysis, we used 15 conserved CDS domains, which were present in the greatest number of species and studied the percentage of SSRs each of these CDS accounted for as summarized in Figure 8. Further, on looking at the types of SSR motifs present in coding and non-coding regions, we found that average density of hexanucleotides was greatest in coding regions, followed by that of trinucleotide repeats (Figure 9). Overall, the number of dinucleotide repeats (15710) was greatest, followed by trinucleotide repeat (7231) motifs. The rarest class of repeats present was the pentanucleotides (17 motifs).
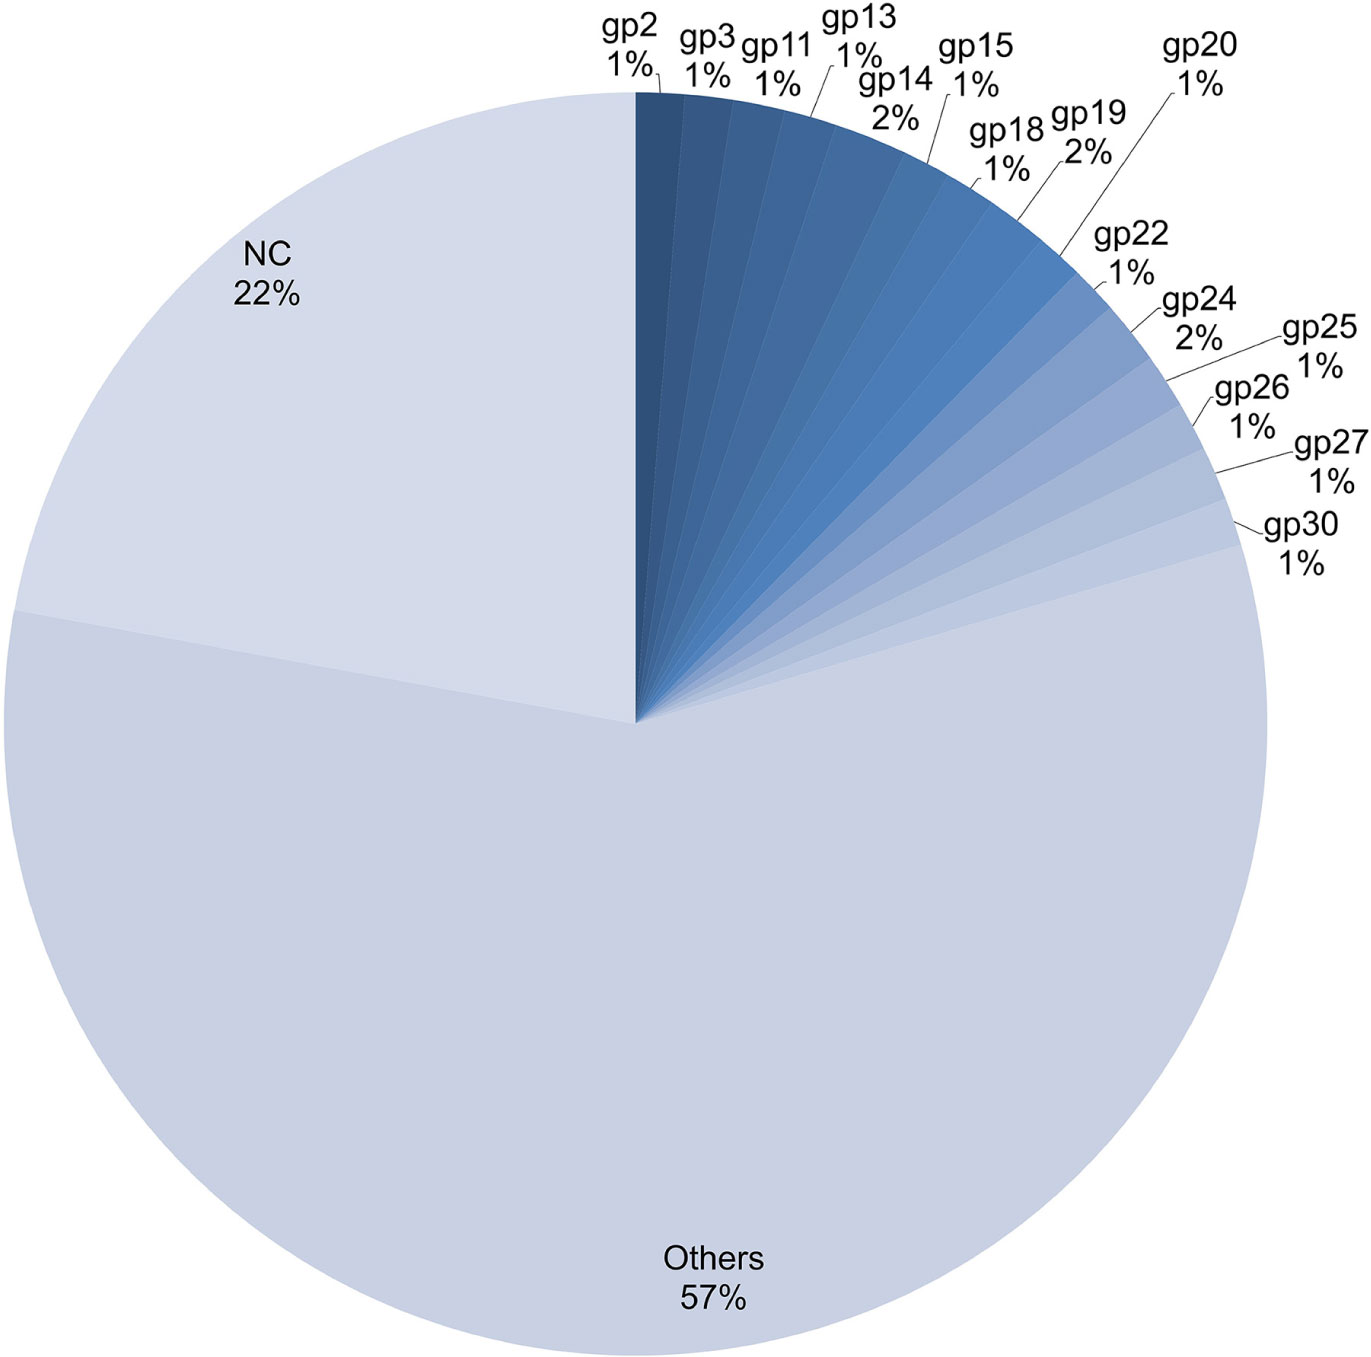
Figure 8. Differential distribution of SSRs (%) in coding vs. non-coding regions. In the figure “gp” represents “ORF”. The 15 most conserved “gp” were included in this figure, “NC” represents non-coding and “Others” represent in remaining “gp” (179). The numbers in percentage represent the fraction of SSRs that can be attributed to that specific sequence across genomes.
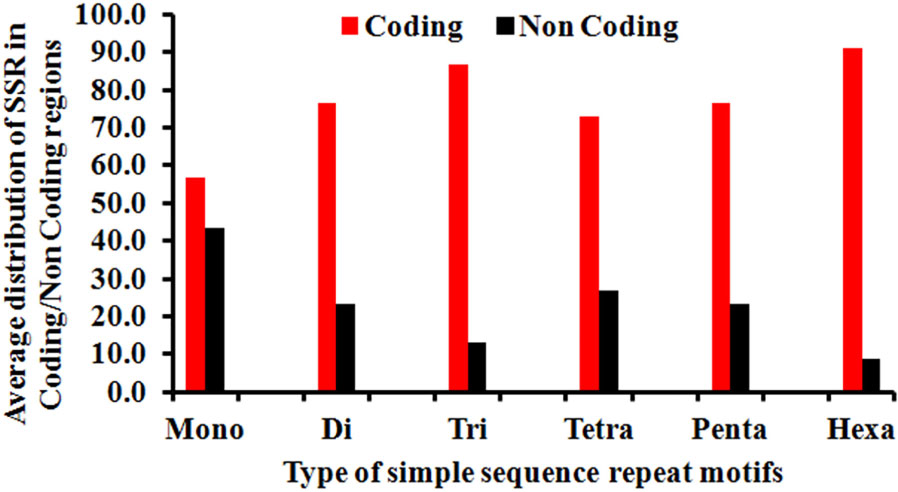
Figure 9. Differential distribution of individual SSR (%) from Mono to Hexanucleotide in coding vs. non-coding regions. The figure very clearly illustrates the extreme bias of hexanucleotide repeats incidence in coding regions. This was followed by trinucleotide repeats whereas the least bias was observed in case of mononucleitide repeats.
We tested for correlations between genome size and GC content and the number, RA, and RD of SSRs and cSSRs. Correlations between genome size and SSR parameters were significant in terms of incidence (R2 = 0.6, P < 0.05), RA (R2 = 0.06, P < 0.05) and RD (R2 = 0.05, P < 0.05). The similarly correlation was significant for GC content in terms of RA (R2 = 0.13, P < 0.05) and RD (R2 = 0.16, P < 0.05), but insignificant for incidence (R2 = 0.02, P > 0.05), Correlation analysis was performed as well for cSSRs. The correlation between genome size and cSSR parameters were insignificant for incidence (R2 = 0.2, P > 0.05), yet significant with cRA (R2 = 0.003, P < 0.05) and cRD (R2 = 0.01, P < 0.05). GC content was not significantly correlated with cSSR incidence (R2 = 0.03, P > 0.05) and cRD (R2 = 0.06, P > 0.05), but was significant for cRA (R2 = 0.07, P > 0.05). The Z-scores served to test the statistical significance of the compound microsatellite distribution in 96 species. cSSRobs was higher compared to cSSRexp, its value ranging from 0 to 0.12, whereas in 51 species cSSRobs was lower compared to cSSRexp and ranged from -0.02 to -0.18, respectively.
We also examined if SSR incidence was correlated with complexity regarding the host range of the Mycobacteriophages covered in the study. For this we focused on six phages: three with broad host ranges, Mycobacterium phage L5 (M116), Mycobacterium phage D29 (M100), and Mycobacterium phage Bxz2 (M97); and three with restricted host ranges, Mycobacterium phage barnyard (M1), Mycobacterium phage rosebush (M73), and Mycobacterium phage Che8 (M16) (Hatfull, 2014). We generated dot plots for these genomes using Gepard (Krumsiek et al., 2007) to highlight the presence of SSRs within the genomes, as represented in Figure 10. Though a repeat-rich genome is an apt platform for genomic evolution and diversity, it is dependent on constituent repeat motifs as well. We looked into the mono- and di-nucleotide repeats of these six genomes keeping in mind the host range. The three species with broad host range (M97, M100, M116) have around 90% of their mono-nucleotide repeat motifs composed of G or C. Also, except for M16, none of the species here has both A and T mononucleotide motifs (Figure 11A). Furthermore, around 20% of the di-nucleotide repeats motifs in the genomes exhibiting a broad host range were CT/TC, which were either absent or represented to a much lesser extent in the other genomes (Figure 11B). We did Pearson Chi-squared test and found that presence of different mono and dinucleotide repeat types were significant for broad host range and for restricted host range. The chi-square for mononucleotides was 48.75 (P-value <0.0001) and for dinucleotides 145.1 (P-value <0.0001).
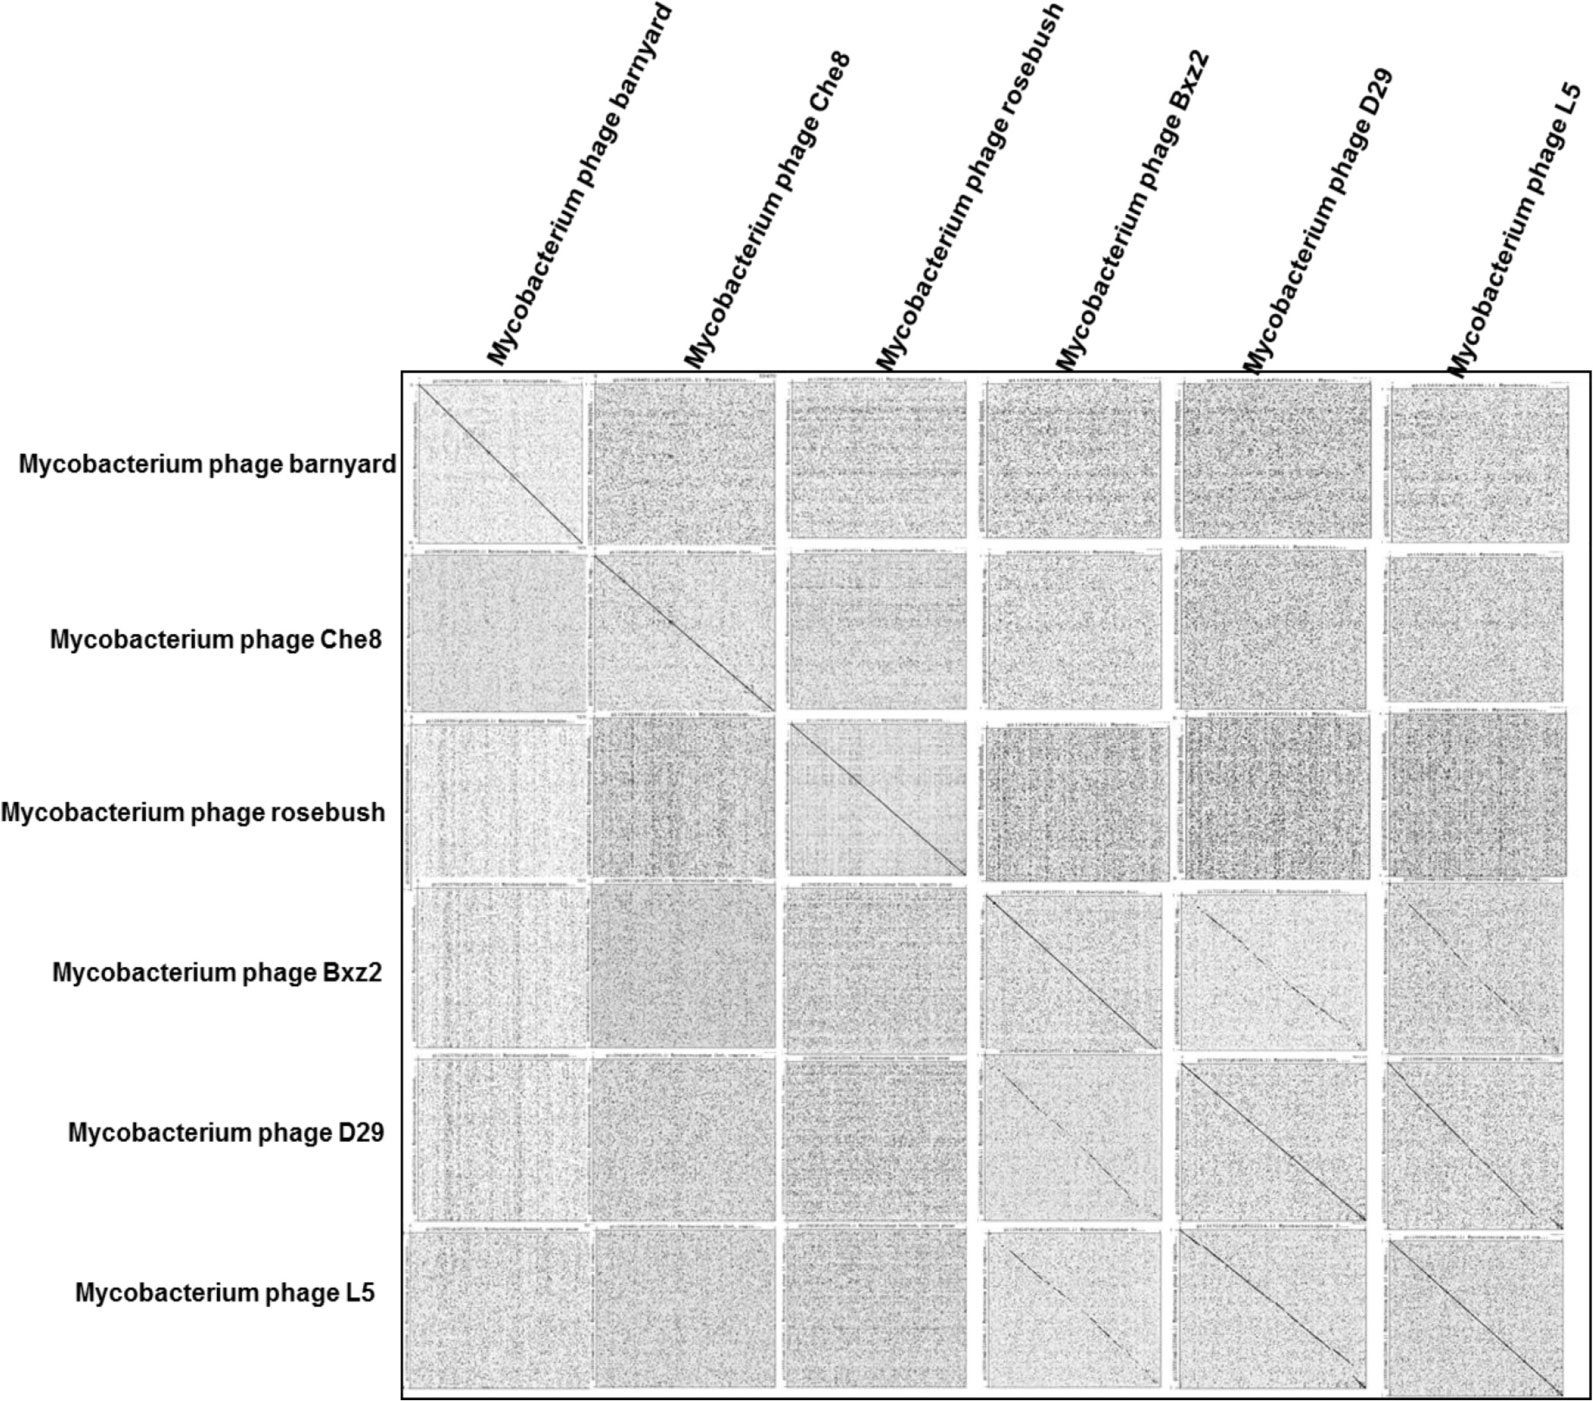
Figure 10. Dot plot analysis of six Mycobacteriophage genomes, three with broad host range and three with restricted host range. Repeats within a single genome are depicted as dots, which extend into lines with as the repeats extend. Lines off the center line of the global comparison indicate sequence conservation between Mycobacteriophage genomes.

Figure 11. Composition of (A) mononucleotide and (B) dinucleotide repeat motifs in six Mycobacteriophage genomes selected by their host range. The broad host range species M97, M100, M116 have extremely high prevalence of mono-nucleotide repeat motifs G/C. These species have ∼20% of the di-nucleotide repeat motifs CT/TC, which are either absent or comparatively much less represented (<10%) in the others with narrow host range.
Microsatellites or SSRs are present across prokaryotic and eukaryotic genomes. In this study, we screened 147 Mycobacteriophage genomes for the presence, abundance, and composition of SSR and cSSR tracts. Though a minor component of these variations may be attributed to sequencing errors but such artifacts, if at all present would be too miniscule to challenge the data per se. We find variation in the incidence of SSRs and cSSRs and their related parameters such as RA, RD, and cSSR percentage. We looked for correlations between frequency and composition of SSRs and cSSRs and found that type of motif varies in species with different host ranges. In our analysis, we found that dinucleotide repeats were most prevalent, followed by trinucleotide, mononucleotide, tetranucleotide, hexanucleotide, and pentanucleotide repeat motifs respectively. Repeat motifs were mostly present in the coding region. We found that genomes can differ in size by almost 16 kb but yet have almost the same number of SSRs. This variation might be associated with the ability to expand their host range through mutations in tail genes (Jacobs-Sera et al., 2012).
In the five Mycobacteriophage species examined, the cSSR percentage increases with increasing dMAX, but not linearly, as we saw earlier on Flavivirus, Ebolavirus, Alphavirus, Human Papillomavirus (HPV), Potexvirus, Carlaviruses, and Tobamovirus (Alam et al., 2013, 2014a,b,c; Singh et al., 2014; Mashhhood Alam, 2016). The non-linear conversion of SSRs to cSSRs in genomes of similar size suggests differential roles of repeat sequences. The cSSRs have been shown to be an outcome of recombination between homologous microsatellites (Jakupciak and Wells, 1999). Although imperfections in microsatellites have been proposed as a source of their evolution (Kofler et al., 2008), a clear evolutionary path of imperfect microsatellites in evolution is not yet elucidated. The abundance of microsatellites correlated well with the sequence composition of the repeat units. Poly (G/C) repeats were significantly more prevalent than poly (A/T) repeats in each complete Mycobacteriophage genome. This contrasts with most of eukaryotic and prokaryotic genomes, which have more abundant poly (A/T) tracts (Gur-Arie et al., 2000; Tóth et al., 2000; Karaoglu et al., 2005). In the sequences we analyzed, GC content is only slightly higher compared to AT, which suggests GC content has no influence on poly (G/C) repeats. Dinucleotide repeats were more prevalent compared to trinucleotide repeats. For the dinucleotide repeats, GC/CG predominates, whereas AT/TA was rare. Contrary to our results, CG/GC repeats were found rarely in most of earlier analyzed genomes such as geminivirus (George et al., 2012), human, Drosophila (Katti et al., 2001), Arabidopsis thaliana, Oryza sativa, Triticum aestivum, Zea mays, Glycine max (Morgante et al., 2002), fungi like Aspergillus nidulans, Cryptococcus neoformans (Hong et al., 2007), and some other eukaryotes (Deback et al., 2009). Among the trinucleotide repeats, GC-rich ones, such as GGC/CGG/AGC/CGA and GCG, were most prevalent.
In earlier studies it has been shown that each type of repeat sequence has its effects on genome function. The mononucletide repeat polymorphism can affect sporulation in budding yeast (Kashi and King, 2006). The dinucleotide repeats have been known to be associated with copy number variations, strand slippage, and polymorphisms accounting for genome evolution and adaptation (Tóth et al., 2000; Kashi and King, 2006; Deback et al., 2009). The contribution of dinucleotide SSRs motifs provides a platform for the dynamic nature of mycobacteriophage genomes, whereas trinucleotide repeats are present mostly in the coding region.
The analysis of L5like virus deserves a special mention across Figures 1, 3, 4. In Figure 4, which depict RA and RD there seems to be a discontinuity in graph for these species (M87 to M147). However, the same may be attributed to lower microsatellite incidence as clearly depicted in Figure 1. What makes it interesting is that in spite of lower values for incidence accounting for reduced RA and RD, these species have a very high cSSR% (Figure 3) implying the clustering of present SSRs. This further strengthens our understanding about SSRs being localized and implicated in functional genome evolution.
The range for RA and RD across genomes of mycobacteriophages is a representation of the degree to which microsatellites fill genome space; values of these parameters indicate species with the potential for genome evolution by SSR accumulation, reflecting on host divergence. Larger genomes tend to have more cSSRs, which suggests clustering of SSRs on the genome, because cSSR % is an indirect representation of distance between adjacent SSRs. Microsatellites are reportedly involved in regulation of gene expression and protein function in several species (Kashi and King, 2006; Chen et al., 2012). However, the fact that coding regions account for almost 78% of the total SSRs present is in line with our earlier studies (Alam et al., 2013, 2014a,b,c; Singh et al., 2014; Mashhhood Alam, 2016) across a diverse set of viruses. The actual presence of SSRs and cSSRs in the coding region and their effect on gene function may become clearer once all the gene products are properly studied and analyzed. We find a common trend that dinucleotide repeats were most prevalent followed by trinucleotide repeats in the coding region of various genera, which suggests their role in gene expression, regulation and evolution. Further, no similarities in the microsatellite landscape between viruses were observed in Herpesvirales having the same host (Wu et al., 2014a,b). It has been reported that the sum of individual incidences of mononucleotide repeat motifs doesn’t match the incidences of the corresponding di-nucleotide repeat motifs, which in turn contribute maximally to the SSR diversity in viral genomes (Zhao et al., 2012). The differences in repeat motif presence between those Mycobacteriophage having broad host range and those with restricted host range may be contributing to divergent host ranges by providing distinct platforms for each genome to evolve and diversify.
The comparative genomics of phages that infect a single common bacterial host can help us understand the mechanisms giving rise to new viruses. The diversity in erstwhile Mycobacteriophages is probably an outcome of the ability of these viruses to rapidly adapt to new hosts. Genome-wide extraction of microsatellites across 147 Mycobacteriophage genomes revealed 25,284 SSRs and 1,127 compound SSRs (cSSRs). Interestingly, genomes of around 50kb accounted for similar numbers of SSRs as did a 110kb genome suggesting that SSR frequency is not necessarily a cause or effect of genome size. Also, a predominant localization of SSRs (∼78%) to coding regions when coupled to their established role in causing sequence polymorphisms indicates their pivotal role in functional genome evolution. Though a complete understanding of the proteins containing these SSRs is yet to be completed, the variations in motif constitution between species with different host range assign at least one functional role for these repeats. The broad host range species exhibited ∼90% mono-nucleotide repeat motifs representation of G/C and ∼20% of the di-nucleotide repeat motifs as CT/TC, which were either absent or represented to a much lesser extent in the other genomes.
CA and AS carried out the microsatellite extraction and correlation studies. AI developed the online tools. AHS helped in statistical analysis. SA coordinated the overall work and prepared the manuscript.
CA was employed by Ingenious e-Brain Solutions, Gurugram, India. AI was employed by PIRO Technologies Private Limited, New Delhi, India.
The remaining authors declare that the research was conducted in the absence of any commercial or financial relationships that could be construed as a potential conflict of interest.
We thank the Erasmus Mundus BRAVE Consortium, the Luke/BI Plant Genome Dynamics Lab, Institute of Biotechnology, and the Viikki Plant Science Centre of the University of Helsinki, Ingenious e-Brain Solutions, Gurugram and the Department of Biomedical Sciences, Shaheed Rajguru College of Applied Sciences for Women, University of Delhi, PIRO Technologies Private Limited, New Delhi and Department of Biological Sciences, Aliah University, Kolkata for all the financial and infrastructural support provided.
The Supplementary Material for this article can be found online at: https://www.frontiersin.org/articles/10.3389/fgene.2019.00207/full#supplementary-material
cSSR, compound simple sequence repeat; IMEx, imperfect microsatellite extraction; RA, relative abundance; RD, relative density; SSR, simple sequence repeat.
Alam, C. M., Singh, A. K., Sharfuddin, C., and Ali, S. (2013). In-silico analysis of simple and imperfect microsatellites in diverse tobamovirus genomes. Gene 530, 193–200. doi: 10.1016/j.gene.2013.08.046
Alam, C. M., Singh, A. K., Sharfuddin, C., and Ali, S. (2014a). Genome-wide scan for analysis of simple and imperfect microsatellites in diverse carlaviruses. Infect. Genet. Evol. 21, 287–294. doi: 10.1016/j.meegid.2013.11.018
Alam, C. M., Singh, A. K., Sharfuddin, C., and Ali, S. (2014b). In- silico exploration of thirty alphavirus genomes for analysis of the simple sequence repeats. Meta Gene 2, 694–705. doi: 10.1016/j.mgene.2014.09.005
Alam, C. M., Singh, A. K., Sharfuddin, C., and Ali, S. (2014c). Incidence, complexity and diversity of simple sequence repeats across potexvirus genomes. Gene 537, 189–196. doi: 10.1016/j.gene.2014.01.007
Brüssow, H., and Hendrix, R. W. (2002). Phage Genomics. Cell 108, 13–16. doi: 10.1016/S0092-8674(01)00637-7
Chambers, G. K., and MacAvoy, E. S. (2000). Microsatellites: consensus and controversy. Comp. Biochem. Physiol. B Biochem. Mol. Biol. 126, 455–476. doi: 10.1016/S0305-0491(00)00233-9
Chen, M., Tan, Z., Zeng, G., and Zeng, Z. (2012). Differential distribution of compound microsatellites in various Human Immunodeficiency Virus Type 1 complete genomes. Infect. Genet. Evol. 12, 1452–1457. doi: 10.1016/j.meegid.2012.05.006
Coenye, T., and Vandamme, P. (2005). Characterization of mononucleotide repeats in sequenced prokaryotic genomes. DNA Res. 12, 221–233. doi: 10.1093/dnares/dsi009
Comeau, A. M., Hatfull, G. F., Krisch, H. M., Lindell, D., Mann, N. H., and Prangishvili, D. (2008). Exploring the prokaryotic virosphere. Res. Microbiol. 159, 306–313. doi: 10.1016/j.resmic.2008.05.001
Deback, C., Boutolleau, D., Depienne, C., Luyt, C. E., Bonnafous, P., Gautheret-Dejean, A., et al. (2009). Utilization of microsatellite polymorphism for differentiating herpes simplex virus type 1 strains. J. Clin. Microbiol. 47, 533–540. doi: 10.1128/JCM.01565-08
Dieringer, D., and Schlötterer, C. (2003). Two distinct modes of microsatellite mutation processes: evidence from the complete genomic sequences of nine species. Genome Res. 13, 2242–2251. doi: 10.1101/gr.1416703
George, B., Mashhood Alam, C., Jain, S. K., Sharfuddin, C., and Chakraborty, S. (2012). Differential distribution and occurrence of simple sequence repeats in diverse geminivirus genomes. Virus Genes 45, 556–566. doi: 10.1007/s11262-012-0802-1
Gur-Arie, R., Cohen, C. J., Eitan, Y., Shelef, L., Hallerman, E. M., and Kashi, Y. (2000). Simple sequence repeats in Escherichia coli: abundance, distribution, composition, and polymorphism. Genome Res. 10, 62–71.
Hatfull, G. F. (2014). Molecular Genetics of Mycobacteriophages. Microbiol. Spectr. 2, 1–36. doi: 10.1128/microbiolspec.MGM2-0032-2013
Hatfull, G. F. (2015). Dark matter of the biosphere: the amazing world of bacteriophage diversity. J. Virol. 89, 8107–8110. doi: 10.1128/JVI.01340-15
Hatfull, G. F., and Hendrix, R. W. (2011). Bacteriophages and their genomes. Curr. Opin. Virol. 1, 298–303. doi: 10.1016/j.coviro.2011.06.009
Hendrix, R. W. (2004). Hot new virus, deep connections. Proc. Natl. Acad. Sci. U.S.A. 101, 7495–7496. doi: 10.1073/pnas.0402151101
Hong, C. P., Piao, Z. Y., Kang, T. W., Batley, J., Yang, T.-J., Hur, Y.-K., et al. (2007). Genomic distribution of simple sequence repeats in Brassica rapa. Mol. Cells 23, 349–356.
Jacobs-Sera, D., Marinelli, L. J., Bowman, C., Broussard, G. W., Guerrero Bustamante, C., Boyle, M. M., et al. (2012). On the nature of mycobacteriophage diversity and host preference. Virology 434, 187–201. doi: 10.1016/j.virol.2012.09.026
Jakupciak, J. P., and Wells, R. D. (1999). Genetic instabilities in (CTG.CAG) repeats occur by recombination. J. Biol. Chem. 274, 23468–23479. doi: 10.1074/jbc.274.33.23468
Karaoglu, H., Lee, C. M. Y., and Meyer, W. (2005). Survey of simple sequence repeats in completed fungal genomes. Mol. Biol. Evol. 22, 639–649. doi: 10.1093/molbev/msi057
Kashi, Y., and King, D. G. (2006). Simple sequence repeats as advantageous mutators in evolution. Trends Genet. 22, 253–259. doi: 10.1016/j.tig.2006.03.005
Katti, M. V., Ranjekar, P. K., and Gupta, V. S. (2001). Differential distribution of simple sequence repeats in eukaryotic genome sequences. Mol. Biol. Evol. 18, 1161–1167. doi: 10.1093/oxfordjournals.molbev.a003903
Kelkar, Y. D., Tyekucheva, S., Chiaromonte, F., and Makova, K. D. (2008). The genome-wide determinants of human and chimpanzee microsatellite evolution. Genome Res. 18, 30–38. doi: 10.1101/gr.7113408
Kofler, R., Schlötterer, C., Luschützky, E., and Lelley, T. (2008). Survey of microsatellite clustering in eight fully sequenced species sheds light on the origin of compound microsatellites. BMC Genomics 9:612. doi: 10.1186/1471-2164-9-612
Krumsiek, J., Arnold, R., and Rattei, T. (2007). Gepard: a rapid and sensitive tool for creating dotplots on genome scale. Bioinformatics 23, 1026–1028. doi: 10.1093/bioinformatics/btm039
Krupovič, M., and Bamford, D. H. (2010). Order to the viral universe. J. Virol. 84, 12476–12479. doi: 10.1128/JVI.01489-10
Mashhhood Alam, C. (2016). Imex based analysis of repeat sequences in flavivirus genomes, including dengue virus. J. Data Mining Genomics Proteomics 7:2153-0602.1000187. doi: 10.4172/2153-0602.1000187
Morgante, M., Hanafey, M., and Powell, W. (2002). Microsatellites are preferentially associated with nonrepetitive DNA in plant genomes. Nat. Genet. 30, 194–200. doi: 10.1038/ng822
Mrázek, J. (2006). Analysis of distribution indicates diverse functions of simple sequence repeats in Mycoplasma genomes. Mol. Biol. Evol. 23, 1370–1385. doi: 10.1093/molbev/msk023
Mudunuri, S. B., and Nagarajaram, H. A. (2007). IMEx: imperfect microsatellite extractor. Bioinformatics 23, 1181–1187. doi: 10.1093/bioinformatics/btm097
Oliveira, A. C. M., de Pereira, L. A., Ferreira, R. C., and Clemente, A. P. G. (2018). [Maternal nutritional status and its association with birth weight in high-risk pregnancies]. Cien Saude Colet 23, 2373–2382. doi: 10.1590/1413-81232018237.12042016
Ouyang, Q., Zhao, X., Feng, H., Tian, Y., Li, D., Li, M., et al. (2012). High GC content of simple sequence repeats in Herpes simplex virus type 1 genome. Gene 499, 37–40. doi: 10.1016/j.gene.2012.02.049
Pan, X. (2004). Two-triplet CGA repeats impede DNA replication in bacteriophage M13 in Escherichia coli. Microbiol. Res. 159, 97–102. doi: 10.1016/j.micres.2003.12.001
Pearson, K. (1900). X. On the criterion that a given system of deviations from the probable in the case of a correlated system of variables is such that it can be reasonably supposed to have arisen from random sampling. Lond. Edinb. Dubl. Philos. Mag. J. Sci. 50, 157–175. doi: 10.1080/14786440009463897
Queller, D. C., Strassmann, J. E., and Hughes, C. R. (1993). Microsatellites and kinship. Trends Ecol. Evol. 8, 285–288. doi: 10.1016/0169-5347(93)90256-O
Singh, A. K., Alam, C. M., Sharfuddin, C., and Ali, S. (2014). Frequency and distribution of simple and compound microsatellites in forty-eight Human papillomavirus (HPV) genomes. Infect. Genet. Evol. 24, 92–98. doi: 10.1016/j.meegid.2014.03.010
Suttle, C. A. (2007). Marine viruses–major players in the global ecosystem. Nat. Rev. Microbiol. 5, 801–812. doi: 10.1038/nrmicro1750
Tóth, G., Gáspári, Z., and Jurka, J. (2000). Microsatellites in different eukaryotic genomes: survey and analysis. Genome Res. 10, 967–981. doi: 10.1101/gr.10.7.967
Usdin, K. (2008). The biological effects of simple tandem repeats: lessons from the repeat expansion diseases. Genome Res. 18, 1011–1019. doi: 10.1101/gr.070409.107
Wommack, K. E., and Colwell, R. R. (2000). Virioplankton: viruses in aquatic ecosystems. Microbiol. Mol. Biol. Rev. 64, 69–114. doi: 10.1128/MMBR.64.1.69-114.2000
Wu, K., Yang, M., Liu, H., Tao, Y., Mei, J., and Zhao, Y. (2014a). Genetic analysis and molecular characterization of Chinese sesame (Sesamum indicum L.) cultivars using insertion-deletion (InDel) and simple sequence repeat (SSR) markers. BMC Genet. 15:35. doi: 10.1186/1471-2156-15-35
Wu, X., Zhou, L., Zhao, X., and Tan, Z. (2014b). The analysis of microsatellites and compound microsatellites in 56 complete genomes of Herpesvirales. Gene 551, 103–109. doi: 10.1016/j.gene.2014.08.054
Keywords: Mycobacteriophage, simple sequence repeats, imperfect microsatellite extractor, dMAX, host range
Citation: Alam CM, Iqbal A, Sharma A, Schulman AH and Ali S (2019) Microsatellite Diversity, Complexity, and Host Range of Mycobacteriophage Genomes of the Siphoviridae Family. Front. Genet. 10:207. doi: 10.3389/fgene.2019.00207
Received: 04 May 2018; Accepted: 26 February 2019;
Published: 14 March 2019.
Edited by:
John R. Battista, Louisiana State University, United StatesReviewed by:
Elgion Lucio Silva Loreto, Universidade Federal de Santa Maria, BrazilCopyright © 2019 Alam, Iqbal, Sharma, Schulman and Ali. This is an open-access article distributed under the terms of the Creative Commons Attribution License (CC BY). The use, distribution or reproduction in other forums is permitted, provided the original author(s) and the copyright owner(s) are credited and that the original publication in this journal is cited, in accordance with accepted academic practice. No use, distribution or reproduction is permitted which does not comply with these terms.
*Correspondence: Safdar Ali, c2FmZGFyX21nbEBsaXZlLmlu; YWxpQGFsaWFoLmFjLmlu
Disclaimer: All claims expressed in this article are solely those of the authors and do not necessarily represent those of their affiliated organizations, or those of the publisher, the editors and the reviewers. Any product that may be evaluated in this article or claim that may be made by its manufacturer is not guaranteed or endorsed by the publisher.
Research integrity at Frontiers

Learn more about the work of our research integrity team to safeguard the quality of each article we publish.