 Shuai Liu
 Mengye Lu
 Hanshuang Li3,4
 Yongchun Zuo
94% of researchers rate our articles as excellent or good
Learn more about the work of our research integrity team to safeguard the quality of each article we publish.
Find out more
ORIGINAL RESEARCH article
Front. Genet. , 04 March 2019
Sec. Computational Genomics
Volume 10 - 2019 | https://doi.org/10.3389/fgene.2019.00120
This article is part of the Research Topic Machine Learning Techniques on Gene Function Prediction View all 48 articles
Cell reprogramming has played important roles in medical science, such as tissue repair, organ reconstruction, disease treatment, new drug development, and new species breeding. Oct4, a core pluripotency factor, has especially played a key role in somatic cell reprogramming through transcriptional control and affects the expression level of genes by its combination intensity. However, the quantitative relationship between Oct4 combination intensity and target gene expression is still not clear. Therefore, firstly, a generalized linear regression method was constructed to predict gene expression values in promoter regions affected by Oct4 combination intensity. Training data, including Oct4 combination intensity and target gene expression, were from promoter regions of genes with different cell development stages. Additionally, the quantitative relationship between gene expression and Oct4 combination intensity was analyzed with the proposed model. Then, the quantitative relationship between gene expression and Oct4 combination intensity at each stage of cell development was classified into high and low levels. Experimental analysis showed that the combination height of Oct4-inhibited gene expression decremented by a temporal exponential value, whereas the combination width of Oct4-promoted gene expression incremented by a temporal logarithmic value. Experimental results showed that the proposed method can achieve goodness of fit with high confidence.
Somatic cells can be reverted to a pluripotent stem cell by cell reprogramming. Cell reprogramming has been significant in many domains of biological and medical science, including tissue repair, organ reconstruction, disease pathogenesis, and new drug development (Wernig et al., 2007; Park et al., 2008). Earlier, the nuclear transfer method was the main method to cultivate new individuals. However, this method was very controversial in terms of ethics (Gurdon, 1958; Campbell et al., 1996; McCreath et al., 2000; Polejaeva et al., 2000). Recently, study of cells induced to reprogram through specific transcription factors became a hotspot. This method solved the problem of immune rejection of allogeneic cells. In this way, the patient-specific stem cells were obtained without ethical controversy (Lv et al., 2018; Poli et al., 2018; Stadhouders et al., 2018).
As an important regulatory element, transcription factor (TF) was involved in the regulation of transcription initiation, and binding sites of TFs in promoter regions affected gene expression (Duren et al., 2017). Oct4, a core transcription factor, played an important regulatory role in stem cell self-renewal and pluripotency maintenance. It controlled the development and differentiation of early embryos and was highly expressed in a variety of stem cells, including germ cells, embryonic stem cells (ESCs), embryonic germ cells (EGCs), and embryonic tumor cells. In an experiment of mice, Oct4 was observed to play a central role in the cellular pluripotency regulatory network, which reprogramed somatic cells into induced pluripotent stem cells (iPSCs) by expressing transcription factors Oct4, Sox2, Klf4, and c-Myc ectopically (Chen et al., 2016). Another study showed that pluripotent stem cells can be obtained by adding Oct3/4, Sox2, c-Myc, and Klf4 to the fiber cells of mice (Boyer et al., 2005). Regulation of these transcription factors on target genes was achieved mainly through the interaction of feedforward systems, self-regulatory networks and other signaling pathways (Boyer et al., 2005).
Oct4-binding sites in promoter regions were closely related to gene expression (Chen et al., 2016). However, the relationship between Oct4 combination intensity in promoter regions and gene expression remained unclear. Therefore, in this paper, a generalized linear regression model was proposed to analyze the relationship between gene expression and Oct4 combination intensity in promoter regions.
The rest of paper was organized as follows. section Related Work introduces related work on cell reprogramming and gene expression; section Materials and Methods provides materials and methods, including source of data, the proposed generalized linear regression model and evaluation criteria of model performance; section Results and Analysis contains detailed experimental results and analysis, including the solution result and performance analysis of our proposed model, analysis of factors affecting gene expression on every stage of cell development, and applications of our proposed model in gene classification; and section Conclusion summarizes the contents of this paper.
Previous studies reported mechanisms and methods of cell reprogramming. Earlier, Gurdon et al. applied the nuclear transfer method to cell reprogramming of Xenopus laevis (Gurdon, 1958). Campbell, McCreath, and Polejaeva cultivated cloning animals using nuclear transfer technology (Campbell et al., 1996; McCreath et al., 2000; Polejaeva et al., 2000). Håkelien and Hochedlinger analyzed a cell recombination mechanism based on nuclear fusion and nuclear transfer technology (Håkelien et al., 2002; Hochedlinger and Jaenisch, 2002). Later, Stadtfeld and Zardo analyzed the effects of specific transcription factors and epigenetic plasticity of chromatin on cell reprogramming (Stadtfeld et al., 2008; Zardo et al., 2008). Studies by Hanna and Li showed that overexpression of transcription factor Oct4 had an effect on cell reprogramming (Hanna et al., 2009; Li et al., 2009). Doege et al. elaborated the effects of the interaction of Oct4, Sox2, Klf4, and c-Myc on cell reprogramming in the early stages of cell reprogramming (Doege et al., 2012). Apostolou and Chen found that the dynamic mechanisms of chromatin change and DNA methylation had important effects on cell reprogramming (Apostolou and Hochedlinger, 2013; Chen et al., 2013). Koqa et al. analyzed the role of transcription factor Foxd1 in cell reprogramming (Koga et al., 2014). Recently, Poli and Stadhouders elaborated the roles of specific transcription factors used as inducing factors in cell reprogramming (Poli et al., 2018; Stadhouders et al., 2018).
The process of cell reprogramming was closely related to the regulation of gene expression. Moreover, regulation of gene expression is the molecular basis of many life activities, including cell differentiation, morphogenesis, and ontogeny (Chen et al., 2016). Earlier, Chen and Rimsky analyzed regulation effects of cis- and trans-regulatory elements on gene expression (Rimsky et al., 1989; Chen et al., 1990). Later, Ueda et al. analyzed effects of diurnal variation of transcription factors on gene expression (Ueda et al., 2002). Patricia et al. analyzed effects of the interaction of cis- and trans-regulatory elements on gene expression (Wittkopp et al., 2004). Sullivan CS et al. studied the regulation effect of microRNAs encoded by SV40 on gene expression (Sullivan et al., 2005). Jeffery et al. found factors related to gene expression using gene expression data and binding sites of transcription factor (Jeffery et al., 2007). Han et al. found that certain types of genomic organization by SATB1 had an effect on gene expression (Han et al., 2008). Afterward, Costa et al. predicted gene expression in T cell differentiation by using histone modification and binding affinity of transcription factor via a linear mixed model (Costa et al., 2011). Maienscheincline et al. searched for target genes regulated by transcription factors based on some information, including binding sites of transcription factors and target genes (Maienschein-Cline et al., 2012). MT and Holoch analyzed the effects of specific transcription factors and the regulation effect of RNA on gene expression, respectively (Lee et al., 2013; Holoch and Moazed, 2015). Recently, Engreitz and Singh clarified effects of lncRNA promoter, transcription factor, variable splicing, and histone modification on gene expression, respectively (Engreitz et al., 2016; Singh et al., 2016). Thomou and Wu analyzed effects of miRNAs and histone modifications on gene expression (Thomou et al., 2017; Wu et al., 2017). Additionally, Duren et al. predicted gene expression based on chromatin accessibility data, cis-acting and trans-acting element data by logistic regression models (Duren et al., 2017). Neumann and Stadhouders analyzed effects of LncRNA and the dynamic interaction of transcription factors with expression of target genes (Neumann et al., 2018; Stadhouders et al., 2018).
Many methods were proposed for deciphering regulation mechanisms of cis-regulatory and trans-regulatory elements based on gene expression. Studies showed that gene expression was closely related to Oct4 combination intensity in promoter regions (Machado et al., 2011; Machado, 2017; Yan et al., 2017; Antão et al., 2018). However, the quantitative relationship between gene expression and Oct4 combination intensity was not considered. Therefore, firstly, a generalized linear regression model was proposed for quantifying the relationship of gene expression and Oct4 combination intensity based on eight gene datapoints. Then, testing data were applied to test the generalization ability of the model. On the one hand, experiments of 27 genes, as well as all genes, from GEO were applied to analyze the quantitative relationship between Oct4 combination intensity and target gene expression at each stage of cell development by our proposed model. On the other hand, 27 genes were divided into positive and negative samples by our proposed method.
Experimental data came from mouse transcriptome data and ChIP-seq data, which were downloaded from GEO database with accession numbers GSE67462 and GSE67520, respectively. In this paper, gene promoter regions were defined as −1.5 kb to +0.5 kb of gene transcription start sites (TSSs). For quantifying the relationship between gene expression and Oct4 combination intensity, while testing the generalization ability of the proposed model, experimental data were divided into training data and test data.
Training data were related to genes Btbd8, Cnbp, Cyb5r3, Dars2, Eef1a1, Hist1h2bf, Ptrh2, Zfp143, which were extracted based on the following steps.
Step 1. All dynamic Oct4 combination intensity and gene expression data related to genes Btbd8, Cnbp, Cyb5r3, Dars2, Eef1a1, Hist1h2bf, Ptrh2, Zfp143 were extracted from transcriptome and ChIP-seq data (Chen et al., 2016). Oct4 combination intensities were expressed as a series of peaks that contained three characteristics, including height, distance and width, which were defined as the value of the highest point corresponding to the midpoint of the peak (height); distance between the midpoint of the peak and transcription start site (distance); and difference between the right and left boundaries of the peak (width).
Step 2. Transcriptome and ChIP-seq data of the above genes from Day 0, Day 1, Day 3, Day 5, Day 7, Day 11, Day 15, and Day 18 were selected for studying the relation between time and gene expression (Chen et al., 2016).
Step 3. Promoter regions with the strongest signal were extracted to avoid the influence of redundant data.
Testing data were composed of two parts, including data of 27 genes and all genes. Firstly, 27 genes and all genes were applied to analyze quantitative relationship between Oct4 combination intensity and target gene expression at each stage of cell development by our proposed model. Then, 27 genes were divided into high and low expression groups to classify.
In detail, 27 genes were obtained by searching for those data that appeared in all eight different cell development stages from GEO. These genes were Alyref2, Atn1, Btbd8, Btg2, Caprin1, Cnbp, Ctgf, Cyb5r3, Dars2, Ddx5, Eef1a1, Fosb, Hes1, Hist1h2bb, Hist1h2bf, Hist1h2bp, Hnrnpa2b1, Kmt2e, Lonp1, Nfe2l2, Pecr, Phldb2, Ptrh2, Setd5, Trappc6b, Tti2, and Zfp143. In the bi-classification experiment, expression values of 27 genes were sorted by descending order. The top 30% of the sorted data were defined as the high expression group, and the lowest 30% were defined as the low expression group. The value of the minimum high expression was the threshold for classification.
The numbers of all genes at each stage of cell development are shown in Table 1.
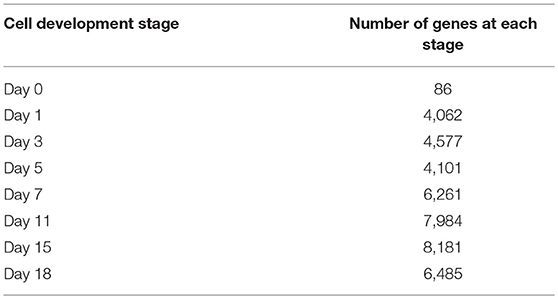
Table 1. Number of genes at each cell development stage.
In Figure 1, relations between height, distance, width, gene expression of Oct4 combination intensity, and time were provided, respectively.
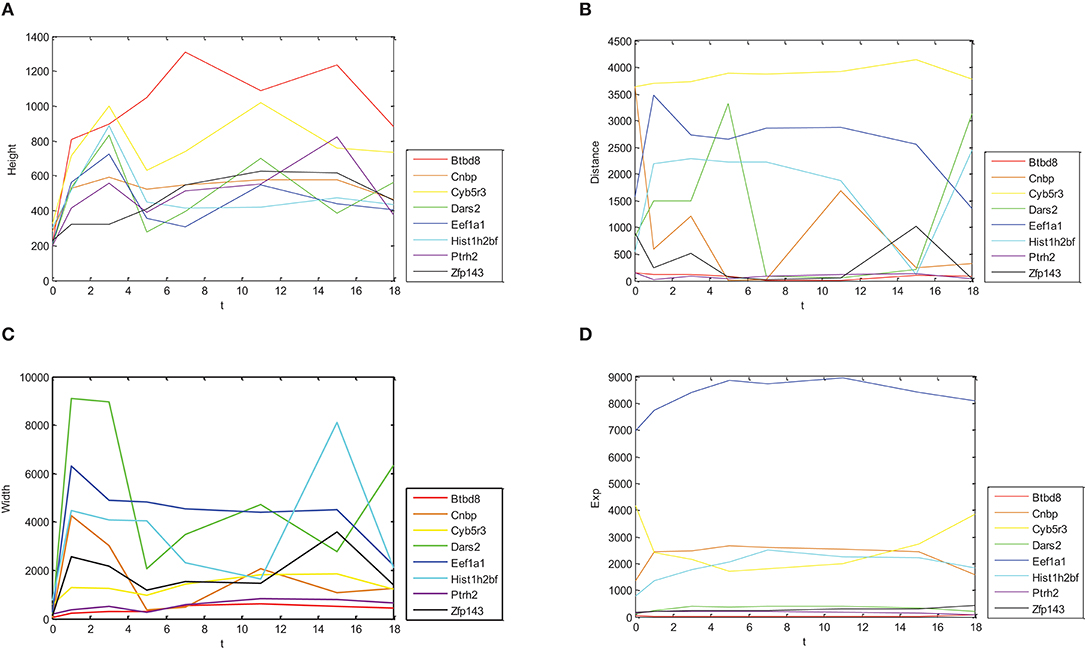
Figure 1. Dynamic change trends for expressions of different genes and their combination intensity. Dynamic change trends of height, distance, width and expression are shown in (A–D), respectively. X axis represents time with 0, 1, 3, 5, 7, 11, 15, and 18 day(s). Y axis represents corresponding values of eight genes.
Figure 1 shows different change trends with time of Oct4 combination intensity in promoter regions and gene expression in the eight proposed genes. Figure 1A illustrates in detail that change trends of height with time were nearly identical in these genes. Similarly, Figure 1C demonstrates that change trends of width with time in these genes were also nearly identical. Figures 1B,D show that change trends of distance and gene expression with time were disorganized.
For quantifying the relationship between gene expressions and Oct4 combination intensity, correlations between height, distance, width, time, and gene expressions were analyzed by using their correlation coefficients, which is defined as Equation (1) with two random variables, X and Y.
In Equation (1), r(X, Y) represents the correlation coefficient between X and Y, cov(X, Y) represents covariance between X and Y, var(X), and var(Y) represent variance of X and Y, respectively.
The correlation coefficients between gene expression and Oct4 combination intensity are shown in Table 2. In addition, correlation coefficients for Oct4 combination intensity and the gene expression, height, distance, width, and time of each gene are provided in Figure 2.
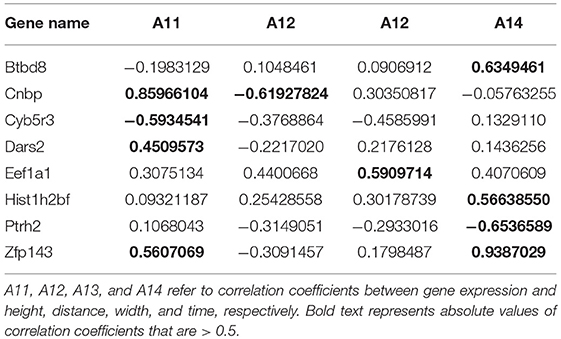
Table 2. Correlation coefficients between gene expression and Oct4 combination intensity for selected genes.
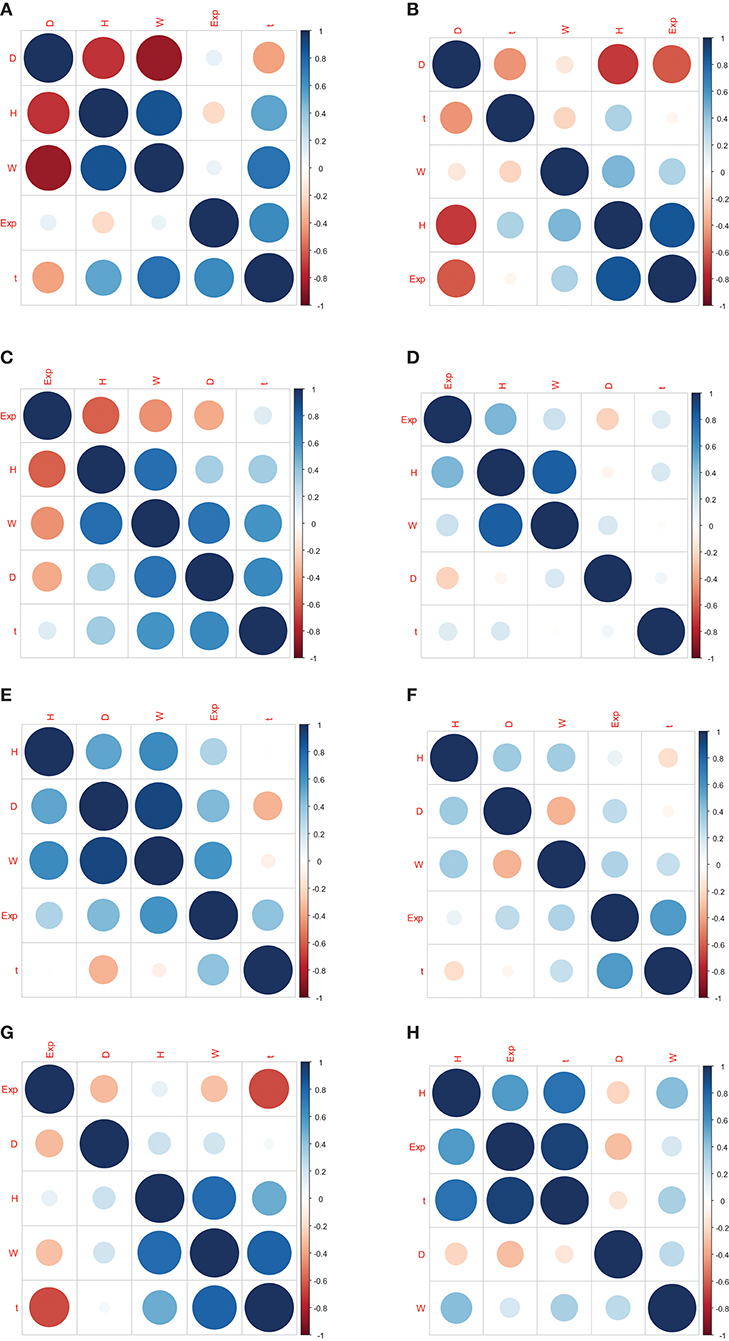
Figure 2. Correlation coefficients for Oct4 combination intensity and the gene expression, height, distance, width, and time of each gene. (A–H) represents the correlation coefficients in genes Btbd8, Cnbp, Cyb5r3, Dars2, Eef1a1, Hist1h2bf, Ptrh2 , Zfp143, respectively.
Table 2 and Figure 2 indicate that the correlation coefficients for gene expression and time were the largest. Correlation coefficients for time and other variables were also strong. However, goodness of fit was low when the predicted model was constructed using height, distance, and width as explanatory variables, and gene expression as explained variable. Due to the strong relationship between time and Oct4 combination intensity, several time-dependent derived combination variables were used as explanatory variables of the proposed model.
Firstly, new derived combination variables were obtained by multiplication operations between height, distance, width and a function of time t, including et, log10(t + 1) and tk (k = 1,2,3). In this way, a set V = {H × t, H × t2, H × t3, H × et, H × 0.5t, H × log10(t + 1), D × t, D × t2, D × t3, D × et, D × 0.5t, D × log10(t + 1), W × t, W × t2, W × t3, W × et, W × 0.5t, W × log10(t + 1)} was constructed as the set of explanation variables, where H denotes height, D denotes distance and W denotes width. Then, stepwise regression method was used to determine explanatory parameters of the proposed regression model. Finally, six explanatory variables were selected from V, including H × et, D × t, D × t2, D × t3, D × 0.5t and W × log10(t + 1).
Therefore, a generalized linear regression model was constructed by using selected explanatory variables, in which gene expression was the explained variable. In this paper, four generalized linear regression models, Models 1–4, were constructed by Equations (2–5).
In Equations (2–5), Exp represents the value of gene expression; β1, β2, β3 are regression coefficients, which are calculated by the Least Squares Method (LSM), and LSM is defined as the sum of squares of differences between predicted value and true value; a random disturbance ε is a normal distribution that was applied to represent other factors affecting gene expression except height, distance and width.
H × et and W × log10(t + 1) were selected in the final model because they were common items in Equations (2–5). Therefore, a general model of gene expression patterns was obtained by Equation (6), and the correctness of the model will be verified in section Analysis of Factors Affecting Gene Expression at Every Stage of Cell Development.
In Equation (6), f(t) represents a function of time t, which was selected from {t, t2, t3, 0.5t}; β1, β2, and β3 are regression coefficients calculated by LSM.
F-test, t-test, and goodness of fit were used to evaluate the performance of linear regression model (Huang and Pan, 2003; Zhou et al., 2003; Xu et al., 2008; Wang and Lee, 2010; Wang et al., 2012). More precisely, F-test was used to test significance of the entire regression model and t-test was used to test significance of regression coefficients in the model. Goodness of fit was used to measure the approximation degree between fitted curve and original data. Meanwhile, , a generation from original coefficient of determination R2, was an adjusted coefficient of determination. It was eliminated the influence of coefficient of determination generated by number of explanatory variables. In this paper, F-test statistic, t-test statistic, adjusted coefficient of determination , original coefficient of determination R2, total sum of squares (TSS), explained sum of squares (ESS), and residuals sum of squares (RSS) are defined as Equations (7–13) (Huang and Pan, 2003; Zhou et al., 2003; Xu et al., 2008; Wang and Lee, 2010; Wang et al., 2012).
In Equations (7–13), k is the number of variables; n is the number of samples; and are estimated value and standard deviation of estimated value of regression coefficient; and Yi, Ŷi, Ȳ represent true, estimated and mean values of explained variable.
Accuracy (Acc), Sensitivity (Sn), specificity (Sp), and Mathew correlation coefficient (Mcc) were used to measure the performance of the classification model (Xu et al., 2013; Guo et al., 2014; Awazu, 2016). Which were defined as Equations (14–17).
In Equations (14–17), TP represents the number of positive samples that are correctly predicted as positive samples; TN represents the number of negative samples that are correctly predicted as negative samples; FP represents the number of negative samples that are incorrectly predicted as positive samples; and FN represents the number of positive samples that are incorrectly predicted as negative samples (Zhang et al., 2014, 2018; Wang et al., 2017, 2018a,b).
Gene expression patterns of the eight selected genes were analyzed by using Models 1–4. More specifically, Model 1 was applied to describe the expression pattern of gene Zfp143, Model 2 was applied to describe the expression pattern of gene Hist1h2bf; Model 3 was applied to describe the expression patterns of genes Dars2 and Eef1a1, and Model4 was applied to describe the expression patterns of genes Btbd8, Cnbp, Cyb5r3, and Ptrh2. Both Model 2 and Model 3 were used to express the expression pattern of gene Eef1a1. Parameter values of the models are shown in Table 3. Parameter values of Model 2 and Model 3 for gene Eef1a1 were shown in Table 4.
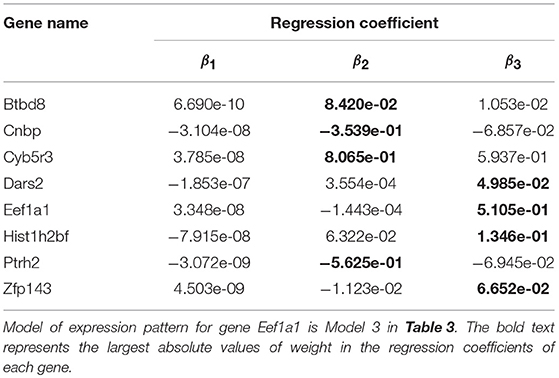
Table 3. Parameter values of model for eight genes.
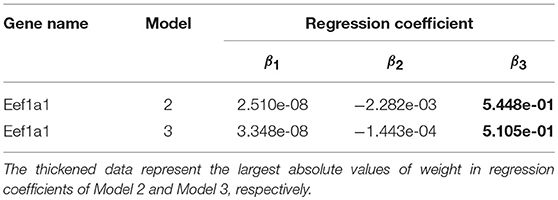
Table 4. Parameter values of model for gene Eef1a1.
Table 3 showed that regression coefficients β2 and β3 were large, which indicated that both distance and width had important influences on gene expression. Furthermore, distance had an effect on gene expression in the form of exponential function of time, and width had an effect on gene expression in the form of logarithmic function of time without other factors. Additionally, Table 4 shows that the difference of the regression coefficients between Model 2 and Model 3 were small. In both Model 2 and Model 3, β3 has the largest absolute values in regression coefficients for gene Eef1a1, which indicated that width was a key factor affecting gene expression.
Goodness of fit for proposed model was calculated to evaluate the performance of these models. In addition, performance of the models was tested by F-test and t-test. Results of goodness of fit, F-test and t-test are shown in Table 5. Results of goodness of fit, F-test and t-test of gene Eef1a1 are shown in Table 6.
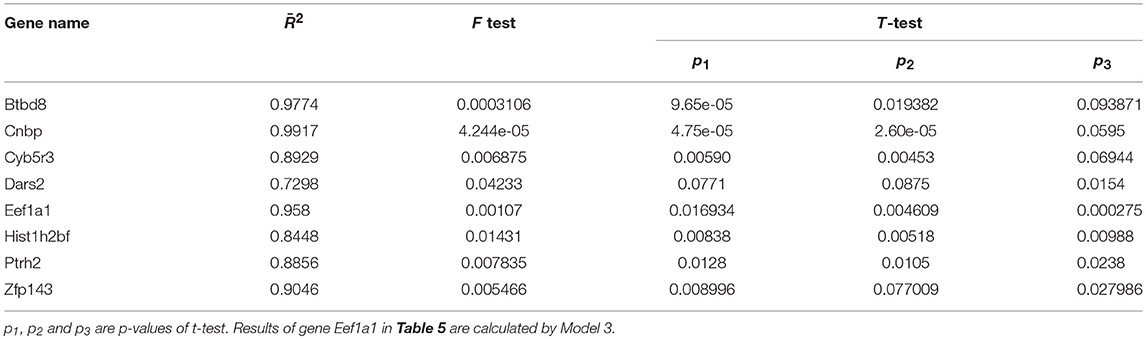
Table 5. Goodness of fit, F-test and t-test for eight genes.
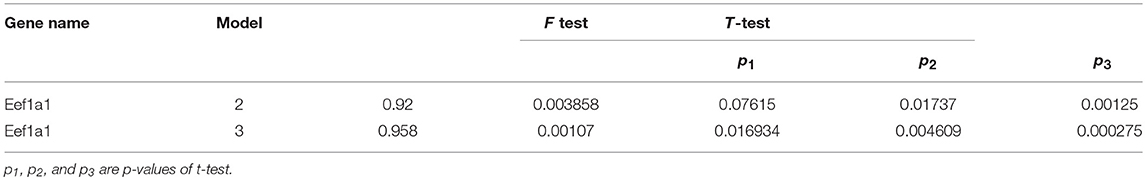
Table 6. Goodness of fit, F-test and t-test for gene Eef1a1.
Table 5 demonstrates that goodness of fit reached at least 80% for all genes except Dars2 by using our proposed method. In addition, the p-value of F-test and t-test were < 0.1, which meant that our proposed model was effective with 90% confidence.
As shown in Table 6, from Model 3 was larger than Model 2, which means that distance had a greater influence on gene expression than time for gene Eef1a1.
As shown in Tables 3–6, absolute values of regression coefficients β2and β3were large in all regression coefficients. Additionally, the absolute value of regression coefficients for β3 was the largest in all regression coefficients with Model 2 and Model 3 for gene Eef1a1. Therefore, width was considered to be the most important factor affecting gene expression, and width had an effect on gene expression in the form of a logarithmic function.
In this paper, the relationship between gene expression and Oct4 combination intensity in promoter regions at the whole-cell developmental stage was analyzed based on the generalized linear regression model. Experimental results showed that the proposed model was effective for gene expression pattern of all eight selected genes except for Eef1a1. For exploring the effects of each model on the different genes, expression data of selected eight genes and Oct4 combination intensity in promoter regions were substituted into the models. Experimental results are shown in Figure 3.
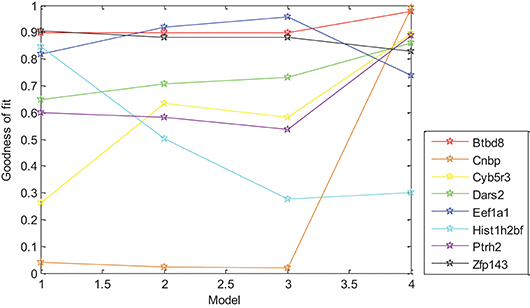
Figure 3. Effect of different models on gene expression patterns. Models 1–4 are represented from 1 to 4 on the x-axis, respectively. The y-axis represents corresponding goodness of fit.
Figure 3 demonstrated that differences in goodness of fit between different models for the same gene were large, which indicated that distance had strong effects on the gene expression of different genes with different levels. Strong correlation between gene expression and D × 0.5t, W × log10(t + 1) was found in Table 3, which indicated that distance had an effect on gene expression in the form of an exponential function of time, and width had an effect on gene expression in the form of a logarithmic function of time without other factors. However, goodness of fit from D × 0.5t and W × log10(t + 1) was lower than for the selected six derived combination variables, which indicated that gene expression was promoted by the interaction of height, distance, width, and time.
Oct4 combination intensity and time had different effects on gene expression in different cell development stages. The goodness of fit obtained by Model 4 was higher than that obtained by Models 1–3 in the prediction of gene expression. Therefore, differences were analyzed based on Model 4 with testing data including 27 genes and all genes. Experimental results are shown in Figures 4, 5.
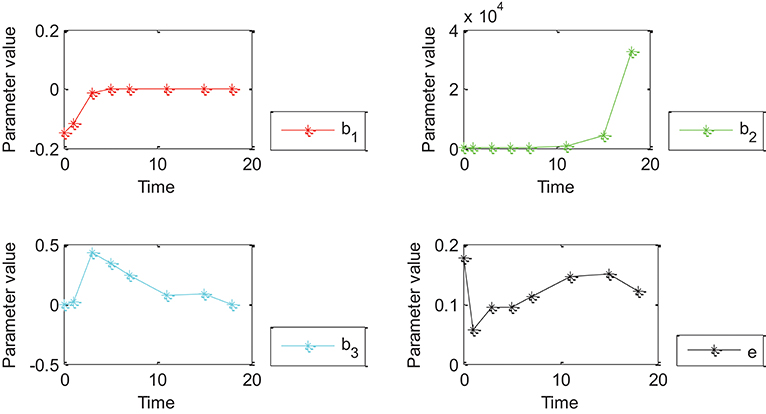
Figure 4. Effects of Oct4 combination intensity and time on gene expression at different stages of cell development for 27 genes. X-axis represents different stages of cell development after 0, 1, 3, 5, 7, 11, 15, and 18 day(s). Y-axis represents parameter value. Curves in red, green, blue, and black represent values of parameters β1, β2, β3 and ε from the proposed generalized linear regression model, respectively.
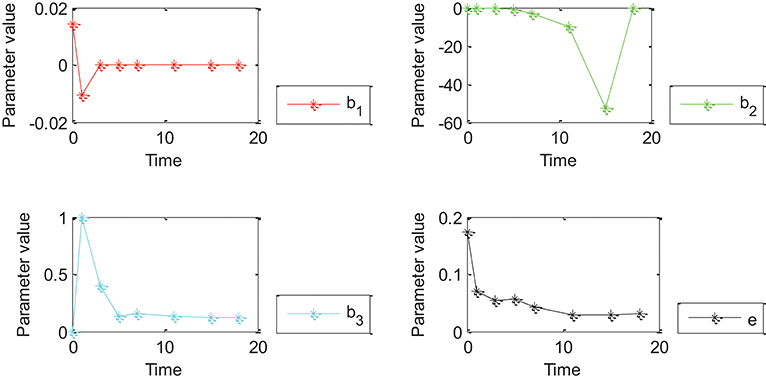
Figure 5. Effects of Oct4 combination intensity and time on gene expression at different stages of cell development for all genes from GEO. X-axis represents different stages of cell development after 0, 1, 3, 5, 7, 11, 15, and 18 days. Y axis represents parameter value. Curve in red, green, blue, and black represents values of parameter β1, β2, β3 and ε of the proposed generalized linear regression model, respectively.
Figures 4, 5 show that the absolute value of β3 was larger than that of β1, β2, and e. Absolute values of β1and β2 were close to zero except for a few points, which indicated that width influenced gene expression in the form of a logarithmic function of time. However, change trends of β1 and β2 were different for Figures 4, 5. More specifically, the absolute value of β1 obtained by 27 genes decreased with time, and the value of was negative when time was equal to 0; the absolute value of obtained by all genes decreased with time and the value of was positive when time was equal to 0; the value of obtained by 27 genes was positive while value of obtained by all genes was negative due to partially missing data, which was contradictory and indicated that time had an important impact on gene expression. Incorrect conclusions were obtained when data of some certain time were missing. Therefore, Figures 4, 5 showed that width and time had important effects on gene expression. Furthermore, width influenced gene expression in the form of a logarithmic function of time.
Gene classification experiments were provided to test the generalization ability of the proposed model. Firstly, in order to avoid the influence of random disturbance on experimental results, the data of 27 genes, including height, distance, width and gene expression, were normalized. Then, Models 1–4 were applied to predict gene expression for 27 genes. Finally, the 27 genes were divided into two categories by comparing gene expression with a threshold; meanwhile, 10-fold cross-validation was used to test the model's performance. Comparison results of Models 1–4 showed Model 4 had a high goodness of fit. Therefore, 27 genes were classified by Model 4.
Gene groups of high and low expression were defined in an artificial way; meanwhile, threshold setting was random in the classification process. A BP neural network was used to classify positive and negative samples in order to prove that the randomness had little effect on experimental results. In this paper, the hidden layer of the BP neural network was set to one layer, and the number of hidden layer neurons was set to 2. In 10-fold cross-validation, regression coefficients and random disturbance of Model 4 were shown in Table 7. The prediction performance obtained by Model 4 and the BP neural network are shown in Table 8.
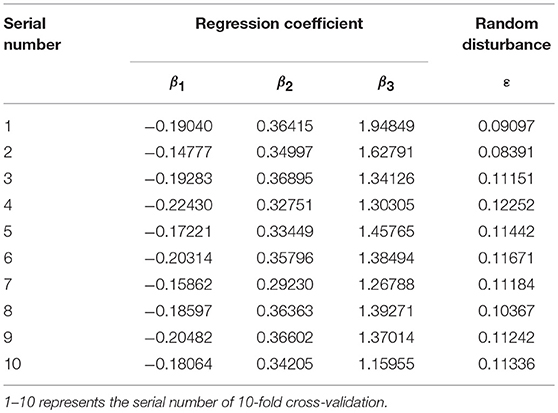
Table 7. Parameter values of Model 4 in 10-fold cross-validation.
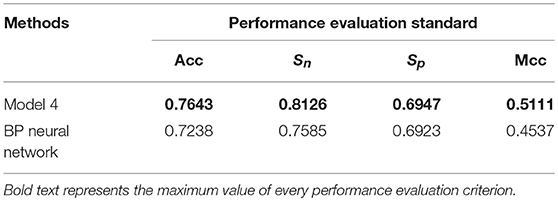
Table 8. Prediction performance of different methods using 10-fold cross-validation.
Table 8 showed that the Acc, Sn, Sp, and Mcc obtained by Model 4 were the largest of the two different methods. Therefore, randomness of the threshold setting had little effect on experimental results, and our proposed method was effective in predicting gene expression.
Cell reprogramming has been a hot issue in the field of life sciences and has played a significant role in medicine, such as in tissue repair, organ reconstruction, disease pathogenesis, and new drug development. Oct4 has especially played an important regulatory role in the process of cell reprogramming. However, there was no scientific method to quantify the relationship between Oct4 combination intensity and gene expression. Therefore, data from the eight selected typical genes were extracted from mouse transcriptome data and ChIP-seq data for quantifying the relationship between gene expression values and Oct4 combination intensity in promoter regions.
Firstly, a generalized linear regression model was constructed based on gene expression with eight different time periods during cell development and Oct4 combination intensity in promoter regions. Then, the relationship between Oct4 combination intensity and gene expression at whole and each stage of cell development was analyzed. Finally, the 27 genes were divided into positive and negative samples based on Model 4 and the BP neural network. Experimental results showed that width of combination influenced gene expression by a logarithmic function of time (day). Additionally, accuracy obtained by the models was 4.05% higher than that obtained by the BP neural network, which indicated that our proposed model was effective in predicting gene expression.
Several additional factors, including extent of histone modification, degree of chromatin opening, strength of promoter and binding sites of transcription factors and promoter regions, also affected gene expression. Non-linear relations between gene expression and Oct4 combination intensity were also ignored due to large non-linear relations. Therefore, in the future, multiple factors and non-linear relations should be considered to analyze key factors affecting gene expression.
SL: design experiment and analyze experiment result; ML: data processing and accomplish experiment; HL: extract and clean data from biological experiment and public database; YZ: provide idea from biological significance.
This research is funded by the National Natural Science Foundation of China project with Grant No. 61502254, No. 61561036, and No. 61702290, the Program for Yong Talents of Science and Technology in Universities of Inner Mongolia Autonomous Region with Grant Nos. NJYT-18-B10 and No. NJYT-18-B01, Open Funds of Key Laboratory of Symbolic Computation and Knowledge Engineering of Ministry of Education with Grant No. 93K172018K07.
The authors declare that the research was conducted in the absence of any commercial or financial relationships that could be construed as a potential conflict of interest.
We want to thank Dr. X. Cheng from Middlesex University (UK) and Prof. Y. Zhang from the University of Leicester (UK) for their efforts on language improvement.
Antão, R., Mota, A., and Machado, J. T. (2018). Kolmogorov complexity as a data similarity metric: application in mitochondrial DNA. Nonlinear Dyn. 2018, 1–13. doi: 10.1007/s11071-018-4245-7
Apostolou, E., and Hochedlinger, K. (2013). Chromatin dynamics during cellular reprogramming. Nature 502, 462–471. doi: 10.1038/nature12749
Awazu, A. (2016). Prediction of nucleosome positioning by the incorporation of frequencies and distributions of three different nucleotide segment lengths into a general pseudo k-tuple nucleotide composition. Bioinformatics 33, 42–48. doi: 10.1093/bioinformatics/btw562
Boyer, L. A., Lee, T. I., Cole, M. F., Johnstone, S. E., Levine, S. S., Zucker, J. P., et al. (2005). Core transcriptional regulatory circuitry in human embryonic stem cells. Cell 122, 947–956. doi: 10.1016/j.cell.2005.08.020
Campbell, K. H., McWhir, J., Ritchie, W. A., and Wilmut, I. (1996). Sheep cloned by nuclear transfer from a cultured cell line. Nature 380, 64–66. doi: 10.1038/380064a0
Chen, J., Chen, X., Li, M., Liu, X., Gao, Y., Kou, X., et al. (2016). Hierarchical Oct4 binding in concert with primed epigenetic rearrangements during somatic cell reprogramming. Cell Rep. 14, 1540–1554. doi: 10.1016/j.celrep.2016.01.013
Chen, J., Liu, H., Liu, J., Qi, J., Wei, B., Yang, J., et al. (2013). H3K9 methylation is a barrier during somatic cell reprogramming into iPSCs. Nat. Genet. 45, 34–42. doi: 10.1038/ng.2491
Chen, R. P., Ingraham, H. A., Treacy, M. N., Albert, V. R., Wilson, L., and Rosenfeld, M. G. (1990). Autoregulation of pit-1 gene expression mediated by two cis-active promoter elements. Nature 346, 583–586. doi: 10.1038/346583a0
Costa, I. G., Roider, H. G., Rego, T. G. D., and de Carvalho Fde, A. (2011). Predicting gene expression in T cell differentiation from histone modifications and transcription factor binding affinities by linear mixture models. BMC Bioinform. 12(Suppl. 1):S29. doi: 10.1186/1471-2105-12-S1-S29
Doege, C. A., Inoue, K., Yamashita, T., Rhee, D. B., Travis, S., Fujita, R., et al. (2012). Early-stage epigenetic modification during somatic cell reprogramming by Parp1 and Tet2. Nature 488, 652–655. doi: 10.1038/nature11333
Duren, Z., Chen, X., Jiang, R., Wang, Y., and Wong, W. H. (2017). Modeling gene regulation from paired expression and chromatin accessibility data. Proc. Natl. Acad. Sci. U.S.A. 114:E4914. doi: 10.1073/pnas.1704553114
Engreitz, J. M., Haines, J. E., Perez, E. M., Munson, G., Chen, J., Kane, M., et al. (2016). Local regulation of gene expression by lncRNA promoters, transcription and splicing. Nature 539, 452–455. doi: 10.1038/nature20149
Guo, S. H., Deng, E. Z., and Xu, L. Q. (2014). iNuc-PseKNC: a sequence-based predictor for predicting nucleosome positioning in genomes with pseudo k-tuple nucleotide composition. Bioinformatics 30, 1522–1529. doi: 10.1093/bioinformatics/btu083
Håkelien, A. M., Landsverk, H. B., Robl, J. M., Skålhegg, B. S., and Collas, P. (2002). Reprogramming fibroblasts to express T-cell functions using cellextracts. Nat. Biotechnol. 20, 460–466. doi: 10.1038/nbt0502-460
Han, H. J., Russo, J., Kohwi, Y., and Kohwishigematsu, T. (2008). SATB1 reprogrammes gene expression to promote breast tumour growth and metastasis. Nature 452, 187–193. doi: 10.1038/nature06781
Hanna, J., Saha, K., Pando, B., von Zon, J., Lengner, C. J., Creyghton, M. P., et al. (2009). Direct cell reprogramming is a stochastic process amenable to acceleration. Nature 462:595. doi: 10.1038/nature08592
Hochedlinger, K., and Jaenisch, R. (2002). Monoclonal mice generated by nuclear transfer from mature B and T donor cells. Nature 415, 1035–1038. doi: 10.1038/nature718
Holoch, D., and Moazed, D. (2015). RNA-mediated epigenetic regulation of gene expression. Nat. Rev. Genet. 16, 71–84. doi: 10.1038/nrg3863
Huang, X., and Pan, W. (2003). Linear regression and two-class classification with gene expression data. Bioinformatics 19, 2072–2078. doi: 10.1093/bioinformatics/btg283
Jeffery, I. B., Madden, S. F., McGettigan, P. A., and Higgins, D. G. (2007). Integrating transcription factor binding site information with gene expression datasets. Bioinformatics 23, 298–305. doi: 10.1093/bioinformatics/btl597
Koga, M., Matsuda, M., Kawamura, T., Sogo, T., Shigeno, A., Nishida, E., et al. (2014). Foxd1 is a mediator and indicator of the cell reprogramming process. Nat. Commun. 5:3197. doi: 10.1038/ncomms4197
Lee, M. T., Bonneau, A. R., Takacs, C. M., Bazzini, A. A., Divito, K. R., Fleming, E. S., et al. (2013). Nanog, Pou5f1 and SoxB1 activate zygotic gene expression during the maternal-to-zygotic transition. Nature 503, 360–364. doi: 10.1038/nature12632
Li, H., Collado, M., Villasante, A., Strati, K., Ortega, S., Ca-amero, M., et al. (2009). The Ink4/Arf locus is a barrier for iPS cell reprogramming. Nature 460:1136. doi: 10.1038/nature08290
Lv, N., Chen, C., Qiu, T., and Sangaiah, A. K. (2018). Deep learning and superpixel feature extraction based on sparse autoencoder for change detection in SAR images. IEEE Trans. Indus. Inform. 14, 5530–5538. doi: 10.1109/TII.2018.2873492
Machado, J. A., Costa, A. C., and Quelhas, M. D. (2011). Wavelet analysis of human DNA. Genomics. 98, 155–163. doi: 10.1016/j.ygeno.2011.05.010
Machado, J. T. (2017). Bond graph and memristor approach to DNA analysis. Nonlinear Dyn. 88, 1051–1057. doi: 10.1007/s11071-016-3294-z
Maienschein-Cline, M., Zhou, J., White, K. P., Sciammas, R., and Dinner, A. R. (2012). Discovering transcription factor regulatory targets using gene expression and binding data. Bioinformatics 28, 206–213. doi: 10.1093/bioinformatics/btr628
McCreath, K. J., Howcroft, J., Campbell, K. H., Colman, A., Schnieke, A. E., and Kind, A. J. (2000). Production of gene-targeted sheep by nuclear transfer from cultured somatic cells. Nature 405, 1066–1069. doi: 10.1038/35016604
Neumann, P., Jaé, N., Knau, A., Glaser, S. F., Fouani, Y., Rossbach, O., et al. (2018). The lncRNA GATA6-AS epigenetically regulates endothelial gene expression via interaction with LOXL2. Nat. Commun. 9:237. doi: 10.1038/s41467-017-02431-1
Park, I. H., Zhao, R., West, J. A., Yabuuchi, A., Huo, H., Ince, T. A., et al. (2008). Reprogramming of human somatic cells to pluripotency with defined factors. Nature 451, 141–146. doi: 10.1038/nature06534
Polejaeva, I. A., Chen, S. H., Vaught, T. D., Page, R. L., Mullins, J., Ball, S., et al. (2000). Cloned pigs produced by nuclear transfer from adult somatic cells. Nature 407:86. doi: 10.1038/35024082
Poli, V., Fagnocchi, L., Fasciani, A., Cherubini, A., Mazzoleni, S., Ferrillo, S., et al. (2018). MYC-driven epigenetic reprogramming favors the onset of tumorigenesis by inducing a stem cell-like state. Nat. Commun. 9:1024. doi: 10.1038/s41467-018-03264-2
Rimsky, L., Dodon, M. D., Dixon, E. P., and Greene, W. C. (1989). Trans -dominant inactivation of HTLV-I and HIV-1 gene expression by mutation of the HTLV-I Rex transactivator. Nature 341, 453–456. doi: 10.1038/341453a0
Singh, R., Lanchantin, J., Robins, G., and Qi, Y. (2016). DeepChrome: deep-learning for predicting gene expression from histone modifications. Bioinformatics 32, i639–i648. doi: 10.1093/bioinformatics/btw427
Stadhouders, R., Vidal, E., Serra, F., Stefano, B. D., Dily, F. L., Quilez, J., et al. (2018). Transcription factors orchestrate dynamic interplay between genome topology and gene regulation during cell reprogramming. Nat. Genet. 50, 238–249. doi: 10.1038/s41588-017-0030-7
Stadtfeld, M., Maherali, N., Breault, D. T., and Hochedlinger, K. (2008). Defining molecular cornerstones during fibroblast to iPS cell reprogramming in mouse. Cell Stem Cell. 2, 230–240. doi: 10.1016/j.stem.2008.02.001
Sullivan, C. S., Grundhoff, A. T., Tevethia, S., Pipas, J. M., and Ganem, D. (2005). SV40-encoded microRNAs regulate viral gene expression and reduce susceptibility to cytotoxic T cells. Nature 435, 682–686. doi: 10.1038/nature03576
Thomou, T., Mori, M. A., Dreyfuss, J. M., Konishi, M., Sakaguchi, M., Wolfrum, C., et al. (2017). Adipose-derived circulating miRNAs Regulate gene expression in other tissues. Nature 542, 450–455. doi: 10.1038/nature21365
Ueda, H. R., Chen, W., Adachi, A., Wakamatsu, H., Hayashi, S., Takasugi, T., et al. (2002). A transcription factor response element for gene expression during circadian night. Nature 418, 534–539. doi: 10.1038/nature00906
Wang, H., Nie, F., Huang, H., Kim, S., Nho, K., Risacher, S. L., et al. (2012). Identifying quantitative trait loci via group-sparse multitask regression and feature selection: an imaging genetics study of the ADNI cohort. Bioinformatics 28, 229–237. doi: 10.1093/bioinformatics/btr649
Wang, J. Y., and Lee, H. S. (2010). Prediction and evolutionary information analysis of protein solvent accessibility using multiple linear regression. Proteins Struct. Funct. Bioinform. 61, 481–491. doi: 10.1002/prot.20620
Wang, S., Rao, R. V., Chen, P., Zhang, Y., Liu, A., and Wei, L. (2017). Abnormal breast detection in mammogram images by feed-forward neural network trained by Jaya algorithm. Fundament. Inform. 151, 191–211. doi: 10.3233/FI-2017-1487
Wang, S. H., Sun, J., Phillips, P., Zhao, G., and Zhang, Y.-D. (2018b). Polarimetric synthetic aperture radar image segmentation by convolutional neural network using graphical processing units. J. Real Time Image Process. 15, 631–642. doi: 10.1007/s11554-017-0717-0
Wang, S. H., Tang, C., Sun, J., Yang, J., Huang, C., Phillips, P., et al. (2018a). Multiple sclerosis identification by 14-layer convolutional neural network with batch normalization, dropout, and stochastic pooling. Front. Neurosci. 12:818. doi: 10.3389/fnins.2018.00818
Wernig, M., Meissner, A., Foreman, R., Brambrink, T., Ku, M., Hochedlinger, K., et al. (2007). In vitro reprogramming of fibroblasts into a pluripotent ES-cell-like state. Nature 448, 318–324. doi: 10.1038/nature05944
Wittkopp, P. J., Haerum, B. K., and Clark, A. G. (2004). Evolutionary changes in cis and trans gene regulation. Nature 430, 85–88. doi: 10.1038/nature02698
Wu, S., Li, K., Li, Y., Zhao, T., Li, T., Yang, Y. F., et al. (2017). Independent regulation of gene expression level and noise by histone modifications. PLoS Comput. Biol. 13:e1005585. doi: 10.1371/journal.pcbi.1005585
Xu, H., Yang, L., and Freitas, M. A. (2008). A robust linear regression based algorithm for automated evaluation of peptide identifications from shotgun proteomics by use of reversed-phase liquid chromatography retention time. BMC Bioinform. 9:347. doi: 10.1186/1471-2105-9-347
Xu, Y., Ding, J., and Wu, L. Y. (2013). iSNO-PseAAC: predict cysteine S-nitrosylation sites in proteins by incorporating position specific amino acid propensity into pseudo amino acid composition. PLoS ONE 8:e55844. doi: 10.1371/journal.pone.0055844
Yan, B., Guan, D., Wang, C., Wang, J., He, B., Qin, J., et al. (2017). An integrative method to decode regulatory logics in gene transcription. Nat. Commun. 8:1044. doi: 10.1038/s41467-017-01193-0
Zardo, G., Cimino, G., and Nervi, C. (2008). Epigenetic plasticity of chromatin in embryonic and hematopoietic stem/progenitor cells: therapeutic potential of cell reprogramming. Leukemia 22, 1503–1518. doi: 10.1038/leu.2008.141
Zhang, Y., Wang, S., Ji, G., and Phillips, P. (2014). Fruit classification using computer vision and feedforward neural network. J. Food Eng. 143, 167–177. doi: 10.1016/j.jfoodeng.2014.07.001
Zhang, Y. D., Pan, C., Sun, J., and Tang, C. (2018). Multiple sclerosis identification by convolutional neural network with dropout and parametric ReLU. J. Comput. Sci. 28, 1–10. doi: 10.1016/j.jocs.2018.07.003
Keywords: cell reprogramming, Oct4, transcription factor binding site (TFBS), combination intensity, generalized linear regression model, gene expression pattern, prediction
Citation: Liu S, Lu M, Li H and Zuo Y (2019) Prediction of Gene Expression Patterns With Generalized Linear Regression Model. Front. Genet. 10:120. doi: 10.3389/fgene.2019.00120
Received: 06 November 2018; Accepted: 04 February 2019;
Published: 04 March 2019.
Edited by:
Arun Kumar Sangaiah, VIT University, IndiaReviewed by:
Yu-Dong Zhang, University of Leicester, United KingdomCopyright © 2019 Liu, Lu, Li and Zuo. This is an open-access article distributed under the terms of the Creative Commons Attribution License (CC BY). The use, distribution or reproduction in other forums is permitted, provided the original author(s) and the copyright owner(s) are credited and that the original publication in this journal is cited, in accordance with accepted academic practice. No use, distribution or reproduction is permitted which does not comply with these terms.
*Correspondence: Shuai Liu, Y3MubGl1LnNodWFpQGdtYWlsLmNvbQ==
Yongchun Zuo, eWN6dW9AaW11LmVkdS5jbg==
Disclaimer: All claims expressed in this article are solely those of the authors and do not necessarily represent those of their affiliated organizations, or those of the publisher, the editors and the reviewers. Any product that may be evaluated in this article or claim that may be made by its manufacturer is not guaranteed or endorsed by the publisher.
Research integrity at Frontiers
Learn more about the work of our research integrity team to safeguard the quality of each article we publish.