Comparative Studies of Gene Expression Kinetics: Methodologies and Insights on Development and Evolution
- Department of Marine Biology, Leon H. Charney School of Marine Sciences, University of Haifa, Haifa, Israel
A Corrigendum on
Comparative Studies of Gene Expression Kinetics: Methodologies and Insights on Development and Evolution
Gildor, T., and Ben-Tabou de-Leon, S. (2018). Front. Genet. 9:339. doi: 10.3389/fgene.2018.00339
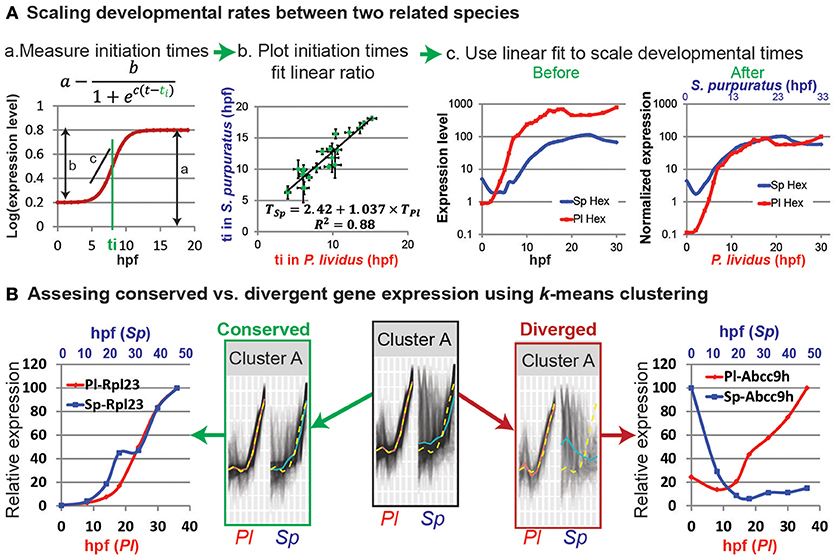
In the original article, there was a mistake in Figure 1 as published. There is a mistake in the formulas in Figures 1Aa,b. The corrected Figure 1 appears below.

Figure 1. Comparative analyses of developmental expression profiles. (A) Scaling gene expression kinetics. (Aa) The initiation time, ti, of each gene in each species can be measured using a sigmoidal fit, here: a = 0.8; b = 0.6; c = 1 and ti = 8 hpf. (Ab) Gene initiation time in one species vs. initiation time in the other species. (Ac) The estimated linear relationship is used to scale the developmental time points in the two species. Kinetic profiles are shown before (left) and after (right) scaling and expression level normalization. (B) k-means clustering of the temporal profiles of homologous genes in P. lividus and S. purpuratus. Genes are clustered according to their expression profiles in P. lividus (cluster A in the middle). Yellow line indicates the cluster centroid in P. lividus; black lines are expression levels of genes in this cluster in P. lividus (left) and their orthologues in S. purpuratus (right); red lines and blue lines are the median of the temporal profiles of the genes in a cluster in P. lividus and in S. purpuratus, respectively. Secondly, the genes in the clusters are separated into conserved vs. diverged (see text). For example, we detect ribosomal genes in the conserved cluster (left) and ABC transporters in the diverged cluster (right).
In the original article, there was an error. There is a mistake in the sigmoid formula, we wrote and the correct formula is:
A correction has been made to the section Scaling developmental rates between related species, Paragraph Number 3:
Most zygotic genes have a clear activation curve that can be well fitted with the following sigmoidal function: (Figure 1Aa; Yanai et al., 2011). Here a is the final expression level, b is the increase in level relative to the basal expression level, c is the slope of the curve, and ti is the initiation time, that is, half-rise time, the time when the expression level is half of the total increase (Figure 1Aa). The initiation times of all measured genes in each species are estimated using this function. The initiation times in one species is then plotted relative to gene initiation times in the other species. In Figure 1Ab we use published measurements of the initiation times of 22 developmental genes in the sea urchins species, Paracentrotus lividus (P. lividus) and Strongylocentrotus purpuratus (S. purpuratus) (Materna et al., 2010; Gildor and Ben-Tabou de-Leon, 2015). These two species diverged from their common ancestor about 40 million years ago and are geographically separated: S. purpuratus occupies the west coasts of the Pacific Ocean and P. lividus occupies the east coasts of the Atlantic Ocean and the Mediterranean Sea. Yet, despite the genetic and geographic distance their embryonic body plan is highly similar. We measured gene initiation times in the two species based on their expression kinetics up to late gastrula stage [30 hpf in P. lividus and 48 hpf in S. purpuratus (Materna et al., 2010; Gildor and Ben-Tabou de-Leon, 2015)]. The trend-line gives the linear relationship between the developmental time in S. purpuratus and P. lividus: TSp = 2.42+1.037 × TPl. Here the constant, 2.42, corresponds to the shift in the maternal to zygotic transition that is about two and a half hours later in S. purpuratus compared to P. lividus. The slope, 1.037, is a little higher than 1, since the developmental rate in S. purpuratus is slower than in P. lividus, possibly due to the lower culture temperature of S. purpuratus [15 vs. 18°, (Gildor and Ben-Tabou de-Leon, 2015)].
The authors apologize for this error and state that this does not change the scientific conclusions of the article in any way. The original article has been updated.
Conflict of Interest Statement
The authors declare that the research was conducted in the absence of any commercial or financial relationships that could be construed as a potential conflict of interest.
References
Gildor, T., and Ben-Tabou de-Leon, S. (2015). Comparative study of regulatory circuits in two sea urchin species reveals tight control of timing and high conservation of expression dynamics. PLoS Genet. 11:e1005435. doi: 10.1371/journal.pgen.1005435
Materna, S. C., Nam, J., and Davidson, E. H. (2010). High accuracy, high-resolution prevalence measurement for the majority of locally expressed regulatory genes in early sea urchin development. Gene Expr. Patterns 10, 177–184. doi: 10.1016/j.gep.2010.04.002
Keywords: comparative developmental biology, developmental robustness and plasticity, development and evolution, gene expression kinetics, scaling & modeling, clustering algorithm
Citation: Gildor T and Ben-Tabou de-Leon S (2018) Corrigendum: Comparative Studies of Gene Expression Kinetics: Methodologies and Insights on Development and Evolution. Front. Genet. 9:631. doi: 10.3389/fgene.2018.00631
Received: 08 November 2018; Accepted: 26 November 2018;
Published: 07 December 2018.
Edited and reviewed by: Frédérique Peronnet, Centre National de la Recherche Scientifique (CNRS), France
Copyright © 2018 Gildor and Ben-Tabou de-Leon. This is an open-access article distributed under the terms of the Creative Commons Attribution License (CC BY). The use, distribution or reproduction in other forums is permitted, provided the original author(s) and the copyright owner(s) are credited and that the original publication in this journal is cited, in accordance with accepted academic practice. No use, distribution or reproduction is permitted which does not comply with these terms.
*Correspondence: Smadar Ben-Tabou de-Leon, c2Jlbi10YWJAdW5pdi5oYWlmYS5hYy5pbA==
 Tsvia Gildor
 Smadar Ben-Tabou de-Leon