 Fu-Ying Dao
 Hao Lv
 Fang Wang
 Hui Ding
- Key Laboratory for Neuro-Information of Ministry of Education, School of Life Science and Technology, Center for Informational Biology, University of Electronic Science and Technology of China, Chengdu, China
The initiate site of DNA replication is called origins of replication (ORI) which is regulated by a set of regulatory proteins and plays important roles in the basic biochemical process during cell growth and division in all living organisms. Therefore, the study of ORIs is essential for understanding the cell-division cycle and gene expression regulation so that scholars can develop a new strategy against genetic diseases by using the knowledge of DNA replication. Thus, the accurate identification of ORIs will provide key clues for DNA replication research and clinical medicine. Although, the conventional experiments could provide accurate results, they are time-consuming and cost ineffective. On the contrary, bioinformatics-based methods can overcome these shortcomings. Especially, with the emergence of DNA sequences in the post-genomic era, it is highly expected to develop high throughput tools to identify ORIs based on sequence information. In this review, we will summarize the current progress in computational prediction of eukaryotic ORIs including the collection of benchmark dataset, the application of machine learning-based techniques, the results obtained by these methods, and the construction of web servers. Finally, we gave the future perspectives on ORIs prediction. The review provided readers with a whole background of ORIs prediction based on machine learning methods, which will be helpful for researchers to study DNA replication in-depth and drug therapy of genetic defect.
Introduction
DNA replication is the most essential process in all living organisms and is the basis for biological inheritance. Two identical replicas of DNA generated from one original DNA molecule in the process. The onset of genomic DNA synthesis requires precise interactions of specialized initiator proteins with DNA at sites where the replication machinery can be loaded. These sites, defined as origins of replication (ORIs) (Macalpine and Bell, 2005; Necsulea et al., 2009; Sequeira-Mendes et al., 2009), regulate the beginning of DNA replication. Thus, they play key roles in DNA replication process.
It is well-known that the replication mechanisms of prokaryotic and eukaryotic genomes are different. Generally, most of the prokaryotes possess a single circular molecule of DNA with only one ORI (Skarstad and Katayama, 2013). Eukaryotes have more complex DNA replication process than the prokaryotes as shown in Figure 1. One linear chromosome of eukaryotic cell has multiple replicating forks. It has been shown that the number of ORIs is as many as 100,000 in a single human cell (Nasheuer et al., 2002). It ensures DNA replication can be completed in the S phase of the cell cycle timely and speeds the duplication of their much larger store of genetic material. The autonomously replicating sequences (ARS), which contains the specific consensus element autonomous consensus sequences (ACSs) of 11-bp, has been widely distributed in Saccharomyces cerevisiae (S. cerevisiae) (Stinchcomb et al., 1979; Theis and Newlon, 1997; Dhar et al., 2012). ACS is the binding site for origin recognition complexes (ORC), the main factor that subsequently serves as a landing platform for the assembly of the other pre-RC proteins. Other elements close to the ACS motif contribute to its activity and provide a modular structure to origins (Figure 1) (Marahrens and Stillman, 1992).
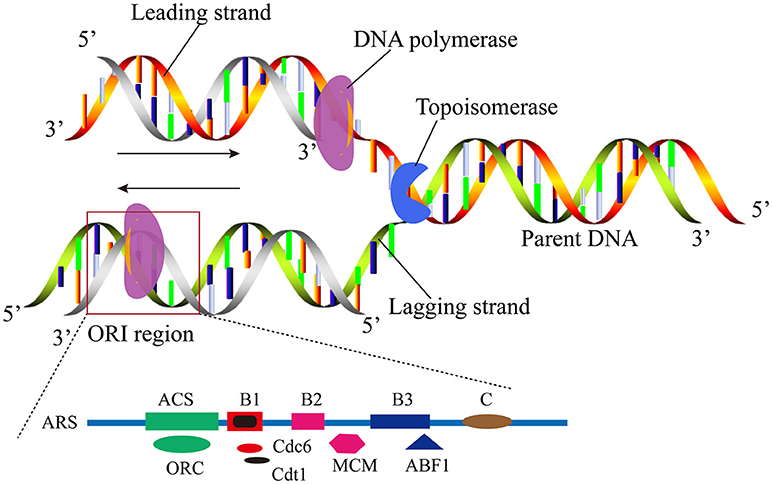
Figure 1. A schematic illustration to show the replication origin in the eukaryote linear DNA molecule. The elements of ORI were found at S. cerevisiae, including the ACS and B elements.
Revealing the DNA replication mechanism could provide important clues to understand the regulatory mechanism of cell division and cell cycle. It can also help the discovery of new drugs for the treatment of various diseases (Mcfadden and Roos, 1999; Soldati, 1999; Raghu Ram et al., 2007). Thus, accurate identification of ORIs is an essential prerequisite for further studying and understanding the DNA replication mechanisms. Chromatin immunoprecipitation (Chip) and the next-generation sequencing technology are popular techniques to determine ORIs, which can precisely identify the ORIs (Metzker, 2009; Lubelsky et al., 2012). However, they are expensive and time-consuming for these experimental approaches to perform genome-wide identification of ORIs.
Recent years, with the accumulation of biological experimental data (Levitsky et al., 2005; Yamashita et al., 2011; Gao et al., 2012), it is possible to predict ORIs by computational approaches. Breier et al. (2004) firstly developed an Oriscan algorithm to identify ORIs of S. cerevisiae. Shah and Krishnamachari (2012) found the nucleotide correlation measure was better than GC skew to accurately delineate the replication origin. Chen et al. (2012) found that the distribution of DNA bendability and cleavage intensity are different between ORI and non-ORI regions and proposed a support vector machine (SVM) based model to identify ORIs in the S. cerevisiae genome. Li et al. (2014) performed a detailed analysis of the compositional bias of S. cerevisiae genome. Subsequently, they developed a predictor called iORI-PseKNC (Li et al., 2015) to identify ORIs in S. cerevisiae genome. Another web server called iROS-gPseKNC was also established to discriminate ORIs from non-ORIs by using random forest (RF) (Xiao et al., 2016). By combining PseKNC with RF classifier, Zhang et al. (2016) developed a predictor called iOri-Human to identify human ORIs. Recently, Singh et al. (2018) used multi-view ensemble learning (MEL) approach to predict ORIs in S. cerevisiae genome. And Liu et al. (2018) developed a new predictor called “iRO-3wPseKNC” to classify four yeast species by rigorous cross-validations.
This review begins with an introduction of benchmark dataset construction for eukaryotic genomes. Then, we outlined machine learning-based techniques that have been applied in ORIs identification successfully and briefly discussed the advantages and limitations of these methods. Next, we analyzed the published prediction results and the published web servers. Finally, future studies on ORI prediction were also discussed.
Benchmark Dataset
Published ORI Databases
With the accumulation of biochemical data and the development of computer, and network, more and more databases were constructed to biological data (Huang et al., 2012; He et al., 2016; Feng et al., 2017; Hou et al., 2017; Liang et al., 2017; The Uniprot, 2018). Some have been specially built to store genome replication origin data (Gao and Zhang, 2007; Nieduszynski et al., 2007; Weddington et al., 2008; Cotterill and Kearsey, 2009; Gao et al., 2012; Cherry, 2015). Here, we will briefly introduce these resources.
OriDB is the most extensively used database for identifying eukaryotic DNA replication, in which each potential replication origin site has one of three confidence levels: confirmed, likely and dubious (Nieduszynski et al., 2007). The replication origin information of two organisms budding yeast (S. cerevisiae) and fission yeast (S. pombe) are stored in the database. Users can access to, search and download ORI data from the database. The database also provides a graphics viewer to allow users to select chromosomal regions and display selected data, which could provide a direct observation and lots of assistance for researchers to study DNA replication.
Another database named DeOri constructed in 2012 which stored eukaryotic ORIs (Gao et al., 2012). A total of 16,145 ORIs were collected from 6 eukaryotic organisms. This database will facilitate the comparative genomic analysis of ORIs, and provide some insight into the nature of ORIs on a genome scale.
In addition to the database described above, there are many other ORI related databases, such as DNAReplication (Cotterill and Kearsey, 2009), Replication Domain (Weddington et al., 2008), and SGD (Cherry, 2015). These databases can be obtained by the URLs in Table 1. And the details of these databases can be referenced the review from Peng et al. (2015).
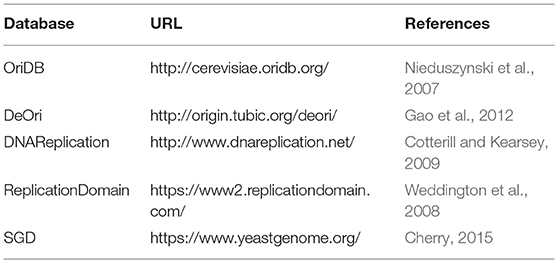
Table 1. A list of published ORI databases.
We found that most of the training datasets of the eukaryotic ORIs recognized researches were structured from database OriDB and only one obtained from DeOri as Table 2 shown. It can be seen that these two databases are reliable and can be used for other studies of ORIs.
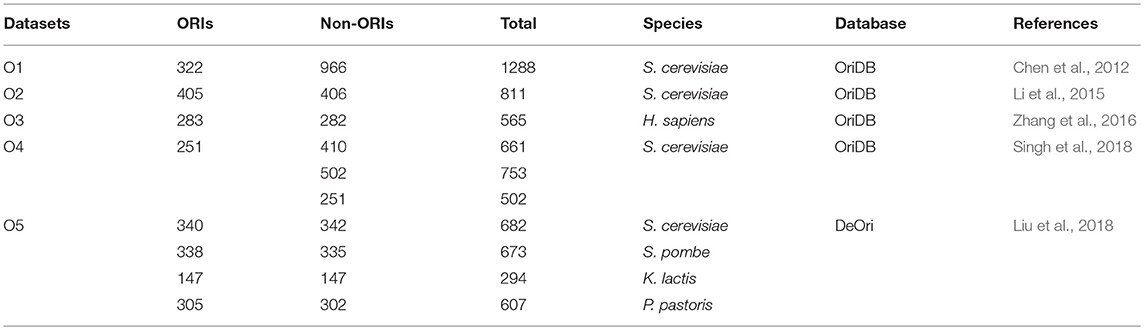
Table 2. The constructed benchmark data sets for predicting ORIs.
The Published Benchmark Datasets
For the purpose of ORIs prediction, it is necessary to construct an objective and strict benchmark dataset which can be handled by machine learning methods. Based on strict steps (Dao et al., 2017), several previous studies have constructed their own benchmark datasets to train and test their proposed prediction models. The details of these datasets were listed in Table 2.
Based on OriDB, the first benchmark dataset of ORIs called O1 was constructed by Chen et al. (2012). The dataset includes 322 ORIs verified by experiment and 966 non-ORIs in the yeast genome. Li et al. (2015) established the second yeast benchmark dataset named O2, which contains 405 experimentally verified ORIs and 406 non-ORIs. In addition, Zhang et al. (2016) built a new dataset called O3 containing 283 human experimentally confirmed ORIs and 282 human non-ORIs sample on the basis of the DeOri. Singh et al. (2018) gained 251 ARS samples of S. cerevisiae from OriDB and generated three negative datasets, respectively. Recently, a dataset (named O5) of four yeast species, including S. cerevisiae, S. pombe, K. lactis, and P. pastoris, was constructed by Liu et al. (2018).
ORI Samples Formulation
It is well-known that machine learning algorithms can only handle vectors but not sequence samples (Liu et al., 2016; Yang et al., 2018b). Thus, we should consider how to formulate the ORI sequence with a vector.
Compositional Analysis Methods
The first method was called GC skew. Since, Lobry (1996) published the computational method to identify ORIs in bacterial genomes in 1996, many scholars have used this method to analyze and identify ORIs (Mclean et al., 1998; Shah and Krishnamachari, 2012; Li et al., 2014; Parikh et al., 2015). For a given ORI sequence, the GC skew can be defined as the following equation.
where fi(G) and fi(C) represent the frequencies of occurrences of Guanine (G) and Cytosine (C) in the i-th sliding window along a sequence, respectively. The range of GC skew score is between −1 and +1. Obviously, when fi(G) < fi(C), the score is a negative value, conversely, it is a positive value. Particularly, the origin of replication is at the position where the GC skew score undergoes an abrupt transition from positive value to negative value.
The GC skew method is the prominent computational measure to predict ORI in the most bacterial genome (Shah and Krishnamachari, 2012). This not only helps to deepen the understanding of advanced biological replication mechanisms, but also contributes to drug discovery. However, this method is not applicable to some bacterial genomes, many archaeal genomes, and almost all eukaryotic genomes (Shah and Krishnamachari, 2012). Moreover, the GC skew is only based on the composition of G and C. Thus, a random sequence displays similar characteristics when it has similar compositions.
The second GC content based method is called GC profile (Li et al., 2014). It is great of importance to acquaint the general compositional features of ORI sequences for understanding the evolution, structure, and function of genomes. For a given ORI sequence, we can obtain the GC profile as Equation (2).
where fi(A), fi(C), fi(G), and fi(T) represent the frequencies of occurrences of Adenine(A), Cytosine(C), Guanine(G), and Thymine(T) in the i-th sliding window along a sequence, respectively. Then, the range of GC profile is between 0 and 1. When the value ranges from 0 to 0.5, the content of GC is lower than that of AT in the windows, conversely, the content of GC is higher than AT content.
GC profile can intuitively give the relationships between the GC content and AT content. A quantitative and qualitative view of genome organization can be easily gained by GC profile. A published tool for studying GC profile can freely available from http://origin.tubic.org/GC-Profile/, which was established by Gao and Zhang (2006). They have provided great convenience for visualizing and analyzing the variation of GC content in genomic sequences.
Correlation Measure
Two kinds of correlation measures were proposed using ORI prediction. One is the auto-correlation measure which can be defined as:
where
where C(k) is the auto-correlation function for a discrete ORI sequence, which was defined in Beauchamp and Yuen (1979) and Cavicchi (2000). There into, aj ∈ {+1, −1} and the range of the value j is between 1 and N. The auto-correlation measure, CG, is the average of all correlation values. The subscript “G” refers to “genome.” The value CG ranges from 0 to 1. Lower value of CG indicates lower correlation strength in that one ORI sequence and vice versa. For a given nucleic acid sequence ATGTCA, it can be converted into a discrete sequence of bits. When the value of A base is +1, the other three positions (G, C, T) are all −1 and that is similar for each position. Therefore, the sequence can be given rise to four different discrete sequences {1,−1,−1,−1,−1,1}, {−1,−1,1, −1,−1,−1}, {−1,−1,−1,−1,1,−1}, and {−1,1,−1,1,−1,−1} corresponding to the four bases A, T, G, C, respectively. Thus, there are four different bit strings and four different values of correlation strength corresponding to each of the four bases. The detailed usage of the method can be referred to references (Shah and Krishnamachari, 2012; Parikh et al., 2015)
The abrupt change of C(k) near ORI is helpful to identify ORIs. This method could take into account the order of the bases. However, it did not define the characteristic signature very well. Thus, the cross-correlation measure was developed to identify ORI. It is defined as:
where
where the value of bj is same as that of aj in above Equation (6), σa = 1 = σb and μa = 1 = μb.
Shah and Krishnamachari (2012) calculated the cross-correlations among A, T and G, C, but they found these values did not give anything meaningful. Therefore, the conclusion can be obtained that a calculation of (A − T)/(A + T) is unable to correctly identify the origin of replication.
DNA Structural Properties
Chen et al. (2012) analyzed DNA bendability and cleavage intensity around ORIs in the S. cerevisiae genome. They found that both DNA bendability and cleavage intensity in core replication regions were significantly lower than those in surrounding regions. Therefore, these two structural properties are of crucial importance in identifying ORIs.
The data of DNA bendability for every trinucleotide in genome was obtained by Brukner et al. (1995), which has also been used in promoter prediction (Abeel et al., 2008; Akan and Deloukas, 2008). Suppose, we calculate the bendability of a sequence CTATG, and its value is 0.406 (0.090[CTA] + 0.182[TAT] + 0.134[ATG]). In a similar way, for a given 300 bp sample sequence, six fragments (300/50) were obtained by using window size of 50 bp with the step of 50 bp. For each fragment, the bendability was calculated. As a result, there are six features for each sample.
Cleavage intensity is the capacity that DNA is unwind by hydroxyl radicals. It can be calculated from parameters for a set of tetra-nucleotide patterns in a given DNA sequence. The parameters of tetra-nucleotides were obtained by experiments (Greenbaum et al., 2007). Subsequently, Bishop et al. (2011) predicted cleavage intensity by ORChID2 algorithm (http://dna.bu.edu/orchid/). Thus, the cleavage intensity of a sequence sample can be calculated by the web tool. By using window size of 50 bp with the step of 50 bp, six features for each sample can be obtained as well.
Pseudo K-Tuple Nucleotide Composition
Stimulating from the concept of pseudo amino acid composition (PseAAC) (Shen and Chou, 2008), the pseudo k-tuple nucleotide composition (PseKNC) was developed to deal with DNA/RNA sequences (Chen et al., 2014, 2018b).
The PseKNC is used to formulate samples for predicting ORIs. For an arbitrary DNA sequence D with L nucleic acid residues formulated as:
where Ri denotes the nucleic acid residue at the i-th position in sample sequence, the sequence can be represented by a 4k+λ dimension vector as follows.
where
where fi is denoted as the normalized frequency of the k-tuple nucleotide composition in a sequence sample. λ reflects the rank of correlation and is a non-negative integer. ω is the weight factor using to adjust the effect of the sequence correlation. θj is the j-tier sequence correlation factor for the sequence, and it can be calculated according to Equations (10)–(12).
where μ is the number of local DNA structural properties in Equation (11). Six types of local structural parameters are more commonly considered, of which three are local translational parameters (shift, slide, and rise) and the other three are local angular parameters (twist, tilt, and roll) (Guo et al., 2014). Pv(RiRi+1) is the numerical value of the v-th physicochemical property for the dinucleotide at i-th position in an ORI or a non-ORI sample. For the consistency of parameters, a standard conversion should be made before using Pv(RiRi+1) in Equation (11). Generally, the Z-score is used to normalize the parameters defined in Equation (12) (Chou and Shen, 2006), in there, the symbol < > means the average value of dinucleotides, and SD denotes the corresponding standard deviation. The website (http://lin-group.cn/pseknc/default.aspx) was used to calculate PseKNC (Chen et al., 2014).
Three-Window-Based PseKNC
A new method combined PseKNC with GC asymmetry information to represent sequence information, which named three-window-based Pseudo k-tuple nucleotide” or “three-window-based PseKNC'. The concrete procedures are as follows. We suppose D denotes a DNA sample, L represents the length of the DNA sequence.
The DNA sequence D is divided into three non-overlapping segments called front window D[1, η], middle window D[η+1, ξ], and rear window D[ξ+1, L] according to two parameters ε and δ. Thereinto, ε represents the percentage of total nucleobases of D in the front window, while 1–δ represents the percentage of total nucleobases of D in the rear window. And η, ξ are defined as below
where Intc means taking the ceiling integer for the number in the brackets right after it.
If each subfragment is represented by k-tuple nucleotide (or k-mers) composition, the DNA sequence will contain 3 × 4k components as following shown
where f1, f2, f3 denote the normalized frequency values of the corresponding k-tuple nucleotides appearing front, middle, and rear window of sample D, respectively. Thus, a sample sequence can be translated into feature vector as
Next, the calculation method of ∅u is referred to Type-I PseKNC (Chen et al., 2014). Here, we will not elaborate on the specific calculation method. More details about the three-window-based PseKNC feature extraction method can refer to the research of Liu et al. (2018).
Prediction Algorithms
Support Vector Machine
Support vector machine (SVM) (Cao et al., 2014) is a supervised machine learning method based on statistical learning theory, which was developed by Cortes and Vapnik (1995). By seeking the minimum structural risk, the generalization ability of SVM can be improved and the risk of experience can be minimized. Good statistical rules can also be achieved on small training sets. Thus, it is one of the most common and effective classifier. Although, the dimension of biological sequence information is generally high, it is not easy to cause over-fitting problem for SVM. Thus, SVM was widely used in bioinformatics (Jensen and Bateman, 2011; Li et al., 2016; Manavalan and Lee, 2017; Manavalan et al., 2017, 2018a,b,c; Song et al., 2018c; Yang et al., 2018a). The detailed descriptions about SVM can be referred to reference (Vapnik and Vladimir, 1997). In order to reduce the programming burden of researchers, the software package LIBSVM (Chang and Lin, 2011) has be developed and can be freely downloaded from https://www.csie.ntu.edu.tw/~cjlin/libsvm/
Singh et al. (2018) used three classification algorithms (KNN, NB, and SVM) to classify ARS sequences based same feature extracting method, where it was found that SVM is the most reliable classifier. Therefore, SVM is suitable machine learning algorithm for identifying ORIs.
Random Forest Algorithm
The Random Forest (RF) algorithm Ho (1995, 1998) is an ensemble learning method for classification and regression. It is also widely used in bioinformatics researches (Zhao et al., 2014). RF integrates multiple trees through the idea of integrated learning. The basic unit is a decision tree. Each decision tree is a classifier from an intuitive point of view. N trees will have N classification results. RF integrates all the classified voting results and specifies the category with the most votes as the final output.
The RF algorithm is flexible and practical. It can handle thousands of input variables without variable deletion and generate an internal unbiased estimate of the generalization error. For estimating missing data and maintains accuracy when a large proportion of the data are missing, the algorithm is still effective.
Commonly-used Evaluation Metrics
Selecting suitable assessment criteria is helpful for correctly and objectively estimating the proposed model's performance (Chou, 2011; Feng et al., 2013a,b; Chen et al., 2018a; Li et al., 2018a,b; Song et al., 2018a,b). Jackknife test can yield a unique result for a given benchmark dataset, thus, it has been widely used to validate predictors' performance (Yang et al., 2016; Chen et al., 2017). The following four parameters, sensitivity (Sn), specificity (Sp), overall accuracy (Acc), and Mathew's correlation coefficient (MCC), are always applied and can be defined as
where TP, FP, TN, and FN, respectively denote the number of true positives, false positives, true negatives, and false negatives.
The receiver operating characteristic (ROC) curve (Metz, 1989) can measure the predictive capability of constructed models across the entire range of algorithms' decision values. It is a visual curve graph that shows the model behavior of the Sn (the ordinate) against the 1-Sp (the abscissa). The area under the ROC (auROC) can objectively assess the performance of a proposed method. auROC = 1 means the model is a perfect classifier, auROC = 0.5 means it is a random predictive classifier.
Published results
ORIs Characteristics
Many statistical analyses Chen et al. (2012) and Li et al. (2014) on ORIs have been made for deeply understanding the replication initiation mechanism.
The physiochemical properties of oligonucleotides play important role in replication regulation by analyzing DNA bendability and cleavage intensity around ORIs in the S. cerevisiae genomes, Chen et al. (2012) found that both DNA bendability and cleavage intensity in core replication regions were significantly lower than those in in both upstream and downstream regions of ORIs. Based on this result, they proposed DNA physiochemical properties based computational model to predict yeast ORIs.
Li et al. (2014) did a lot of analysis on yeast ORIs. Firstly, they analyzed the compositional bias in the S. cerevisiae genome by calculating the GC content surrounding ORIs and found GC content was lower than that of genome-wide. Secondly, they found the scores of GC profile and GC skew in the region of ORIs is significantly lower than that in the flanking regions based on the analysis of the GC profile and GC skew. Thus, they deduced that the replication mechanism of S. cerevisiae genome is similar to that of bacterial genomes. Thirdly, by calculating the information redundancies, they found that ORIs sequence have a very strong short-range dominance of base correlations. Fourthly, they investigated the distribution of ORIs in the genome and obtained several conclusions: ORIs always appear in the nucleosome-free regions; promoters might share elements with ORIs; most ORIs are not biased to transcription start regions. Finally, they compared the prediction performance of the above-mentioned characteristics on ORIs prediction by using SVM and found the nucleosome occupancy feature can much more accurately predict ORIs than GC skew and D2.
ORIs Prediction
Based on the constructed benchmark datasets listed in Table 2, researchers have developed various models for ORIs prediction by using machine learning methods
On the basis of the benchmark dataset O1, Chen et al. (2012) constructed two models which were, respectively based on structure characteristics (DNA bendability and cleavage intensity) and local word contents of k-mer (k = 3, 4) by using SVM. They obtained the conclusion that DNA bendability and cleavage intensity could be of great help to ORI prediction. Moreover, they also found that DNA structure characteristics could provide novel insights into regulatory mechanisms of DNA replication. In their structural feature-based model, overall accuracy of 85.86% was achieved with the auROC of 0.848.
Based on the benchmark dataset O2, Li et al. (2015) encoded the ORI sequences of S. cereviesiae with PseKNC which could reflect the short-range and long-range sequence-order effects of DNA sequence. They incorporated six common local structural properties of 16 dinucleotides into PseKNC, of which three are local translational parameters (shift, slide, and rise) and the other three are local angular parameters (twist, tilt, and roll). As a result, the overall success rate of 83.72% was achieved in the jackknife cross-validation test based on SVM algorithm. Subsequently, a user-friendly web server called iORI-PseKNC was established and could be freely accessible at http://lin-group.cn/server/iOri-PseKNC. They applied the model in yeast genome and found over 8,000 potential ORIs. Later on Xiao et al. (2016), proposed the dinucleotide position-specific propensity information into the general pseudo nucleotide composition for predicting ORIs by using the RF classifier. As a result, the overall success rate reached 98.03%. According to the model, they provided the web server iROS-gPseKNC which could be obtained from http://www.jcibioinfo.cn/iROS-gPseKNC.
Based on the benchmark dataset O3, Zhang et al. (2016) developed a predictor called iOri-Human. They used the same method as Li et al. (2015) to extract features. The RF algorithm was proposed to perform classification. The overall accuracy in identifying human ORIs was over 75% in jackknife cross-validation. Moreover, a user-friendly web server for iOri-Human has been established at http://lin-group.cn/server/iOri-Human.html, by which users can easily get their desired results without the need to go through the complicated mathematics involved.
Based on the benchmark dataset O4, Singh et al. (2018) compared three classification algorithms namely, distance-based k-nearest neighbor (KNN), probabilistic distribution based Naive Bayes (NB) classifier and SVM. They found SVM was a better choice to predict ARS with given properties in all genomic contexts by using the Multi-view ensemble learning model.
Based on the benchmark dataset O5, Liu et al. (2018) established a classification model for ORIs in four yeast species named iRO-3wPseKNC. They employed a different mode PseKNC to extrac features by incorporating the GC asymmetry information into the sample formulation and used the RF algorithm as classification algorithms. According to the jackknife cross-validation, for four yeast species (S. cerevisiae, S. pombe, K. lactis, and P. pastoris), high success prediction rates were obtained, which were 0.730, 0.965, 0.851, and 0.710, respectively. That clearly indicated the proposed their predictor was indeed quite powerful and may become a very useful bioinformatics tool for genome analysis.
Web server is a newly emerging tool in the internet age. It has brought a lot of convenience to the vast majority of biochemical scholars without the need to understand the mathematical details and programming. The difficult mathematics and computational methods can be easily used by means of web servers. Listed in Table 3 are the overviews of the web servers for ORI prediction as described above. As we can see in Table 3, for a given unknown sequence, predictors, iORI-PseKNC, and iOri-Human, can predict a more accurate ORI position by the 300 bp window but homogeneous species. The iRO-3wPseKNC can classify four different species of yeast for a given sequence but predict a whole given sequence with only one result. And the iROS-gPseKNC can't work.
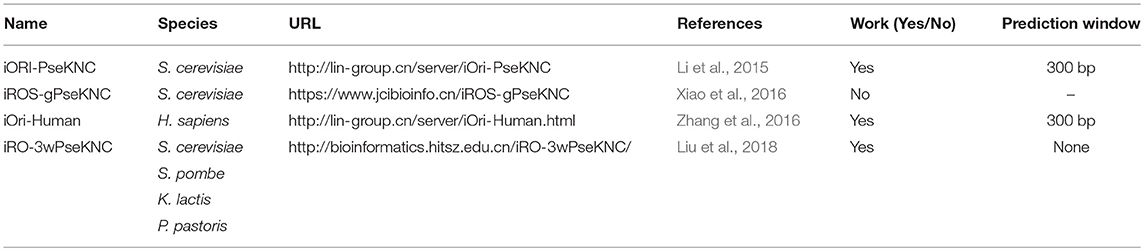
Table 3. A list of the published prediction tools for ORI prediction.
Conclusions and Perspectives
DNA molecule can transfer the genetic information from parent to offspring by replication. Thus, DNA replication plays the one of the most important part of life process at the cellular level. It is fundamentally significant for understanding such vitally important biological process to obtain the knowledge of ORIs. Accurate identification of ORIs will provide crucial clues in revealing DNA replication mechanism and discovering new drugs for treatment of various diseases. The computational tools based on machine learning are especially necessary to acquire these predicting outcomes.
Generally, developing a sequence-based predictor needs to consider the following guidelines (Chou, 2011): (i) benchmark dataset construction; (ii) feature extraction and feature optimization; (iii) classification algorithm comparison and selection; (iv) result evaluation and analysis; (v) web server establishment.
We found that none of these abovementioned publications used feature selection methods to improve prediction accuracy. Feature selection is important in pattern recognition for obtaining key features, excluding redundant information, or noise, improving robust, efficiency, and accuracy of models as well as solving dimension disaster. At present, many feature selection techniques have been proposed to optimize a feature set for producing the maximum accuracy and establishing a robust bioinformatics model, for instance, minimal-redundancy-maximal-relevance (mRMR) (Peng et al., 2005), maximum-relevance-maximum-distance (MRMD) (Zou et al., 2016b), (BD) (Su et al., 2018), F-score (Lin et al., 2014), and the analysis of variance (ANOVA) (Tang et al., 2018).
minimal-redundancy-maximal-relevance is a kind of filtering feature method proposed by Peng et al. (2005). The core idea of mRMR is to maximize the correlation between features and categorical labels and at same time to minimize the correlation between features and features. It runs fast and can always produce robust models. MRMD is similar to mRMR but can scan the ranking features for a best dimension. It was widely used in bioinformatics recently (Zou et al., 2016a; Wei et al., 2018c). BD-based feature selection technique has strict and objective statistical foundation for extracting the over-represent motifs in sample sequences (Feng et al., 2018; Su et al., 2018; Zhu et al., 2018). Thus, it is also widely applied for sequence analysis (Feng and Luo, 2008; Lai et al., 2017). F-score, a simple feature selection method is usually used to measure the degree of difference between two real number sets (Lin et al., 2014, 2017). This method could achieve the most effective feature selection with strict mathematical definition. The basic idea of ANOVA is to compare the difference between the variance among groups and the variance within the group under different levels of influence, and then to determine differential expressed features (Chen et al., 2016).
In bioinformatics prediction, a key role for obtaining a highly accurate model is to use valid mathematical descriptors to formulate samples. The Type-II PseKNC is a different kind PseKNC which could reflect the correlation effect for different kind of physiochemical properties (Chen et al., 2014). Thus, it is better than Type-I PseKNC for describing ORI samples. However, it has not been used in all the published references for predicting ORI. In the future, we will try to use the Type-II PseKNC method combined with feature selection techniques to build a powerful and robust prediction model for predicting ORIs.
In summary, although a great progress for ORIs prediction has been obtained, further improvements should be made from the following points. Firstly, most of works focused on the ORIs prediction in bacteria, yeast and human genomes. Thus, we should try our best to construct more models for the prediction of ORIs in other species genomes. Secondly, with more and more accumulation of biochemical data, some old benchmark datasets should be updated constantly to acquire much more reliable samples. Thirdly, appropriate feature selection methods should be employed to reduce feature vector dimensions and improve the prediction accuracy. Fourth, try more machine learning methods to build classification models, such as deep learning (Cao et al., 2016, 2017; Long et al., 2017; Shao et al., 2018; Wei et al., 2018a,b; Yu et al., 2018; Zhang et al., 2018).
Author Contributions
HD conceived and designed the experiments. F-YD, HL, and FW analyzed the data and reviewed the references. F-YD, HL, FW, and HD performed the analysis and wrote the paper. All authors read and approved the final manuscript.
Conflict of Interest Statement
The authors declare that the research was conducted in the absence of any commercial or financial relationships that could be construed as a potential conflict of interest.
Acknowledgments
This work was supported by the National Nature Scientific Foundation of China (61772119, 31771471), the Fundamental Research Funds for the Central Universities of China (Nos. ZYGX2015Z006, ZYGX2016J125, ZYGX2016J118), Natural Science Foundation for Distinguished Young Scholar of Hebei Province (No. C2017209244), the Program for the Top Young Innovative Talents of Higher Learning Institutions of Hebei Province (No. BJ2014028).
References
Abeel, T., Saeys, Y., Bonnet, E., Rouze, P., and Van De Peer, Y. (2008). Generic eukaryotic core promoter prediction using structural features of DNA. Genome Res. 18, 310–323. doi: 10.1101/gr.6991408
Akan, P., and Deloukas, P. (2008). DNA sequence and structural properties as predictors of human and mouse promoters. Gene 410, 165–176. doi: 10.1016/j.gene.2007.12.011
Beauchamp, K. G., and Yuen, C. K. (1979). Digital Methods for Signal Analysis. New York, NY: Routledge.
Bishop, E. P., Rohs, R., Parker, S. C., West, S. M., Liu, P., Mann, R. S., et al. (2011). A map of minor groove shape and electrostatic potential from hydroxyl radical cleavage patterns of DNA. ACS Chem. Biol. 6, 1314–1320. doi: 10.1021/cb200155t
Breier, A. M., Chatterji, S., and Cozzarelli, N. R. (2004). Prediction of Saccharomyces cerevisiae replication origins. Genome Biol. 5, 1–14. doi: 10.1186/gb-2004-5-4-r22
Brukner, I., Sanchez, R., Suck, D., and Pongor, S. (1995). Sequence-dependent bending propensity of DNA as revealed by DNase I: parameters for trinucleotides. EMBO J. 14, 1812–1818. doi: 10.1002/j.1460-2075.1995.tb07169.x
Cao, R., Freitas, C., Chan, L., Sun, M., Jiang, H., and Chen, Z. (2017). ProLanGO: protein function prediction using neural machine translation based on a recurrent neural network. Molecules 22:1732. doi: 10.3390/molecules22101732
Cao, R., Wang, Z., Wang, Y., and Cheng, J. (2014). SMOQ: a tool for predicting the absolute residue-specific quality of a single protein model with support vector machines. BMC Bioinformatics 15:120. doi: 10.1186/1471-2105-15-120
Cao, R. Z., Bhattacharya, D., Hou, J., and Cheng, J. L. (2016). DeepQA: improving the estimation of single protein model quality with deep belief networks. BMC Bioinformatics 17:495. doi: 10.1186/s12859-016-1405-y
Chang, C. C., and Lin, C. J. (2011). LIBSVM: A Library For Support Vector Machines. New York, NY: ACM Transactions on Intelligent Systems and Technology.
Chen, W., Ding, H., Zhou, X., Lin, H., and Chou, K. C. (2018b). iRNA(m6A)-PseDNC: Identifing N6-methyladenosine sites using pseudo dinucleotide composition. Anal. Biochem. 561–562: 59–65. doi: 10.1016/j.ab.2018.09.002
Chen, W., Feng, P., and Lin, H. (2012). Prediction of replication origins by calculating DNA structural properties. FEBS Lett. 586, 934–938. doi: 10.1016/j.febslet.2012.02.034
Chen, W., Lei, T. Y., Jin, D. C., Lin, H., and Chou, K. C. (2014). PseKNC: a flexible web server for generating pseudo K-tuple nucleotide composition. Anal. Biochem. 456:53–60. doi: 10.1016/j.ab.2014.04.001
Chen, W., Yang, H., Feng, P., Ding, H., and Lin, H. (2017). iDNA4mC: identifying DNA N4-methylcytosine sites based on nucleotide chemical properties. Bioinformatics 33, 3518–3523. doi: 10.1093/bioinformatics/btx479
Chen, X. X., Tang, H., Li, W. C., Wu, H., Chen, W., Ding, H., et al. (2016). Identification of bacterial cell wall lyases via pseudo amino acid composition. Biomed. Res. Int. 2016:1654623. doi: 10.1155/2016/1654623
Chen, Z., Liu, X., Li, F., Li, C., Marquez-Lago, T., Leier, A., et al. (2018a). Large-scale comparative assessment of computational predictors for lysine post-translational modification sites. Brief. Bioinformatics. doi: 10.1093/bib/bby089. [Epub ahead of print].
Cherry, J. M. (2015). The saccharomyces genome database: a tool for discovery. Cold Spring Harb. Protoc. 2015:pdb top083840. doi: 10.1101/pdb.top083840
Chou, K. C. (2011). Some remarks on protein attribute prediction and pseudo amino acid composition. J. Theor. Biol. 273, 236–247. doi: 10.1016/j.jtbi.2010.12.024
Chou, K. C., and Shen, H. B. (2006). Predicting eukaryotic protein subcellular location by fusing optimized evidence-theoretic K-Nearest Neighbor classifiers. J. Proteome Res. 5, 1888–1897. doi: 10.1021/pr060167c
Cortes, C., and Vapnik, V. (1995). Support-vector networks. Mach. Learn. 20, 273–297. doi: 10.1007/BF00994018
Cotterill, S., and Kearsey, S. E. (2009). DNAReplication: a database of information and resources for the eukaryotic DNA replication community. Nucleic Acids Res. 37, D837–D839. doi: 10.1093/nar/gkn726
Dao, F. Y., Yang, H., Su, Z. D., Yang, W., Wu, Y., Hui, D., et al. (2017). Recent advances in conotoxin classification by using machine learning methods. Molecules 22:1057. doi: 10.3390/molecules22071057
Dhar, M. K., Sehgal, S., and Kaul, S. (2012). Structure, replication efficiency and fragility of yeast ARS elements. Res. Microbiol. 163, 243–253. doi: 10.1016/j.resmic.2012.03.003
Feng, C. Q., Zhang, Z. Y., Zhu, X. J., Lin, Y., Chen, W., Tang, H., et al. (2018). iTerm-PseKNC: a sequence-based tool for predicting bacterial transcriptional terminators. Bioinformatics. doi: 10.1093/bioinformatics/bty827. [Epub ahead of print].
Feng, P., Ding, H., Lin, H., and Chen, W. (2017). AOD: the antioxidant protein database. Sci. Rep. 7:7449. doi: 10.1038/s41598-017-08115-6
Feng, P. M., Ding, H., Chen, W., and Lin, H. (2013a). Naive Bayes classifier with feature selection to identify phage virion proteins. Comput. Math. Methods Med. 2013:530696. doi: 10.1155/2013/530696
Feng, P. M., Lin, H., and Chen, W. (2013b). Identification of antioxidants from sequence information using naive Bayes. Comput. Math. Methods Med. 2013:567529. doi: 10.1155/2013/567529
Feng, Y., and Luo, L. (2008). Use of tetrapeptide signals for protein secondary-structure prediction. Amino Acids 35, 607–614. doi: 10.1007/s00726-008-0089-7
Gao, F., Luo, H., and Zhang, C. T. (2012). DeOri: a database of eukaryotic DNA replication origins. Bioinformatics 28, 1551–1552. doi: 10.1093/bioinformatics/bts151
Gao, F., and Zhang, C. T. (2006). GC-Profile: a web-based tool for visualizing and analyzing the variation of GC content in genomic sequences. Nucleic Acids Res. 34, W686–W691. doi: 10.1093/nar/gkl040
Gao, F., and Zhang, C. T. (2007). DoriC: a database of oriC regions in bacterial genomes. Bioinformatics 23, 1866–1867. doi: 10.1093/bioinformatics/btm255
Greenbaum, J. A., Pang, B., and Tullius, T. D. (2007). Construction of a genome-scale structural map at single-nucleotide resolution. Genome Res. 17, 947–953. doi: 10.1101/gr.6073107
Guo, S. H., Deng, E. Z., Xu, L. Q., Ding, H., Lin, H., Chen, W., et al. (2014). iNuc-PseKNC: a sequence-based predictor for predicting nucleosome positioning in genomes with pseudo k-tuple nucleotide composition. Bioinformatics 30, 1522–1529. doi: 10.1093/bioinformatics/btu083
He, B., Chai, G., Duan, Y., Yan, Z., Qiu, L., Zhang, H., et al. (2016). BDB: biopanning data bank. Nucleic Acids Res. 44, D1127–D1132. doi: 10.1093/nar/gkv1100
Ho, T. K. (1995). “Random decision forests,” in Proceedings of 3rd International Conference on Document Analysis and Recognition (Montreal), 278–282.
Ho, T. K. (1998). The random subspace method for constructing decision forests. IEEE Trans. Pattern Anal. Mach. Intell. 20, 832–844.
Hou, Q. L., Luo, J. X., Zhang, B. C., Jiang, G. F., Ding, W., and Zhang, Y. Q. (2017). 3D-QSAR and molecular docking studies on the TcPMCA1-mediated detoxification of scopoletin and coumarin derivatives. Int. J. Mol. Sci. 18:1380. doi: 10.3390/ijms18071380
Huang, J., Ru, B., Zhu, P., Nie, F., Yang, J., Wang, X., et al. (2012). MimoDB 2.0: a mimotope database and beyond. Nucleic Acids Res. 40, D271–277. doi: 10.1093/nar/gkr922
Jensen, L. J., and Bateman, A. (2011). The rise and fall of supervised machine learning techniques. Bioinformatics 27, 3331–3332. doi: 10.1093/bioinformatics/btr585
Lai, H. Y., Chen, X. X., Chen, W., Tang, H., and Lin, H. (2017). Sequence-based predictive modeling to identify cancerlectins. Oncotarget 8, 28169–28175. doi: 10.18632/oncotarget.15963
Levitsky, V. G., Katokhin, A. V., Podkolodnaya, O. A., Furman, D. P., and Kolchanov, N. A. (2005). NPRD: nucleosome positioning region database. Nucleic Acids Res. 33, D67–70. doi: 10.1093/nar/gki049
Li, D. P., Ju, Y., and Zou, Q. (2016). Protein folds prediction with hierarchical structured SVM. Curr. Proteomics 13, 79–85. doi: 10.2174/157016461302160514000940
Li, F., Li, C., Marquez-Lago, T. T., Leier, A., Akutsu, T., Purcell, A. W., et al. (2018a). Quokka: a comprehensive tool for rapid and accurate prediction of kinase family-specific phosphorylation sites in the human proteome. Bioinformatics. doi: 10.1093/bioinformatics/bty522. [Epub ahead of print].
Li, F., Wang, Y., Li, C., Marquez-Lago, T. T., Leier, A., Rawlings, N. D., et al. (2018b). Twenty years of bioinformatics research for protease-specific substrate and cleavage site prediction: a comprehensive revisit and benchmarking of existing methods. Brief. Bioinformatics. doi: 10.1093/bib/bby077. [Epub ahead of print].
Li, W. C., Deng, E. Z., Ding, H., Chen, W., and Lin, H. (2015). iORI-PseKNC: A predictor for identifying origin of replication with pseudo k -tuple nucleotide composition. Chemo. Intell. Lab. Syst. 141, 100–106. doi: 10.1016/j.chemolab.2014.12.011
Li, W. C., Zhong, Z. J., Zhu, P. P., Deng, E. Z., Ding, H., Chen, W., et al. (2014). Sequence analysis of origins of replication in the Saccharomyces cerevisiae genomes. Front. Microbiol. 5:574. doi: 10.3389/fmicb.2014.00574
Liang, Z. Y., Lai, H. Y., Yang, H., Zhang, C. J., Yang, H., Wei, H. H., et al. (2017). Pro54DB: a database for experimentally verified sigma-54 promoters. Bioinformatics 33, 467–469. doi: 10.1093/bioinformatics/btw630
Lin, H., Deng, E. Z., Ding, H., Chen, W., and Chou, K. C. (2014). iPro54-PseKNC: a sequence-based predictor for identifying sigma-54 promoters in prokaryote with pseudo k-tuple nucleotide composition. Nucleic Acids Res. 42, 12961–12972. doi: 10.1093/nar/gku1019
Lin, H., Liang, Z. Y., Tang, H., and Chen, W. (2017). Identifying sigma70 promoters with novel pseudo nucleotide composition. IEEE. ACM Trans. Comput. Biol. Bioinform. doi: 10.1109/TCBB.2017.2666141. [Epub ahead of print].
Liu, B., Liu, F., Fang, L., Wang, X., and Chou, K. C. (2016). RepRNA: a web server for generating various feature vectors of RNA sequences. Mol. Genet. Genomics 291, 473–481. doi: 10.1007/s00438-015-1078-7
Liu, B., Weng, F., Huang, D. S., and Chou, K. C. (2018). iRO-3wPseKNC: Identify DNA replication origins by three-window-based PseKNC. Bioinformatics 34, 3086–3089. doi: 10.1093/bioinformatics/bty312
Lobry, J. R. (1996). Asymmetric substitution patterns in the two DNA strands of bacteria. Mol. Biol. Evol. 13, 660–665. doi: 10.1093/oxfordjournals.molbev.a025626
Long, H. X., Wang, M., and Fu, H. Y. (2017). Deep convolutional neural networks for predicting hydroxyproline in proteins. Curr. Bioinform. 12, 233–238. doi: 10.2174/1574893612666170221152848
Lubelsky, Y., Macalpine, H. K., and Macalpine, D. M. (2012). Genome-wide localization of replication factors. Methods 57, 187–195. doi: 10.1016/j.ymeth.2012.03.022
Macalpine, D. M., and Bell, S. P. (2005). A genomic view of eukaryotic DNA replication. Chromosome Res. 13, 309–326. doi: 10.1007/s10577-005-1508-1
Manavalan, B., Basith, S., Shin, T. H., Choi, S., Kim, M. O., and Lee, G. (2017). MLACP: machine-learning-based prediction of anticancer peptides. Oncotarget 8, 77121–77136. doi: 10.18632/oncotarget.20365
Manavalan, B., and Lee, J. (2017). SVMQA: support-vector-machine-based protein single-model quality assessment. Bioinformatics 33, 2496–2503. doi: 10.1093/bioinformatics/btx222
Manavalan, B., Shin, T. H., and Lee, G. (2018a). DHSpred: support-vector-machine-based human DNase I hypersensitive sites prediction using the optimal features selected by random forest. Oncotarget 9, 1944–1956. doi: 10.18632/oncotarget.23099
Manavalan, B., Shin, T. H., and Lee, G. (2018b). PVP-SVM: sequence-based prediction of phage virion proteins using a support vector machine. Front. Microbiol. 9:476. doi: 10.3389/fmicb.2018.00476
Manavalan, B., Subramaniyam, S., Shin, T. H., Kim, M. O., and Lee, G. (2018c). Machine-learning-based prediction of cell-penetrating peptides and their uptake efficiency with improved accuracy. J. Proteome Res. 17, 2715–2726. doi: 10.1021/acs.jproteome.8b00148
Marahrens, Y., and Stillman, B. (1992). A yeast chromosomal origin of DNA replication defined by multiple functional elements. Science 255, 817–823. doi: 10.1126/science.1536007
Mcfadden, G. I., and Roos, D. S. (1999). Apicomplexan plastids as drug targets. Trends Microbiol. 7, 328–333. doi: 10.1016/S0966-842X(99)01547-4
Mclean, M. J., Wolfe, K. H., and Devine, K. M. (1998). Base composition skews, replication orientation, and gene orientation in 12 prokaryote genomes. J. Mol. Evol. 47, 691–696. doi: 10.1007/PL00006428
Metz, C. E. (1989). Some practical issues of experimental design and data analysis in radiological ROC studies. Invest. Radiol. 24, 234–245. doi: 10.1097/00004424-198903000-00012
Metzker, M. L. (2009). Sequencing technologies — the next generation. Nat. Rev. Genet. 11:31. doi: 10.1038/nrg2626
Nasheuer, H. P., Smith, R., Bauerschmidt, C., Grosse, F., and Weisshart, K. (2002). Initiation of eukaryotic DNA replication: regulation and mechanisms. Prog. Nucleic Acid Res. Mol. Biol. 72, 41–94. doi: 10.1016/S0079-6603(02)72067-9
Necsulea, A., Guillet, C., Cadoret, J. C., Prioleau, M. N., and Duret, L. (2009). The relationship between DNA replication and human genome organization. Mol. Biol. Evol. 26, 729–741. doi: 10.1093/molbev/msn303
Nieduszynski, C. A., Hiraga, S., Ak, P., Benham, C. J., and Donaldson, A. D. (2007). OriDB: a DNA replication origin database. Nucleic Acids Res. 35, D40–46. doi: 10.1093/nar/gkl758
Parikh, H., Singh, A., Krishnamachari, A., and Shah, K. (2015). Computational prediction of origin of replication in bacterial genomes using correlated entropy measure (CEM). BioSystems. 128, 19–25. doi: 10.1016/j.biosystems.2015.01.001
Peng, C., Luo, H., Zhang, X., and Gao, F. (2015). Recent advances in the genome-wide study of DNA replication origins in yeast. Front. Microbiol. 6:117. doi: 10.3389/fmicb.2015.00117
Peng, H., Long, F., and Ding, C. (2005). Feature selection based on mutual information: criteria of max-dependency, max-relevance, and min-redundancy. IEEE Trans. Pattern Anal. Mach. Intell. 27, 1226–1238. doi: 10.1109/TPAMI.2005.159
Raghu Ram, E. V., Kumar, A., Biswas, S., Kumar, A., Chaubey, S., Siddiqi, M. I., et al. (2007). Nuclear gyrB encodes a functional subunit of the Plasmodium falciparum gyrase that is involved in apicoplast DNA replication. Mol. Biochem. Parasitol. 154, 30–39. doi: 10.1016/j.molbiopara.2007.04.001
Sequeira-Mendes, J., Diaz-Uriarte, R., Apedaile, A., Huntley, D., Brockdorff, N., and Gomez, M. (2009). Transcription initiation activity sets replication origin efficiency in mammalian cells. PLoS Genet. 5:e1000446. doi: 10.1371/journal.pgen.1000446
Shah, K., and Krishnamachari, A. (2012). Nucleotide correlation based measure for identifying origin of replication in genomic sequences. BioSystems. 107, 52–55. doi: 10.1016/j.biosystems.2011.09.003
Shao, L., Gao, H., Liu, Z., Feng, J., Tang, L., and Lin, H. (2018). Identification of antioxidant proteins with deep learning from sequence information. Front. Pharmacol. 9:1036. doi: 10.3389/fphar.2018.01036
Shen, H. B., and Chou, K. C. (2008). PseAAC: a flexible web server for generating various kinds of protein pseudo amino acid composition. Anal. Biochem. 373, 386–388. doi: 10.1016/j.ab.2007.10.012
Singh, V. K., Kumar, V., and Krishnamachari, A. (2018). Prediction of replication sites in Saccharomyces cerevisiae genome using DNA segment properties: Multi-view ensemble learning (MEL) approach. BioSystems. 163, 59–69. doi: 10.1016/j.biosystems.2017.12.005
Skarstad, K., and Katayama, T. (2013). Regulating DNA replication in bacteria. Cold Spring Harb. Perspect. Biol. 5:a012922. doi: 10.1101/cshperspect.a012922
Soldati, D. (1999). The apicoplast as a potential therapeutic target in and other apicomplexan parasites. Parasitol. Today. 15, 5–7. doi: 10.1016/S0169-4758(98)01363-5
Song, J., Li, F., Leier, A., Marquez-Lago, T. T., Akutsu, T., Haffari, G., et al. (2018a). PROSPERous: high-throughput prediction of substrate cleavage sites for 90 proteases with improved accuracy. Bioinformatics 34, 684–687. doi: 10.1093/bioinformatics/btx670
Song, J., Li, F., Takemoto, K., Haffari, G., Akutsu, T., Chou, K. C., et al. (2018b). PREvaIL, an integrative approach for inferring catalytic residues using sequence, structural, and network features in a machine-learning framework. J. Theor. Biol. 443, 125–137. doi: 10.1016/j.jtbi.2018.01.023
Song, J., Wang, Y., Li, F., Akutsu, T., Rawlings, N. D., Webb, G. I., et al. (2018c). iProt-Sub: a comprehensive package for accurately mapping and predicting protease-specific substrates and cleavage sites. Brief. Bioinformatics doi: 10.1093/bib/bby028. [Epub ahead of print].
Stinchcomb, D. T., Struhl, K., and Davis, R. W. (1979). Isolation and characterisation of a yeast chromosomal replicator. Nature 282, 39–43. doi: 10.1038/282039a0
Su, Z. D., Huang, Y., Zhang, Z. Y., Zhao, Y. W., Wang, D., Chen, W., et al. (2018). iLoc-lncRNA: predict the subcellular location of lncRNAs by incorporating octamer composition into general PseKNC. Bioinformatics. doi: 10.1093/bioinformatics/bty508. [Epub ahead of print].
Tang, H., Zhao, Y. W., Zou, P., Zhang, C. M., Chen, R., Huang, P., et al. (2018). HBPred: a tool to identify growth hormone-binding proteins. Int. J. Biol. Sci. 14, 957–964. doi: 10.7150/ijbs.24174
The Uniprot, C. (2018). UniProt: the universal protein knowledgebase. Nucleic Acids Res. 32, D115–D119. doi: 10.1093/nar/gky092
Theis, J. F., and Newlon, C. S. (1997). The ARS309 chromosomal replicator of Saccharomyces cerevisiae depends on an exceptional ARS consensus sequence. Proc. Natl. Acad. Sci. U. S. A. 94, 10786–10791. doi: 10.1073/pnas.94.20.10786
Vapnik Vladimir, N. (1997). The nature of statistical learning theory. IEEE Trans. Neural Netw. 8:1564.
Weddington, N., Stuy, A., Hiratani, I., Ryba, T., Yokochi, T., and Gilbert, D. M. (2008). Replication domain: a visualization tool and comparative database for genome-wide replication timing data. BMC Bioinformatics 9:530. doi: 10.1186/1471-2105-9-530
Wei, L., Ding, Y., Su, R., Tang, J., and Zou, Q. (2018a). Prediction of human protein subcellular localization using deep learning. J. Parallel Distributed Comput. 117, 212–217. doi: 10.1016/j.jpdc.2017.08.009
Wei, L., Su, R., Wang, B., Li, X., and Zou, Q. (2018b). Integration of deep feature representations and handcrafted features to improve the prediction of N 6 -methyladenosine sites. Neurocomputing. 324:3–9. doi: 10.1016/j.neucom.2018.04.082
Wei, L., Xing, P., Shi, G., Ji, Z. L., and Zou, Q. (2018c). Fast prediction of protein methylation sites using a sequence-based feature selection technique. IEEE/ACM Trans. Comput. Biol. Bioinform. doi: 10.1109/TCBB.2017.2670558. [Epub ahead of print].
Xiao, X., Ye, H. X., Liu, Z., Jia, J. H., and Chou, K. C. (2016). iROS-gPseKNC: Predicting replication origin sites in DNA by incorporating dinucleotide position-specific propensity into general pseudo nucleotide composition. Oncotarget 7, 34180–34189. doi: 10.18632/oncotarget.9057
Yamashita, R., Sathira, N. P., Kanai, A., Tanimoto, K., Arauchi, T., Tanaka, Y., et al. (2011). Genome-wide characterization of transcriptional start sites in humans by integrative transcriptome analysis. Genome Res. 21, 775–789. doi: 10.1101/gr.110254.110
Yang, H., Lv, H., Ding, H., Chen, W., and Lin, H. (2018a). iRNA-2OM: A sequence-based predictor for identifying 2'-O-methylation sites in Homo sapiens. J. Comput. Biol. 25:1266–77. doi: 10.1089/cmb.2018.0004
Yang, H., Qiu, W.-R., Liu, G., Guo, F.-B., Chen, W., Chou, K.-C., et al. (2018b). iRSpot-Pse6NC: Identifying recombination spots in Saccharomyces cerevisiae by incorporating hexamer composition into general PseKNC. Int. J. Biol. Sci. 14, 883–891. doi: 10.7150/ijbs.24616
Yang, H., Tang, H., Chen, X. X., Zhang, C. J., Zhu, P. P., Ding, H., et al. (2016). Identification of secretory proteins in Mycobacterium tuberculosis using pseudo amino acid composition. Biomed Res. Int. 2016:5413903. doi: 10.1155/2016/5413903
Yu, L., Sun, X., Tian, S. W., Shi, X. Y., and Yan, Y. L. (2018). Drug and non-drug classification based on deep learning with various feature selection strategies. Curr. Bioinform. 13, 253–259. doi: 10.2174/1574893612666170125124538
Zhang, C. J., Tang, H., Li, W. C., Lin, H., Chen, W., and Chou, K. C. (2016). iOri-Human: identify human origin of replication by incorporating dinucleotide physicochemical properties into pseudo nucleotide composition. Oncotarget 7, 69783–69793. doi: 10.18632/oncotarget.11975
Zhang, Z., Zhao, Y., Liao, X., Shi, W., Li, K., Zou, Q., et al. (2018). Deep learning in omics: a survey and guideline. Brief. Funct. Genomics. doi: 10.1093/bfgp/ely030. [Epub ahead of print].
Zhao, X., Zou, Q., Liu, B., and Liu, X. (2014). Exploratory predicting protein folding model with random forest and hybrid features. Curr. Proteomics 11, 289–299. doi: 10.2174/157016461104150121115154
Zhu, X. J., Feng, C. Q., Lai, H. Y., Chen, W., and Hao, L. (2018). Predicting protein structural classes for low-similarity sequences by evaluating different features. Knowledge-Based Syst. 163:787–793. doi: 10.1016/j.knosys.2018.10.007
Zou, Q., Wan, S., Ju, Y., Tang, J., and Zeng, X. (2016a). Pretata: predicting TATA binding proteins with novel features and dimensionality reduction strategy. BMC Syst. Biol. 10:114. doi: 10.1186/s12918-016-0353-5
Keywords: eukaryotic DNA replication, origins of replication, machine learning method, DNA structure properties, webserver
Citation: Dao F-Y, Lv H, Wang F and Ding H (2018) Recent Advances on the Machine Learning Methods in Identifying DNA Replication Origins in Eukaryotic Genomics. Front. Genet. 9:613. doi: 10.3389/fgene.2018.00613
Received: 21 October 2018; Accepted: 21 November 2018;
Published: 10 December 2018.
Edited by:
Dariusz Mrozek, Silesian University of Technology, PolandCopyright © 2018 Dao, Lv, Wang and Ding. This is an open-access article distributed under the terms of the Creative Commons Attribution License (CC BY). The use, distribution or reproduction in other forums is permitted, provided the original author(s) and the copyright owner(s) are credited and that the original publication in this journal is cited, in accordance with accepted academic practice. No use, distribution or reproduction is permitted which does not comply with these terms.
*Correspondence: Hui Ding, aGRpbmdAdWVzdGMuZWR1LmNu