 Keiko Kitamura
 Atsushi Nakanishi
 Chunlan Lian
 Susumu Goto
- 1Hokkaido Research Center, Forestry and Forest Products Research Institute, Forest Research and Management Organization, Sapporo, Japan
- 2Asian Natural Environmental Science Center, The University of Tokyo, Tokyo, Japan
- 3Education and Research Center, The University of Tokyo Forests, Graduate School of Agricultural and Life Sciences, The University of Tokyo, Tokyo, Japan
Conifers in northern forests, such as fir and spruce, preferably regenerate on coarse woody debris, including fallen logs, stumps, and snags. In northern Japan, the sub-boreal conifer species Picea jezoensis is completely dependent on coarse woody debris for seedling establishment. To understand the fine-scale spatial genetic structure (FSGS) of this species, a 5-ha plot was established in central Hokkaido, and 531 individual trees were categorized into four life-stages (seedling, sapling, juvenile, and mature) on the basis of age and size. The FSGS of the established seedlings and later growth stages was investigated using 11 nuclear simple sequence repeat loci. A STRUCTURE analysis of seedlings and saplings established on fallen logs revealed that genetically related individuals were spatially localized between adjacent logs. We also found a significant FSGS in early life-stages based on a decline in the kinship coefficient calculated between individuals over shorter to longer spatial distances. Furthermore, the estimation of dispersal kernels indicated the frequent occurrence of short-distance seed dispersal. These results indicated that genetically related seedlings and saplings regenerated on the same or nearby fallen logs. In contrast to the results for the early stages, mature-stage trees showed no significant FSGS. We ran a simulation to examine the hypothesis that the FSGS could be eliminated by demographic thinning during life history processes. We calculated values for simulated offspring generated under three sets of conditions; i.e., by removing (i) inbred individuals, (ii) randomly chosen individuals, and (iii) all individuals on the specific fallen logs. However, the results for the FSGS were significant for all simulated data sets. This indicated that inbreeding depression, stochastic loss, or eradication of establishment sites by local disturbances alone could not explain the lack of FSGS among mature-stage trees. Therefore, it is possible that the colonization history of mature trees present on the study site might differ from that of the current offspring.
Introduction
Sub-boreal conifer forests are widely distributed throughout the northern hemisphere, including North America, northern Europe, and western Siberia, and are mainly dominated by the genera Picea, Abies, and Tsuga. These coniferous species successfully regenerate at safe sites, which are most often decaying logs and areas of coarse woody debris (CWD) (McCullough, 1948; Harmon, 1987; Suzuki et al., 1987; Nakamura, 1992), and some are so strongly dependent on CWD for their establishment that they are highly susceptible to changes in the environment. Regeneration on CWD is generally a characteristic of cool-temperate to boreal forest conifers in forest ecosystems throughout Europe (Hofgaard, 1993; Bače et al., 2012), the Pacific coast of North America (Harmon and Franklin, 1989), and East Asia (Kubota et al., 1994; Nakagawa et al., 2003). CWD is more beneficial than the soil surface for seedling establishment as it affords better light conditions (Harmon and Franklin, 1989; Maruyama et al., 2004) and fewer pathogens (Cheng and Igarashi, 1987). Previous studies on the successful establishment of tree species on CWD have revealed a number of preferred environmental factors for effective seed capture, germination, survival, and growth (Takahashi et al., 2000; Narukawa et al., 2003). However, in contrast to the numerous studies undertaken on regeneration on CWD, few studies have investigated the demographic processes from seedlings to mature trees for CWD-dependent species.
Recently, the use of molecular markers has enhanced our understanding of the genetic diversity in natural plant populations. Fine-scale spatial genetic structure (FSGS) within wild populations; i.e., the non-random spatial distribution of genotypes (Vekemans and Hardy, 2004), is a consequence of the combined effects of various evolutionary forces such as isolation, drift, selection, and adaptation. These forces are influenced by biotic and abiotic factors, such as mating systems, seed and pollen dispersal, the density of reproductive individuals, and the microenvironmental situation at the establishment sites (Epperson, 1993; Hamrick et al., 1993; Kalisz et al., 2001; Chung et al., 2003). In addition, human activities, such as the selective logging of forest tree species, may reduce the number of reproductive individuals and affect both population gene diversity and FSGS (Lourmas et al., 2007; Carneiro et al., 2011). Demographic processes from early to later life-stages, such as demographic thinning (Kitamura et al., 1997; Ueno et al., 2002; Lian et al., 2008) and generation overlapping (Ueno et al., 2002), may also affect FSGS. In addition, if individuals from different life-stages originate from different reproductive individuals, seed dispersal patterns, or seedling establishment opportunities, the FSGS should differ between life-stages. Thus, studies on FSGS at different life-stages could substantiate the demographic and regenerative processes between life-stages. However, few studies have investigated FSGS in forest tree species with CWD-dependent regeneration. In their survey of Abies sachalinensis, a CWD-dependent regeneration species, Lian et al. (2008) investigated FSGS in different growth stages using microsatellite markers. The authors detected a significant FSGS at the seedling stage, possibly attributable to limited seed dispersal, but a decline in FSGS in the later growth stages. They suggest that sib-competition and the density-dependent effect from juvenile to mature stages might lessen the FSGS in A. sachalinensis. In contrast to A. sachalinensis, which mainly regenerates on CWD but can also regenerate directly on forest soil (Nakagawa et al., 2001), the establishment of Picea jezoensis seedlings depends entirely on CWD. This can be explained by the fact that P. jezoensis seedlings are more susceptible to snow blight disease than are A. sachalinensis seedlings (Cheng and Igarashi, 1990). Furthermore, P. jezoensis seedlings were found to successfully establish themselves at more recent areas of CWD owing to their small size (Iijima and Shibuya, 2010). Consequently, a limited number of establishment sites results in the spatially uneven distribution of individuals (Nakagawa et al., 2003). Okada et al. (2015) identified P. jezoensis seedlings and saplings established on fallen logs at the same study site as that used by Lian et al. (2008), and they genotyped them using microsatellite markers and monitored survival and death over a 7-year period. They found that individual heterozygosity positively affected seedling longevity in P. jezoensis. As a matter of course, the survival or death of genetically related individuals may affect the spatial genetic structure of the later life-stages (Kitamura et al., 2008). However, the previous study by Okada et al. (2015) did not investigate P. jezoensis FSGS or seed dispersal patterns, which may be expected to strongly reflect a lack of consistent opportunities for regeneration on CWD. Limited seed dispersal and restriction of establishment sites may reduce the effective number of seed parents, which may induce a strong FSGS; however, the genetic or stochastic death of individuals may weaken the FSGS.
Generally, numerous years of regeneration on spatiotemporally varying areas of CWD leads to the accumulation of a substantial number of different mother trees all contributing to the next generations. The effective number of seed parents affects the FSGS of the offspring, as increases in gene dispersal and density of reproductive individuals reduce the intensity of genetic structure by overlapping “gene shadows” (Oddou-Muratorio and Klein, 2008). In fact, the intensity of the FSGS as expressed statistically as Sp is the reciprocal of the neighborhood size under certain conditions (Vekemans and Hardy, 2004). Therefore, the more the number of mother trees contributes to reproduction, the weaker the FSGS becomes. In this regard, the population of mature P. jezoensis individuals consists of overlapping generations established over many years, with the long life-span of this species (Hiura et al., 1996) thereby resulting in a weak FSGS. Thus, the study of FSGS verifies the conservation of genetic diversity as well as the reproductive process of the local population.
In the present study, we estimated the FSGS in P. jezoensis at four different growth stages, seedling, sapling, juvenile, and mature trees. Our working hypotheses are as follows; (1) strong restriction of safe-sites decreases the number of mother trees contributing to offspring and results in a strong FSGS at the early demographic stages and (2) accordingly, the FSGS at the early demographic stage should be weaker at the later demographic stages. Finally, we examined the factors affecting the FSGS, such as inbreeding depression, stochastic loss of individuals, and the eradication of establishment sites by local disturbances using simulation studies.
Materials and Methods
Study Site and Genotyping
The 5-ha study site (200 m × 250 m) was established at the fluvial terrace of the Iwanazawa Forest Reserve, University of Tokyo Hokkaido Forest (UTHF) in central Hokkaido (43°13′N, 142°34′E), Japan. The FSGS of co-occurring tree species; namely, Fraxinus mandshurica var. japonica (Goto et al., 2006), Cercidiphyllum japonicum (Sato et al., 2006), and Betula maximowicziana (Uchiyama et al., 2006) were investigated in a series of studies in the Iwanazawa Forest Reserve. Moreover, Lian et al. (2008) revealed the spatial genetic structure of CWD-dependent A. sachalinensis. The present study deals with the other species with CWD-dependent regeneration, P. jezoensis, on the same study plot.
In this study site, there were 112 fallen logs the diameters of which were larger than 20 cm at the base. Fallen logs were regarded as a major component of CWD in this forest. We measured individual P. jezoensis plants and identified four growth stages in the study plot: mature, juvenile, sapling, and seedling. We observed all 123 mature P. jezoensis individuals with a diameter at breast height (dbh) ≥20 cm, and all 39 juveniles with a dbh ≥5 cm but <20 cm. Individual trees with a dbh <5 cm were differentiated into two categories by age as determined by the number of bud scale vestiges. For saplings and seedlings, we selected half of the individuals established on fallen logs in this study, so that 190 saplings aged ≥3 years and 179 seedlings aged <3 years were included in this study. The locations of the areas of CWD and individual trees were identified using a digital compass (LaserACE 300, TimberTech), and their needle leaf tissues were collected for DNA analysis.
DNA was extracted from dried needle leaf samples from 531 individuals using a DNeasy Plant Mini kit (Qiagen). The following 11 microsatellite loci, GC1, GD1, GG3 (Pfeiffer et al., 1997), PaGB3, PgGB5 (Besnard et al., 2003), EATC1E03, EATC2G05 (Scotti et al., 2002), Pj4, Pj8, Pj22, and Pj24 (Okada et al., 2015) were analyzed using a Multiplex PCR Kit (Qiagen) together with a 3130xl Genetic Analyzer and GeneMapper ver. 4.0 (Thermo Fisher Scientific Inc.).
Data Analyses
The genetic diversity of the four growth stages was calculated using FSTAT ver. 2.3.9.2 (Goudet, 1995). FIS was also calculated considering the null alleles using INEst (Chybicki and Burczyk, 2009). Deviations from the Hardy-Weinberg equilibrium (HWE) for the mature stage at each locus and the overall loci were tested using the Markov chain method with GENEPOP (Raymond and Rousset, 1995). The null allele frequency of each locus was estimated using CERVUS ver. 2.0 (Marshall et al., 1998). To evaluate the associations between loci in mature trees, we conducted an exact test of linkage disequilibrium using GENEPOP.
To test for a temporal Wahlund effect, which may be due to differences between reproductive individuals among growth stages, pairwise population differentiation values between all pairs of stages were calculated using FST from an AMOVA (Excoffier et al., 1992; Michalakis and Excoffier, 1996), which is equivalent to Weir and Cockerham (1984) using GENODIVE (Meirmans and Van Tienderen, 2004).
We used four approaches to evaluate the FSGS at the four growth stages, and then examined the factors affecting the FSGS dynamics during the life history process.
First, the local distribution of genetic variation was examined by multilocus model-based cluster analysis using STRUCTURE 2.3.4 (hereafter, STRUCTURE) (Pritchard et al., 2000) for all 531 individuals. All of the runs consisted of 200,000 Markov chain Monte Carlo (MCMC) generations, after a burn-in period of 100,000 iterations. Twenty runs were performed for each number of clusters (K), ranging from 1 to 10. To determine the most likely value for K, we first used the methods suggested in the original description of STRUCTURE, which involves comparing the log probability to the data (ln Pr [X|K]) for each run to evaluate the genetic structure. Then, we calculated ΔK (Evanno et al., 2005) to determine the optimal value of K. Subsequently, we chose the most appropriate K (Pritchard et al., 2000) for the inferred clustering interpretation.
Second, the FSGS at each growth stage was evaluated using the kinship coefficient, Fij (coancestry) (Loiselle et al., 1995). In the case of two individuals, i and j, Fij can be defined as Fij = (Qij–Qm)/(1–Qm), where Qij is the probability of identity in state between two randomly chosen genes from i and j, and Qm is the average probability of identity by state between two randomly chosen individuals from the reference population. Assuming that the reference population is the parental generation, Fij is expected to have values derived from the pedigree information (i.e., 0.125 for half-siblings [sibs] and 0.25 for full-sibs) (Hardy and Vekemans, 2002). For the analyses of seedlings, saplings, and juveniles (hereafter, these three stages are collectively referred to as adolescents), we assumed the 123 mature trees to be the reference population. When an allele unique to the adolescent stage was observed, one of its haploid genes was incorporated into the reference population to allocate the low frequency for the allele into the reference population. The reference population was used to calculate average Fij values for all four stages for each of the 20 continuous distance classes at 10 m intervals from 0–10 to 190–200 m. The significance of the average Fij values was then assessed using permutation tests (with 1000 permutations), in which spatial distances were permuted randomly among pairs of individuals. Furthermore, to compare the intensity of the FSGS among the four stages, we calculated Sp, a parameter indicating FSGS intensity, using the formula Sp = bF/(F1–1). In this formula, bF is the slope of Fij against the logarithm of the distance between individuals, and F1 is the average kinship coefficient among individuals in the first distance class (i.e., 0–10 m) in this study. The value for bF was estimated based on the regression of all spatial distances between individuals, and the significance level was calculated using 1000 permutation tests. All the FSGS-related calculations were performed using SPAGEDI ver. 1.4 (Hardy and Vekemans, 2002).
Third, we evaluated the effect of inbreeding on demographic change as follows. We calculated the average values of individual inbreeding coefficients (Fis) as a kinship coefficient between genes within each individual (Hardy and Vekemans, 2002) at each of the four growth stages, and then examined their significance. Coefficients for all four stages were calculated using the same reference population as used for the FSGS analyses. These calculations were performed using SPAGEDI ver. 1.4.
Fourth, NM+ software (Chybicki and Burczyk, 2010) was used to evaluate the pollen and seed dispersal kernels for seedlings and saplings using the neighborhood model approach, based on the multilocus genotypes of mature trees, seedlings, and saplings (Burczyk et al., 2006). We applied the following exponential-power function, characterized by the parameters a and b (Clark, 1998):
where r is the pollen or seed dispersal distance, Γ is the gamma function, a is a scale parameter, and b is the shape parameter affecting the fat tail of the dispersal curve (Austerlitz et al., 2004). Assuming all 123 mature trees to be neighbors and setting selfing rates to zero, we estimated the parameters a and b, immigration rates, and average dispersal distances for pollen and seeds for seedling and sapling generations. We incorporated mature tree dbh values as a predictor of reproductive success, and null allele frequencies to the estimation of the kernels.
Finally, to examine whether demographic thinning by inbreeding depression, stochastic loss, or both during the transition from adolescent to mature stage affected the FSGS among mature trees, we simulated seedling and sapling deaths under three sets of conditions. We first combined all 179 seedlings and 190 saplings into a dataset of 369 offspring. We then generated the following datasets. (1) To examine the deaths of inbred offspring; i.e., death by inbreeding depression, we generated a set consisting of 123 offspring with low Fis values, assuming the death of the top 246 offspring based on high Fis values. (2) To examine the deaths of random offspring, we randomly extracted 123 individuals from the offspring data without replacement and repeated this procedure 10 times to generate 10 different datasets. This randomization procedure was conducted using Visual Basic for Applications. In the first and second simulations, the number (123) of surviving offspring was the same as that of mature trees. (3) To determine the effects of local disturbances such as flooding, which may eradicate all offspring on specific CWD, we generated six datasets by excluding all offspring on CWD with (i) the largest number of offspring; (ii) the largest and second largest number of offspring; (iii) the largest, second, and third largest number of offspring; (iv) the largest, second, third, and fourth largest number of offspring; (v) the largest, second, third, fourth, and fifth largest number of offspring; and (vi) more than eight offspring, resulting in 250, 232, 216, 200, 186, and 122 surviving individual data sets, respectively. The number of datasets from (vi) was approximately the same as that of the mature trees. We calculated test statistics for the FSGS of the simulated offspring datasets (1, 2, and 3), to examine whether the FSGS was significant in each dataset. In these simulation-based analyses, all the statistical calculations for the FSGS of actual mature trees, and actual and simulated offspring were determined using the same methods as previously mentioned for the examination of FSGS at each growth stage, but without the reference population.
Results
Genetic Diversity
The genetic diversity (HS) of each growth stage ranged from 0.743 to 0.751, and the allelic richness (based on 37 individuals) ranged from 14.01 to 15.19 (Table 1). The juvenile stage showed the highest values for both parameters, although the values for these parameters were similar among the four growth stages. The inbreeding coefficient (FIS) was the highest and lowest in the seedling and mature stages (0.241 and 0.113), respectively. This was also observed for the FIS values (0.074 and 0.024 in seedling and mature tree stages, respectively) estimated using the Bayesian approach taking into account the null alleles (i.e., using the INEST software). The 11 loci were polymorphic in mature trees, with 3 to 46 alleles per locus and mean HE values of 0.743 (Supplementary Table 1). The FIS values for each locus ranged from -0.054 to 0.286, with an average of 0.112 across all loci. Significant deviations from the HWE were observed at five loci: GD1, Pj22, Pj24, EATC1E03, and PaGB3 (p < 0.05 after Bonferroni correction), which all had high null allele frequencies, ranging from 0.090 to 0.185. Therefore, these loci were excluded from the calculations of Fij and Fis. There was no significant linkage disequilibrium between any pair of loci analyzed.
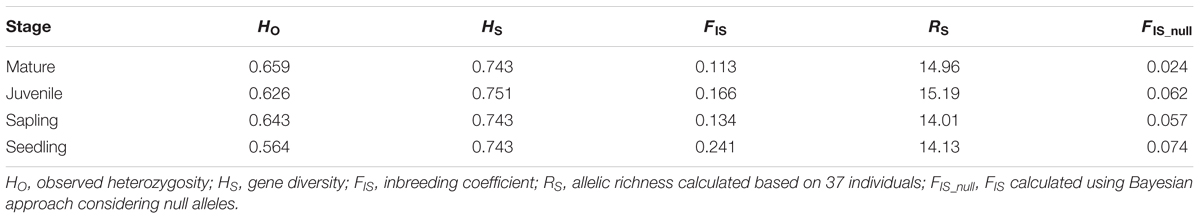
TABLE 1. Genetic diversity of each growth stage of Picea jezoensis.
Pairwise FST values between growth stages were calculated using 11 and 6 loci without the above-mentioned significant deviations from the HWE loci (Table 2). Genetic differentiation was not detected between mature and juvenile stages. However, the mature stage was significantly differentiated from the sapling and seedling stages. The juvenile stage was also differentiated from saplings and seedling stages, but the FST values obtained by 6 loci were not significantly different between juveniles and saplings. Differentiation between saplings and seedlings was also significant. This result indicated that a genetic differentiation had occurred, with a temporal Wahlund effect detected between growth stages.
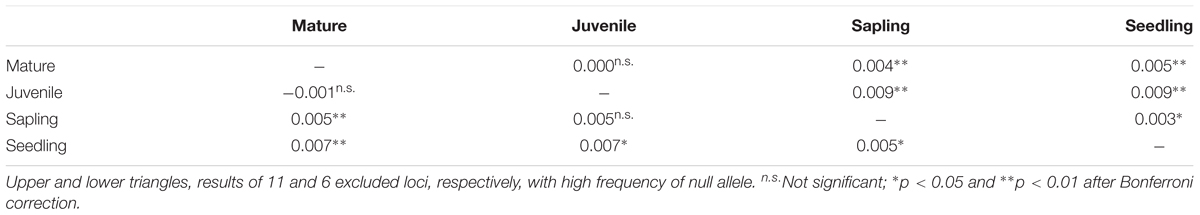
TABLE 2. Pairwise differentiation between four growth stages using FST from AMOVA using 11 and 6 loci.
Fine-Scale Spatial Genetic Structure
The spatial genetic structure was revealed using STRUCTURE analysis (Figure 1). We chose K = 2 as the most appropriate number of clusters to distinguish any local assemblage based on the rate of change in the log probability of the data (ln Pr [X|K]) between successive K values (Supplementary Figure 1). The distribution of each cluster component for each individual was mapped using the location of each area of CWD (Figure 1). Allele frequency divergence between 2 clusters was 0.028. The mean value of FST for Cluster 1 (red in Figure 1) and Cluster 2 (green in Figure 1) was 0.076 and 0.0086, respectively. The localized distribution of Cluster 1 was observed at the center of the study plot (red in Figure 1A). The spatial distribution of individuals differed between growth stages (Figures 1C–F). Mature trees were evenly distributed in the study plot, but juveniles were extremely localized; the spatial distribution of any cluster was insignificant for the mature and juvenile stages (Figures 1E,F). Saplings and seedlings were restricted to the areas of CWD and showed a spatially distinct concentration for Cluster 1 (Figures 1E,F). We calculated the average Fij values of seedlings and saplings within Cluster 1 to examine the relationships comparable to half or full-sibs. We chose seedlings and saplings with probabilities of belonging to Cluster 1 higher than 0.9, which resulted in a final population of 59 seedlings and 59 saplings. We then calculated the Fij values between 1711 pairs for seedlings and saplings, respectively. The average Fij for seedlings and saplings for Cluster 1 was 0.025 and 0.011, respectively.
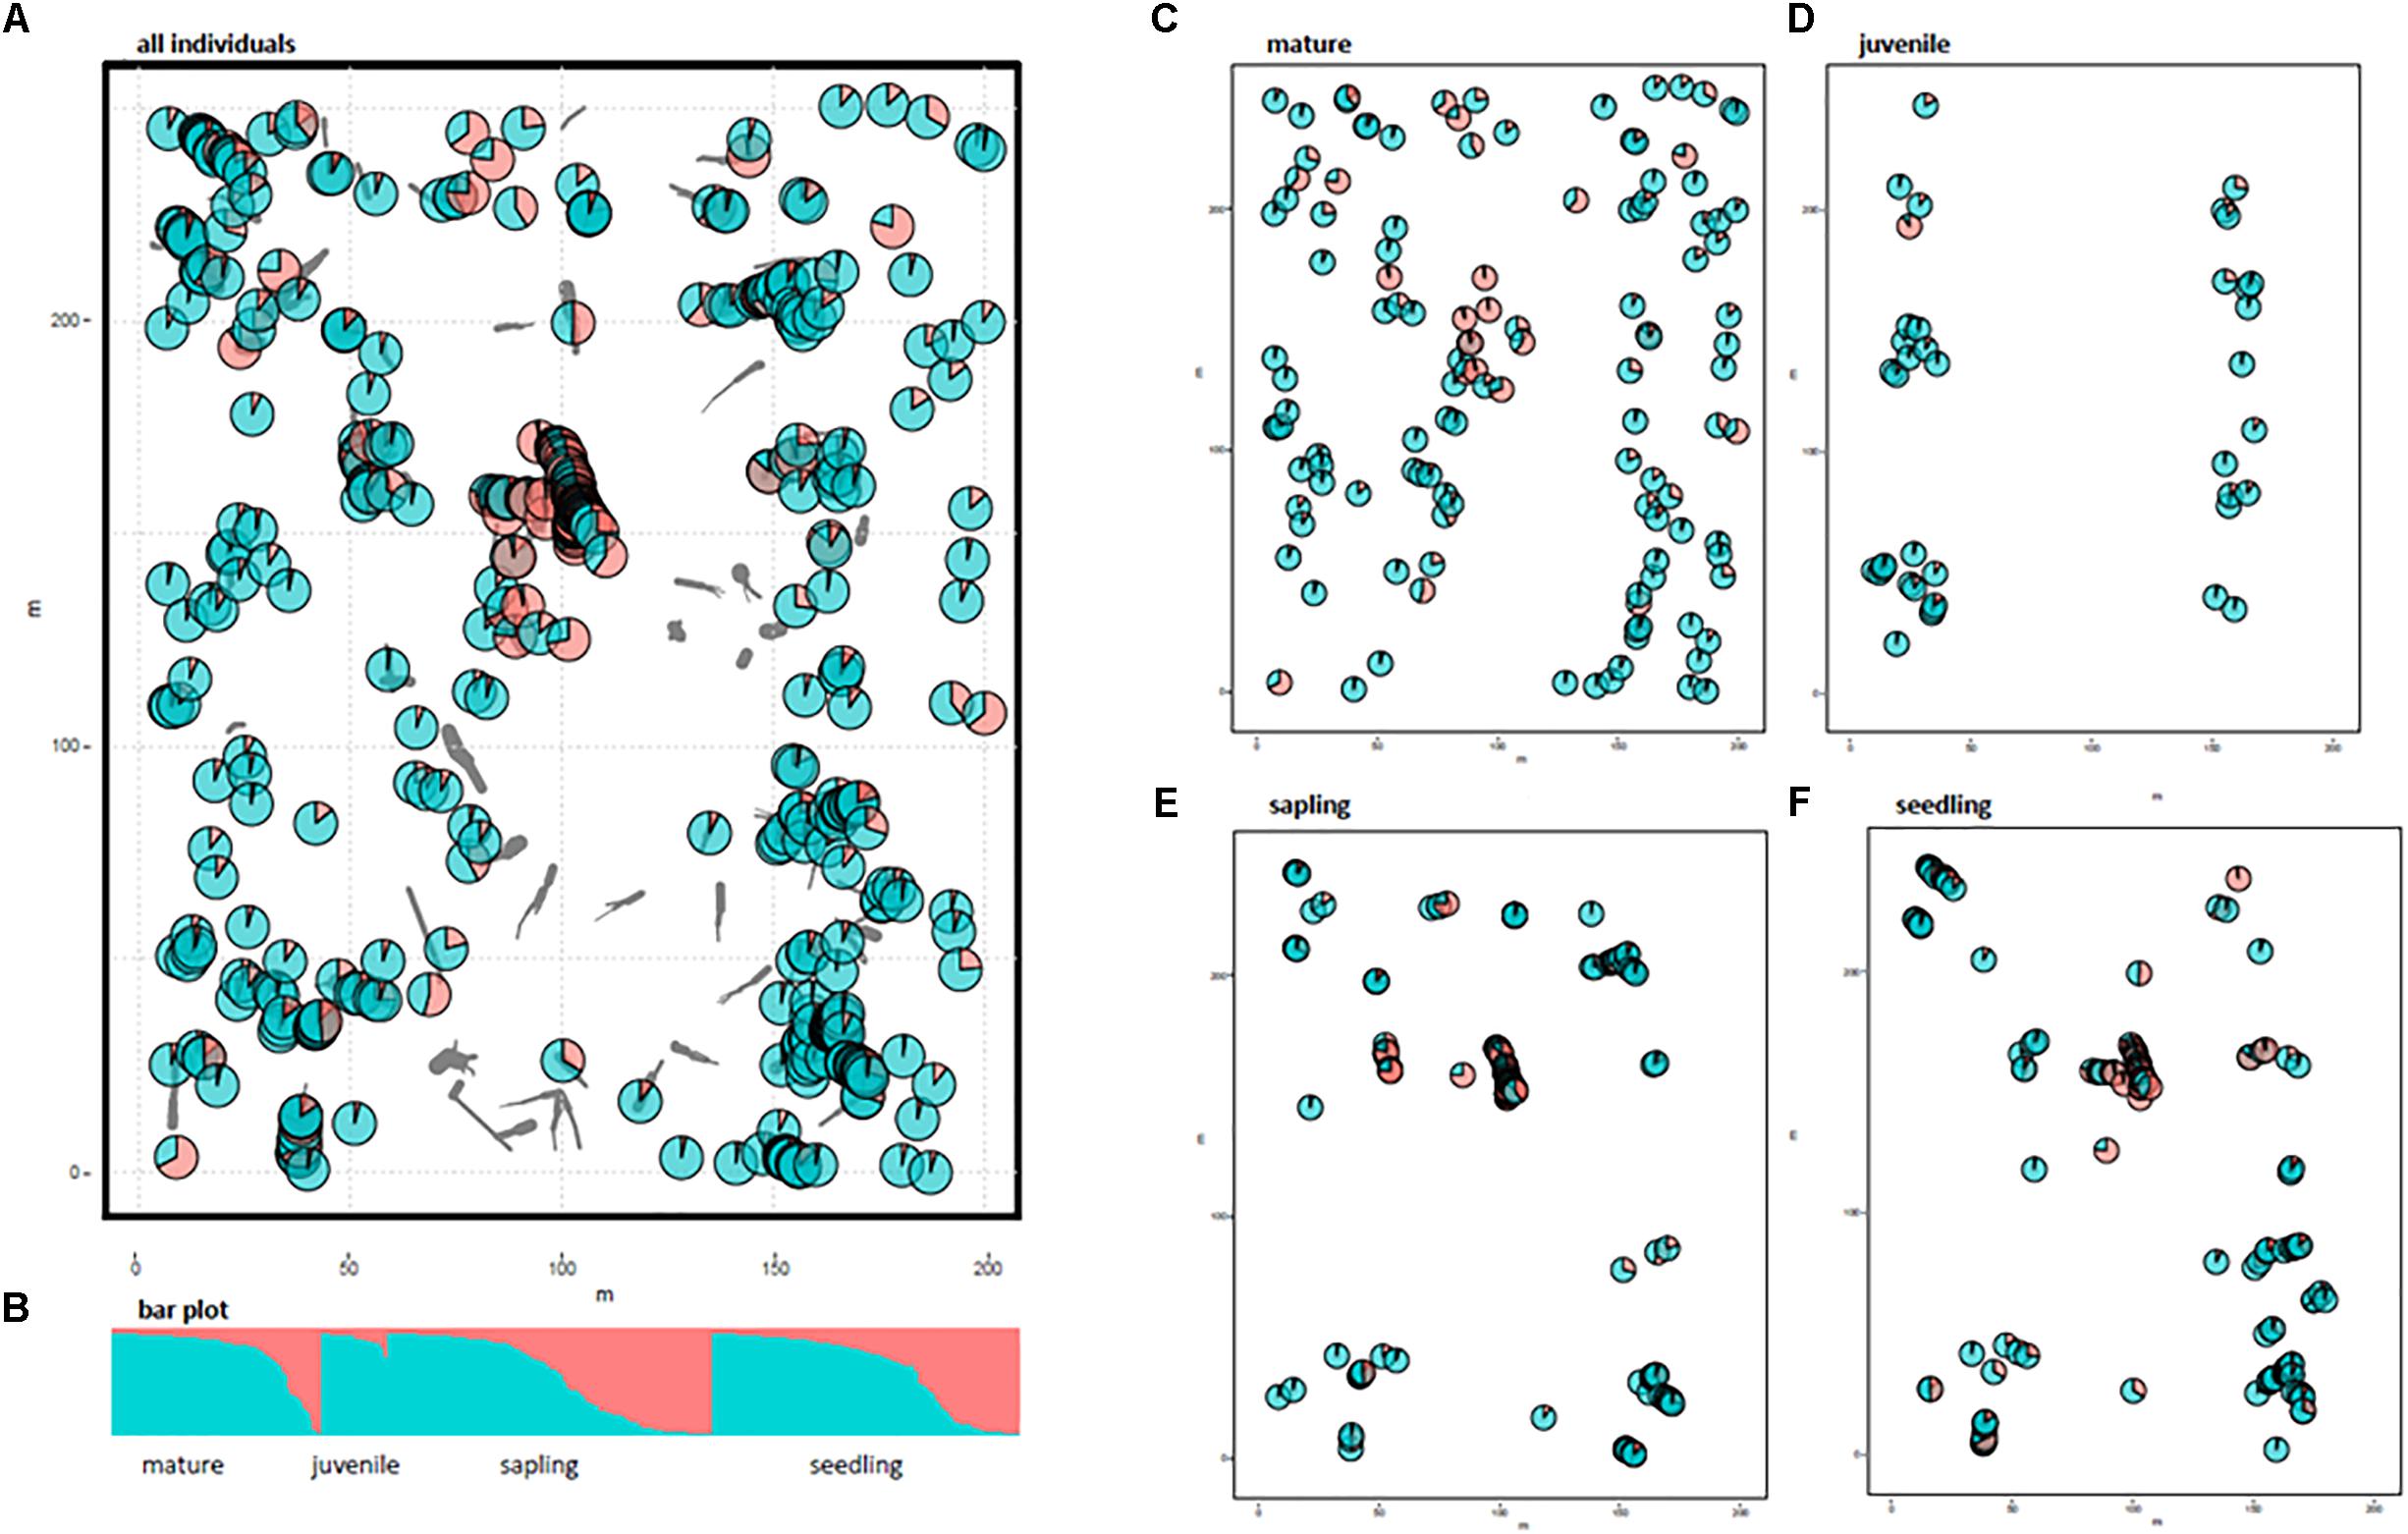
FIGURE 1. Distribution of two cluster components of 531 individuals using STRUCTURE analysis. Gray bars indicate coarse woody debris (CWD). Pie charts represent the cluster components of each individual plant. Different colors indicate different clusters (K = 2); Cluster 1 in red and Cluster 2 in green. (A) All 531 individuals, (B) bar plot for K = 2, (C–F), cluster components for each growth stage without CWD locations.
Correlograms of the average Fij values for the four different growth stages are shown in Figure 2. Significantly positive values were observed in the shorter distance classes for seedlings (0–10 and 10–20 m), saplings (0–10 and 10–20 m), and juveniles (0–10 m), but the values were either not significant or significantly negative in the longer distance classes for these three stages; however, this tendency was not detected for mature trees. The bF values for juveniles (-0.008), saplings (-0.013), and seedlings (-0.011) were all significant (permutation test, p < 0.05), but were not significant for mature trees (-0.001, Table 2). The Sp values for mature trees (0.001) were much lower than those for juveniles (0.009), saplings (0.014), and seedlings (0.012). This indicated that the FSGS was stronger in the adolescents than in the mature trees.
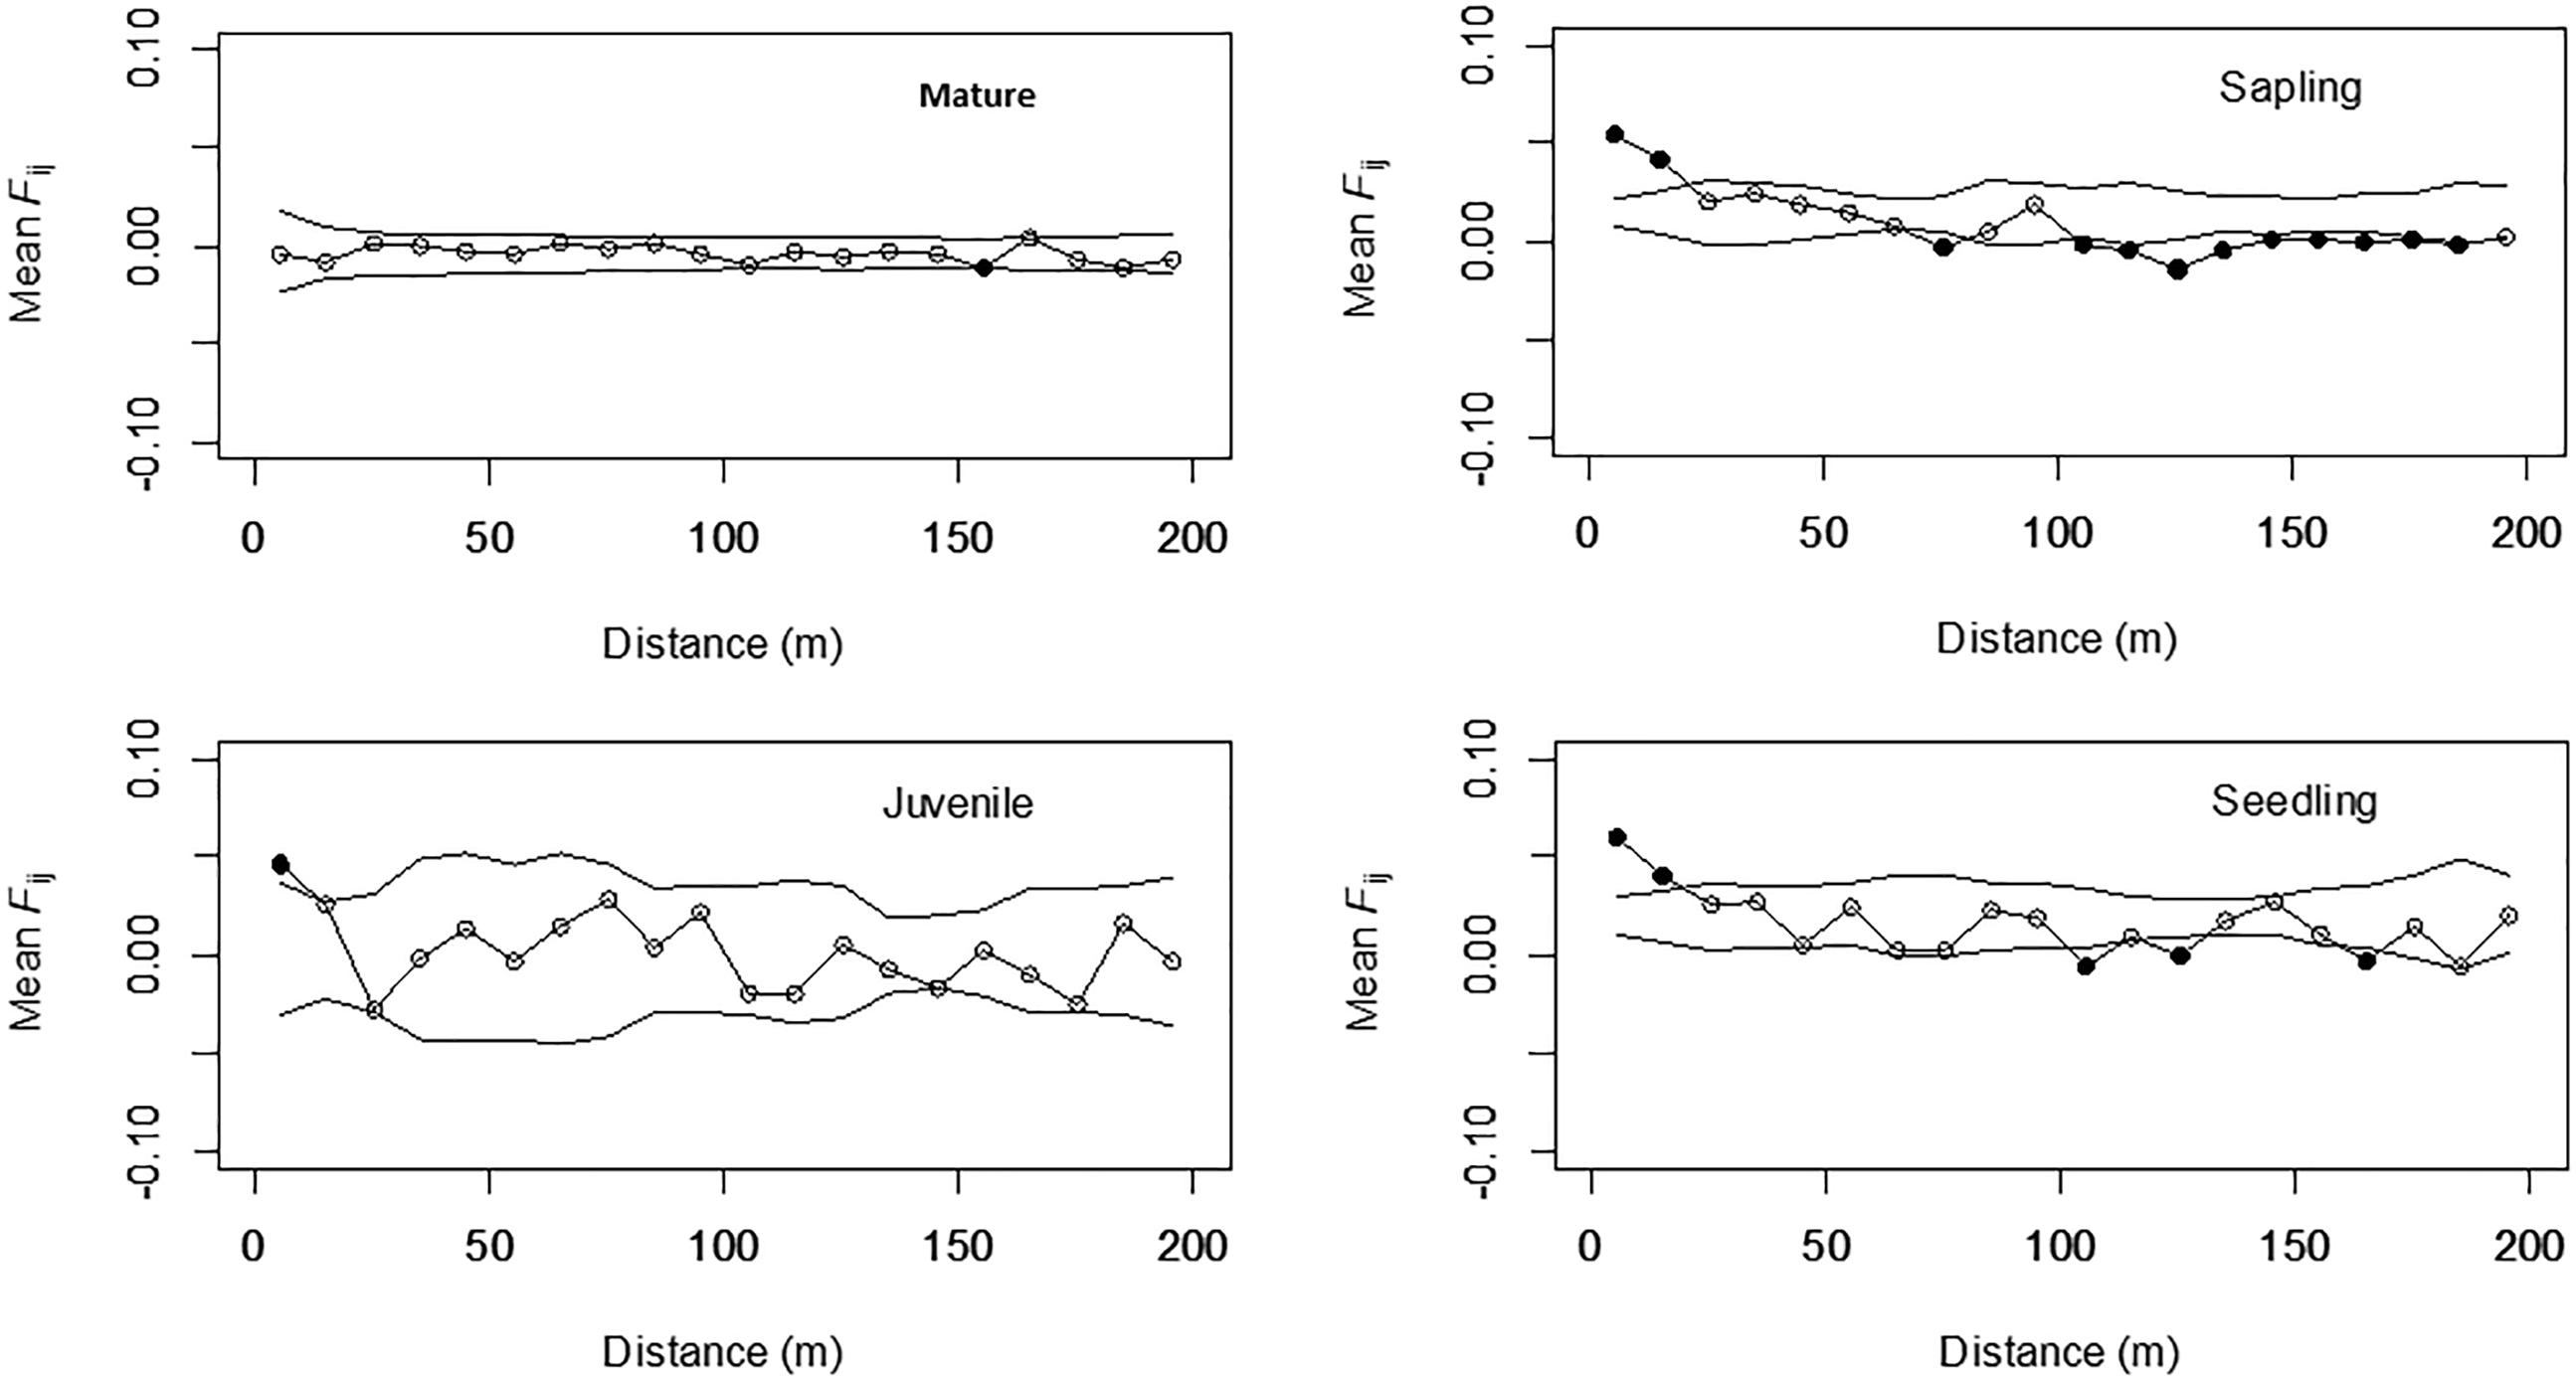
FIGURE 2. Mean Fij (kinship coefficient) for each growth stage in Picea jezoensis. Dotted lines, 95% confidence interval envelopes; ∗significance level, p < 0.05.
Inbreeding Detected at Each Growth Stage
The average value of the individual inbreeding coefficient (Fis) at all four growth stages was significantly high (permutation test after Bonferroni correction, Table 3). However, the average value for seedlings (0.228, p < 0.005) was the highest, and the values then decreased with life history for saplings (0.094, p < 0.005), juveniles (0.072, p < 0.05), and mature trees (0.034, p < 0.05).
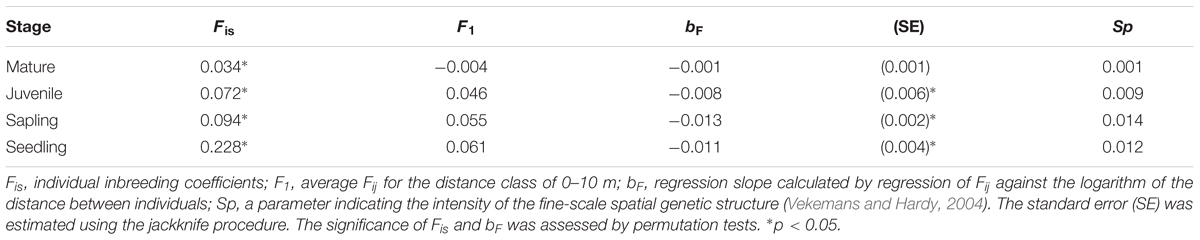
TABLE 3. Genetic parameters of inbreeding and spatial genetic structure for the different growth stages of Picea jezoensis.
Estimated Patterns of Seed and Pollen Dispersal
Based on the neighborhood model and using exponential power functions as dispersal kernels for both pollen and seeds, the scale parameter (a), shape parameter (b), average dispersal distance (d), and immigration rate (m) were calculated to be 81.816, 3.097, and 59.9 m and 86.6%, respectively, for pollen dispersal in the seedling stage. Furthermore, the corresponding values for seed dispersal were 3.823, 0.571, and 40.6 m and 74.4%, respectively, for the seedling stage (Table 4). The above parameters for pollen dispersal in the sapling stage were 0.010, 0.251, and 71.6 m and 82.4%, respectively, while those for seed dispersal were 2.710, 0.564, and 30.5 m and 61.2%, respectively (Table 4).
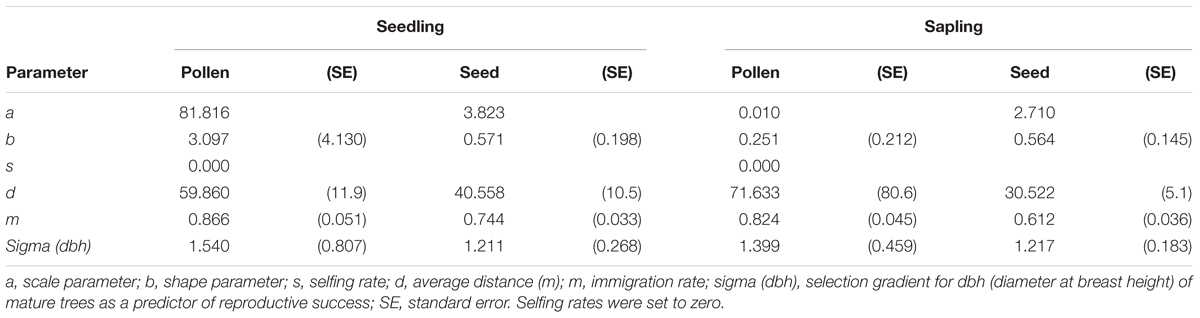
TABLE 4. Parameters of pollen and seed dispersal kernels at the seedling and sapling stages, estimated according to the neighborhood model approach using exponential power functions.
FSGS of Simulated Offspring
Fine-scale spatial genetic structure values were significant for seedlings and saplings observed on the study site, and for all the sets of simulated offspring under the three conditions, except for mature trees (Supplementary Table 2). For simulated offspring selected under the condition of death by inbreeding depression, although the average Fis value was negative and significantly low (permutation test, p < 0.001), the F1 and bF values remained significantly high (permutation test, p < 0.001). For the sets of offspring simulated under the two sets of conditions related to random death and eradication of all the offspring on specific CWD, the average Fis, F1, and bF values for all the data sets were significantly high (permutation test, p < 0.001). Furthermore, the Sp values (0.004–0.010) for all the sets of simulated offspring were higher than those of mature trees (0.001).
Discussion
Significant FSGS in Adolescent Stages
The STRUCTURE analysis indicated that adjacent areas of CWD accommodated genetically related progeny at the center of the study plot (Figures 1E,F). This might reflect limited seed dispersal capacity and a limited number of established sites (CWD), both of which decrease the effective number of seed parents and, consequently, strengthen the FSGS in this species. Moreover, correlograms of the average Fij value for adolescents showed a significant FSGS for short distance classes (i.e., within a specific area of CWD and between adjacent areas of CWD, Figure 2). It was comparable to the significance of the regression slope (bF), indicating that the genetic clustering of adolescents was stronger than that of mature trees (Table 3). Although P. jezoensis is wind-pollinated and anemochorous, it demonstrates FSGS in its early life-stages, which could be attributed to the limited gene dispersal and small number of establishment sites. The F1 (mean Fij at 0–10 m distance class) values (0.046–0.061) for adolescents were much lower than those expected for half-sibs (0.125). Moreover, the average Fij values for seedlings and saplings for Cluster 1 in the STRUCTURE analysis (0.025 and 0.011, respectively) were also much smaller than the kinship coefficients expected for half-sibs. The significant FSGS and low F1 values for adolescents indicated that spatially limited seed dispersal should generate a half-sib family structure around seed parents, but this structure may be weakened by the overlapping of seed shadows.
Even in the case of anemochory, the seed shadow of each mother tree would create a spatial genetic structure during the initial regeneration process (Uchiyama et al., 2006). The proportion of seed and pollen flow from outside the plot was high in both the seedling and sapling stages, indicating long-distance seed and pollen dispersal. However, seed dispersal was limited locally because the average distances of seed dispersal at the seedling (40.6 m) and sapling (30.5 m) stages were shorter than the average distances for pollen dispersal. Similar results were obtained from a study of the anemochorous species, A. sachalinensis, at the same study site, for which the average distance of seed dispersal was 23.7 m (Lian et al., 2008). It is probable that frequent seed dispersal over short distances may have induced the significant FSGS observed for the adolescent stages. As the proportion of seed flow from outside the plot and the mean distances of seed dispersal for P. jezoensis detected in this study were higher and longer than those (18.7% and 23.7 m, respectively) for A. sachalinensis in the same plot (Lian et al., 2008), the distance of seed dispersal is expected to be longer in P. jezoensis than in A. sachalinensis. However, the Sp values at the seedling, sapling, and juvenile stages for P. jezoensis were higher than those for A. sachalinensis (0.004, 0.004, and 0.004, respectively). The stronger FSGS for P. jezoensis may be due to its stronger dependency on CWD for establishment than that of A. sachalinensis.
Evidence of Inbreeding Among Early Life Stages
The genetic diversity parameters were similar among the four growth stages (Table 1). In contrast, the average Fis value was high at the seedling stage and decreased for the later growth stages (Table 3). Husband and Schemske (1996) suggested that outcrossing species express much of their inbreeding depression either early, at the time of seed development, or later during the growth and reproductive stages. The decrease in average Fis value with life history process might be influenced by inbreeding depression at the growing stages after seedling establishment. Our previous study, based on the same population examined in the present study, indicated that multilocus heterozygosity had an effect on seedling longevity (Okada et al., 2015). Some cross-experiment studies of Picea species have shown that growth in height decreased as the kinship coefficient increased (Doerksen et al., 2014). Therefore, it is likely that not only decreasing growth in height but also increasing mortality due to inbreeding depression may affect Fis values during the life history process of P. jezoensis. Additionally, inbreeding depression might be one of the reasons for the weakening of the FSGS during the progression from juveniles to mature trees.
Inbreeding Depression, Stochastic Loss, or Local Disturbances Alone Did Not Explain the Decline in FSGS in Mature Trees
In the present study, we found a significant FSGS in seedlings, saplings, and juveniles, but not in mature trees. Thus, our two working hypotheses were confirmed by this study. First, the decline in FSGS over the life history was previously reported for various tree species (Hamrick et al., 1993; Epperson and Alvarez-Buylla, 1997; Lian et al., 2008; Schroeder et al., 2014; Ganzhorn et al., 2015), and has been attributed to the demographic thinning of individuals. Second, the previously mentioned inbreeding depression might also have weakened the FSGS in our study. Furthermore, the Sp value of mature P. jezoensis trees (0.001) in this study was much lower than that of other tree species that relay on wind-pollination and wind-dispersal of seeds (0.002–0.011) (Vekemans and Hardy, 2004), and that of the CWD-dependent A. sachalinensis (0.003) (Lian et al., 2008).
However, according to the results of the simulations under the conditions of death by inbreeding depression, stochastic loss, and local disturbance, the FSGS values for all simulated offspring datasets were significant (Supplementary Table 2). These results appear to indicate that demographic thinning by the stochastic loss of individuals, removal of specific areas of CWD by local disturbances, or via the inferior fitness of inbred individuals, did not reduce the FSGS in the adolescent life stages of P. jezoensis. In conclusion, we cannot attribute the decline in the FSGS throughout the life history of P. jezoensis to demographic thinning alone. It is probable that the regeneration processes responsible for each generation have changed significantly over long periods. Thus, not only demographic thinning but also other factors, such as differences in colonization histories between the mature and offspring populations, and seeds derived from multiple sources, should be considered in explaining the low Sp values and lack of FSGS in mature P. jezoensis populations.
We do not currently have any concrete evidence to explain the observed lack of FSGS in the mature stage. However, it is most probable that the mature population consists of individuals derived from multiple origins by long-distance propagule dispersal. This is likely if the mature individuals are a founder population established after a strong disturbance, and it must be remembered that the study site is located on a floodplain along a creek. We speculate that immediately after the vegetation was cleared by natural disturbances such as flooding, no effective mother trees remained in the adjacent area, but substantial CWD was available for P. jezoensis establishment; i.e., it was an ecologically empty site.
Insights Into Regeneration Processes Using FSGS Analysis
Figures 1C–F clearly shows that the spatial distribution of individuals differed among growth stages. For example, mature trees spread over the whole study site (Figure 1C), whereas there were relatively small numbers of juveniles restricted to either end of the study site (Figure 1D). Saplings and seedlings showed similar localization patterns at each area of CWD (Figures 1E,F). The results of FSGS analysis differed among size classes, namely, a significant FSGS was observed in the proximate distance classes of seedlings and sapling stages (Figure 2). This might reflect limited seed dispersal and establishment sites in the present forest. The distribution of each growth stage reflects the existence of ecological empty patches at that time of regeneration. As the study site is located on the fluvial plain of Iwanazawa creek, the widely scattered distribution of mature trees (Figure 1C) suggests that these individuals were established in an ecological empty patch created by a strong natural disturbance such as the clearance of the forest floor by flooding. The longevity of P. jezoensis (100–160 years old) also suggests that the substantial number of areas of CWD accumulated after the initial establishment and regeneration of the younger mature trees. In addition, an artificial disturbance appears to have occurred at the study site in the past. The distribution of juveniles reflected the track of an abandoned forest railway and the present-day forest road. As there are large broadleaf trees growing at the center of the study plot, it seems that few areas of CWD are available for the regeneration of the present juveniles. The limited area available for regeneration may lead to a weak but significant FSGS in the juvenile stage in spite of its small sample size (Figure 2). Recently created areas of CWD have been revealed as suitable substrates for the regeneration of P. jezoensis (Iijima and Shibuya, 2010). In fact, similar but, in some part, slight differences were observed in the genetic distribution between the saplings and seedlings. This reflect differences in the time of CWD production.
In conclusion, the number and distribution of establishment sites, such as CWD, may be attributable to the FSGS in each generation of P. jezoensis. Moreover, our FSGS simulations suggested that present mature individuals may have been established by different disturbance regimes compared to the other demographic stages. It might be one of the characteristics of CWD-dependent tree species that different genetic variations could be created through spatiotemporal differences in the production of areas of CWD.
Author Contributions
KK, CL, and SG designed the study and interpreted the results. KK was responsible for the laboratory work. KK and AN analyzed the data. All authors contributed to the final version of the manuscript.
Funding
This study was supported by the Japan Society for the Promotion of Science (JSPS), KAKENHI Grant Numbers 25292081 and 16H02554.
Conflict of Interest Statement
The authors declare that the research was conducted in the absence of any commercial or financial relationships that could be construed as a potential conflict of interest.
Acknowledgments
We thank M. Okada for her contribution to the earlier version of the manuscript. We also thank the technical staff of the University of Tokyo Hokkaido Forest, especially Y. Takahashi, M. Matsui, A. Ohkawa, Y. Nakagawa, and M. Tookuni for their help in the field, and I. J. Chybicki for his technical advice.
Supplementary Material
The Supplementary Material for this article can be found online at: https://www.frontiersin.org/articles/10.3389/fgene.2018.00490/full#supplementary-material
Abbreviations
CWD, coarse woody debris; FSGS, fine-scale genetic structure.
References
Austerlitz, F., Dick, C. W., Dutech, C., Klein, E. K., Oddou-Muratorio, S., Smouse, P. E., et al. (2004). Using genetic markers to estimate the pollen dispersal curve. Mol. Ecol. 13, 937–954. doi: 10.1111/j.1365-294X.2004.02100.x
Bače, R., Svoboda, M., Pouska, V., Janda, P., and Červenka, J. (2012). Natural regeneration in Central-European subalpine spruce forests: which logs are suitable for seedling recruitment? Forest Ecol. Manag. 266, 254–262. doi: 10.1016/j.foreco.2011.11.025
Besnard, G., Acheré, V., Besnard, G., Faivre, V., Rampant, P., Favre, J. M., et al. (2003). A set of cross-species amplifying microsatellite markers developed from DNA sequence databanks in Picea (Pinaceae). Mol. Ecol. 3, 380–383. doi: 10.1046/j.1471-8286.2003.00456.x
Burczyk, J., Adams, W. T., Birkes, D. S., and Chybicki, I. J. (2006). Using genetic markers to directly estimate gene flow and reproductive success parameters in plants on the basis of naturally regenerated seedlings. Genetics 173, 363–372. doi: 10.1534/genetics.105.046805
Carneiro, F. S., Lacerda, A. E. B., Lemes, M. R., Gribel, R., Kanashiro, M., Wadt, L. H. O., et al. (2011). Effects of selective logging on the mating system and pollen dispersal of Hymenaea courbaril L. (Leguminosae) in the Eastern Brazilian Amazon as revealed by microsatellite analysis. Forest Ecol. Manag. 262, 1758–1765. doi: 10.1016/j.foreco.2011.07.023
Cheng, D., and Igarashi, T. (1987). Fungi associated with natural regeneration of Picea jezoensis Carr. in seed stage: their distribution on forest floors and pathogenicity to the seeds. Res. Bull. Coll. Exp. For. Fac. Agric. Hokkaido Univ. 44, 175–188.
Cheng, D., and Igarashi, T. (1990). Comparison of susceptibility to Racodium therryanum infection of seeds and seedlings of four coniferous species. Res. Bull. Exp. For. Fac. Agric. Hokkaido Univ. 47, 125–136.
Chung, M. Y., Epperson, B. K., and Chung, M. G. (2003). Genetic structure of age classes in Camellia japonica (Theaceae). Evolution 57, 62–73. doi: 10.4238/gmr16019526
Chybicki, I. J., and Burczyk, J. (2009). Simultaneous estimation of null alleles and inbreeding coefficients. J. Hered. 100, 106–113. doi: 10.1093/jhered/esn088
Chybicki, I. J., and Burczyk, J. (2010). NM + : software implementing parentage-based models for estimating gene dispersal and mating patterns in plants. Mol. Ecol. Resour. 10, 1071–1075. doi: 10.1111/j.1755-0998.2010.02849.x
Clark, J. S. (1998). Why trees migrate so fast: confronting theory with dispersal biology and the paleorecord. Am. Nat. 152, 204–224. doi: 10.1086/286162
Doerksen, T. K., Bousquet, J., and Beaulieu, J. (2014). Inbreeding depression in intra-provenance crosses driven by founder relatedness in white spruce. Tree Genet. Genomes 10, 203–212. doi: 10.1007/s11295-013-0676-y
Epperson, B. K. (1993). Recent advances in correlation studies of spatial patterns of genetic variation. Evol. Biol. 27, 95–155.
Epperson, B. K., and Alvarez-Buylla, E. R. (1997). Limited seed dispersal and genetics structure in life stages of Cecropia obtusifolia. Evolution 51, 275–282. doi: 10.1111/j.1558-5646.1997.tb02409.x
Evanno, G., Regnaut, S., and Goudet, J. (2005). Detecting the number of clusters of individuals using the software STRUCTURE: a simulation study. Mol. Ecol. 14, 2611–2620. doi: 10.1111/j.1365-294X.2005.02553.x
Excoffier, L., Smouse, P. E., and Quattro, J. M. (1992). Analysis of molecular variance inferred from metric distances among DNA haplotypes – application to human mitochondrial-DNA restriction data. Genetics 131, 479–491.
Ganzhorn, S. M., Thomas, W. W., Gaiotto, F. A., and Lewis, J. D. (2015). Spatial genetic structure of Manilkara maxima (Sapotaceae), a tree species from the Brazilian Atlantic forest. J. Trop. Ecol. 31, 437–447. doi: 10.1017/S0266467415000292
Goto, S., Shimatani, K., Yoshimaru, H., and Takahashi, Y. (2006). Fat-tailed gene flow in the dioecious canopy tree species Fraxinus mandshurica var. japonica revealed by microsatellites. Mol. Ecol. 15, 2985–2996. doi: 10.1111/j.1365-294X.2006.02976.x
Goudet, J. (1995). Fstat version 1.2: a computer program to calculate Fstatistics. J. Hered. 86, 485–486. doi: 10.1093/oxfordjournals.jhered.a111627
Hamrick, J. L., Murawski, D. A., and Nason, J. D. (1993). The influence of seed dispersal mechanisms on the genetic structure of tropical tree populations. Vegetatio 107, 281–297.
Hardy, O. J., and Vekemans, X. (2002). SPAGeDi: a versatile computer program to analyse spatial genetic structure at the individual or population levels. Mol. Ecol. Resour. 2, 618–620. doi: 10.1046/j.1471-8286.2002.00305.x
Harmon, M. E. (1987). The influence of litter and humus accumulations and canopy openness on Picea sitchensis (Bong.) Carr. and Tsuga heterophylla (Raf.) Sarg. seedlings growing on logs. Can. J. Forest Res. 17, 1475–1479. doi: 10.1139/x87-229
Harmon, M. E., and Franklin, J. F. (1989). Tree seedlings on logs in Picea–Tsuga forests of Oregon and Washington. Ecology 70, 48–59. doi: 10.2307/1938411
Hiura, T., Sano, J., and Konno, Y. (1996). Age structure and response to fine-scale disturbances of Abies sachalinensis, Picea jezoensis, Picea glehnii, and Betula ermanii growing under the influence of a dwarf bamboo understory in northern Japan. Can. J. Forest Res. 26, 289–297. doi: 10.1139/x26-032
Hofgaard, A. (1993). Structure and regeneration patterns in a virgin Picea abies forest in northern Sweden. J. Veg. Sci. 4, 601–608. doi: 10.2307/3236125
Husband, B. C., and Schemske, D. W. (1996). Evolution of the magnitude and timing of inbreeding depression in plants. Evolution 50, 54–70. doi: 10.1111/j.1558-5646.1996.tb04472.x
Iijima, H., and Shibuya, M. (2010). Evaluation of suitable conditions for natural regeneration of Picea jezoensis on fallen logs. J. For. Res. 15, 46–54. doi: 10.1007/s10310-009-0133-9
Kalisz, S., Nason, J. D., Hanzawa, F. M., and Tonsor, S. J. (2001). Spatial population genetic structure in Trillium grandiflorum: the roles of dispersal, mating, history, and selection. Evolution 55, 1560–1568. doi: 10.1111/j.0014-3820.2001.tb00675.x
Kitamura, K., Shimada, K., Nakashima, K., and Kawano, S. (1997). Demographic genetics of Japanese beech, Fagus crenata, at the Ogawa Forest Preserve, Ibaraki, central Honshu, Japan. II. Genetic substructuring among size-classes in local populations. Plant Species Biol. 12, 137–155. doi: 10.1111/j.1442-1984.1997.tb00163.x
Kitamura, K., Takasu, H., Hagiwara, S., Homma, K., O’Neill, J., Whigham, D. F., et al. (2008). Demographic genetics of American Beech (Fagus grandifolia Ehrh.) IV. Development of genetic variability and gene flow during succession in a Coastal Plain forest in Maryland. Plant Species Biol. 23, 159–173. doi: 10.1111/j.1442-1984.2008.00228.x
Kubota, Y., Konno, Y., and Hiura, T. (1994). Stand structure and growth patterns of understorey trees in a coniferous forest, Taisetsuzan National Park, northern Japan. Ecol. Res. 9, 333–341. doi: 10.1007/BF02348420
Lian, C., Goto, S., Kubo, T., Takahashi, Y., Nakagawa, M., and Hogetsu, T. (2008). Nuclear and chloroplast microsatellite analysis of Abies sachalinensis regeneration on fallen logs in a subboreal forest in Hokkaido, Japan. Mol. Ecol. 17, 2948–2962. doi: 10.1111/j.1365-294X.2008.03802.x
Loiselle, B. A., Sork, V. L., Nason, J., and Graham, C. (1995). Spatial genetic structure of a tropical understory shrub, Psychotria officinalis (Rubiaceae). Am. J. Bot. 82, 1420–1425. doi: 10.2307/2445869
Lourmas, M., Kjellberg, F., Dessard, H., Joly, H. I., and Chevallier, M.-H. (2007). Reduced density due to logging and its consequences on mating system and pollen flow in the African mahogany Entandrophragma cylindricum. Heredity 99, 151–160. doi: 10.1038/sj.hdy.6800976
Marshall, T. C., Slate, J., Kruuk, L. E. B., and Pemberton, J. M. (1998). Statistical confidence for likelihood-based paternity inference in natural populations. Mol. Ecol. 7, 639–655. doi: 10.1046/j.1365-294x.1998.00374.x
Maruyama, R., Maruyama, M., and Konno, Y. (2004). Effects of understory vegetation and litter on the establishment of Abies sachalinensis and Picea jezoensis seedlings in a conifer forest in Hokkaido, northern Japan. Jpn. J. Ecol. 54, 105–116.
McCullough, H. A. (1948). Plant succession on fallen logs in a virgin spruce-fir forest. Ecology 29, 508–513. doi: 10.2307/1932645
Meirmans, P. G., and Van Tienderen, P. H. (2004). GENOTYPE and GENODIVE: two programs for the analysis of genetic diversity of asexual organisms. Mol. Ecol. Notes 4, 792–794. doi: 10.1111/j.1471-8286.2004.00770.x
Michalakis, Y., and Excoffier, L. (1996). A generic estimation of population subdivision using distances between alleles with special reference for microsatellite loci. Genetics 142, 1061–1064.
Nakagawa, M., Kurahashi, A., and Hogetsu, T. (2003). The regeneration characteristics of Picea jezoensis and Abies sachalinensis on cut stumps in the sub-boreal forests of Hokkaido Tokyo University Forest. Forest Ecol. Manag. 180, 353–359. doi: 10.1016/S0378-1127(02)00654-0
Nakagawa, M., Kurahashi, A., Kaji, M., and Hogetsu, T. (2001). The effects of selection cutting on regeneration of Picea jezoensis and Abies sachalinensis in the sub-boreal forests of Hokkaido, northern Japan. Forest Ecol. Manag. 146, 15–23. doi: 10.1016/S0378-1127(00)00445-X
Nakamura, T. (1992). Effect of bryophytes on survival of conifer seedlings in subalpine forests of central Japan. Ecol. Res. 7, 155–162. doi: 10.1007/BF02348494
Narukawa, Y., Iida, S., Tanouchi, H., Abe, S., and Yamamoto, S. (2003). State of fallen logs and the occurrence of conifer seedlings and saplings in boreal and subalpine old-growth forests in Japan. Ecol. Res. 18, 267–277. doi: 10.1046/j.1440-1703.2003.00553.x
Oddou-Muratorio, S., and Klein, E. K. (2008). Comparing direct vs. indirect estimates of gene flow within a population of a scattered tree species. Mol. Ecol. 17, 2743–2754. doi: 10.1111/j.1365-294X.2008.03783.x
Okada, M., Kitamura, K., Lian, C., and Goto, S. (2015). The effects of multilocus heterozygosity on the longevity of seedlings established on fallen logs in Picea jezoensis and Abies sachalinensis. Open J. For. 5, 422–430. doi: 10.4236/ojf.2015.54036
Pfeiffer, A., Olivieri, A. M., and Morgante, M. (1997). Identification and characterization of microsatellites in Norway spruce (Picea abies K.). Genome 40, 411–419. doi: 10.1139/g97-055
Pritchard, J. K., Stephens, M., and Donnelly, P. (2000). Inference of population structure using multilocus genotype data. Genetics 155, 945–959.
Raymond, M., and Rousset, F. (1995). GENEPOP (version 1.2): population genetics software for exact tests and ecumenicism. J. Hered. 86, 248–249. doi: 10.1093/oxfordjournals.jhered.a111573
Sato, T., Isagi, Y., Sakio, H., Osumi, K., and Goto, S. (2006). Effect of gene flow on spatial genetic structure in the riparian canopy tree Cercidiphyllum japonicum revealed by microsatellite analysis. Heredity 96, 79–84. doi: 10.1038/sj.hdy.6800748
Schroeder, J. W., Tran, H. T., and Dick, C. W. (2014). Fine scale spatial genetic structure in Pouteria reticulata (Engl.) Eyma (Sapotaceae), a dioecious, vertebrate dispersed tropical rain forest tree species. Global Ecol. Conserv. 1, 43–49. doi: 10.1016/j.gecco.2014.07.002
Scotti, I., Magni, F., Paglia, G., and Morgante, M. (2002). Trinucleotide microsatellites in Norway spruce (Picea abies): their features and the development of molecular markers. Theor. App. Genet. 106, 40–50. doi: 10.1007/s00122-002-0986-1
Suzuki, E., Ota, K., Igarashi, T., and Fujiwara, K. (1987). Regeneration process of coniferous forests in northern Hokkaido. I. Abies sachalinenesis forest and Picea glehnii forest. Ecol. Res. 2, 61–75. doi: 10.1007/BF02348620
Takahashi, M., Sakai, Y., Ootomo, R., and Shiozaki, M. (2000). Establishment of tree seedlings and water-soluble nutrients in coarse woody debris in an old-growth Picea-Abies forest in Hokkaido, northern Japan. Can. J. Forest Res. 30, 1148–1155. doi: 10.1139/x00-042
Uchiyama, K., Goto, S., Tsuda, Y., Takahashi, Y., and Ide, Y. (2006). Genetic diversity and genetic structure of adult and buried seed populations of Betula maximowicziana in mixed and post-fire stands. For. Ecol. Manage. 237, 119–126. doi: 10.1016/j.foreco.2006.09.037
Ueno, S., Tomaru, N., Yoshimaru, H., Manabe, T., and Yamamoto, S. (2002). Size-class differences in genetic structure and individual distribution of Camellia japonica L. in a Japanese old-growth evergreen forest. Heredity 89, 120–126. doi: 10.1038/sj.hdy.6800111
Vekemans, X., and Hardy, O. J. (2004). New insights from fine-scale spatial genetic structure analyses in plant populations. Mol. Ecol. 13, 921–935. doi: 10.1046/j.1365-294X.2004.02076.x
Keywords: coarse woody debris, demographic genetics, kinship, microsatellite, safe-site, seed dispersal, sub-boreal forest
Citation: Kitamura K, Nakanishi A, Lian C and Goto S (2018) Distinctions in Fine-Scale Spatial Genetic Structure Between Growth Stages of Picea jezoensis Carr. Front. Genet. 9:490. doi: 10.3389/fgene.2018.00490
Received: 01 May 2018; Accepted: 01 October 2018;
Published: 24 October 2018.
Edited by:
Jordi López-Pujol, Consejo Superior de Investigaciones Científicas (CSIC), SpainReviewed by:
Myong Gi Chung, Gyeongsang National University, South KoreaYessica Rico, Instituto de Ecología (INECOL), Mexico
Katharina Birgit Budde, INRA UMR1202 Biodiversité Gènes et Communautés, France
Copyright © 2018 Kitamura, Nakanishi, Lian and Goto. This is an open-access article distributed under the terms of the Creative Commons Attribution License (CC BY). The use, distribution or reproduction in other forums is permitted, provided the original author(s) and the copyright owner(s) are credited and that the original publication in this journal is cited, in accordance with accepted academic practice. No use, distribution or reproduction is permitted which does not comply with these terms.
*Correspondence: Susumu Goto, Z290b3NAdWYuYS51LXRva3lvLmFjLmpw