- 1Department of Clinical Chinese Pharmacy, School of Chinese Materia Medica, Beijing University of Chinese Medicine, Beijing, China
- 2Evidence Based Medicine Center, School of Basic Medical Sciences, Lanzhou University, Lanzhou, China
- 3Key Laboratory of Evidence Based Medicine and Knowledge Translation of Gansu Province, Lanzhou, China
- 4Beijing Institute of Traditional Chinese Medicine, Beijing University of Chinese Medicine, Beijing, China
Background and Objective: Non-small cell lung cancer (NSCLC) accounts for 80–85% of all patients with lung cancer and 5-year relative overall survival (OS) rate is less than 20%, so that identifying novel diagnostic and prognostic biomarkers is urgently demanded. The present study attempted to identify potential key genes associated with the pathogenesis and prognosis of NSCLC.
Methods: Four GEO datasets (GSE18842, GSE19804, GSE43458, and GSE62113) were obtained from the Gene Expression Omnibus (GEO) database. The differentially expressed genes (DEGs) between NSCLC samples and normal ones were analyzed using limma package, and RobustRankAggreg (RRA) package was used to conduct gene integration. Moreover, Search Tool for the Retrieval of Interacting Genes database (STRING), Cytoscape, and Molecular Complex Detection (MCODE) were utilized to establish protein–protein interaction (PPI) network of these DEGs. Furthermore, functional enrichment and pathway enrichment analyses for DEGs were performed by Funrich and OmicShare. While the expressions and prognostic values of top genes were carried out through Gene Expression Profiling Interactive Analysis (GEPIA) and Kaplan Meier-plotter (KM) online dataset.
Results: A total of 249 DEGs (113 upregulated and 136 downregulated) were identified after gene integration. Moreover, the PPI network was established with 166 nodes and 1784 protein pairs. Topoisomerase II alpha (TOP2A), a top gene and hub node with higher node degrees in module 1, was significantly enriched in mitotic cell cycle pathway. In addition, Interleukin-6 (IL-6) was enriched in amb2 integrin signaling pathway. The mitotic cell cycle was the most significant pathway in module 1 with the highest P-value. Besides, five hub genes with high degree of connectivity were selected, including TOP2A, CCNB1, CCNA2, UBE2C, and KIF20A, and they were all correlated with worse OS in NSCLC. Conclusion: The results showed that TOP2A, CCNB1, CCNA2, UBE2C, KIF20A, and IL-6 may be potential key genes, while the mitotic cell cycle pathway may be a potential pathway contribute to progression in NSCLC. Further, it could be used as a new biomarker for diagnosis and to direct the synthesis medicine of NSCLC.
Introduction
Lung cancer is the crucial cause of cancer-related mortality in China and worldwide. In 2016, the number of patients newly diagnosed with lung cancer will be 224 000, and over 158 000 will die from it in the United States alone (Torre et al., 2016; Sperduto et al., 2017). Non-small cell lung cancer (NSCLC) accounts for 80–85% of all patients with lung cancer, which is also the most malignant carcinoma among men and women, with an incidence higher than the combined incidence of breast, cervical, and colorectal cancers (Spiro and Porter, 2002; Maher et al., 2012). Although prominent progress in early diagnosis and treatment methods, 5-year relative overall survival (OS) rate is less than 20% (Boolell et al., 2015; Lin et al., 2018). For inoperable cancer patients and surgical patients chemotherapy remains the most important complementary treatment, and platinum is mild in the treatment of advanced NSCLC (Song et al., 2014). However, the adverse drug reactions are getting worse and drug resistance has also been emerging. Therefore, the novel strategies are urgently needed to supplement traditional chemotherapy (Lu et al., 2018). Over the past decades, our understanding of the molecular characterization of cancer has increased though genomic medicine. The treatment strategy for advanced NSCLC has changed from the traditional chemotherapy based on histopathology to individualized precision treatment based on carcinogenic factors (Jin et al., 2018). Zhu et al indicated that MTA1 might be a momentous biomarker in the diagnosis of NSCLC. (Zhu et al., 2017) Some studies revealed that high expression of IGF-1R and loss of PTEN were associated with poor prognosis in NSCLC. (Zhao J. et al., 2017; Zhao Y. et al., 2017) Although biomarkers and therapeutic targets found in NSCLC have made a great contribution to improving the diagnosis and treatment of NSCLC, due to the biological complexity and poor prognosis of NSCLC, more genetic information remains urgently needed to provide reference for precision medical treatment (Riess et al., 2018; Xu et al., 2018).
In order to explore common biomarkers associated with cancer and direct drugs for cancer treatment, diagnosis and prognosis, more and more microarray and high throughput sequencing technologies on cancer have been released in recent years (Kulasingam and Diamandis, 2008; Matamala et al., 2015; Lusito et al., 2018; Zhang et al., 2018). Meanwhile, in order to overcome the limited or inconsistent results caused by the application of different technological platforms or a small sample size, integrated bioinformatics methods have been applied in cancer research and a vast range of valuable biological information has been uncovered (Chang et al., 2015; Lee et al., 2015; Sun M. et al., 2017; Li et al., 2018).
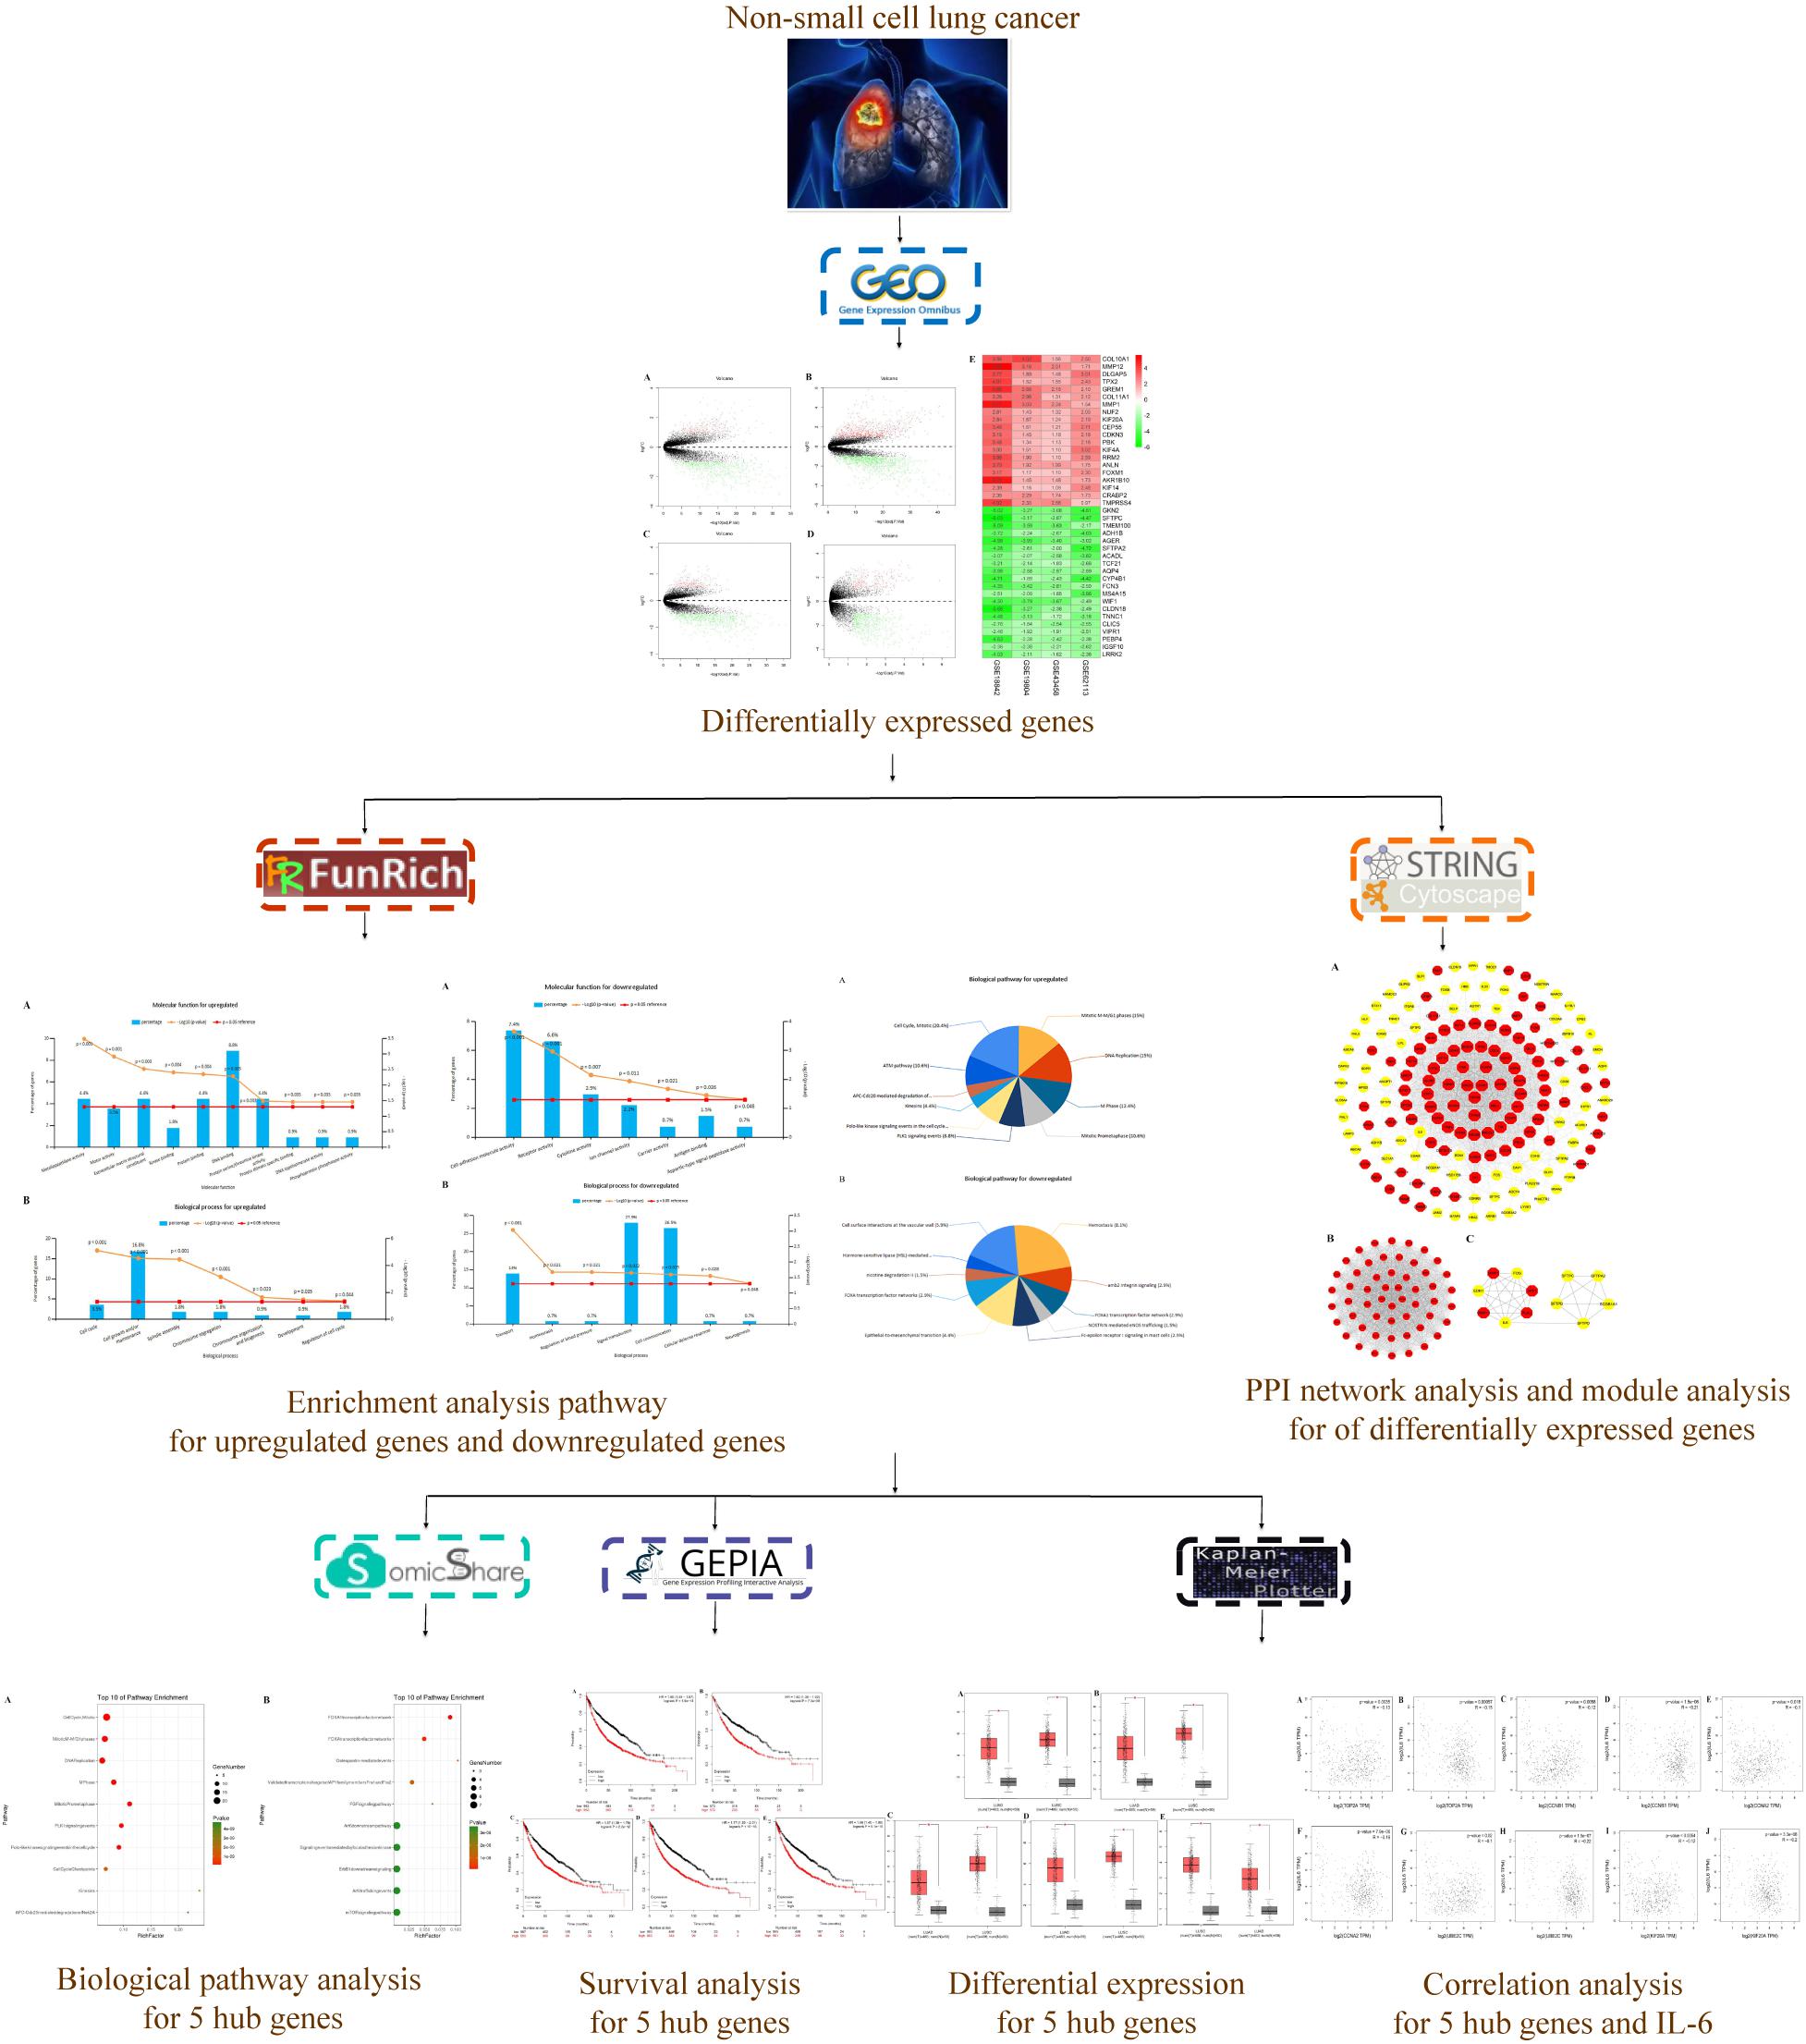
The microarray data of GSE18842 (Sanchez-Palencia et al., 2011), GSE19804 (Lu et al., 2010), GSE43458 (Kabbout et al., 2013), and GSE62113 (Li et al., 2014) were applied to identify the differentially expressed genes (DEGs) between NSCLC tissues and normal ones utilizing a bioinformatics approach. In addition, a protein–protein interaction (PPI) network of 166 hub genes and two modules was established. Meanwhile, five significant genes were found to be associated with OS in NSCLC via Kaplan Meier-plotter online database. Besides, enrichment analyses were performed for DEGs. The present study aimed to identify key genes associated with the pathogenesis and prognosis of NSCLC from new insights. The workflow of this study was shown in Figure 1.
Materials and Methods
Gene Expression Profile Data
The gene expression profile data (GSE18842, GSE19804, GSE43458, and GSE62113) were obtained from Gene Expression Omnibus (GEO1) (Schminke et al., 2015). All included datasets met the following criteria: (1) they employed tissue samples gathered from human NSCLC and corresponding adjacent or normal tissues. (2) they included at least 10 samples. (3) all the studies on these datasets were published in English language.
Integrated Analysis of Microarray Datasets
Limma package (Ritchie et al., 2015) in R/Bioconductor software was applied to perform the normalization and log2 conversion for the matrix data of each GEO dataset, and the DEGs in every microarray were also screened by the limma package. Gene integration for the DEGs identified from the four datasets was conducted employing RobustRankAggreg (Kolde et al., 2012). | log2FC|≥ 1 and adjust P-value < 0.05 were considered statistically significant for the DEGs.
Functional Enrichment Analysis
FunRich is a stand-alone software tool used mainly for functional enrichment and interaction network analysis of genes and proteins (Pathan et al., 2017). The functional enrichment analysis for the upregulated and downregulated DEGs, which included molecular function (MF), biological process (BP), cellular component (CC), and biological pathway (BPA), was performed via FunRich in the present study. The results of the functional enrichment analysis were visualized via OmicShare platform2 (OmicShare, 2018).
PPI Network and Module Analysis
The Search Tool for the Retrieval of Interacting Genes database (STRING)3 provides information regarding the predicted and experimental interactions of proteins (Szklarczyk et al., 2015). In the present study, the DEGs were mapped into PPIs and a combined score of ≥0.4 was used as the cut-off value. Moreover, the use of Cytoscape software (version 3.6.0) was to construct PPI networks (Shannon et al., 2003). The network module was one of the characteristics of the protein network and may contain specific biological significance. The Cytoscape plug-in Molecular Complex Detection (MCODE) was applied to detect notable modules in this PPI network (Bader and Hogue, 2003). Degree cutoff = 2, Node Score Cutoff = 0.2, and K-Core = 2 were set as the advanced options. Next, the enrichment analysis of the DEGs in different modules was also conducted by the Funrich software.
Survival Analysis of Hub Genes
Kaplan Meier-plotter (KM plotter4) could assess the effect of 54675 genes on survival using 10,461 cancer samples (Lánczky et al., 2016; Szász et al., 2016). The aim is to estimate the time of death, an event that will eventually occur in each person, which may have important effects when using these estimates to inform clinical decisions, health care policies and resource allocation (Lacny et al., 2018). The relapse free and OS information were based on GEO (Affymetrix microarrays only), EGA and TCGA database. The hazard ratio (HR) with 95% confidence intervals and log rank P-value were calculated and showed on the plot (Sun C. et al., 2017).
Expression Level Analysis and Correlation Analysis of the Hub Genes
The Gene Expression Profiling Interactive Analysis (GEPIA)5 is a newly web-based tool for gene expression analysis between the tumor and normal data from the Cancer Genome Atlas (TCGA) and the Genotype-Tissue Expression (GTEx), applying a standard processing pipeline (Tang et al., 2017). It provides customizable functions such as tumor and normal differential expression analysis, and we could demonstrate the expression of hub genes in NSCLC tissues and normal ones. Then the boxplot was performed to visualize the relationship (Sun C. et al., 2017). Correlation analysis performs pairwise gene correlation analysis for any given sets of TCGA and/or GTEx expression data and check the relative ratios between two genes (Tang et al., 2017).
Results
Gene Expression Profile Data
There were 197 NSCLC samples and 154 normal samples in this study (Table 1 and Supplementary Table S1). In all, 249 genes (113 upregulated and 136 downregulated genes) were identified as DEGs in the NSCLC samples compared with the normal ones (Figures 2A–D and Supplementary Table S2). According to the cut-off criteria, we screened the top 20 differentially expressed upregulated and downregulated genes (Figure 2E).
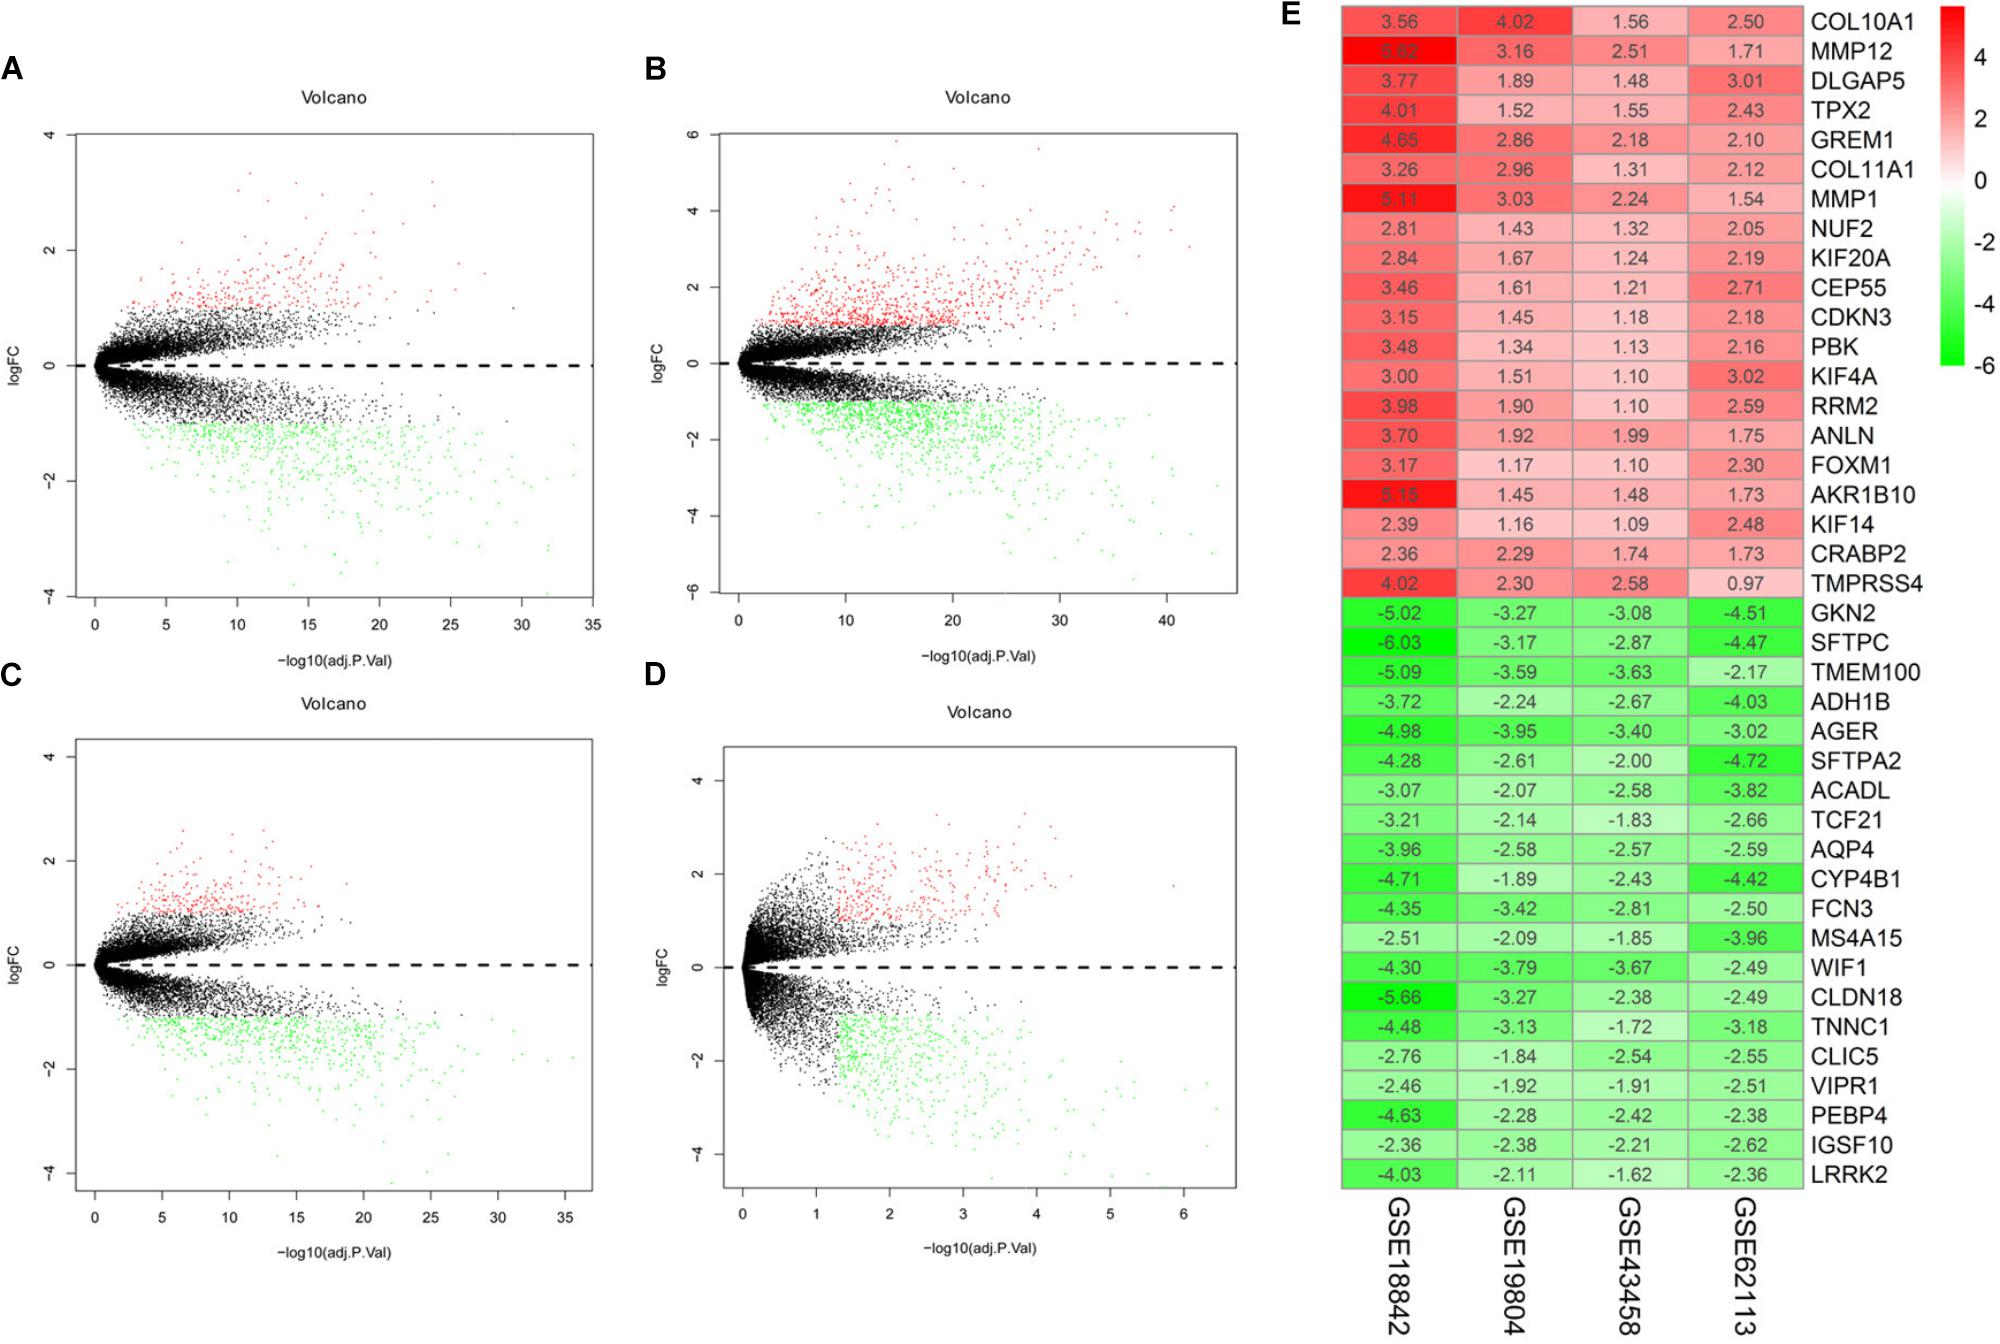
FIGURE 2. Volcano plot of gene expression profile data in NSCLC samples and normal ones and heat map of differentially expressed gene (DEGs). (A) Volcano plot of GSE19804, (B) volcano plot of GSE18842, (C) volcano plot of GSE43458, (D) volcano plot of GSE62113, and (E) heat map of differentially expressed genes. Green represents a lower expression level, red represents higher expression levels and white represents that there is no different expression amongst the genes. Each column represents one dataset and each row represents one gene. The number in each rectangle represents the normalized gene expression level. The gradual color ranged from green to red represents the changing process from down-regulation to up-regulation.
Enrichment Analyses
Enrichment analyses for the upregulated and downregulated DEGs after gene integration were performed via Funrich. The functional enrichment terms of upregulated DEGs were mainly associated with the metallopeptidase activity, cell communication and cell growth and/or maintenance (Figures 3A,B and Supplementary Table S3). The downregulated DEGs were mainly enriched in the cell adhesion molecule activity, receptor activity and transport (Figures 4A,B and Supplementary Table S3).
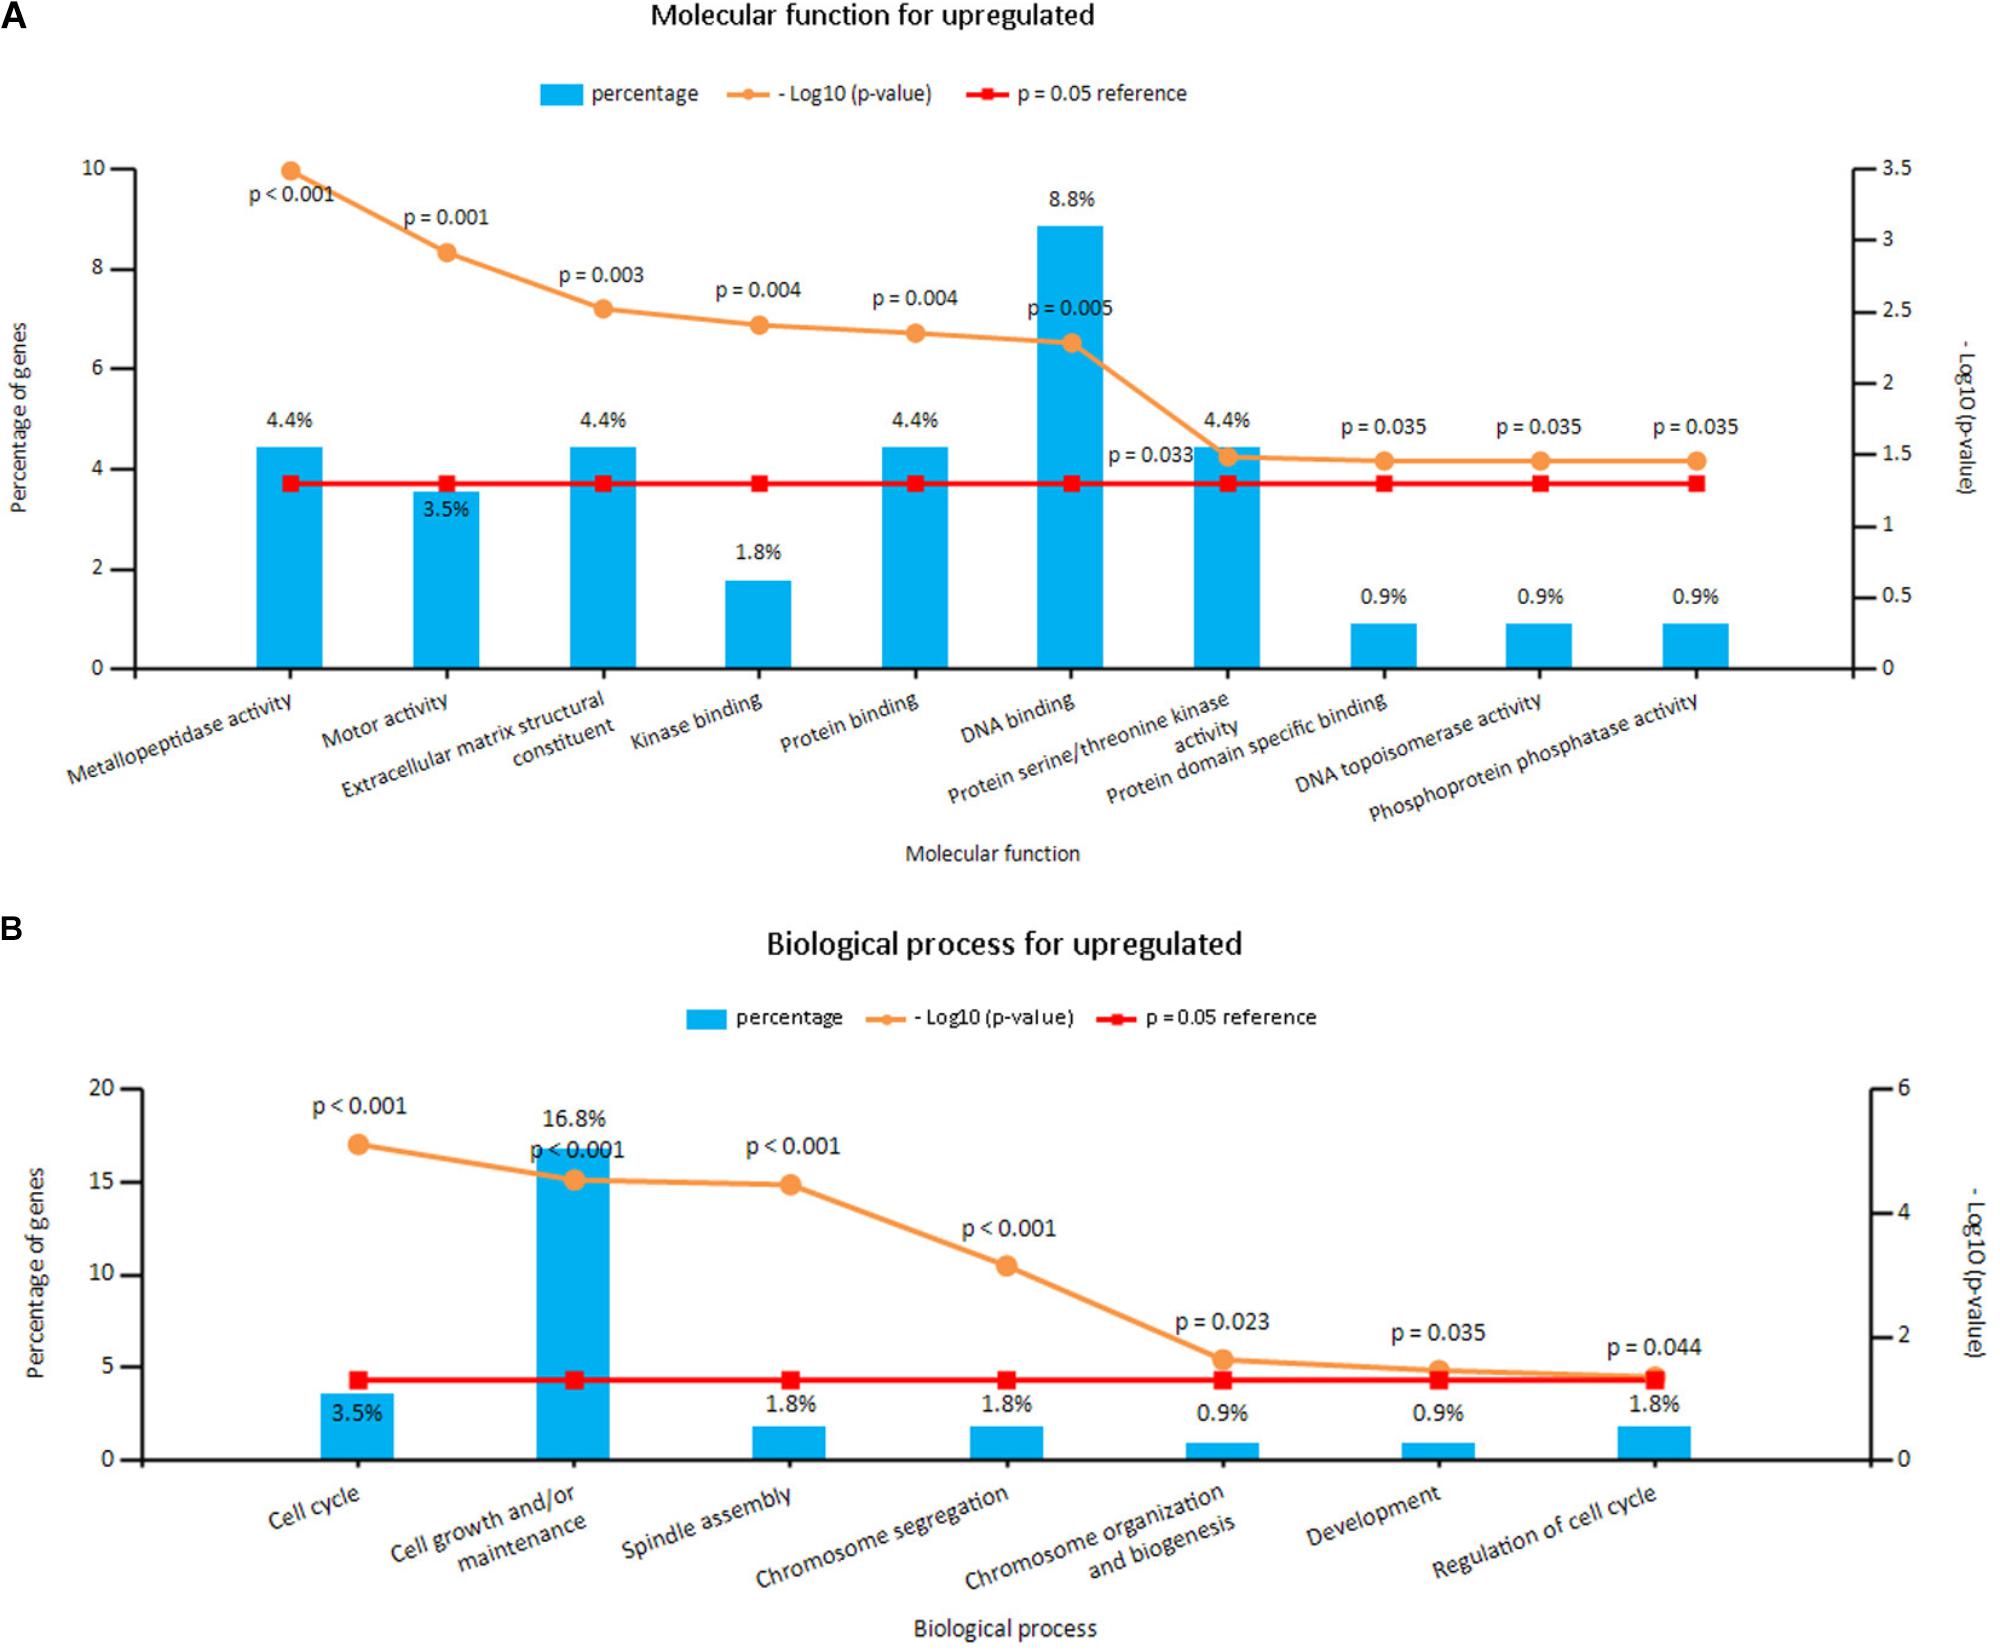
FIGURE 3. (A) Molecular function for upregulated genes, (B) biological process for upregulated genes. X axis represents molecular functions or biological processes; Y axis represents percentage of genes or –log10(P-value).
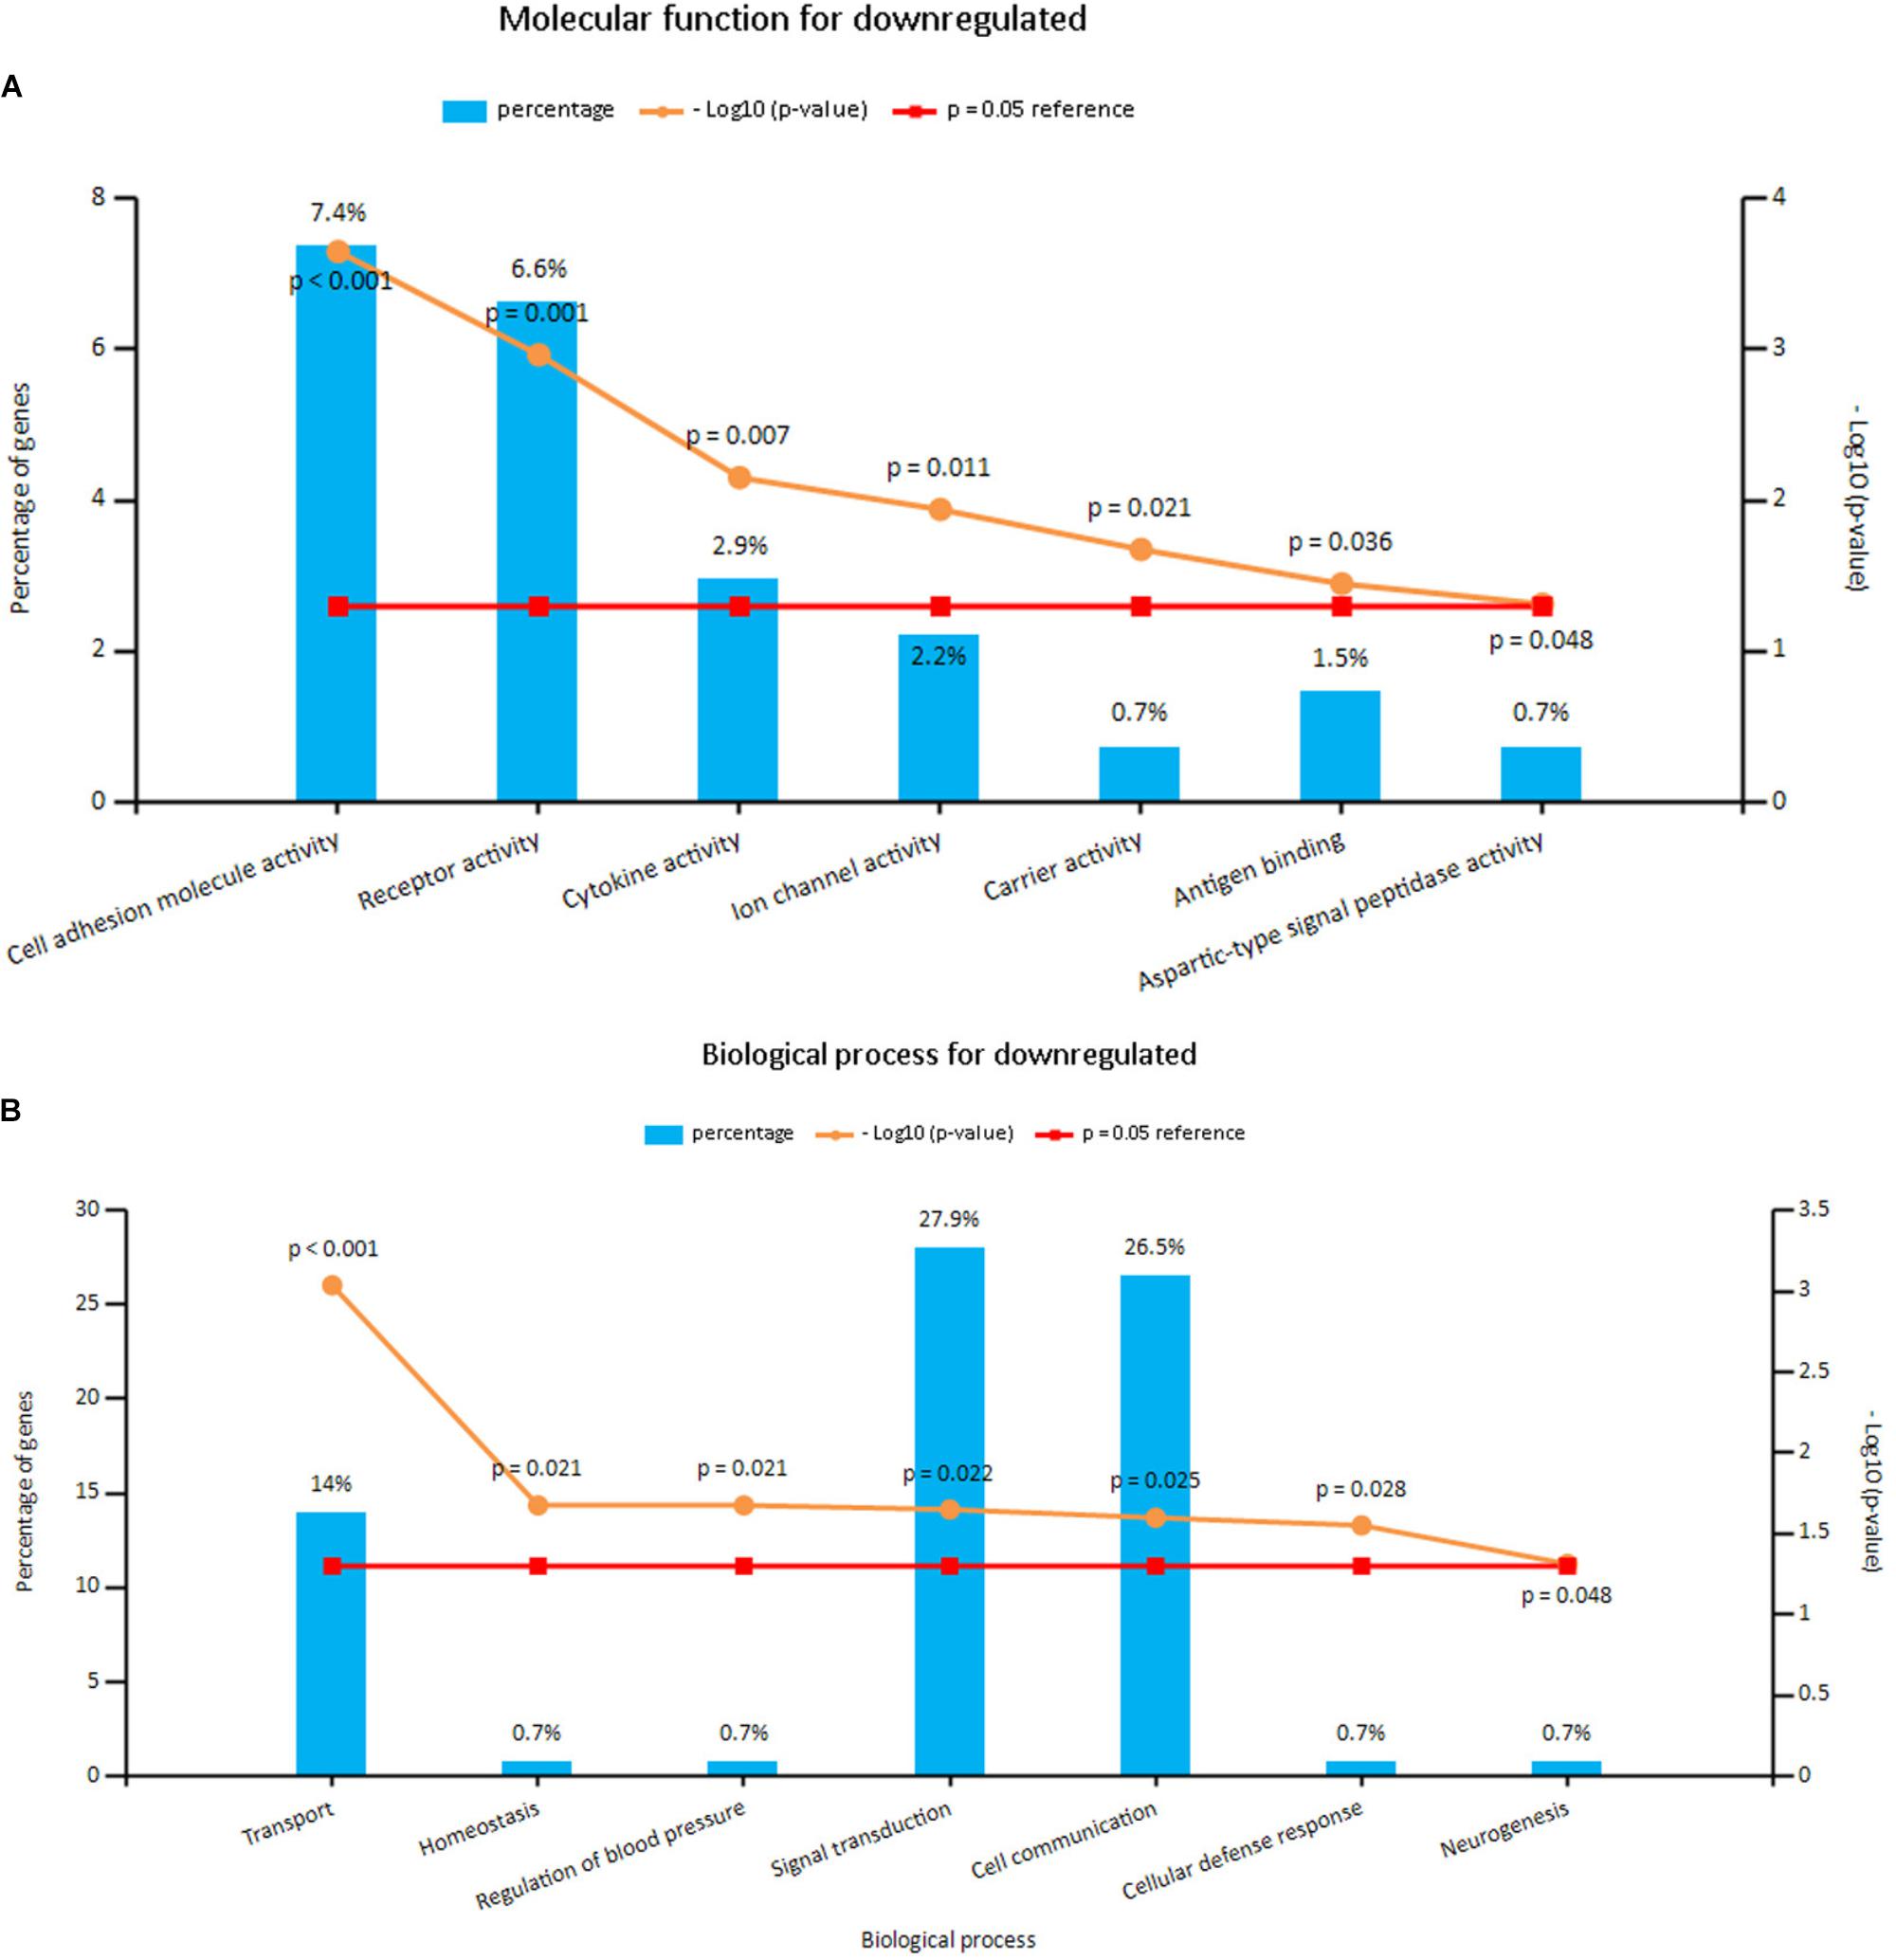
FIGURE 4. (A) Molecular function for downregulated genes, (B) biological process for downregulated genes. X axis represents molecular functions or biological processes; Y axis represents percentage of genes or –log10(P-value).
Three pathways that were particularly enriched by upregulated DEGs were mitotic cell cycle, DNA replication and mitotic M-M/G1 phases. Furthermore, a critical gene TOP2A was significantly enriched in mitotic cell cycle pathway, validated transcriptional targets of deltaNp63 isoforms pathway, p63 transcription factor network pathway, mitotic G1-G1/S phases pathway and G0 and early G1 pathway in biological pathway (BPA) enrichment analysis for upregulated genes. (Figure 5A and Supplementary Table S3).
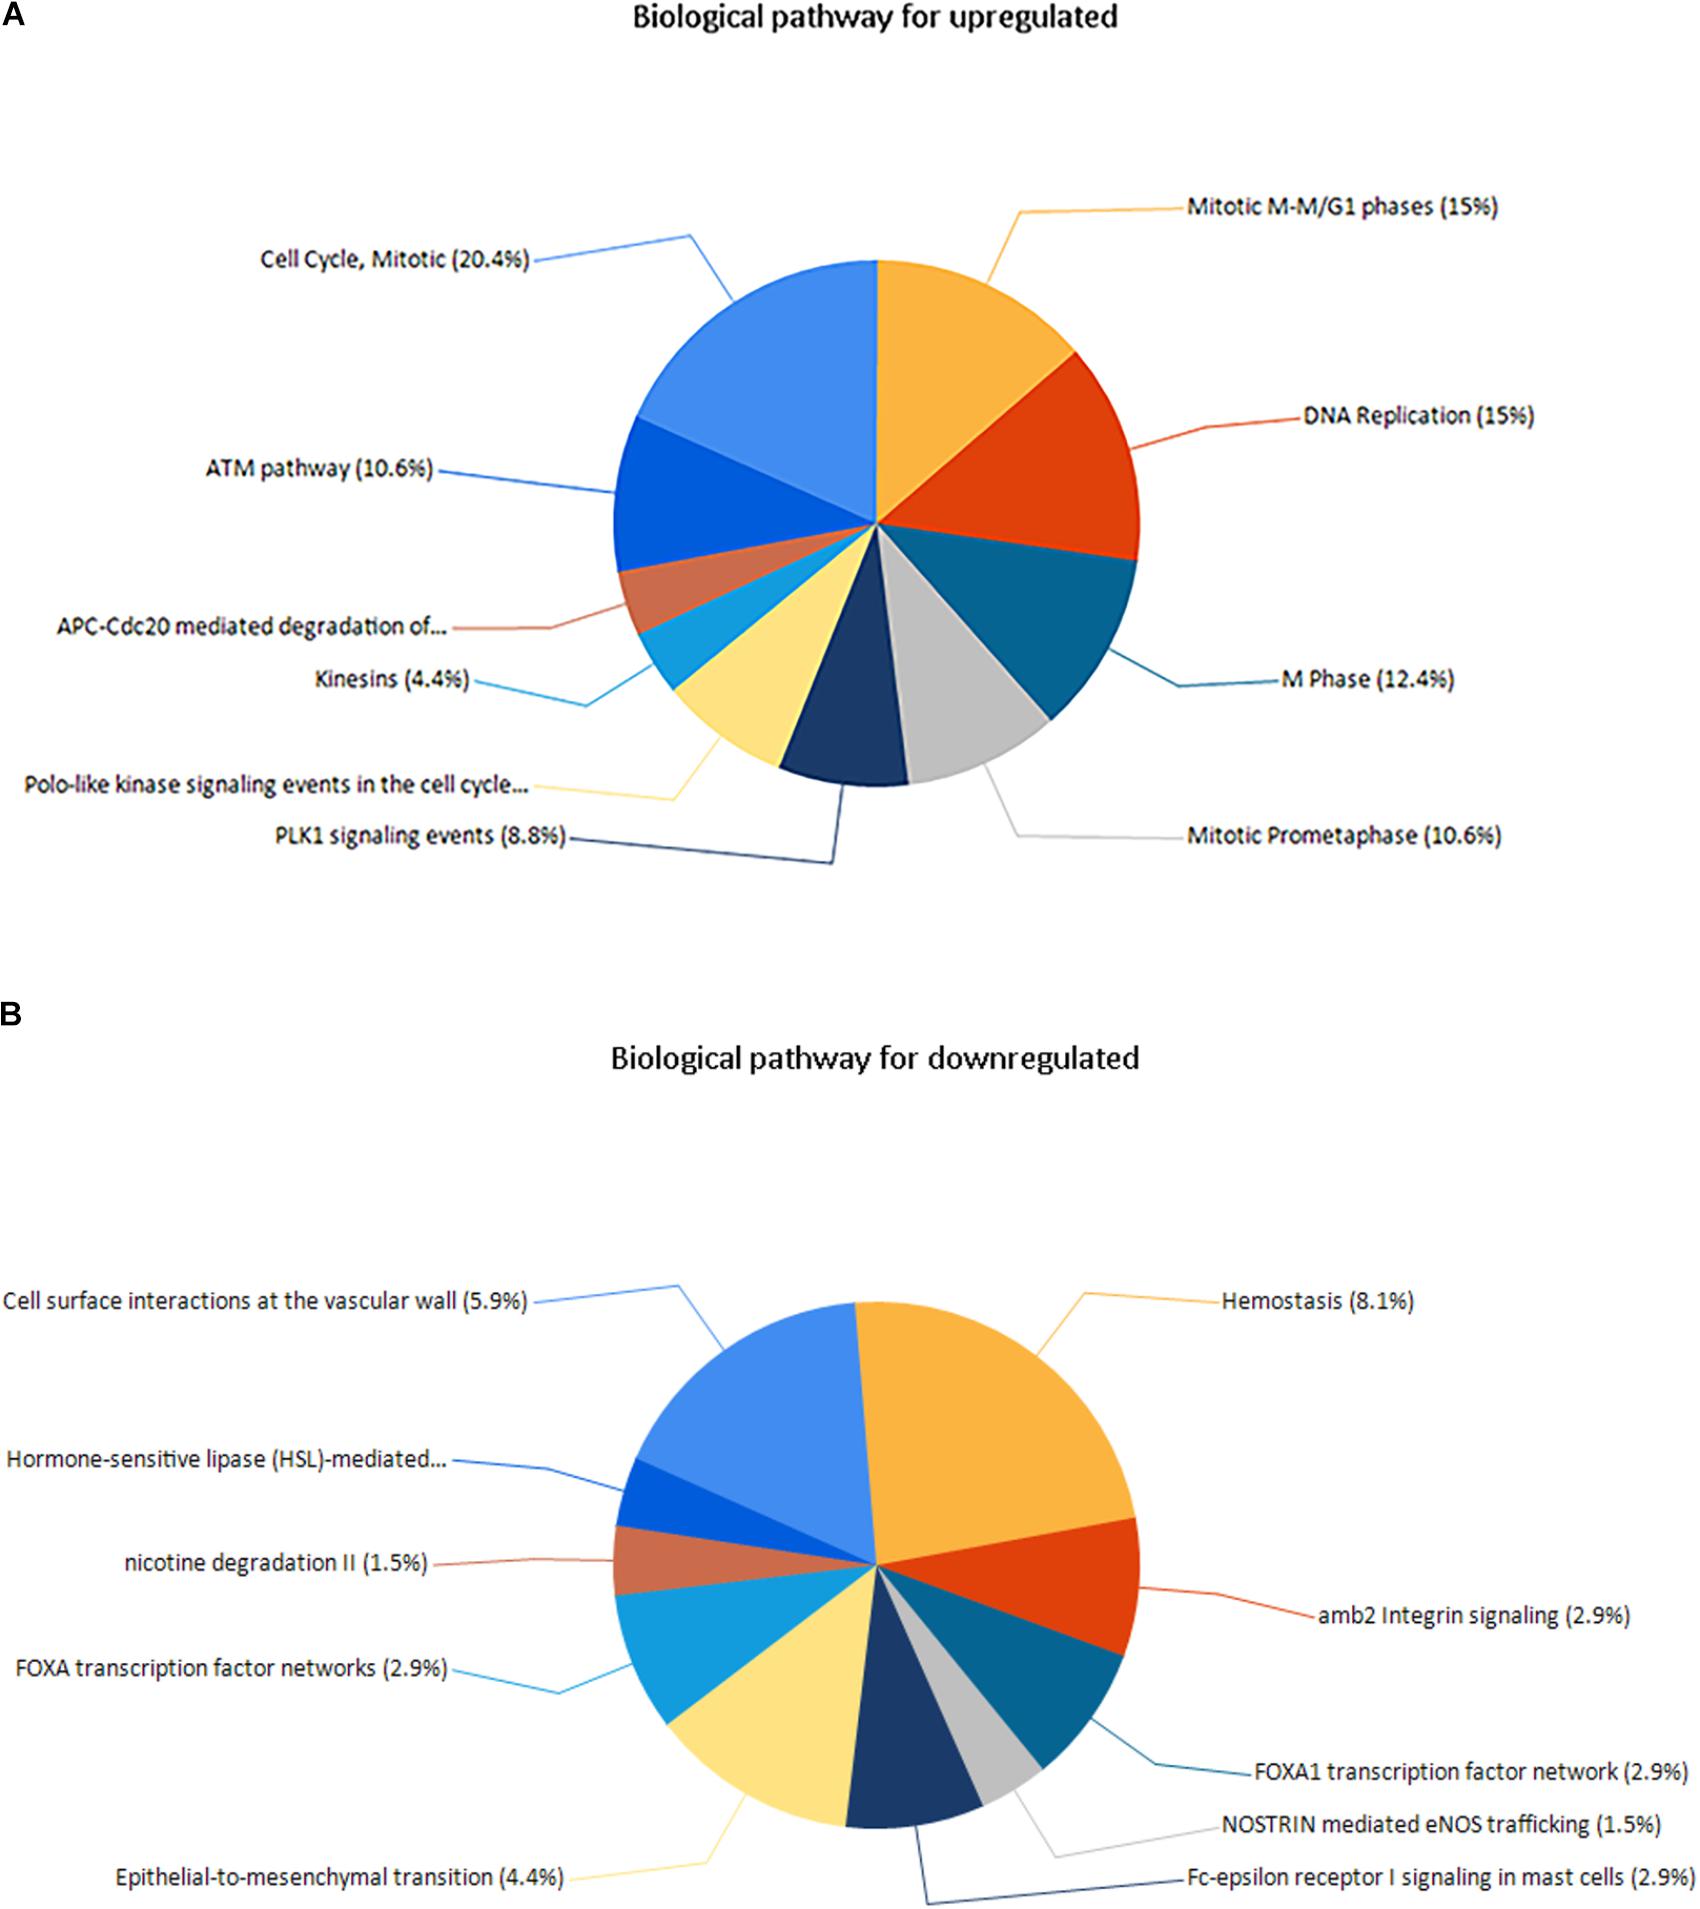
FIGURE 5. (A) Biological pathway for upregulated genes, (B) biological pathway for downregulated genes.
Downregulated DEGs were notably enriched in two pathways, including Hemostasis, cell surface interactions at the vascular wall and amb2 integrin signaling. However, a vital gene Interleukin-6 (IL-6) was significantly enriched in amb2 integrin signaling pathway, integrin family cell surface interactions pathway, glypican pathway and glucocorticoid receptor regulatory network pathway in BPA enrichment analysis for downregulated genes (Figure 5B and Supplementary Table S3).
PPI Network Analysis and Module Analysis
Based on the SRTING database, we made the PPI network of a total of 166 nodes and 1784 protein pairs were obtained with a combined score >0.4. As shown in Figure 6A and Supplementary Table S4, the majority of the nodes in the network were upregulated DEGs in NSCLC samples. In total, two modules (modules 1 and 2) with score >5 were detected by MCODE. As shown in Figures 6B,C, TOP2A, CCNB1, CCNA2, UBE2C, and KIF20A were hub nodes with higher node degrees in module 1, and IL-6, MMP1, SPP1, FOS, PLAU, EDN1, MMP13, and SFTPD were hub nodes in module 2. Besides, 5 hub genes with high degree of connectivity were selected (Table 2). Furthermore, module 1 and module 2 enrichment pathways were shown in Figure 7 and Supplementary Table S5, the mitotic cell cycle pathway was identified as the most significant pathway in module 1.
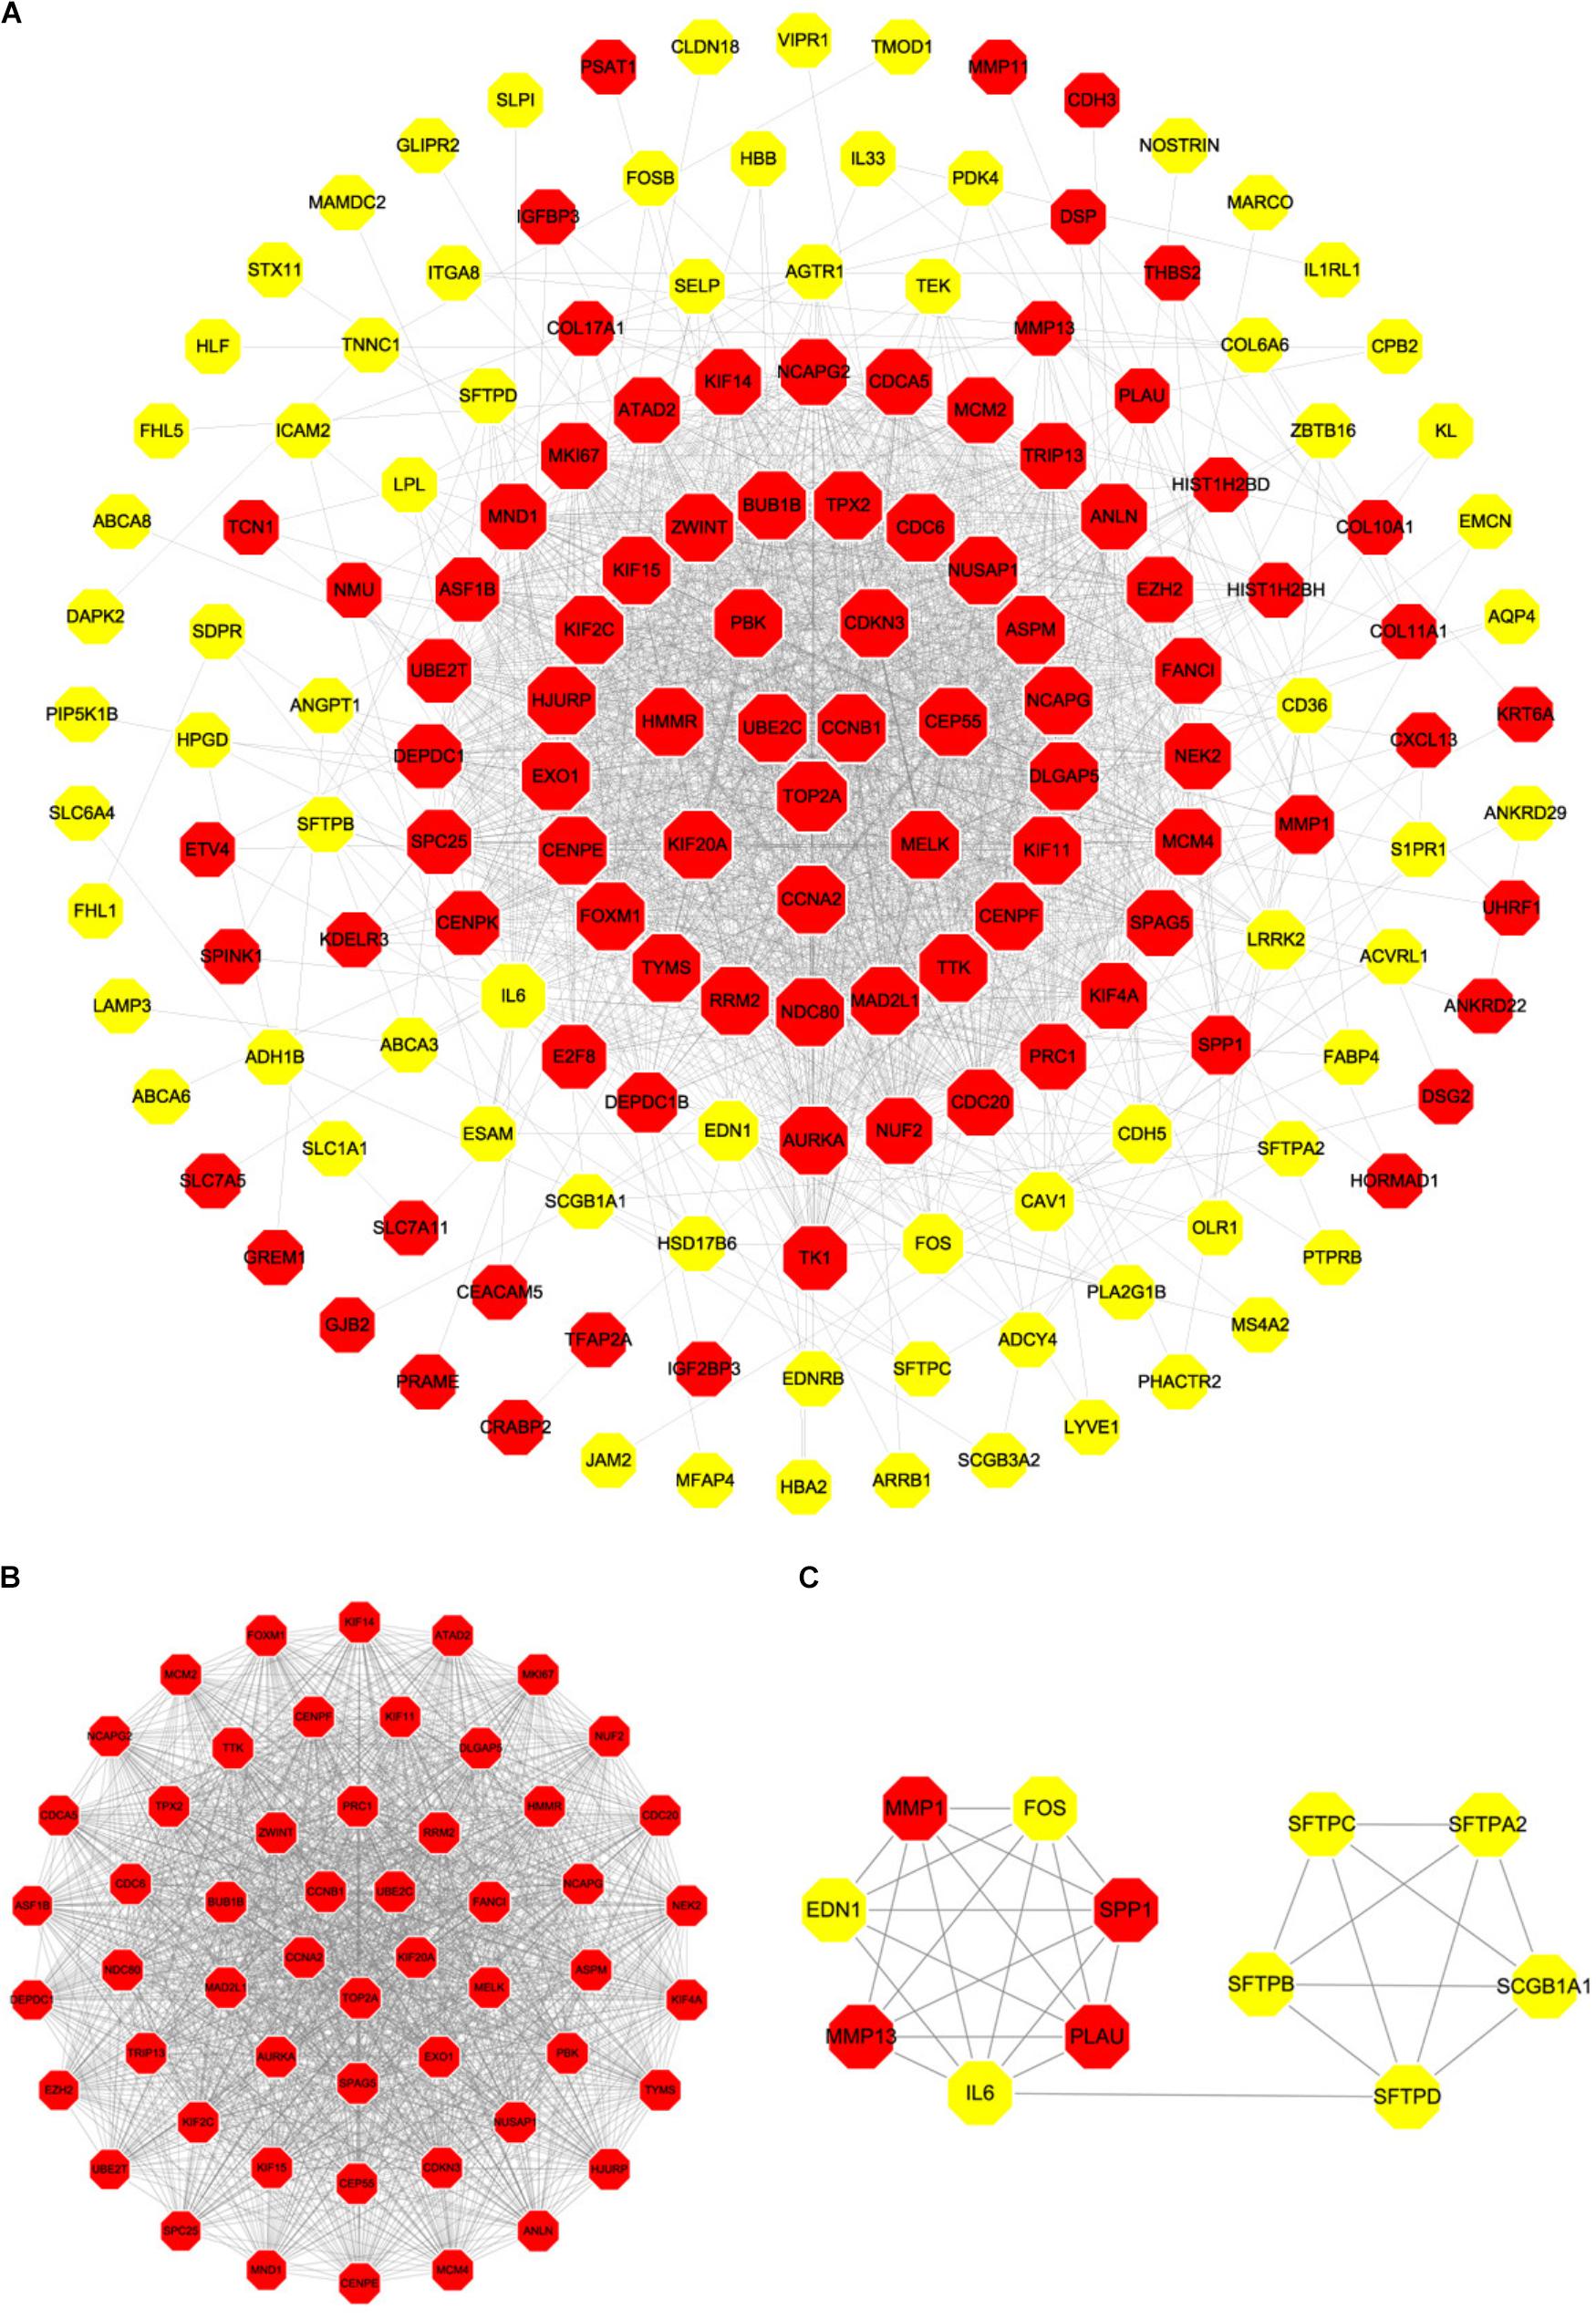
FIGURE 6. PPI network of differentially expressed genes in NSCLC samples compared with the control ones and two significant modules identified from the PPI network using the molecular complex detection method with a score of >5.0. Red nodes, upregulated genes; Yellow nodes, downregulated genes; (A) PPI network of differentially expressed genes in NSCLC samples compared with the control ones; (B) Module 1, MCODE score = 52.34; (C) Module 2, MCODE score = 5.63.
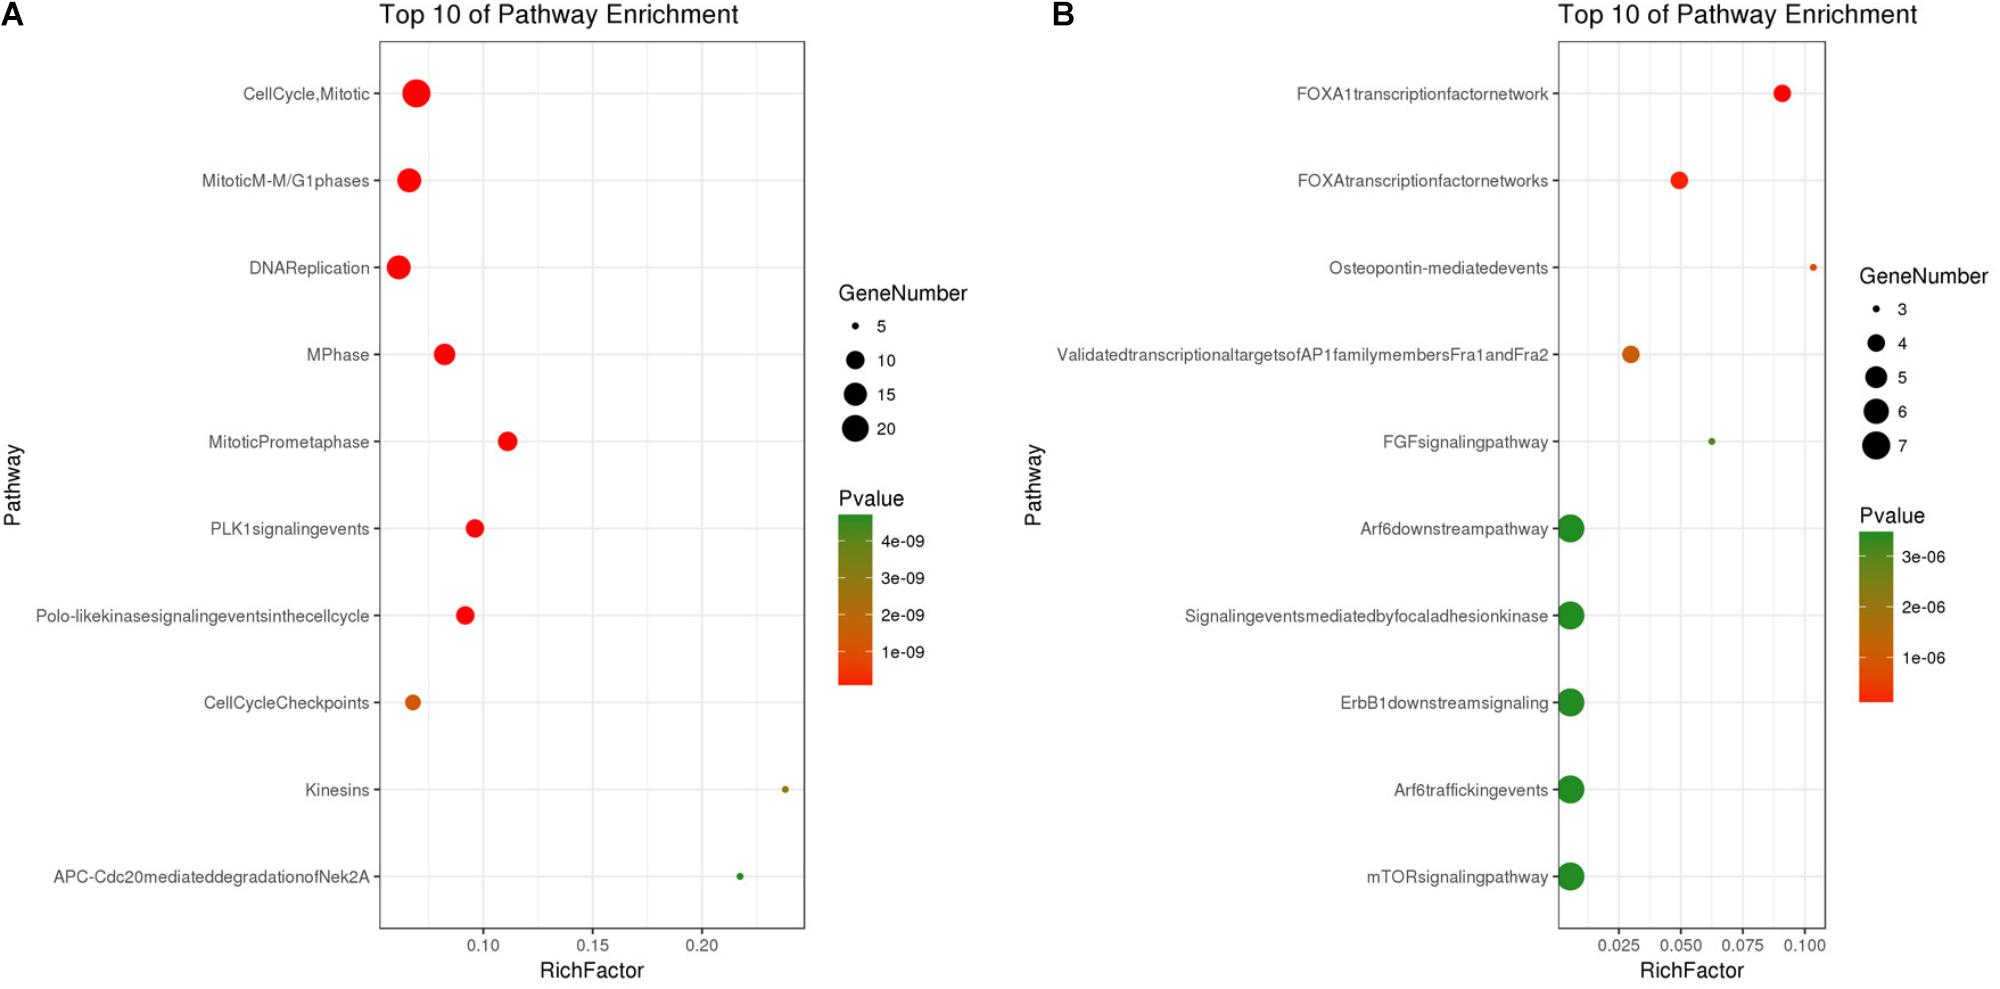
FIGURE 7. (A) Pathway analysis of Module 1; (B) Pathway analysis of Module 2. The y-axis shows significantly enriched pathways of Module 1 and Module 2, and the x-axis shows the Rich factor, P < 0.01, FDR < 0.01. Rich factor stands for the ratio of the number of target genes belonging to a pathway to the number of all the annotated genes located in the pathway. The higher Rich factor represents the higher level of enrichment. The size of the dot indicates the number of target genes in the pathway, and the color of the dot reflects the different P-value range.
The Kaplan Meier-Plotter and Expression Level of Hub Genes Correlation and Correlated Analysis
The prognostic information of the 5 hub genes was freely available in Kaplan Meier-plotter. It was found that high expression of TOP2A [HR 1.65 (1.45–1.87), P = 1.3e–14], CCNB1 [HR 1.63 (1.38–1.92), P = 7.3e–09], CCNA2 [HR 1.57 (1.39–1.79), P = 2.2e–12)], UBE2C [HR 1.77 (1.55–2.01), P < 1e–16], and KIF20A [HR 1.66 (1.46–1.89), P = 5.1e–15] was associated with worse OS for NSCLC patients. (Figure 8) Then, we applied GEPIA to catch the hub genes expression level between NSCLC tissues and normal ones, and Figure 9 reflected that compared with the normal ones, the 5 genes significantly increased expression levels in NSCLC tissues. The increase of 5 hub genes was interacted strongly with the decrease of IL-6 which was observed in the LUAD (Figures 10A,C,E,G,I) and LUSD (Figures 10B,D,F,H,J).
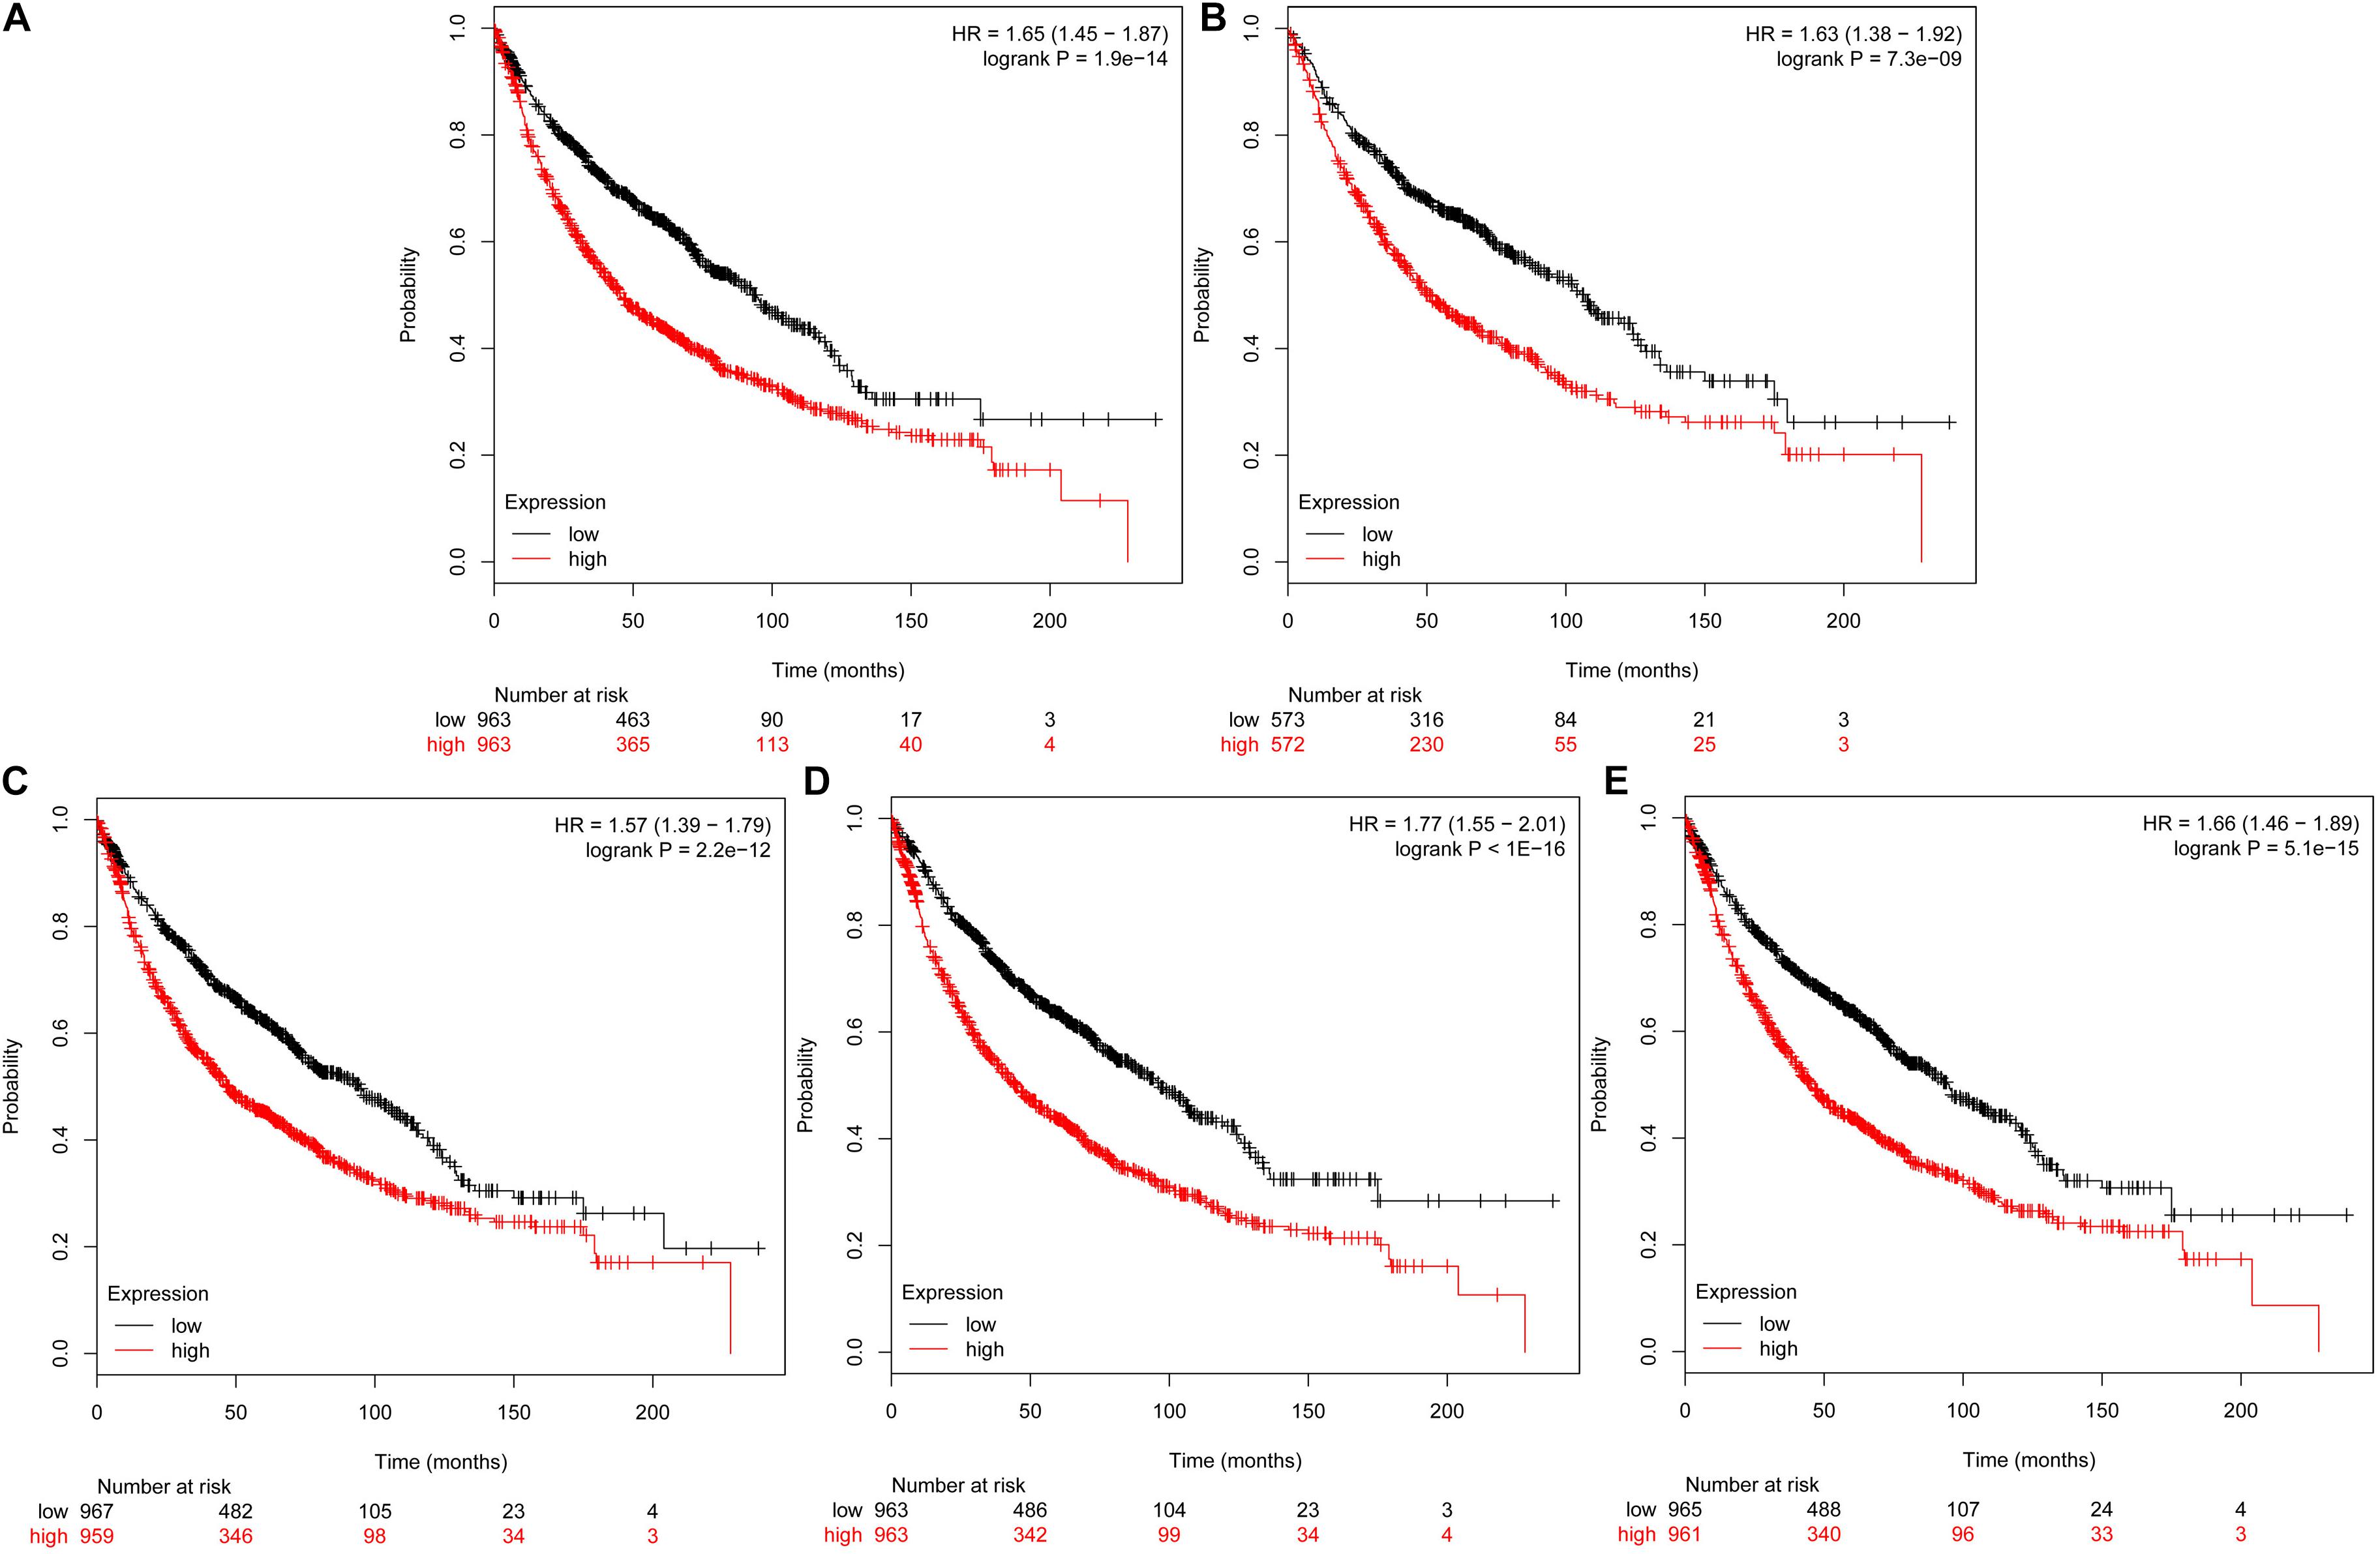
FIGURE 8. Prognostic roles of five hub genes in the NSCLC patients. Survival curves are plotted for NSCLC cancer patients. (A) TOP2A; (B) CCNB1; (C) CCNA2; (D) UBE2C; and (E) KIF20A.
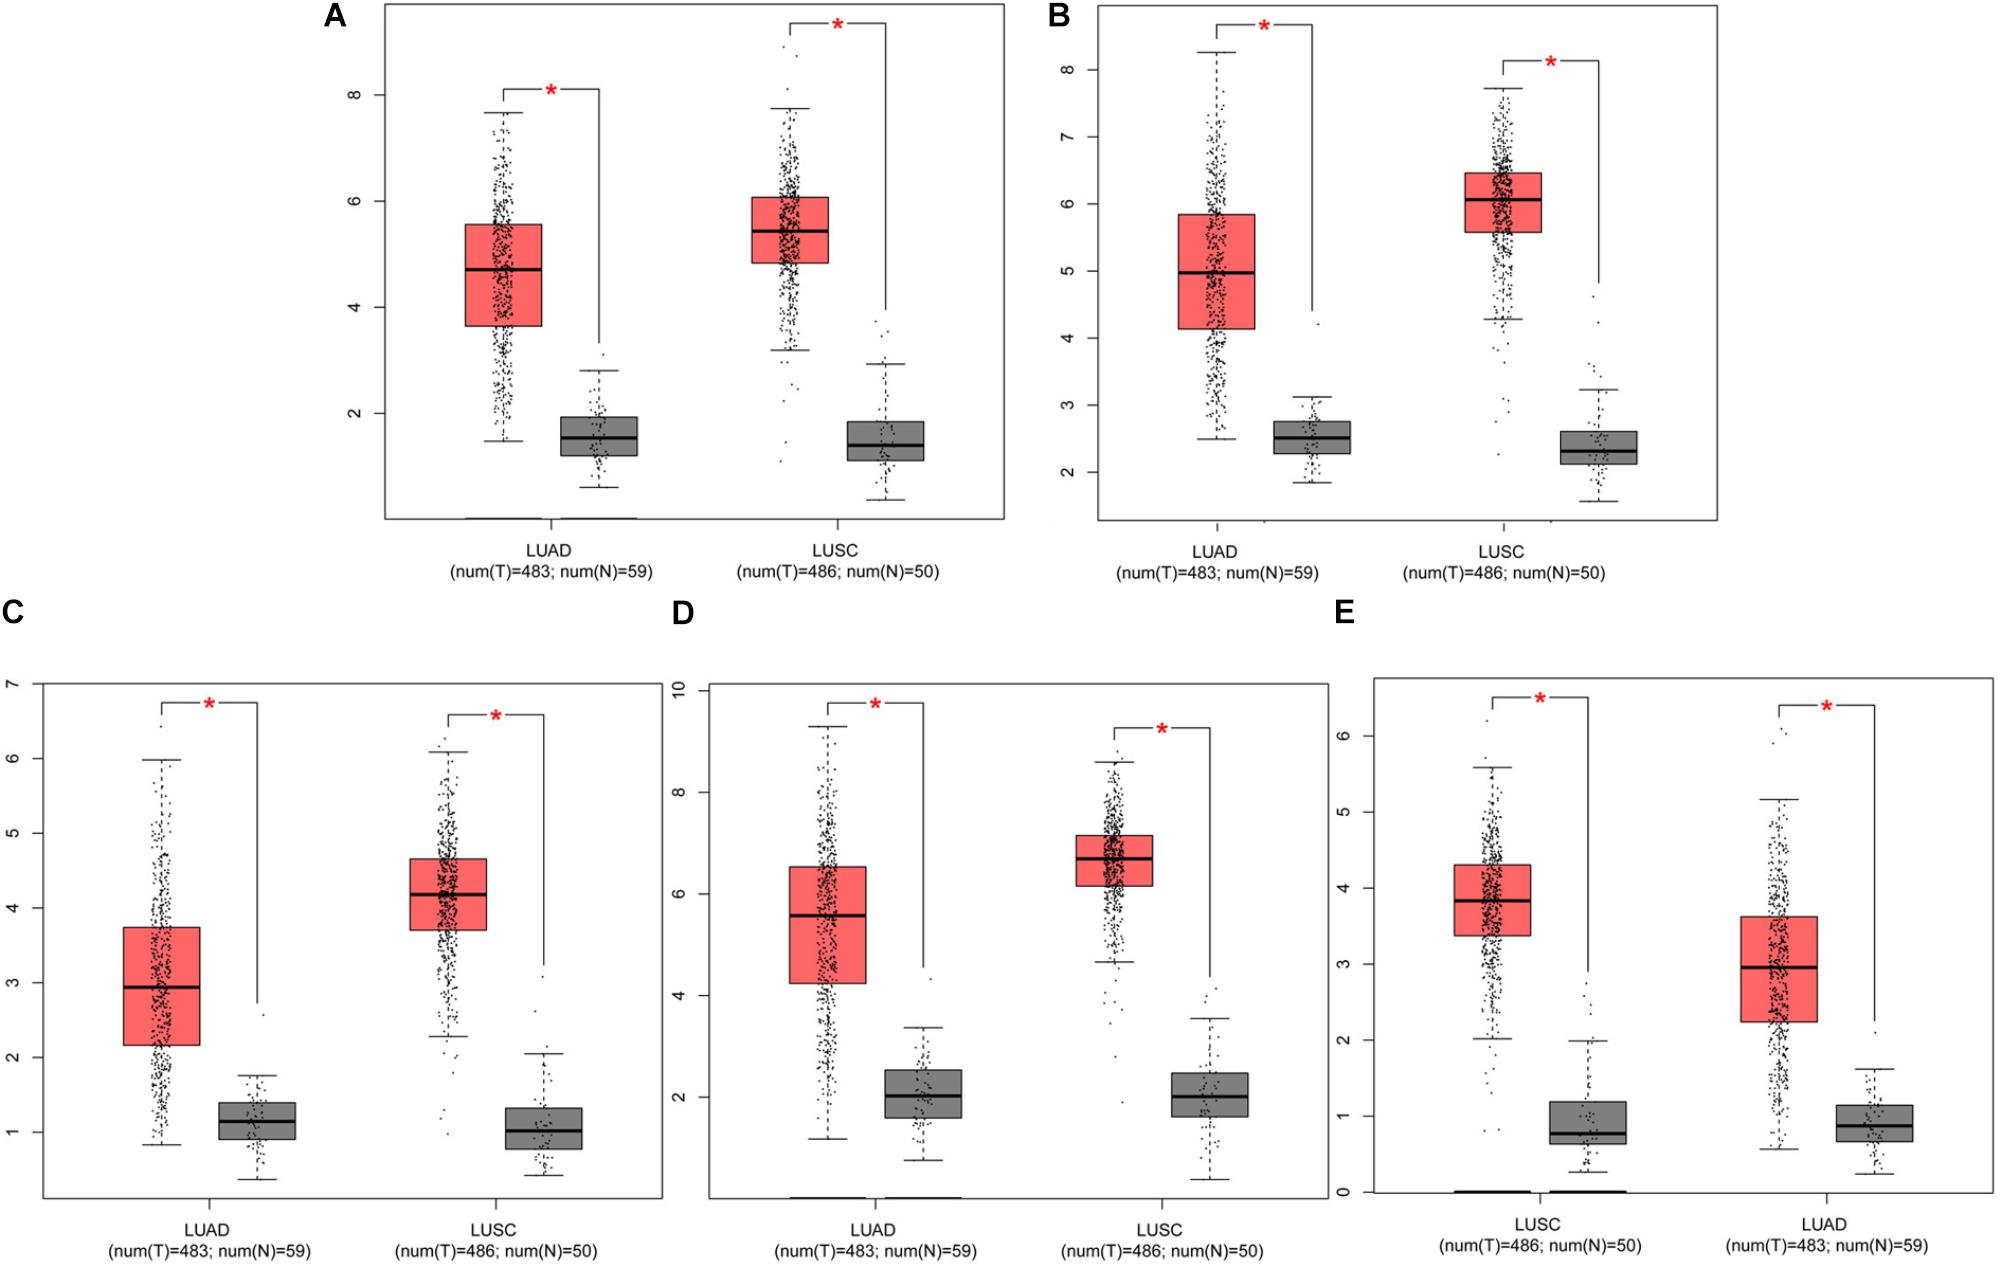
FIGURE 9. Analysis of five hub genes expression level in human NSCLC. The red and gray boxes represent cancer and normal tissues, respectively. (A) TOP2A; (B) CCNB1; (C) CCNA2; (D) UBE2C; and (E) KIF20A; LUAD: Lung adenocarcinoma; LUSC: Lung squamous cell carcinomas.
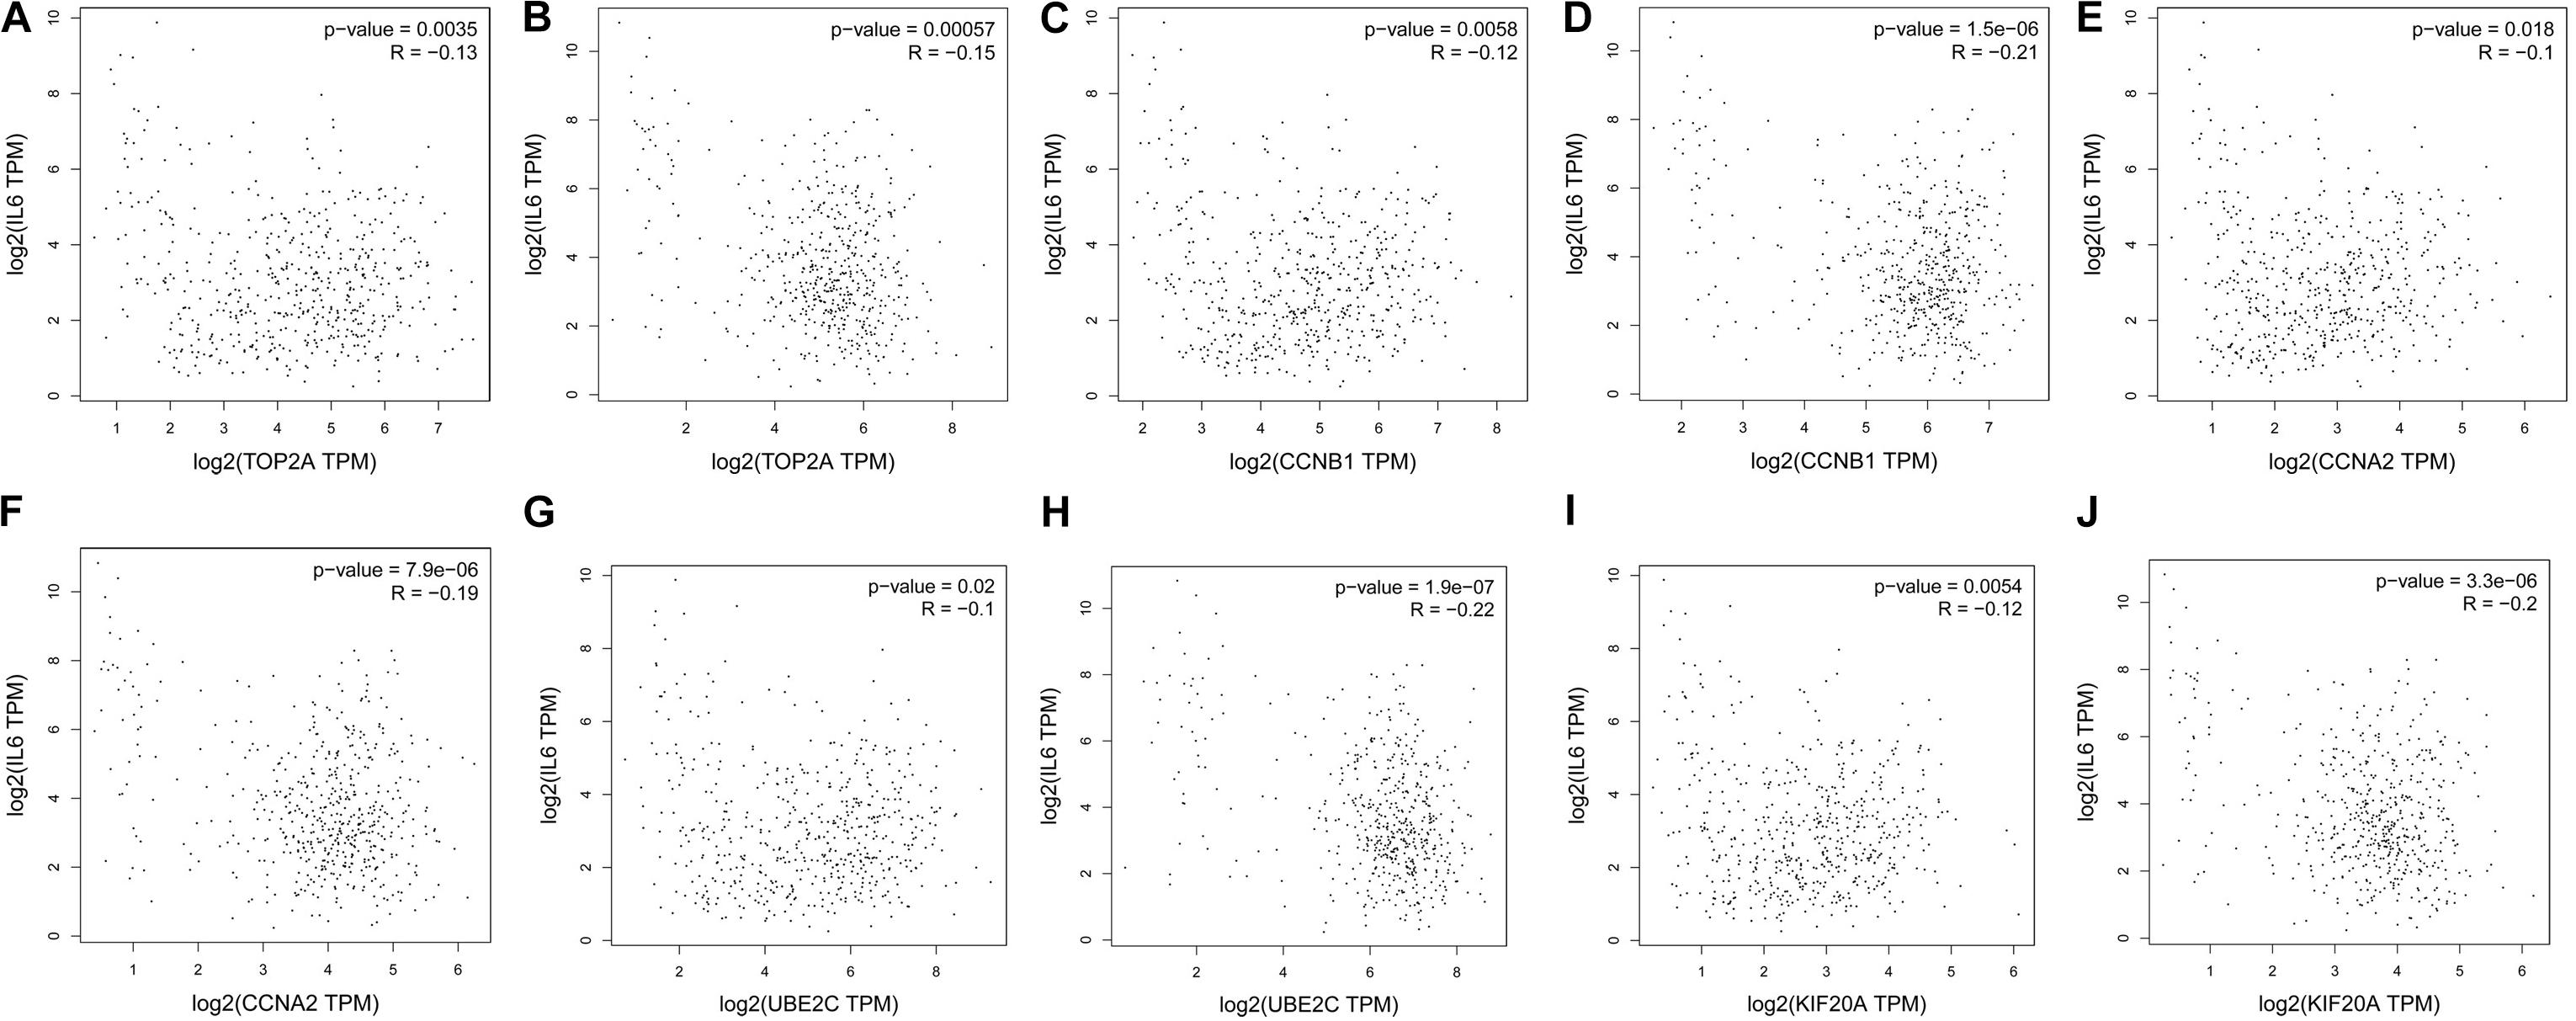
FIGURE 10. Correlation analysis of 5 hub genes and IL-6 in NSLCL. (A,C,E,G,I) lung adenocarcinoma; (B,D,F,H,J) lung squamous cell carcinomas.
Discussion
In the present study, the gene expression patterns obtained from the GEO database revealed a total of 249 genes, including 113 upregulated and 136 downregulated genes, which were differently expressed in NSCLC samples compared with controls. The upregulated genes with TOP2A as a hub gene were significantly enriched in the mitotic cell cycle pathway. The downregulated genes with IL-6 as a hub gene were significant enriched in the amb2 integrin signaling pathway. Five hub genes (TOP2, CCNB1, CCNA2, UBE2C, and KIF20A) which were up-regulated in NSCLC tissues in comparison to normal tissues. Meanwhile, increased of five hub genes was associated with worse OS and decrease of IL-6.
Type II topoisomerases contain two types of isozymes: TOP2A and topoisomerase II beta (TOP2B) (Li and Liu, 2001; Chen et al., 2012). High expression of TOP2A is detected in several types of cancer, and more importantly TOP2A has been acknowledged as a cancer target in clinical application (Wesierska-Gadek and Skladanowski, 2012; Lan et al., 2014; Li et al., 2015). In many tumors, such as breast cancer, head, and neck squamous cell carcinoma and NSCLC, TOP2A expression is significantly higher in middle and low differentiated tumors than in high differentiated ones (Nakopoulou et al., 2000; Stathopoulos et al., 2000; Sun and Wu, 2004). Highly increased expression level of TOP2A in NSCLC tissues is closely related to the malignant biological behaviors of this cancer such as proliferation and invasion, and interference with TOP2A expression inhibits the proliferation and invasion of NSCLC cells (Han et al., 2016). Higher TOP2A expression in NSCLC predicts more malignant biological behavior of the tumor, and more importantly TOP2A has been widely used as an independent prognostic factor in NSCLC and high expression of TOP2A is associated with worse prognoses of NSCLC patients (Villman et al., 2002). In the present study, TOP2A, a hub node with higher node degree in module PPI network, was enriched in mitotic cell cycle pathway and validated transcriptional targets of deltaNp63 isoforms pathway. Therefore, the results are in line with these previous studies, which indicated that TOP2A may be directly or indirectly important in NSCLC development and worse OS.
Interleukin-6 is a key cytokine, which involves in various pathological and physiological processes of inflammatory reaction and proliferation and differentiation of various malignant tumor cells (Kishimoto, 2005; Hong et al., 2007; Ando et al., 2014). IL-6 has been reported to be critical in the tumorigenesis and tumor metastasis of epithelial cancer (Shintani et al., 2016). The unbalanced of IL-6 and its receptors will affect the stability of the internal environment of the body, which will also lead to immune dysfunction and induce the occurrence and development of tumors (Xu et al., 2002). Previous studies have shown that IL-6 is a potential target for the treatment of patients with advanced NSCLC. Moreover, higher levels of IL-6 exists in NSCLC patients and shows an upward trend and IL-6 is associated with the pathogenesis and progression of lung cancer (Strassmann et al., 1992; Xu et al., 2002; Chang et al., 2013). However, some evidence showed that IL-6 is down-regulated in NSCLC (Fang et al., 2017). The inconsistent results of the present studies in turn show that IL-6 may be play an important role in NSCLC development. The fact validates our results, which identified IL-6 as a hub gene.
In addition to the two aforementioned genes, NDC80, CCNA2, CDC6, CCNB1, TPX2, AURKA, MAD2L1, and BUB1B are enriched in mitotic cell cycle pathway, which is the most highly enriched pathway of module 1 with the most significant P-value. For cancer screening and prognosis, analysis of the DNA replication initiation machinery and mitotic engine proteins in human tissues is now conducive to the identification of novel biomarkers and is suppling target validation for cell cycle-directed therapies (Williams and Stoeber, 2011). Therefore, the mitotic cell cycle pathway and its mentioned genes may be vital in NSLCL progression.
Cyclin B1 (CCNB1) is a regulatory protein, which plays a crucial role in mitosis. Overexpressed CCNB1 was detected in NSCLC and related to the clinic stages of NSCLC, and could be used as a marker for NSCLC in indicating the abilities of division, proliferation and apoptosis inhibition of NSCLC (Li et al., 2011). Cyclin A2 (CCNA2) is one of the mammalian A-type cyclin family in humans (Ko et al., 2013). Several research teams have reported the prognostic significance of CCNA2 in lung cancer but the results are controversial. Some suggested that the expression CCNA2 is negatively correlated with prognosis (Volm et al., 1997; Dobashi et al., 2003). However, others reported CCNA2 could not serve as a prognostic factor (Müllertidow et al., 2001; Cooper et al., 2010). Ubiquitin-conjugating enzyme E2C (UBE2C), which encodes a member of the E2 ubiquitin-conjugating enzyme family, had been reported to serve momentous roles in various malignancies, including breast cancer, colorectal cancer, and hepatocellular carcinoma (Ieta et al., 2007; Loussouarn et al., 2009; Chen et al., 2010; Bavi et al., 2011). For lung cancer, a study showed that progression-free survival and poorer OS of NSCLC patients was associated with UBE2C overexpression (Kadara et al., 2009; Zhang et al., 2015). Kinesin family member 20A (KIF20A) belongs to the kinesin superfamily-6, a microtubule-correlated motor protein, is required for cell cycle mitosis (Yan et al., 2012; Zhang et al., 2014). Based on previous studies, KIF20A has been overexpressed in lung and breast cancer, otherwise low levels are inspected in the placenta and heart (Lai et al., 2000; Kikuchi et al., 2003; Stangel et al., 2015). Concerning malignant cellular functions, KIF20A has been revealed to be involved in proliferation, migration, invasiveness, and angiogenesis (Taniuchi et al., 2014).
At present, some relevant studies were published that concerned about core genes in NSCLC in the database. Huang et al identified five genes from two GEO datasets by developing an integrated method including the raw data analysis by GEO2R, functional and pathway enrichment analysis, PPI network and module analysis, cell culture, reverse transcription-quantitative polymerase chain reaction, ROC analysis, survival analysis of hub genes, and statistical analysis (Huang and Gao, 2018). Piao et al identified 16 hub genes, the expression of 14 of which were associated with prognosis of NSCLC patients by a bioinformatics approach incorporating functional and pathway enrichment analysis, PPI network and OS analysis based on gene and miRNA expression profiles from the GEO database (Piao et al., 2018). Chen et al identified 8 disease genes from one GEO database by using Naïve Bayesian Classifier based on the Maximum Relevance Minimum Redundancy feature selection method following preprocessing, shortest path analysis and function and pathway enrichment analysis (Chen et al., 2018). Tian et al identified 7 important genes from one GEO database by using data preprocessing and screening of DEGs, functional enrichment analysis and construction of transcriptional regulatory network (Tian et al., 2016). Compared to previous works, the advantages of the current study were mainly reflected in the following points: First, this study integrated microarray data with relative large sample size from multiple GEO datasets. Secondly, functional enrichment analysis was further carried out to analyze the main biological functions modulated by the DEGs. Finally, this study built gene networks and identified potential diagnostic and prognostic biomarkers in NSCLC and the correlations between hub genes.
The limitations of our study were as follows: First, our results cannot be validated due to the absence of experiment. Second, the data used in our study were accessed from a public database while the quality of the data cannot be appraised. Third, the sample size of involved data was relatively small, and the study failed to cover different races and regions, which can affect the gene expression in NSCLC. Finally, as a result of our study only focused on the genes that are usually identified as significant changes in multiple data sets, there is no consideration of such characteristics as sex, age, tumor classification, and staging in detail. Thus, some biological information may be overlooked in our study.
Conclusion
Our bioinformatics analysis identified TOP2A, CCNB1, CCNA2, UBE2C, KIF20A, and IL-6 and the mitotic cell cycle pathway may be critical in the development and prognosis of NSCLC. However, further experiments confirming the results of this prediction in NSLCL are required because our study was performed based on data analysis. We hope this study may provide some evidence for the future genomic individualized treatment of NSCLC from new insights.
Author Contributions
MN and XL conceived, designed, and performed the research and wrote the paper. JW supervised the research. JT provisioned useful suggestions in methodology. DZ, TW, SL, ZM, KW, XD, WZ, and XZ provisioned suggestions in figure preparation. All authors read and approved the final version of the manuscript.
Funding
The study was financially supported by National Natural Science Foundation of China (Grant Nos. 81473547 and 81673829).
Conflict of Interest Statement
The authors declare that the research was conducted in the absence of any commercial or financial relationships that could be construed as a potential conflict of interest.
Supplementary Material
The Supplementary Material for this article can be found online at: https://www.frontiersin.org/articles/10.3389/fgene.2018.00469/full#supplementary-material
Footnotes
- ^http://www.ncbi.nlm.nih.gov/geo/
- ^http://www.omicshare.com/ (accessed July 19, 2018)
- ^https://string-db.org/
- ^http://kmplot.com/analysis/
- ^http://gepia.cancer-pku.cn/index.html
References
Ando, K., Takahashi, F., Kato, M., Kaneko, N., Doi, T., Ohe, Y., et al. (2014). Tocilizumab, a proposed therapy for the cachexia of interleukin6-expressing lung cancer. PLoS One 9:e102436. doi: 10.1371/journal.pone.0102436
Bader, G. D., and Hogue, C. W. (2003). An automated method for finding molecular complexes in large protein interaction networks. BMC Bioinformatics 4:2. doi: 10.1186/1471-2105-4-2
Bavi, P., Uddin, S., Ahmed, M., Jehan, Z., Bu, R., Abubaker, J., et al. (2011). Bortezomib stabilizes mitotic cyclins and prevents cell cycle progression via inhibition of UBE2C in colorectal carcinoma. Am. J. Pathol. 178, 2109–2120. doi: 10.1016/j.ajpath.2011.01.034
Boolell, V., Alamgeer, M., Watkins, D. N., and Ganju, V. (2015). The evolution of therapies in non-small cell lung cancer. Cancers 7, 1815–1846. doi: 10.3390/cancers7030864
Chang, C. H., Hsiao, C. F., Yeh, Y. M., Chang, G. C., Tsai, Y. H., Chen, Y. M., et al. (2013). Circulating interleukin-6 level is a prognostic marker for survival in advanced nonsmall cell lung cancer patients treated with chemotherapy. Int. J. Cancer 132, 1977–1985. doi: 10.1002/ijc.27892
Chang, T. H., Lee, Y. M., and Huang, R. S. (2015). The impact of the cancer genome atlas on lung cancer. Transl. Res. J. Lab. Clin. Med. 166, 568–585. doi: 10.1016/j.trsl.2015.08.001
Chen, J., Dong, X., Lei, X., Xia, Y., Zeng, Q., Que, P., et al. (2018). Non-small-cell lung cancer pathological subtype-related gene selection and bioinformatics analysis based on gene expression profiles. Mol. Clin. Oncol. 8, 356–361. doi: 10.3892/mco.2017.1516
Chen, M. C., Pan, S. L., Shi, Q., Xiao, Z., Lee, K. H., Li, T. K., et al. (2012). QS-ZYX-1-61 induces apoptosis through topoisomerase II in human non-small-cell lung cancer A549 cells. Cancer Sci. 103, 80–87. doi: 10.1111/j.1349-7006.2011.02103.x
Chen, S., Chen, Y., Hu, C., Jing, H., Cao, Y., and Liu, X. (2010). Association of clinicopathological features with ubch10 expression in colorectal cancer. J. Cancer Res. Clin. Oncol. 136, 419–426. doi: 10.1007/s00432-009-0672-7
Cooper, W. A., Kohonen-Corish, M. R. J., Mccaughan, B., Kennedy, C., Sutherland, R. L., and Lee, C. S. (2010). Expression and prognostic significance of cyclin b1 and cyclin a in non-small cell lung cancer. Histopathology 55, 28–36. doi: 10.1111/j.1365-2559.2009.03331.x
Dobashi, Y., Shoji, M., Jiang, S. X., Kobayashi, M., Kawakubo, Y., and Kameya, T. (2003). Diversity in expression and prognostic significance of G1/S cyclins in human primary lung carcinomas. J. Pathol. 199, 208–220. doi: 10.1002/path.1247
Fang, X., Yin, Z., Li, X., Xia, L., Quan, X., Zhao, Y., et al. (2017). Multiple functional SNPs in differentially expressed genes modify risk and survival of non-small cell lung cancer in Chinese female non-smokers. Oncotarget 8, 18924–18934. doi: 10.18632/oncotarget.14836
Han, Z. X., Zhang, M. J., Zhang, Y. N., Wang, Y., and Du, X. P. (2016). Overexpression of TOP2A in non-small cell lung cancer promotes cancer cell proliferation and invasion. Mod. Oncol. 24, 1371–1375.
Hong, D. S., Angelo, L. S., and Kurzrock, R. (2007). Interleukin-6 and its receptor in cancer: implications for translational therapeutics. Cancer 110, 911–928. doi: 10.1002/cncr.22999
Huang, R., and Gao, L. (2018). Identification of potential diagnostic and prognostic biomarkers in non-small cell lung cancer based on microarray data. Oncol. Lett. 15, 6436–6442. doi: 10.3892/ol.2018.8153
Ieta, K., Ojima, E., Tanaka, F., Nakamura, Y., Haraguchi, N., Mimori, K., et al. (2007). Identification of overexpressed genes in hepatocellular carcinoma, with special reference to ubiquitin-conjugating enzyme E2C gene expression. Int. J. Cancer 121, 33–38. doi: 10.1002/ijc.22605
Jin, Y., Chen, Y., Yu, X., and Shi, X. (2018). A real-world study of treatment patterns and survival outcome in advanced anaplastic lymphoma kinase-positive non-small-cell lung cancer. Oncol. Lett. 15, 8703–8710. doi: 10.3892/ol.2018.8444
Kabbout, M., Garcia, M. M., Fujimoto, J., Liu, D. D., Woods, D., and Chow, C. W. (2013). ETS2 mediated tumor suppressive function and met oncogene inhibition in human non-small cell lung cancer. Clin. Cancer Res. 19,3383–3395. doi: 10.1158/1078-0432.CCR-13-0341
Kadara, H., Lacroix, L., Behrens, C., Solis, L., Gu, X., Lee, J. J., et al. (2009). Identification of gene signatures and molecular markers for human lung cancer prognosis using an in vitro lung carcinogenesis system. Cancer Prev. Res. 2, 702–711. doi: 10.1158/1940-6207.CAPR-09-0084
Kikuchi, T., Daigo, Y., Katagiri, T., Tsunoda, T., Okada, K., Kakiuchi, S., et al. (2003). Expression profiles of non-small cell lung cancers on cDNA microarrays: identification of genes for prediction of lymph-node metastasis and sensitivity to anti-cancer drugs. Oncogene 22, 2192–2205. doi: 10.1038/sj.onc.1206288
Kishimoto, T. (2005). Interleukin-6: from basic science to medicine–40 years in immunology. Annu. Rev. Immunol. 23, 1–21. doi: 10.1146/annurev.immunol.23.021704.115806
Ko, E., Kim, Y., Cho, E. Y., Han, J., Shim, Y. M., Park, J., et al. (2013). Synergistic effect of Bcl-2 and cyclin A2 on adverse recurrence-free survival in stage I non-small cell lung cancer. Ann. Surg. Oncol. 20, 1005–1012. doi: 10.1245/s10434-012-2727-2
Kolde, R., Laur, S., Adler, P., and Vilo, J. (2012). robust rank aggregation for gene list integration and meta-analysis. Bioinformatics 28, 573–580. doi: 10.1093/bioinformatics/btr709
Kulasingam, V., and Diamandis, E. P. (2008). Strategies for discovering novel cancer biomarkers through utilization of emerging technologies. Nat. Clin. Prac. Oncol. 5, 588–599. doi: 10.1038/ncponc1187
Lacny, S., Wilson, T., Clement, F., Roberts, D. J., Faris, P., Ghali, W. A., et al. (2018). Kaplan-Meier survival analysis overestimates cumulative incidence of health-related events in competing risk settings: a meta-analysis. J. Clin. Epidemiol. 93, 25–35. doi: 10.1016/j.jclinepi.2017.10.006
Lai, F., Fernald, A. A., Zhao, N., and Le Beau, M. M. (2000). cDNA cloning, expression pattern, genomic structure and chromosomal location of rab6kifl, a human kinesin-like gene. Gene 248, 117–125.
Lan, J., Huang, H. Y., Lee, S. W., Chen, T. J., Tai, H. C., Hsu, H. P., et al. (2014). TOP2A overexpression as a poor prognostic factor in patients with nasopharyngeal carcinoma. Tumour Biol. 35, 179–187. doi: 10.1007/s13277-013-1022-6
Lánczky, A., Nagy,Á, Bottai, G., Munkácsy, G., Szabó, A., Santarpia, L., et al. (2016). MiRpower: a web-tool to validate survival-associated MiRNAs utilizing expression data from 2178 breast cancer patients. Breast Cancer Res. Treat. 160, 439–446. doi: 10.1007/s10549-016-4013-7
Lee, H., Palm, J., Grimes, S. M., and Ji, H. P. (2015). the cancer genome atlas clinical explorer: a web and mobile interface for identifying clinical–genomic driver associations. Genome Med. 7, 1–14. doi: 10.1186/s13073-015-0226-3
Li, G., Liu, X., Zhang, D., Liu, D., and Li, Z. (2011). The expression and significance of cyclin b1 and survivin in human non-small cell lung cancer. Chin. German J. Clin. Oncol. 10, 192–197. doi: 10.1007/s10330-011-0771-1
Li, J., Wang, W., Xia, P., Wan, L., Zhang, L., Yu, L., et al. (2018). Identification of a five-LNCRNA signature for predicting the risk of tumor recurrence in breast cancer patients. Int. J. Cancer doi: 10.1002/ijc.31573 [Epub ahead of print].
Li, L., Wei, Y., To, C., Zhu, C. Q., Tong, J., Pham, N. A., et al. (2014). Integrated omic analysis of lung cancer reveals metabolism proteome signatures with prognostic impact. Nat. Commun. 28:5469. doi: 10.1038/ncomms6469
Li, T. K., and Liu, L. F. (2001). Tumor cell death induced by topoisomerase-targeting drugs. Annu. Rev. Pharmacol. Toxicol. 41, 53–77. doi: 10.1146/annurev.pharmtox.41.1.53
Li, Y., Shen, X., Wang, X., Li, A., Wang, P., Jiang, P., et al. (2015). EGCG regulates the cross-talk between JWA and topoisomerase IIα in Non-Small-Cell Lung Cancer (NSCLC) Cells. Sci. Rep. 5:11009. doi: 10.1038/srep11009
Lin, L., Li, H., Zhu, Y., He, S., and Ge, H. (2018). Expression of metastasis-associated lung adenocarcinoma transcript 1 long non-coding RNA in vitro, and in patients with non-small cell lung cancer. Oncol. Lett. 15, 9443–9449. doi: 10.3892/ol.2018.8531
Loussouarn, D., Campion, L., Leclair, F., Campone, M., Charbonnel, C., Ricolleau, G., et al. (2009). Validation of UBE2C protein as a prognostic marker in node-positive breast cancer. Br. J. Cancer 101, 166–173. doi: 10.1038/sj.bjc.6605122
Lu, T. P., Tsai, M. H., Lee, J. M., Hsu, C. P., Chen, P. C., Lin, C. W., et al. (2010). Identification of a novel biomarker, SEMA5A, for non–small cell lung carcinoma in nonsmoking women. Cancer Epidemiol. Biomarkers Prev. 19, 2590–2597. doi: 10.1158/1055-9965.EPI-10-0332
Lu, X., Zhou, D., Hou, B., Liu, Q. X., Chen, Q., Deng, X. F., et al. (2018). Dichloroacetate enhances the antitumor efficacy of chemotherapeutic agents via inhibiting autophagy in non-small-cell lung cancer. Cancer Manag Res. 10, 1231–1241. doi: 10.2147/CMAR.S156530
Lusito, E., Felice, B., D’Ario, G., Ogier, A., Montani, F., Di Fiore, P. P., et al. (2018). Unraveling the role of low-frequency mutated genes in breast cancer. Bioinformatics doi: 10.1093/bioinformatics/bty520 [Epub ahead of print].
Maher, A. R., Miake-Lye, I. M., Beroes, J. M., and Shekelle, P. G. (2012). Treatment of Metastatic Non-Small Cell Lung Cancer: A Systematic Review of Comparative Effectiveness and Cost-Effectiveness, Vol. 12. Washington, DC: U.S. Department of Veterans Affairs, 707–708.
Matamala, N., Vargas, M. T., Gonzálezcámpora, R., Miñambres, R., Arias, J. I., Menéndez, P., et al. (2015). Tumor microRNA expression profiling identifies circulating microRNAs for early breast cancer detection. Clin. Chem. 61,1098–1106. doi: 10.1373/clinchem.2015.238691
Müllertidow, C., Metzger, R., Kügler, K., Diederichs, S., Idos, G., Thomas, M., et al. (2001). Cyclin E is the only cyclin-dependent kinase 2-associated cyclin that predicts metastasis and survival in early stage non-small cell lung cancer. Cancer Res. 61, 647–653.
Nakopoulou, L., Lazaris, A., Kavantzas, N., Alexandrou, P., Athanassiadou, P., Keramopoulos, A., et al. (2000). DNA topoisomerase II-alpha immunoreactivity as a marker of tumor aggressiveness in invasive breast cancer. Pathobiology 68, 137–143. doi: 10.1159/000055914
OmicShare (2018). Available at: http://www.omicshare.com/ [accessed July 19, 2018].
Pathan, M., Keerthikumar, S., Chisanga, D., Alessandro, R., Ang, C. S., Askenase, P., et al. (2017). A novel community driven software for functional enrichment analysis of extracellular vesicles data. J. Extracell. Ves. 6:1321455. doi: 10.1080/20013078.2017.1321455
Piao, J., Sun, J., Yang, Y., Jin, T., Chen, L., and Lin, Z. (2018). Target gene screening and evaluation of prognostic values in non-small cell lung cancers by bioinformatics analysis. Gene 647, 306–311. doi: 10.1016/j.gene.2018.01.003
Riess, J. W., Gandara, D. R., Frampton, G. M., Madison, R., Peled, N., Bufill, J. A., et al. (2018). Diverse EGFR Exon 20 insertions and co-occurring molecular alterations identified by comprehensive genomic profiling of non-small cell lung cancer. J. Thorac. Oncol. 13, 1560–1568. doi: 10.1016/j.jtho.2018.06.019
Ritchie, M. E., Phipson, B., Wu, D., Hu, Y., Law, C. W., Shi, W., et al. (2015). Limma powers differential expression analyses for RNA-sequencing and microarray studies. Nucleic Acids Res. 43:e47. doi: 10.1093/nar/gkv007
Sanchez-Palencia, A., Gomez-Morales, M., Gomez-Capilla, J. A., Pedraza, V., Boyero, L., Rosell, R., et al. (2011). Gene expression profiling reveals novel biomarkers in nonsmall cell lung cancer. Int. J. Cancer 129, 355–364. doi: 10.1002/ijc.25704
Schminke, B., Vom Orde, F., Gruber, R., Schliephake, H., Bürgers, R., and Miosge, N. (2015). The pathology of bone tissue during peri-implantitis. J. Dent. Res. 94, 354–361. doi: 10.1177/0022034514559128
Shannon, P., Markiel, A., Ozier, O., Baliga, N. S., Wang, J. T., Ramage, D., et al. (2003). Cytoscape: a software environment for integrated models of biomolecular interaction networks. Genome Res. 13, 2498–2504. doi: 10.1101/gr.1239303
Shintani, Y., Fujiwara, A., Kimura, T., Kawamura, T., Funaki, S., Minami, M., et al. (2016). IL-6 secreted from cancer-associated fibroblasts mediates chemoresistance in NSCLC by increasing epithelial-mesenchymal transition signaling. J. Thorac. Oncol. 11, 1482–1492. doi: 10.1016/j.jtho.2016.05.025
Song, W., Tang, Z., Li, M., Lv, S., Sun, H., Deng, M., et al. (2014). Polypeptide-based combination of paclitaxel and cisplatin for enhanced chemotherapy efficacy and reduced side-effects. Acta Biomater. 10, 1392–1402. doi: 10.1016/j.actbio.2013.11.026
Sperduto, P. W., Yang, T. J., Beal, K., Pan, H., Brown, P. D., Bangdiwala, A., et al. (2017). Estimating survival in patients with lung cancer and brain metastases: an update of the graded prognostic assessment for lung cancer using molecular markers (Lung-molGPA). JAMA Oncol. 3, 827–831. doi: 10.1001/jamaoncol.2016.3834
Spiro, S. G., and Porter, J. C. (2002). Lung cancer – where are we today? Current advances in staging and nonsurgical treatment. Am. J. Respir. Crit. Care Med. 166, 1166–1196. doi: 10.1164/rccm.200202-070SO
Stangel, D., Erkan, M., Buchholz, M., Gress, T., Michalski, C., Raulefs, S., et al. (2015). Kif20a inhibition reduces migration and invasion of pancreatic cancer cells. J. Surg. Res. 197, 91–100. doi: 10.1016/j.jss.2015.03.070
Stathopoulos, G. P., Kapranos, N., Manolopoulos, L., Papadimitriou, C., and Adamopoulos, G. (2000). Topoisomerase IIα expression in squamous cell carcinomas of the head and neck. Anticancer Res. 20, 177–182.
Strassmann, G., Fong, M., Kenney, J. S., and Jacob, C. O. (1992). Evidence for the involvement of interleukin 6 in experimental cancer cachexia. J. Clin. Invest. 89, 1681–1684. doi: 10.1172/JCI115767
Sun, B. S., and Wu, H. M. (2004). Expression of topoisomerase IIαand its relationship with Ki67 protein,p53 gene in nonsmall cell lung carcinoma patients. J. Huazhong Univ. Sci. Tech. 33, 118–121.
Sun, C., Yuan, Q., Wu, D., Meng, X., and Wang, B. (2017). Identification of core genes and outcome in gastric cancer using bioinformatics analysis. Oncotarget 8, 70271–70280. doi: 10.18632/oncotarget.20082
Sun, M., Song, H., Wang, S., Zhang, C., Zheng, L., Chen, F., et al. (2017). Integrated analysis identifies microrna-195 as a suppressor of Hippo-YAP pathway in colorectal cancer. J. Hematol. Oncol. 10:79. doi: 10.1186/s13045-017-0445-8
Szász, A. M., Lánczky, A., Nagy,Á, Förster, S., Hark, K., Green, J. E., et al. (2016). Cross-validation of survival associated biomarkers in gastric cancer using transcriptomic data of 1,065 patients. Oncotarget 7, 49322–49333. doi: 10.18632/oncotarget.10337
Szklarczyk, D., Franceschini, A., Wyder, S., Forslund, K., Heller, D., Huerta-Cepas, J., et al. (2015). STRING v10: protein-protein interaction networks, integrated over the tree of life. Nucleic Acids Res. 43, D447–D452. doi: 10.1093/nar/gku1003
Tang, Z., Li, C., Kang, B., Gao, G., Li, C., and Zhang, Z. (2017). GEPIA: a web server for cancer and normal gene expression profiling and interactive analyses. Nucleic Acids Res. 45, W98–W102. doi: 10.1093/nar/gkx247
Taniuchi, K., Furihata, M., and Saibara, T. (2014). KIF20A-mediated RNA granule transport system promotes the invasiveness of pancreatic cancer cells. Neoplasia 16, 1082–1093. doi: 10.1016/j.neo.2014.10.007
Tian, W., Liu, J., Pei, B., Wang, X., Guo, Y., and Yuan, L. (2016). Identification of MiRNAs and differentially expressed genes in early phase non-small cell lung cancer. Oncol. Rep. 35, 2171–2176. doi: 10.3892/or.2016.4561
Torre, L. A., Siegel, R. L., and Jemal, A. (2016). Lung cancer statistics. Adv. Exp. Med. Biol. 893, 1–19. doi: 10.1007/978-3-319-24223-1-1
Villman, K., Ståhl, E., Liljegren, G., Tidefelt, U., and Karlsson, M. G. (2002). Topoisomerase II-alpha expression in different cell cycle phases in fresh human breast carcinomas. Mod. Pathol. 15, 486–491. doi: 10.1038/modpathol.3880552
Volm, M., Koomagi, R., Mattern, J., and Stammler, G. (1997). Cyclin A is associated with an unfavourable outcome in patients with non-small-cell lung carcinoma. Br. J. Cancer 75, 1774–1778. doi: 10.1038/bjc.1997.302
Wesierska-Gadek, J., and Skladanowski, A. (2012). Therapeutic intervention by the simultaneous inhibition of DNA repair and Type I or Type II DNA topoisomerases: one strategy, many outcomes. Future Med. Chem. 4, 51–72. doi: 10.4155/fmc.11.175
Williams, G. H., and Stoeber, K. (2011). The cell cycle and cancer. Placenta 226, 352–364. doi: 10.1002/path.3022
Xu, Q. X., Xu, F. Z., and Liu, Z. (2002). The determination and clinical significance of IL-6 and TNF- alpha in patients with lung cancer. Chin. J. Clin. Oncol. Rehab. 9, 38–39.
Xu, Y., Liu, H., Liu, S., Wang, Y., Xie, J., Stinchcombe, T. E., et al. (2018). Genetic variant of IRAK2 in the toll-like receptor signaling pathway and survival of non-small cell lung cancer. Int. J. Cancer doi: 10.1002/ijc.31660 [Epub ahead of print].
Yan, G. R., Zou, F. Y., Dang, B. L., Zhang, Y., Yu, G., Liu, X., et al. (2012). Genistein-induced mitotic arrest of gastric cancer cells by downregulating KIF20A, a proteomics study. Proteomics 12, 2391–2399. doi: 10.1002/pmic.201100652
Zhang, L., Yang, Y., Cheng, L., Cheng, Y., Zhou, H. H., and Tan, Z. R. (2018). Identification of common genes refers to colorectal carcinogenesis with paired cancer and noncancer samples. Dis. Markers 2018:3452739. doi: 10.1155/2018/3452739
Zhang, Y., Liu, J., Peng, X., Zhu, C. C., Han, J., Luo, J., et al. (2014). KIF20A regulates porcine oocyte maturation and early embryo development. PLoS One 9:e102898. doi: 10.1371/journal.pone.0102898
Zhang, Z., Liu, P., Wang, J., Gong, T., Zhang, F., Ma, J., et al. (2015). Ubiquitin-conjugating enzyme E2C regulates apoptosis-dependent tumor progression of non-small cell lung cancer via ERK pathway. Med. Oncol. 32, 1–7. doi: 10.1007/s12032-015-0609-8
Zhao, J., Shi, X., Wang, T., Ying, C., He, S., and Chen, Y. (2017). The prognostic and clinicopathological significance of igf-1r in NSCLC: a meta-analysis. Cell. Physiol. Biochem. 43, 697–704. doi: 10.1159/000480655
Zhao, Y., Zheng, R., Li, J., Lin, F., and Liu, L. (2017). Loss of Phosphatase and tensin homolog expression correlates with clinicopathological features of non-small cell lung cancer patients and its impact on survival: a systematic review and meta-analysis. Thorac. Cancer 8, 203–213. doi: 10.1111/1759-7714.12425
Keywords: non-small cell lung cancer, bioinformatics, differentially expressed genes, survival, biomarker, GEO
Citation: Ni M, Liu X, Wu J, Zhang D, Tian J, Wang T, Liu S, Meng Z, Wang K, Duan X, Zhou W and Zhang X (2018) Identification of Candidate Biomarkers Correlated With the Pathogenesis and Prognosis of Non-small Cell Lung Cancer via Integrated Bioinformatics Analysis. Front. Genet. 9:469. doi: 10.3389/fgene.2018.00469
Received: 24 July 2018; Accepted: 24 September 2018;
Published: 12 October 2018.
Edited by:
Yi Zhao, Institute of Computing Technology (CAS), ChinaReviewed by:
Yonghua Wang, Northwest A&F University, ChinaWiejian Bei, Guangdong Pharmaceutical University, China
Jia-bo Wang, 302 Military Hospital of China, China
Copyright © 2018 Ni, Liu, Wu, Zhang, Tian, Wang, Liu, Meng, Wang, Duan, Zhou and Zhang. This is an open-access article distributed under the terms of the Creative Commons Attribution License (CC BY). The use, distribution or reproduction in other forums is permitted, provided the original author(s) and the copyright owner(s) are credited and that the original publication in this journal is cited, in accordance with accepted academic practice. No use, distribution or reproduction is permitted which does not comply with these terms.
*Correspondence: Jiarui Wu, ZXhvZ2FteUAxNjMuY29t
†These authors have contributed equally to this work
 Mengwei Ni1†
 Xinkui Liu
 Jiarui Wu