 Lin Yu
 Bernhard Ahrens
 Sönke Zaehle
 Marion Schrumpf
- Max Planck Institute for Biogeochemistry, Jena, Germany
In this study, we investigate the responses of soil organic carbon (C) to nitrogen (N) and phosphorus (P) additions along a soil P stock gradient of five beech forest stands in Germany, using a modeling approach. Two different soil models with coupled C, N, and P cycles are used to simulate fertilization experiments conducted at the study sites. The first model, the stand-alone soil module of QUINCY (QUINCY-soil, Thum et al., 2019), is a conventional soil model that uses first-order kinetics to describe soil organic matter (SOM) turnover and represents microbial biomass only implicitly. The second model, the Jena Soil Model (JSM) (Yu et al., 2020), is a novel microbial soil model, which explicitly simulates microbial dynamics and describes the turnover of SOM as the consequence of several interactive processes, such as microbially mediated depolymerization of litter and SOM, organo-mineral association, and vertical transport. We applied both site-level models to five study sites and compared the modeled soil profile with observations. In addition, model scenarios were conducted to simulate the fertilization of N and P, and we further evaluate the effect of soil P stock, plant litter quality, and SOM CNP stoichiometry, on the responses of soil (heterotrophic) respiration (Rs) to nutrient addition. We found that the fitness between simulated and observed SOM profiles (defined as normalized root mean square ratios, Knrmsr) were generally better in JSM than in QUINCY-soil (Knrmsr larger by 0.03 ± 0.10 to 0.16 ± 0.06 for various soil measurements at all sites); The general pattern of observed Rs responses to nutrient fertilization, that N addition decreases Rs whereas P addition increases it, can be reproduced by JSM but not by QUINCY-soil. Our results indicated that a detailed explicit description of microbial processes and organo-mineral association is required to model plant-soil-microbial interactions, thus to better reproduce SOM profiles and their responses to nutrient additions. It highlights the need to better represent these processes in future model developments.
Introduction
Macronutrients such as nitrogen (N) and phosphorus (P) are capable of regulating major functions (e.g., photosynthesis and respiration) of higher plants (Engels et al., 2011; Hawkesford et al., 2012), and can thus affect the future forest carbon (C) balance (Fernández-Martínez et al., 2014; Wieder et al., 2015). Although changes of terrestrial C cycling are more easily observed aboveground than belowground (Pan et al., 2011; Jonard et al., 2015, Zhu et al., 2016), many studies have shown that belowground biogeochemical processes, such as C allocation, decomposition, nutrient uptake, and mineralization, strongly control the C-nutrient interactions of forest ecosystems. For example, increased atmospheric CO2 concentration has been shown to increase belowground C allocation (Norby et al., 2004; Ellsworth et al., 2017), and to facilitate plant N uptake (Finzi et al., 2007) and soil P mining (Jiang et al., 2020) in free-air CO2 enrichment studies. A similarly large number of studies have shown that changes of nutrient inputs (fertilization, deposition changes, nutrient stock gradients, etc.) can affect forest ecosystem C cycling by changing plant nutrient uptake, litter and soil organic matter (SOM) decomposition, and nutrient mineralization (see reviews of Johnson and Turner, 2019, Janssens et al., 2010 and references therein). These processes mostly occur belowground and are driven by interactions between plants, soil, and microorganisms (Čapek et al., 2018; Mori et al., 2018). Plant production and microbial activity rely on nutrient availability so that the response of soil C storage to global changes is expected to be modulated by soil nutrient contents (Fernández-Martínez et al., 2014; Wieder et al., 2015). However, while a range of soil models coupling carbon and nutrient cycles are already available (e.g., Schimel and Weintraub, 2003; Moorhead and Sinsabaugh, 2006), only the latest ones have an explicit representation of microbial activity or consider the full vertical profile (e.g., Abramoff et al., 2017; Sulman et al., 2019, Yu et al., 2020). It remains to be tested if the microbial-explicit models can better reproduce interactions between C and nutrient cycling in soils, both along gradients in soil nutrient contents, or under fertilization or increased nutrient deposition.
Soil respiration (Rs), which consists of autotrophic respiration and heterotrophic respiration, is commonly used as a key indicator to study the response of SOM dynamic to perturbation (Bond-Lamberty et al., 2018; Carey et al., 2016). The negative response of Rs to N addition is well-known and generally consistent across studies. For instance, Janssens et al. (2010) have shown a reduction of forest soil respiration in response to increasing N deposition, particularly in temperate forest soils. The meta-analysis of Zhou et al. (2014) confirmed the finding in the forest ecosystem and pointed out that the magnitude of Rs responses was positively correlated with changes in root and microbial biomass as well as soil organic C (SOC) content. In contrast, in other biomes, such as croplands, grasslands, and deserts, Rs was enhanced in response to N addition (Zhong et al., 2016; Zhou et al., 2014).
However, the response of Rs to P addition is less investigated compared to that of N addition. The very first global meta-analysis of Rs to P addition (Feng and Zhu, 2019) has shown that Rs is significantly increased by 17.4% in tropical forests but decreased by 13.7% in wetlands in response to P addition. Although many studies tend to agree that P addition generally causes increases in Rs and soil microbial biomass (Fanin et al., 2012; Liu et al., 2013, Jing et al., 2017; Meyer et al., 2018, Spohn and Schleuss, 2019), there are also some studies reporting no effects (Groffman and Fisk, 2011; Wang et al., 2019) or a reduction in Rs (Wang et al., 2017) in response to P addition. The soil P stock has been found to be one of the key factors regulating the P cycling strategy in beech forests (Lang et al., 2017). For instance, soil P has also been proposed as one potential reason for different responses to P addition in P fertilization studies at several beech forest sites (Kohler et al., 2019; Spohn and Widdig, 2017, Netzer et al., 2019). These studies have found that soil P stock can impact plant and soil processes, such as retranslocation (Kohler et al., 2019) or microbial turnover (Spohn and Widdig, 2017). These impacts are less notable for aboveground plant traits, such as foliar N and P contents, compared to belowground traits, such as the root biomass and forest floor turnover time (Lang et al., 2017).
Most studies conducting both N and P additions have pointed to contrasting effects of N and P addition imposed on heterotrophic respiration (Fisk et al., 2015; Poeplau et al., 2016, Ren et al., 2016; Stiles et al., 2018, Liu et al., 2019), that is N addition decreases heterotrophic respiration whereas P addition increases it. The proposed mechanisms of these studies are different effects of N and P on microbial and SOM turnover, i.e., microbial nutrient mining. The microbial N mining hypothesis (Moorhead and Sinsabaugh, 2006) predicts an increase in SOM decomposition when N availability decreases. The N mining always involves C mineralization but P mining does not, leading to different respiration responses after nutrient addition (Craine et al., 2007). An alternative hypothesis is that the competition of inorganic P with SOC for adsorption sites in the soil could help release organic C to microbes after P but not N addition (Mori et al., 2018; Spohn and Schleuss, 2019). Moreover, how these processes are affected by soil nutrient availabilities is largely unknown.
Process-based models are powerful tools to identify and quantify important processes as well as to test hypotheses within complex terrestrial ecosystems (e.g., Medlyn et al., 2016; Zaehle et al., 2014). The importance to account for N cycle or novel microbial processes has been shown by earlier soil model studies. For example, soil priming effect, i.e., the change in SOM decomposition caused by plant root activity (Kuzyakov et al., 2000), was found to be affected by the litter C:N ratio (Abramoff et al., 2017; Wutzler et al., 2017), the SOM stability (Huang et al., 2018), and mycorrhizal association types (Sulman et al., 2017, 2019), thus further influence the soil respiration and C storage. Recent developments in these models have focused on representations of the P cycle (Goll et al., 2017; Thum et al., 2019, Zhu et al., 2019) and microbial processes (Sulman et al., 2019; Yu et al., 2020), which provide a new opportunity to investigate soil responses to nutrient additions. One important assumption in these models of the P cycle is the so-called bio-mineralization process, which accounts for an additional soil P mining pathway that does not involve C release (McGill and Cole, 1981; Wang et al., 2010). The bio-mineralization has been quantified as one of the main sources for plant P supply in many modeling studies (Goll et al., 2012; Thum et al., 2019, Wang et al., 2010; Yu et al., 2018) and also identified as an important process regulating the SOM C:P ratio (Yu et al., 2020).
In this study, we investigate the effects of soil P stock on soil responses to N and P additions by applying two soil models to five study sites with a soil P stock gradient. The two models, QUINCY-soil model and Jena Soil Model (JSM), share many common features and the same code base but differ in the way SOM formation and turnover are represented. We firstly identify if and how SOM and its CNP stoichiometry are affected by a natural gradient in soil P stock. This was done by comparing simulations of the two models with different SOM formation representation with observations from beech forests growing on soils with different P stocks. Secondly, we verify if the two models can reproduce the observed soil respiration (Rs) response to N or P fertilization often observed from experiments, with a decline in Rs with N-, but an increase with P-addition and test if the results vary with initial soil P stock along the tested gradient. An ongoing fertilization experiment was simulated at the five study sites for this purpose to evaluate short- and long-term responses of SOM to nutrient additions. We hypothesize that the more mechanistic Jena Soil Model should better reproduce the observed SOM stoichiometry and Rs responses to nutrient addition compared to the more conventional QUINCY-soil model. Lastly, we aim to identify which features, i.e., process representation or model structure, of the two models are affecting the simulated Rs responses to nutrient addition, and discuss recommendations for improving soil C, N, and P interaction representations in terrestrial biosphere models (TBMs) in the future. This is done by conducting further model scenarios and sensitivity analyses.
Materials and Methods
Descriptions of Study Sites
Five mature beech forest stands in Germany [Bad Brückenau (BBR), Mitterfels (MTF), Vessertal (VES), Conventwald (COM), and Lüss (LUE)] were selected as study sites. Because all five sites are the Level II intensive monitoring plots in the Pan-European International Co-operative Program for the assessment and monitoring of air pollution effects on forests (ICP Forests) and have been continuously monitored with soil and tree properties for 15–25 years. They are also the main study sites of the research project SPP1685 “Ecosystem Nutrition” (Lang et al., 2017), which aims for investigating the P cycling strategies of forests with varying soil P stocks.
The total soil P stock (g P/m2, down to 1 m depth) decreases strongly along the gradient: BBR > MTF > VES > COM > LUE. This decrease is concurrent with increasing soil N:P ratios in the topsoil (0–30 cm) along the gradient, and decreasing P concentration in the litterfall, including leaf litter and fine roots in forest floor and mineral soil (Table 1). Such a decreasing trend along the gradient is less remarkable in soil P content (mg P/kg soil) and available P content [mg P/kg soil, resin P and NaHCO3 extracted P in Hedley fractionation (Klotzbücher et al., 2019)], due to a noticeably lower stone content at MTF than VES (Table 1). Other soil properties, including soil organic and microbial C contents as well as soil and microbial C:N:P ratios, do not show clear trends along the total soil P gradient. Other vegetation traits such as tree height, diameter, and foliar N and P contents are similar among the sites (Lang et al., 2017). With respect to the soil texture, the subsoil is generally more sandy than the topsoil at all study sites; the most P-rich site, BBR, is meanwhile the siltiest site and the most P-poor site, LUE, is the sandiest site (Table 1, Lang et al., 2017).
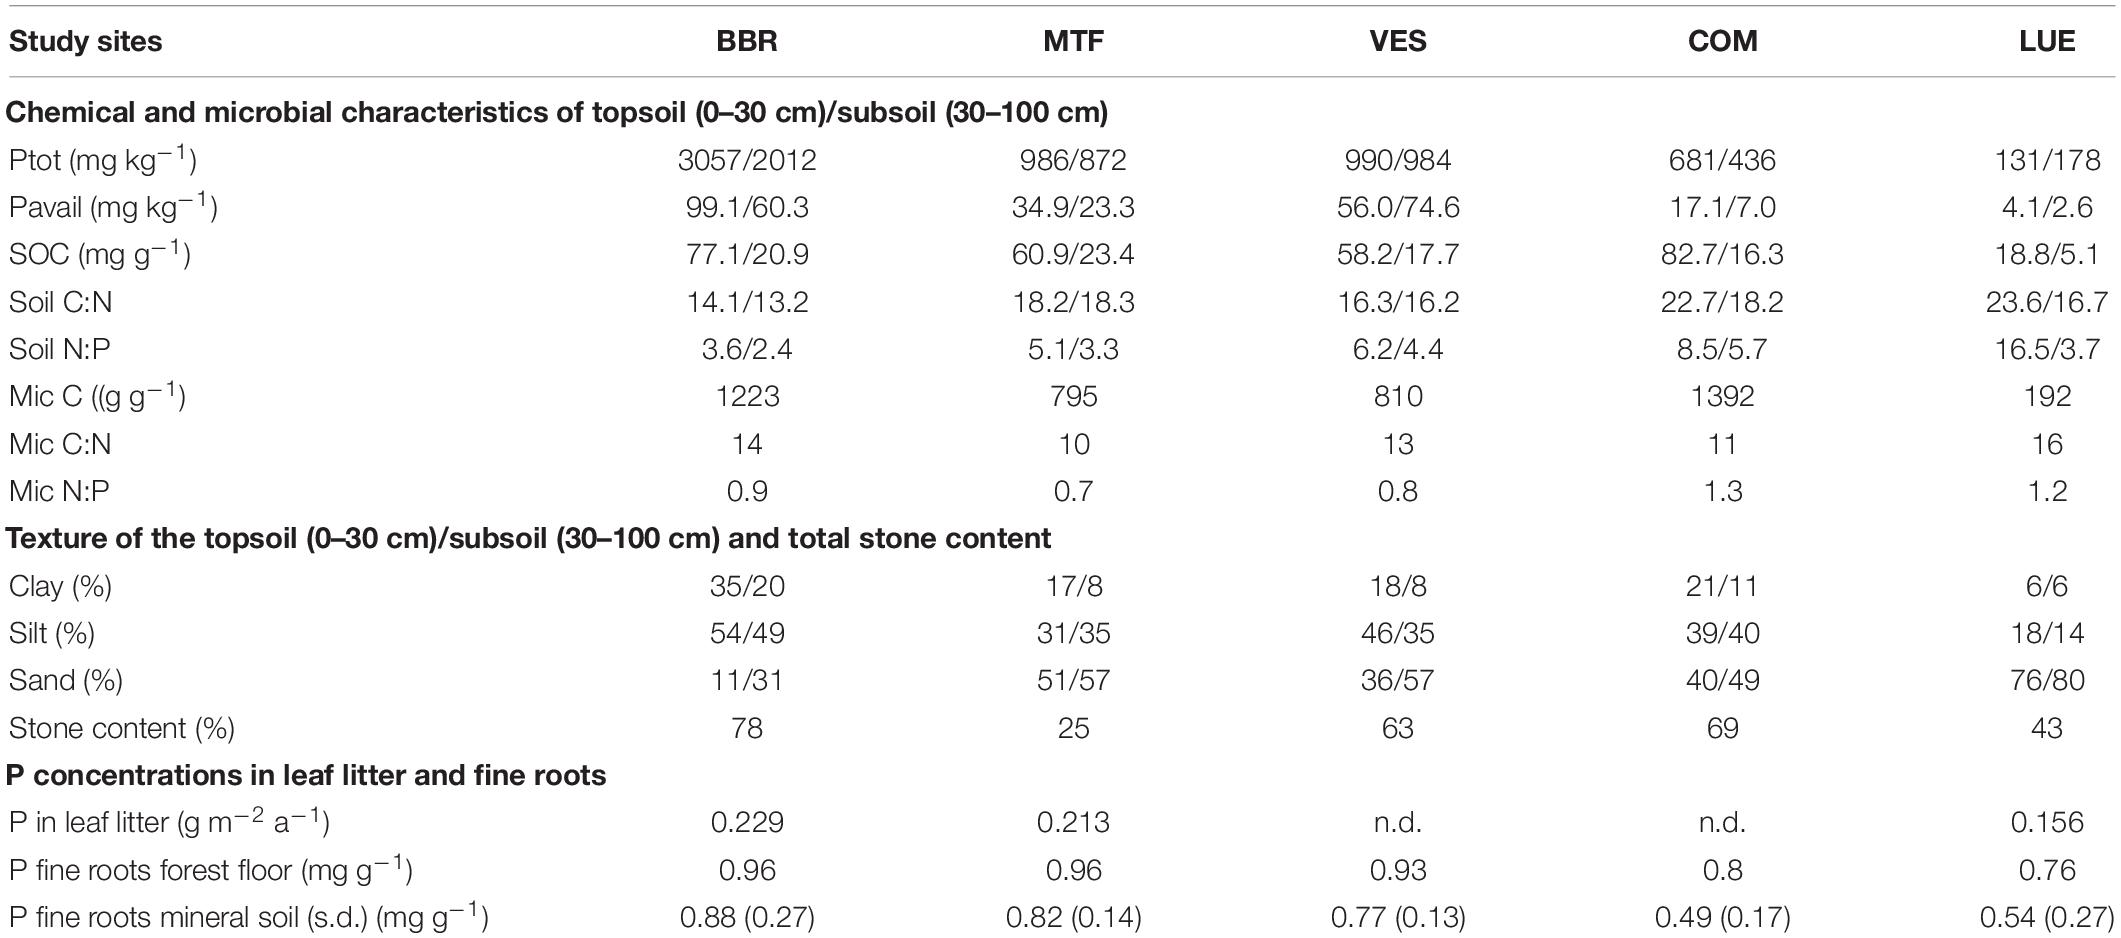
Table 1. Site characteristics of the study sites Bad Brückenau (BBR), Mitterfels (MTF), Vessertal (VES), Conventwald (COM), and Lüss (LUE), reproduced from data in Lang et al. (2017).
Models
In this study, we employ two contrasting stand-alone soil models implemented into the QUantifying Interactions between terrestrial Nutrient CYcles and the climate system (QUINCY) TBM with fully coupled C, N, and P cycles and water and energy balances (Thum et al., 2019). The two models, QUINCY-soil and Jena Soil Model, share some common structures and processes of the QUINCY framework, such as soil layering, calculations of soil temperature, moisture, and water transport, litter pooling, woody litter turnover, and most inorganic P cycling processes (Table 2 and Figure 1).
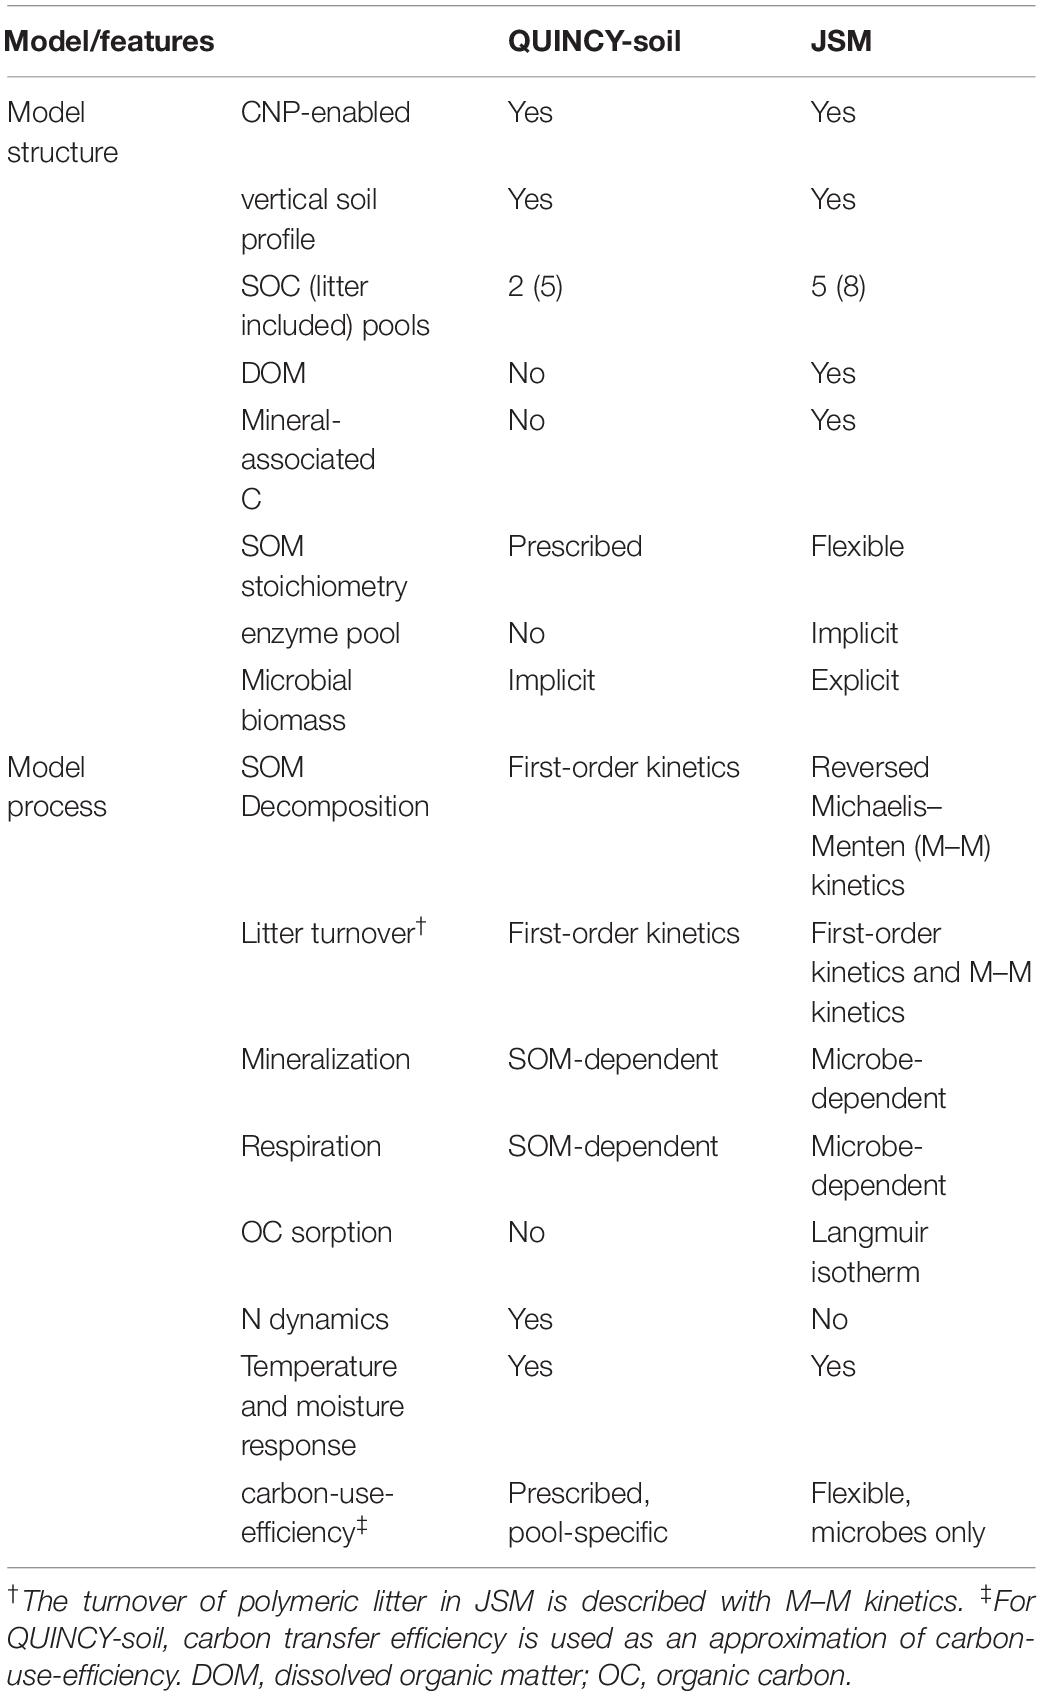
Table 2. Comparison of model features between the soil module in QUINCY (QUINCY-soil) and Jena Soil model (JSM).
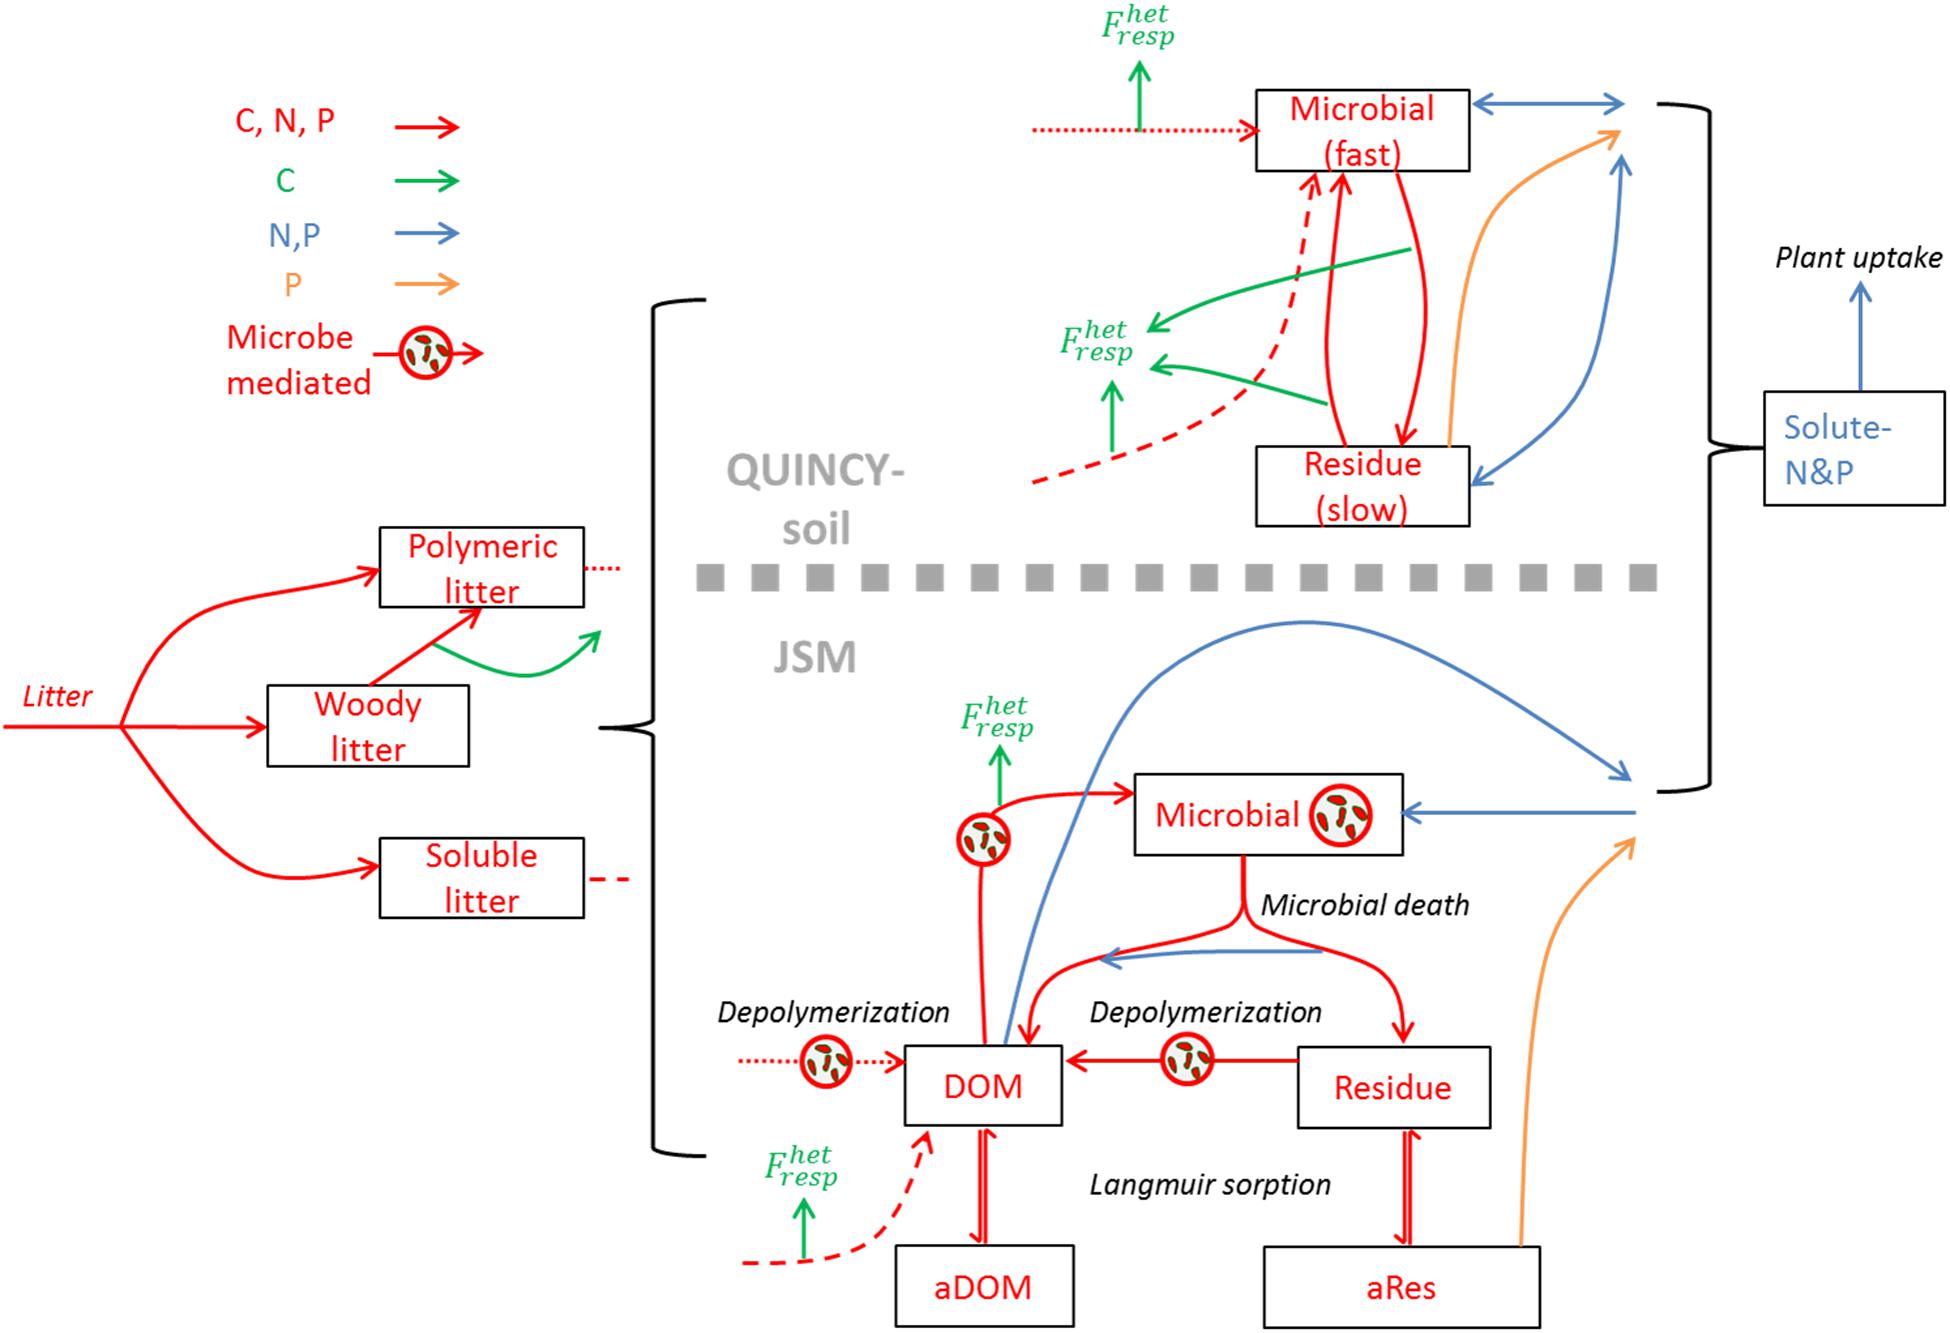
Figure 1. Model structure comparison between QUINCY-soil and Jena Soil Model (JSM). The fast SOM pools in JSM include the Microbial, DOM, and Residue pools, and the slow SOM pools refer to the mineral-adsorbed DOM (aDOM) and residue (aRes) pools. The soil litter pool in both models refer to the woody, polymeric, and soluble litter; both models share the same litter distribution process, and the effluxes from polymeric and soluble litter are distinguished with dash line types.
The QUINCY-soil model as applied in the standard version of the QUINCY model applies first-order kinetics for SOM decomposition for 15 vertical soil levels, broadly following the CENTURY approach (Parton et al., 1988). In addition, it accounts for vertical transport through bioturbation fluxes, such as movements caused by soil fauna and animals, as well as the advection of soluble mineral nutrients.
The Jena Soil Model (JSM) is a microbe-based, vertically explicit soil carbon model with integrated N and P cycles (Yu et al., 2020). It represents the turnover and formation of SOM based on mechanistic descriptions of soil processes such as microbially mediated depolymerization, organo-mineral association, and transport of dissolved organic matter (DOM) as well as bioturbation following the COMISSION model (Ahrens et al., 2015). JSM applies different kinetics to different processes, such as Michaelis–Menten kinetics for depolymerization and microbial uptake, Langmuir isotherm for the organo-mineral association and phosphate adsorption, and first-order kinetics for woody litter turnover (Table 2).
The main differences between the two models originate from the representation of SOM formation and turnover processes (Table 2 and Figure 1). In QUINCY-soil, decomposed litter enters a SOM pool with fast turnover, which implicitly contains microbial biomass. The fast SOM pool stabilizes into the slowly overturning SOM pool and the slow SOM pool can also be destabilized back to the fast SOM pool. All these processes, i.e., litter decomposition, and SOM stabilization/destabilization, are described with first-order kinetics and happen at the same time with heterotrophic respiration (Figure 1, upper panel). In QUINCY-soil, the stoichiometry of the fast SOM pool adjusts linearly to the soluble N concentration with a heuristic function, in which the stoichiometry adjustment occurs instantaneously as the soluble N concentration changes, whereas the slow SOM pool is assumed to have fixed C:N:P ratio. All the C transfer processes have a prescribed C transfer efficiency, which determines the rate of respiration flux (Table 2 and Figure 1).
Contrary, in JSM, polymeric litter needs to be first depolymerized to DOM and then enters an explicit microbial pool, which represents microbial biomass with a fixed ratio of C, N, and P. The microbial residue (necromass) pool could also be depolymerized to DOM, and both pools can be adsorbed to mineral surfaces up to a maximum sorption capacity, forming more recalcitrant SOM. The depolymerization rate is calculated using reverse Michaelis–Menten kinetics, limited by the microbial biomass C; the microbial DOM uptake and growth rate is described using Michaelis–Menten kinetics, limited by the substrate (DOM); the organo-mineral association is calculated with Langmuir isotherm, constrained by a C sorption capacity, which is related with soil clay and silt contents (Ahrens et al., 2015). In JSM, only the microbial stoichiometry is fixed, and the stoichiometry of all the other SOM pools depends on the C:N:P ratios of the influx and efflux of substrates. These fluxes retain the stoichiometry of their source SOM pools unless the microbial community’s element use efficiencies change during the process (Figure 1, Yu et al., 2020). The respiration rate in JSM mainly depends on the microbial growth and its carbon use efficiency (CUE), which adjusts with nutrient availability (Table 2 and Figure 1).
In this study, we refer to Rs only as heterotrophic respiration, since root respiration is not described in our models. Therefore we only qualitatively compare the Rs responses of model simulations with the general pattern that is often observed from experiments partly because a qualitative analysis is sufficient for our aim, and partly due to an absence of Rs observations from the simulated study sites to directly compare to model results.
Model Protocols, Scenarios, and Sensitivity Analysis
Model Protocols
Both models require soil temperature, moisture, and litterfall as forcing data, which were generated by running the full QUINCY model (including the respective soil submodel and vegetation processes), for 500 years at each site. To account for the natural litter P gradient in Table 1, we modified the QUINCY model outputs at VES, COM, and LUE sites to replicate the observed trend in litter P concentrations. The soil texture profiles for all the sites were obtained from observations and were used by both models as inputs. The time series of N deposition for each site was extrapolated from Lamarque et al. (2010) and Lamarque et al. (2011). For the P deposition, model estimates of nutrient and dust fluxes from Brahney et al. (2015) and Chien et al. (2016) were used. Site-specific climate data were taken from the nearest grid-cell of the daily CRU-NCEP (Viovy, 2018), as described in Thum et al. (2019). The initialization of litter and soil inorganic P pools in both models followed the protocol in Yu et al. (2020), in which each study site is initialized with its observed Hedley P pool sizes. The initialization of SOM pools assumed the same total CNP contents of litter and SOM for each site, however, specific pool sizes differ between the two models given their different pool structure and vertical distribution of SOM. The microbial C:N:P ratios in JSM were parameterized using the field observations (Lang et al., 2017).
Model Scenarios
We first ran both models at all the study sites to evaluate their performances against observed SOM profiles and to set up the baseline for the N and P fertilization scenarios, referring to this scenario as the control treatment (CK). We spun up both models for 900 years before 1920 to guarantee that a stable SOM profile has been reached (see also Yu et al., 2020), and ran the model for 150 years (1920–2070). Both spin-up and model simulation used the same 1-year soil and litter forcing generated as described in the previous section. We used the JSM parameterization from our previous study (Yu et al., 2020) which was calibrated at the VES site, as for the QUINCY-soil model, we used the parameterization from Thum et al. (2019)’s study and tuned the SOM stoichiometry parametrization (Table 3) in the allowable range to match the observed SOM stoichiometry at VES. To explore the modeled soil responses to N and P additions, we conducted a model scenario to reproduce ongoing field N x P fertilization experiments, which consists of an N addition treatment (N-add), and a P addition treatment (P-add). In the N-add treatment, 150 kg N/ha was added as ammonium nitrate (NH4NO3) to each study site at five dates (30 kg per dosage): September 16, 2016; April 17, 2017; June 17, 2017; September 17, 2017; May 18, 2018. In the P-add treatment, 50 kg/ha P was added once as potassium dihydrogen phosphate (KH2PO4) on September 16, 2016 (Jaane Krüger, personal communication). The added N accounts for 0.5, 0.9, 1.0, 1.3, and 2.0% of the total soil N at the sites along the soil P gradient (BBR > MTF > VES > COM > LUE), respectively; the added P accounts for 0.1, 0.6, 0.6, 1.3, and 2% of the total soil P at the sites along the soil P gradient, respectively. The simulation ends in 2070, allowing for a long-term (>50 years) perspective of the fertilization scenarios. To test the effect of litter quality on soil responses to nutrient addition, we implemented a model scenario, in which all the five sites have equal litter C:P ratio, for the control, N addition, and P addition treatments (Lit-CK, Lit-N-add, and Lit-P-add). According to the field observations (Table 1), the litter C:P ratios of all the five sites in equal-litter scenarios were set as that of BBR and MTF in the CK scenario, meaning that VES, COM, and LUE sites were 10, 20, and 30% lower than their values in the CK scenario, respectively.
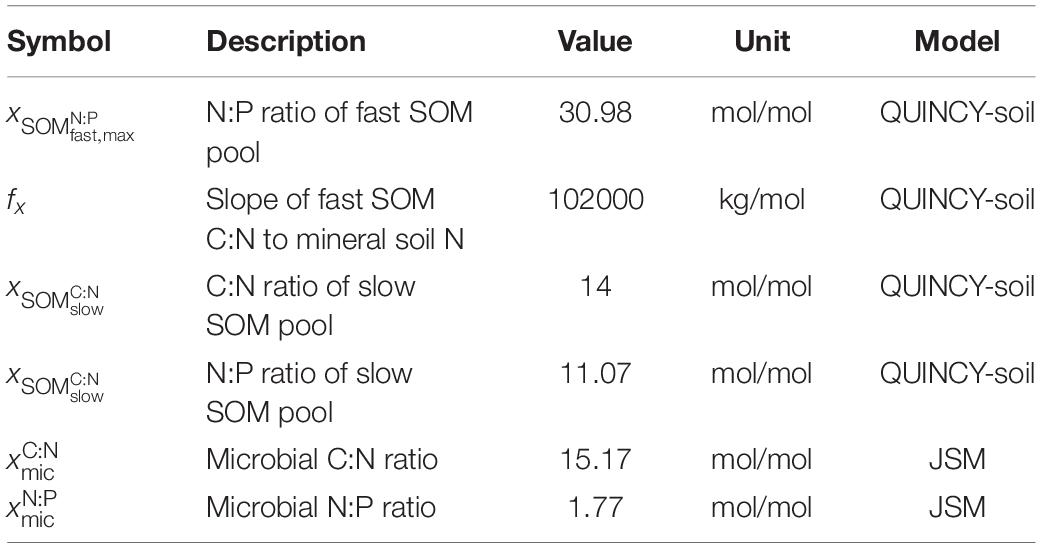
Table 3. Parameter for sensitivity analysis.
Sensitivity Analysis
To explore the effects of SOM stoichiometry on soil responses to nutrient addition, we tested the sensitivity of both models to changes of parameters that control SOM stoichiometry, using a hierarchical Latin hypercube design, which is a robust, scalable Monte Carlo-type stratified sampling approach that is used in many areas of science and engineering (LHS, Zaehle et al., 2005). For JSM, the SOM stoichiometry is an emerging property of flexible SOM stoichiometry, which is regulated by fixed microbial stoichiometry, therefore we varied the microbial C:N and N:P ratios between 75 and 125% of the default values to form a set of 50 LHS samples (Table 3), i.e., parameter sets. For QUINCY-soil, the SOM stoichiometry is determined by the prescribed stoichiometry of individual SOM pools. Therefore we selected four SOM stoichiometry parameters and varied each parameter between 75 and 125% of the default values to form another set of 80 LHS samples (Table 3). For each LHS sample in each model, we ran the three treatments (CK, N-add, P-add) for the VES site in parallel, and firstly evaluated the model output from all the CK LHS model runs in terms of soil C, N, and P stocks, soil respiration, and mineralization rates of N and P; secondly, we calculated the fertilization responses, i.e., output differences between N-add and CK as well as between P-add and CK for each LHS sample, and evaluated the output in term of respiration only.
All statistical tests were carried out with the RStudio software (R Core Team, 2013). Trend analyses were carried out with the Mann–Kendall test (M–K test) of the Kendall R package (McLeod, 2011). In the Mann–Kendall test, the tau (τ) value varies between −1 and 1, where −1 represents a decreasing trend and 1 represents an increasing trend. The match between the modeled soil profile and observed soil profile was evaluated with a normalized root mean square ratio term, Knrmsr, which is modified to represent the average proportions between modeled and measured values.
Ki is the variable representing the ratio between simulated and observed values at the observed ith layer. Since the observation depths differed from the model soil layer depths, Ki values can only be compared using volumetric units. Although each depth shares the same weight in the calculation, Knrmsr is weighted toward topsoil due to the increasing sampling intervals. To balance the influences of overestimation and underestimation, Ki is always normalized between 0 and 1 where 1 represents a perfect match of simulated and observed values.
Results
Comparison of Observed and Simulated Soil Profiles
The simulated soil profiles of original (CK) and equal-litter (Lit-CK) control treatments for both JSM and QUINCY-soil model (referred to as QS in annotations of figures and tables) were compared with observed data (Figure 2). Although both models were tuned to the VES site, JSM better represented the SOC, soil inorganic P (SIP), soil organic P (SOP), and SOM profile C:N ratio, as the Knrmsr values of JSM were greater than QUINCY-soil by 0.12, 0.16, 0.19, and 0.09, respectively (Supplementary Table S1). In contrast, QUINCY-soil underestimated SIP contents and failed to capture the decreases of C:N and C:P ratios with increasing soil depth (Figure 2 and Supplementary Table S2). For the simulations of the other four sites, which used the calibration to VES, we observed similar differences between the two models. The goodness of fits between simulations and observations were similar as at VES (Supplementary Table S1), especially for soil C:N and C:P ratios (Figure 2). However, JSM performed better than QUINCY-soil in simulating SIP (Knrmsr greater by 0.13 ± 0.16, Supplementary Table S1) and SOP (Knrmsr greater by 0.16 ± 0.06, Supplementary Table S1) contents as well as SOM C:N (Knrmsr greater by 0.06 ± 0.05, Supplementary Table S1) and C:P (Knrmsr greater by 0.03 ± 0.10, Supplementary Table S1) ratios (Figures 2C,D). The simulation results from CK treatment better reproduced topsoil C:P ratio and SIP content compared to the Lit-CK treatment, particularly at the most P-poor site LUE, demonstrating the need to correctly account for litter P concentration in these simulations, and thus an adequate representation of this process across sites.
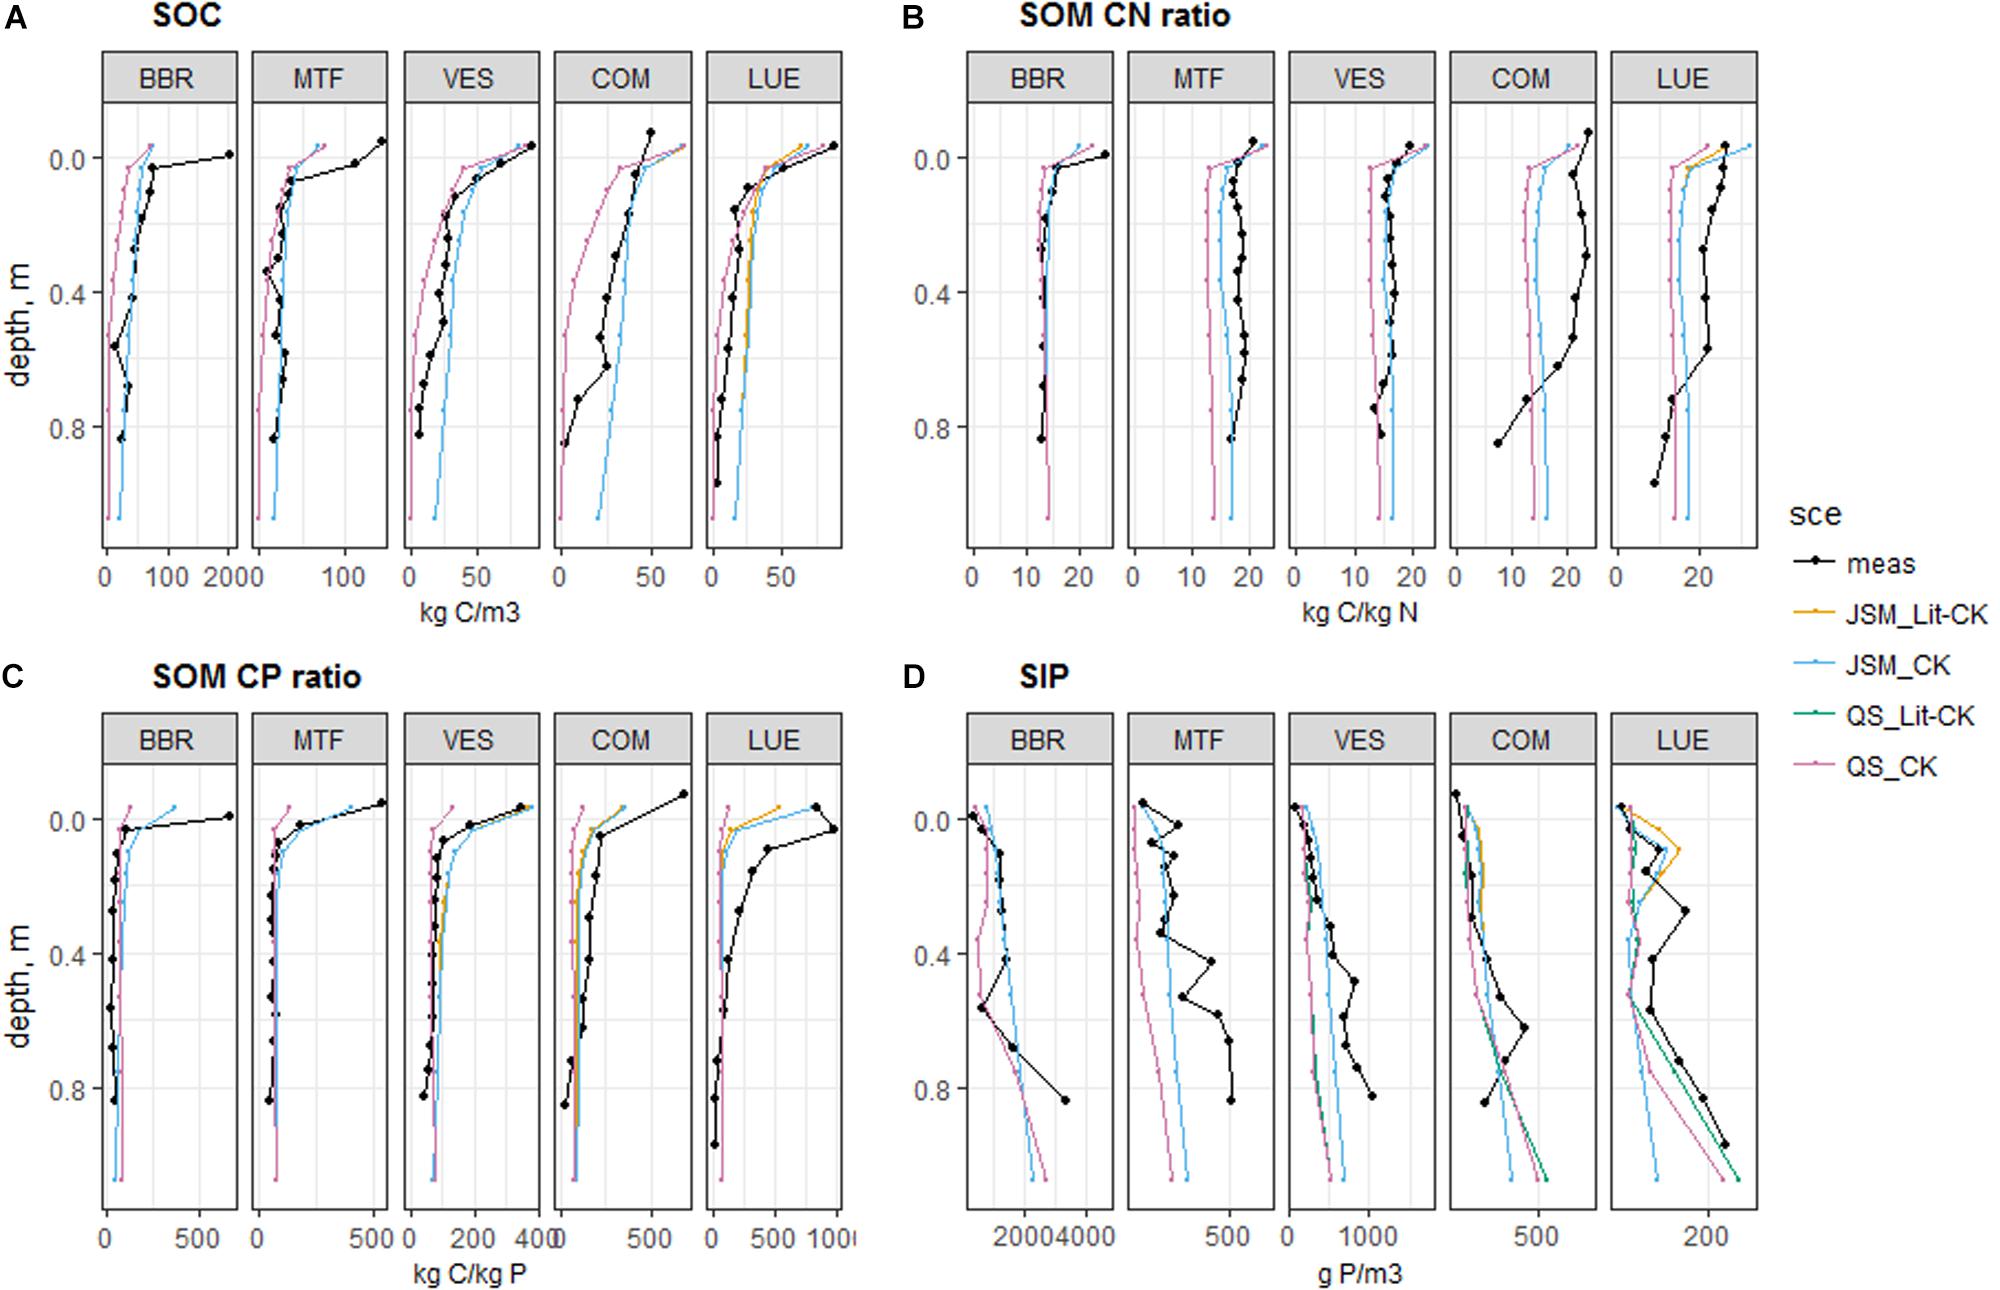
Figure 2. Simulated and observed (A) SOC content, (B) C:N ratio in SOM, (C) C:P ratio in SOM, (D) SIP content at the study sites up to 1 m soil depth. Black lines and dots: observations; colored lines and dots: simulated mean values by control (CK) and equal-litter control (Lit-CK) treatments. Simulated means were calculated using data from the last 10 years of model experiments.
Based on field measurements, we detected a slightly decreasing trend in SOC content, strong decreasing trends in soil organic N (SON), SOP, and SIP contents, and slight increasing trends in soil C:N, C:P, and N:P ratios along the decreasing soil P gradient (BBR > MTF > VES > COM > LUE) (Table 4). With respect to our models, JSM was generally much better in reproducing the observed trends along the P gradient by capturing the trends in SOC (M–K test τ of observation vs. JSM: −0.6 vs. −0.6), SOP (M−K τ: −1 vs. −0.6), and SIP (M−K τ: −0.8 vs. −0.8) contents and SOM C:N ratio (M−K τ: 0.6 vs. 0.6), whereas QUINCY-soil model only captured the SIP (M−K τ of observation vs. QS: −0.8 vs. −0.6) trend. JSM could capture the SOP trend with realistic stoichiometry in litter forcing (CK, Table 4), indicating the important role of litter stoichiometry on SOM formation. Both models did not reproduce observed trends of soil C:P and N:P ratios along the soil P gradient, but JSM performed much better in reproducing the observed decreasing trends of C:P (M−K τ of observation vs. JSM: −0.96 to −0.67 vs. −0.83 to −0.68) and N:P (M−K τ: −0.89 to −0.67 vs. −0.89 to −0.71) ratios with increasing soil depth (Supplementary Table S2).
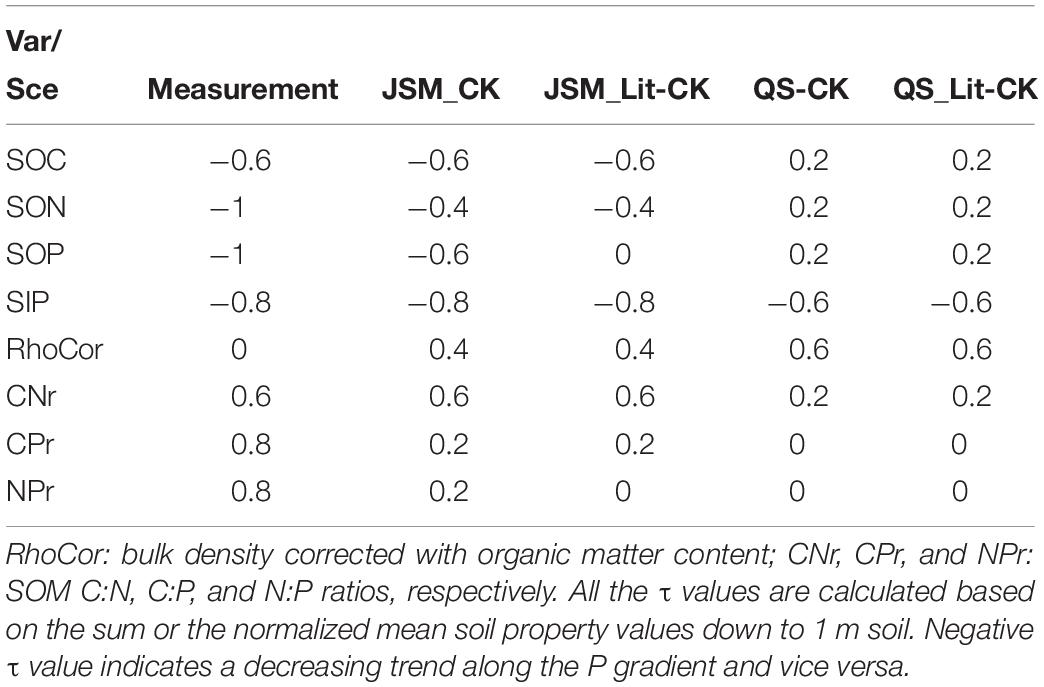
Table 4. The tau (τ) values of the Mann–Kendall trend test for main soil variables along the soil P gradient (BBR > MTF > VES > COM > LUE) of field measurements and control (CK) and equal-litter (Lit-CK) scenarios for JSM and QUINCY-soil (QS) models.
Modeled Soil C Cycling Responses to Nutrient Additions
The addition of nutrients affected C cycling and storage in the model scenarios at most study sites (Table 5 and Figure 3). According to the mass balance, an increase in Rs, i.e., a positive response, led to a decrease in C storage and vice versa. The addition of N (N-add) led to decreased Rs in JSM at all sites, and increased Rs in QUINCY-soil at all sites except MTF. The addition of P (P-add) led to strong Rs decreases in JSM but caused no Rs responses in QUINCY-soil (Table 5). Our simulations indicated that N-add in both models led to increases of microbial biomass and residue C (C_fast in Figure 3) and decreases of soil litter C pool. Litter C decrease was offset by an increase in fast C, therefore, resulting in negative Rs responses in JSM; While in QUINCY-soil, there was no offset of litter loss by the fast C pool and the model simulated Rs increases (Figures 3A,B). P-add in JSM also generally increased the microbial biomass C, which led to stronger depolymerization and Rs increases at the P-poor LUE site, but not at other sites (Figures 3C,D).
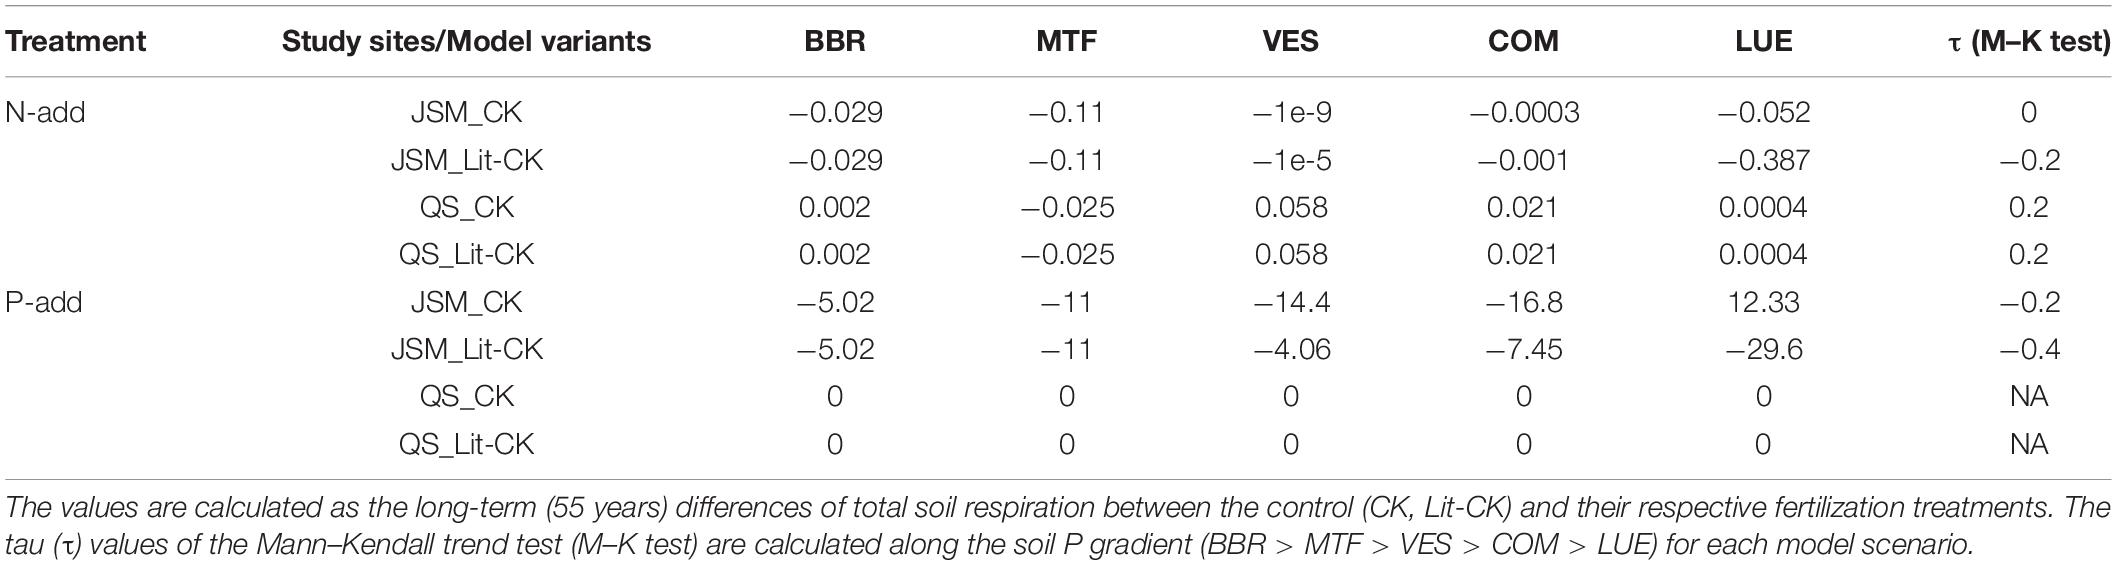
Table 5. Simulated soil respiration responses (g C/m2) of model scenarios at all study sites.
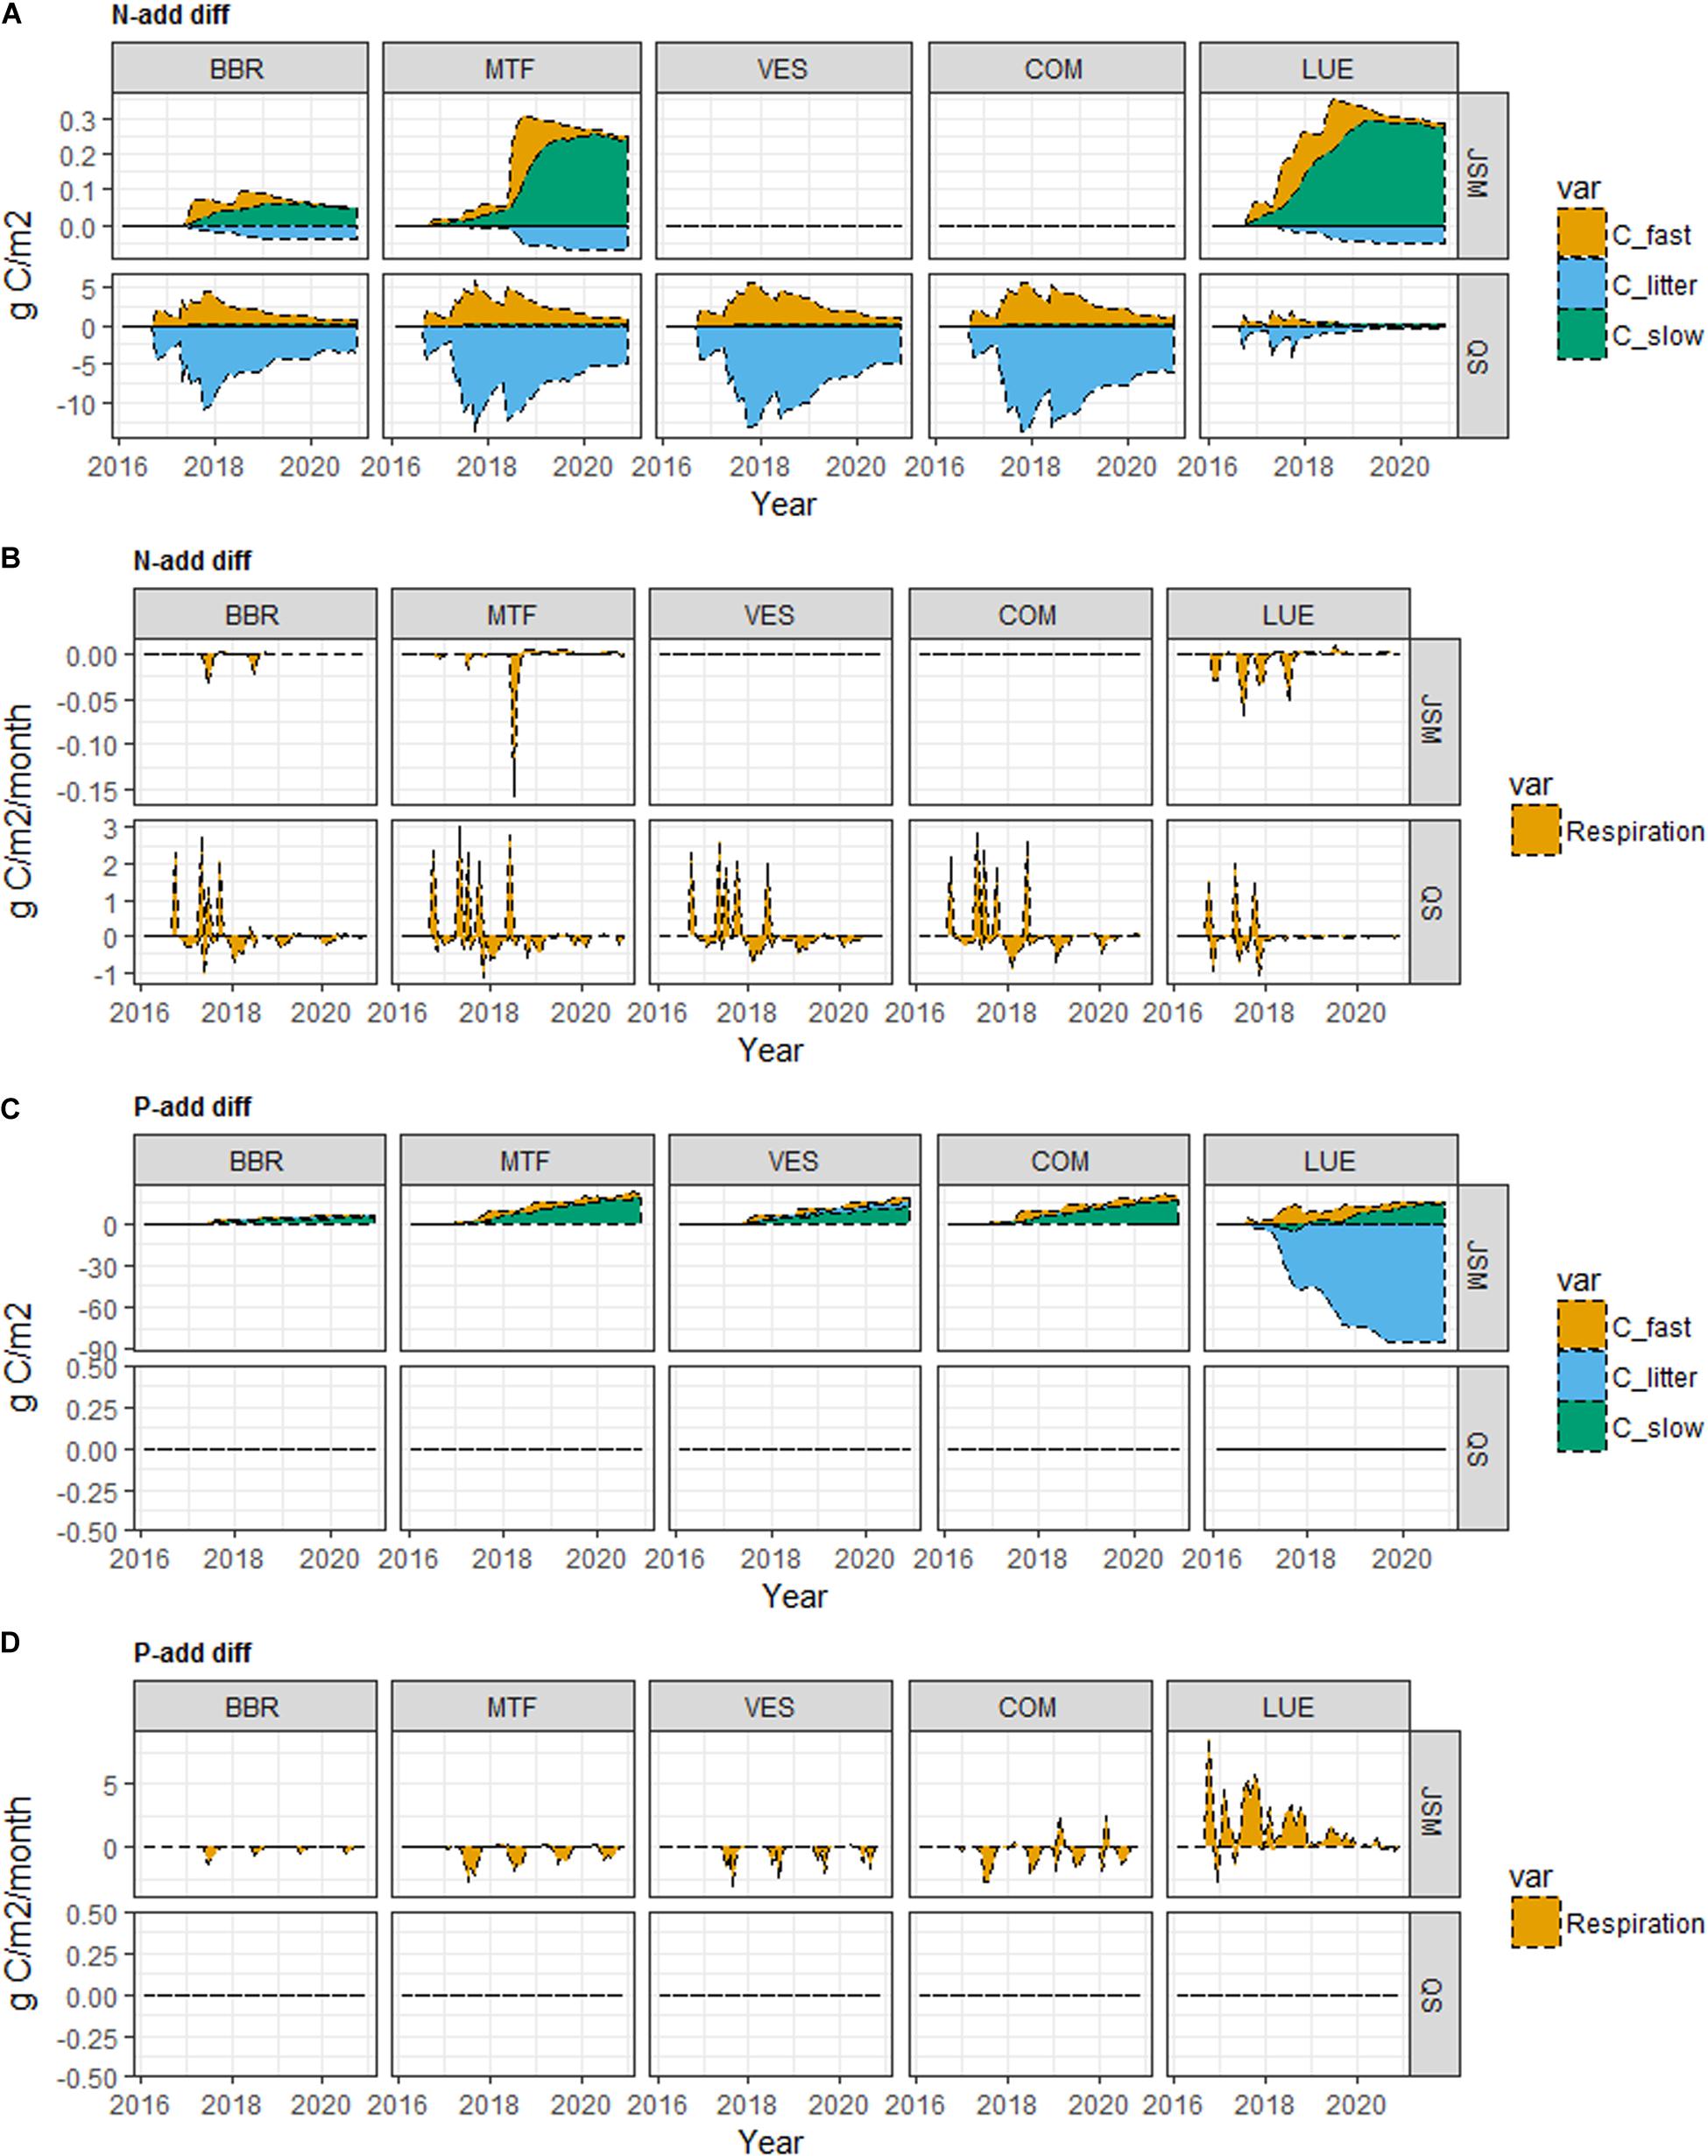
Figure 3. Simulated SOC and soil respiration responses to N addition (A,B, N-add diff), and P addition (C,D, P-add diff) of JSM and QUINCY-soil (QS) at the study sites along the soil P gradient (BBR > MTF > VES > COM > LUE). Fast C refers to C in microbe, microbial residue and dissolved organic matter (DOM) pools in JSM, and C in fast SOM pool in QUINCY-soil; slow C refers to C in mineral-associated DOM and mineral-associated residue pools in JSM, and C in slow SOM pool in QUINCY-soil; litter C refers to C in litter in both models. Time for N addition: September 2016; April 2017; June 2017; September 2017; May 2018. Time for P addition: September 2016.
Effects of Soil P Stock, Litter Quality, and Temporal Responses
The effect of the soil P gradient on Rs responses to nutrient addition was not found, since no clear trends were confirmed along the soil P gradient (BBR > MTF > VES > COM > LUE) in any of the model scenarios (Table 5). In QUINCY-soil, there were no Rs responses to P addition at all study sites (Figures 3C,D), while in JSM, we did see a different pattern of Rs responses to P addition at the P-poor LUE site compared to the other four sites. Meanwhile, the negligibly small Rs responses to N addition at two middle sites (VES and COM) also showed that soil P was not controlling the responses to N addition in JSM (Figure 3). In QUINCY-soil, Rs responses were not sensitive to litter C:P ratios, indicated by the same Rs responses in CK and Lit-CK scenarios (Table 5). However, in JSM, Rs responses to P and N additions were changed by decreasing litter C:P ratios, particularly at LUE. A 30% decrease of litter C:P ratio changed Rs response to P-add from positive to negative mainly due to a decrease in litter-C, which was not seen at VES or COM (where a decrease of 10 and 20% of litter C:P ratio was applied, respectively).
Modeled Soil Nutrient Responses to Nutrient Additions
We noticed divergent temporal patterns of the two models’ N responses to N-add (Figure 4 and Supplementary Figure S1). In QUINCY-soil, a substantial amount of N was quickly incorporated to fast SOM via microbial uptake after N addition (between 0.6 and 1.5 g N for all study sites) and then slowly released and taken up by plants, whilst in JSM, most of N was quickly taken up by plants after fertilization and only a minor amount (<0.01 g N/m2) was incorporated into SOM (Supplementary Figure S1). This difference primarily reflects the difference in the representation of SOM stoichiometry, where the QUINCY-soil model applies a heuristic function to decrease SOM C:N with increasing N availability, whereas stoichiometric changes in JSM occur only by changing the magnitude of organic pools, resulting in the much slower responses of simulated SOM after nutrient additions.
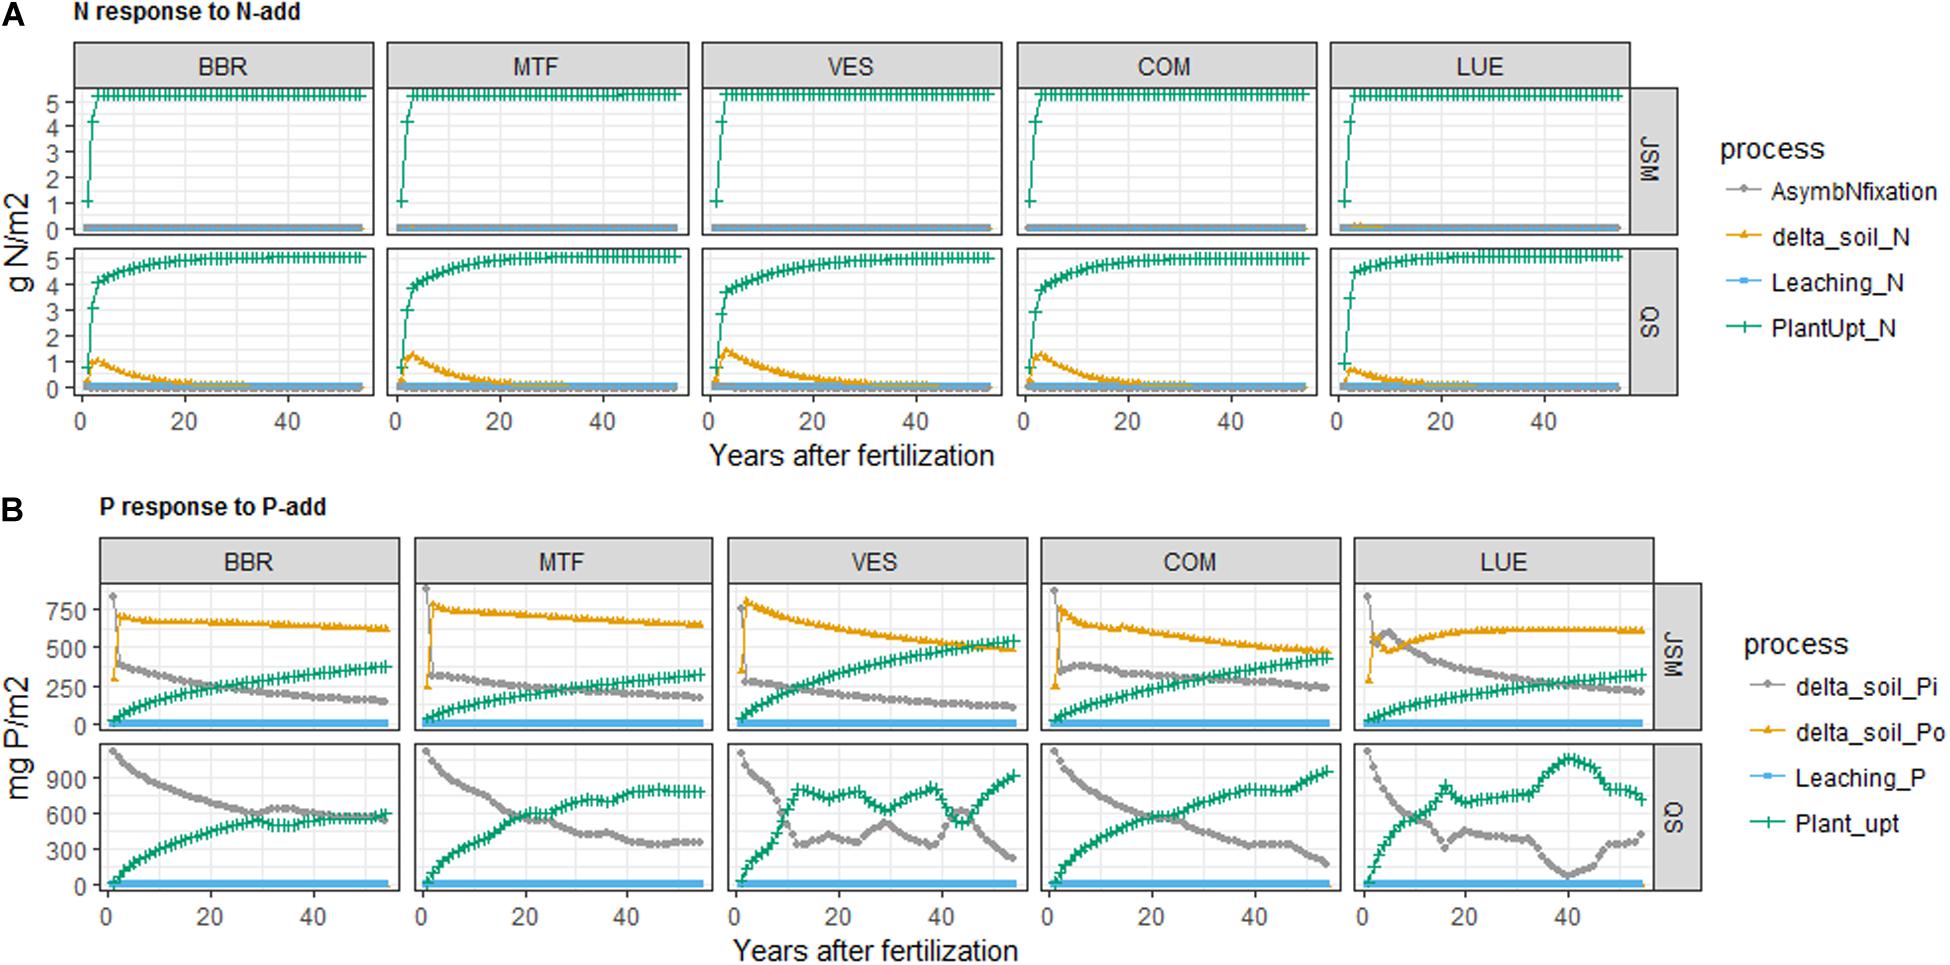
Figure 4. Simulated changes of (A) N budget after N addition (N-add) and (B) P budget after P addition (P-add) in JSM and QUINCY-soil (QS) at the study sites along the soil P gradient (BBR > MTF > VES > COM > LUE). The proposed processes for the N budget are: N fixation, SON change, N leaching, and plant N uptake; the proposed processes for P budget are: SIP change, SOP change, P leaching, and plant P uptake.
The responses of soil P pools to P-add were largely different from the responses of N pools to N-add due to the presence of SIP pools and inorganic P cycling processes. The two models’ responses to P addition also largely differed (Figures 4, 5, 6 and Supplementary Table S3) due to their distinct representations of SOM processes. In JSM, of all the added P (P-add: 1.14 g P/m2 for each site) in various treatments at all study sites, 40–60% was stored in SOM, 25–50% taken up by plants, and 10–20% was stored as SIP (Supplementary Table S3 and Figure 4). However, in QUINCY-soil, no P was stored in SOM and the storage of the added P in SIP varied greatly among sites and treatments, from 15% to almost 50%. We also noticed that the response of P cycling processes after P addition was different in JSM and QUINCY-soil (Figures 4, 5, 6). P-add in QUINCY-soil led to an immediate spike of phosphate adsorption followed by a continuous increase of plant P uptake and a decrease in bio-mineralization (Figures 5B, 6B). However, in JSM, P-add led to an increase in adsorption as well as to an instantaneous decrease in bio-mineralization (except LUE), followed by continuous desorption and alternating changes of net P mineralization, microbial P uptake (Figures 5, 6).
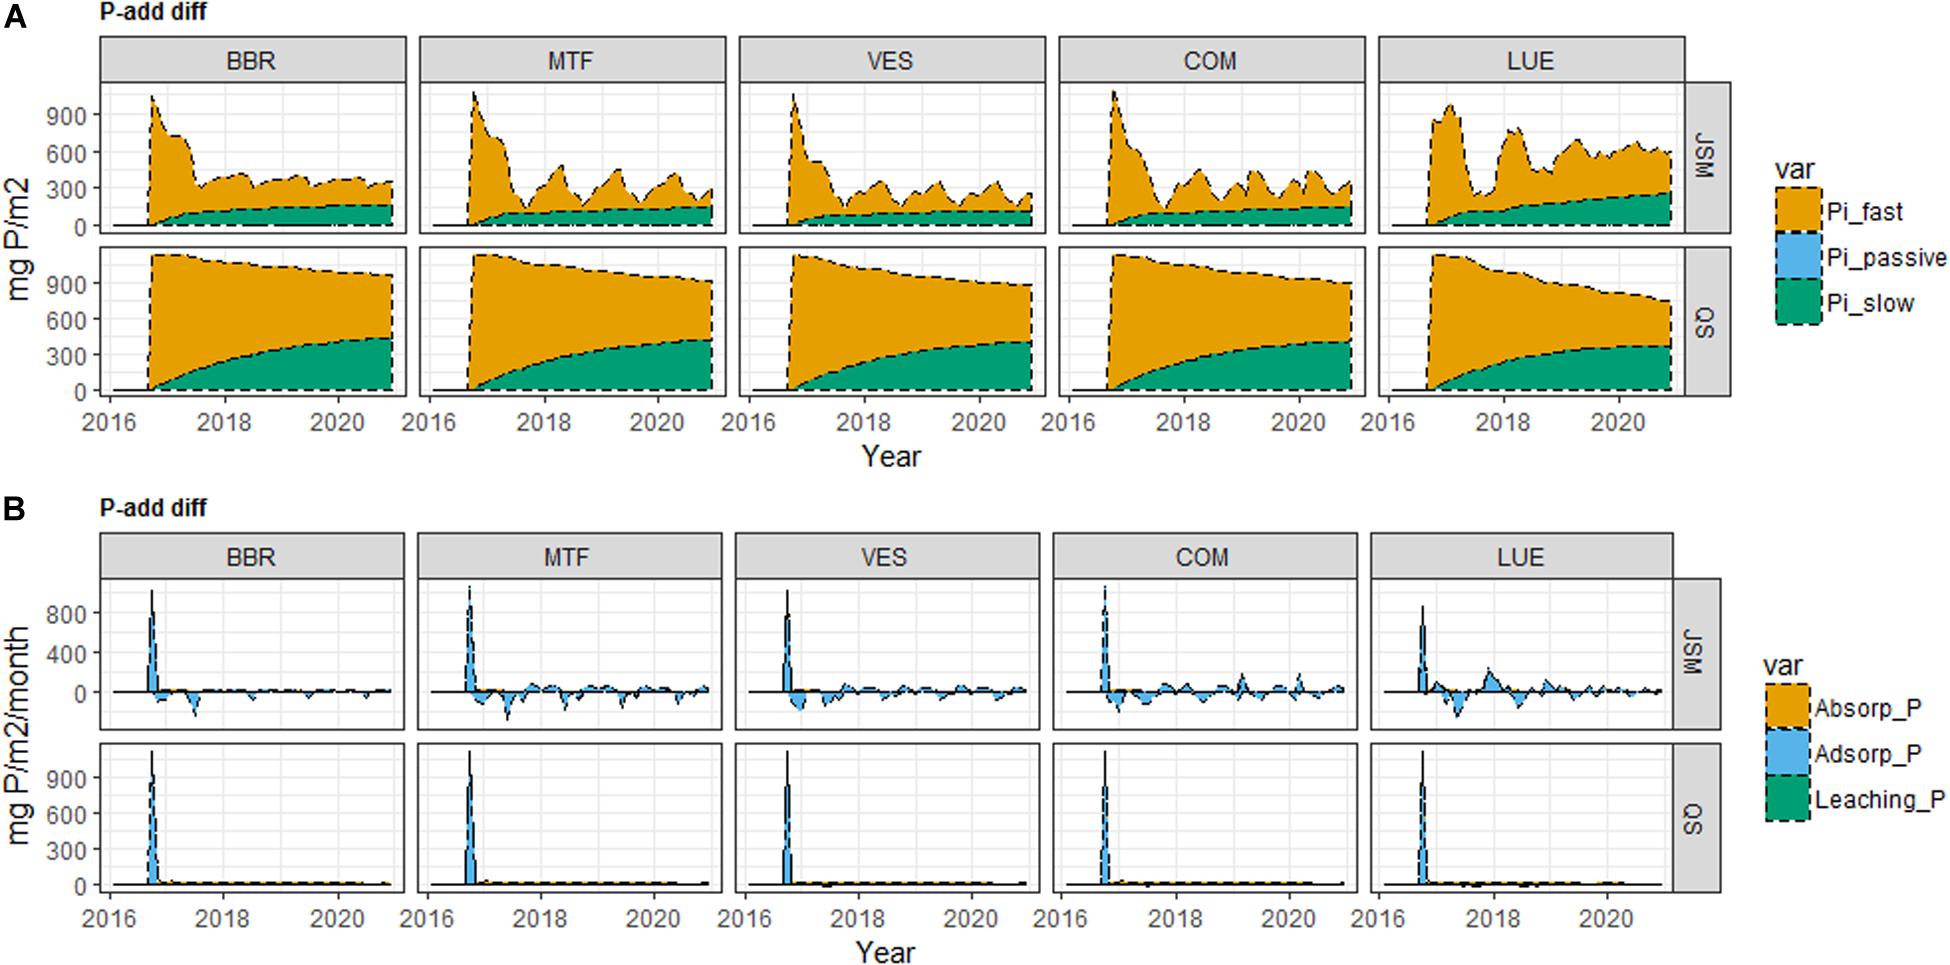
Figure 5. Simulated (A) soil inorganic P (SIP) pool responses and (B) inorganic P cycling processes responses to P addition (P-add diff) of JSM and QUINCY-soil (QS) at the study sites along the soil P gradient (BBR > MTF > VES > COM > LUE). In both models, fast Pi refers to soluble and labile inorganic P pools, slow Pi refers to strongly sorbed P pool, and passive Pi refers to occluded and primary P pools; adsorption (adsorp_P) and absorption (absorp_P) refer to transfer of P from soluble pool to labile pool and from labile pool to sorbed pool, respectively. Time for P addition: September 2016.
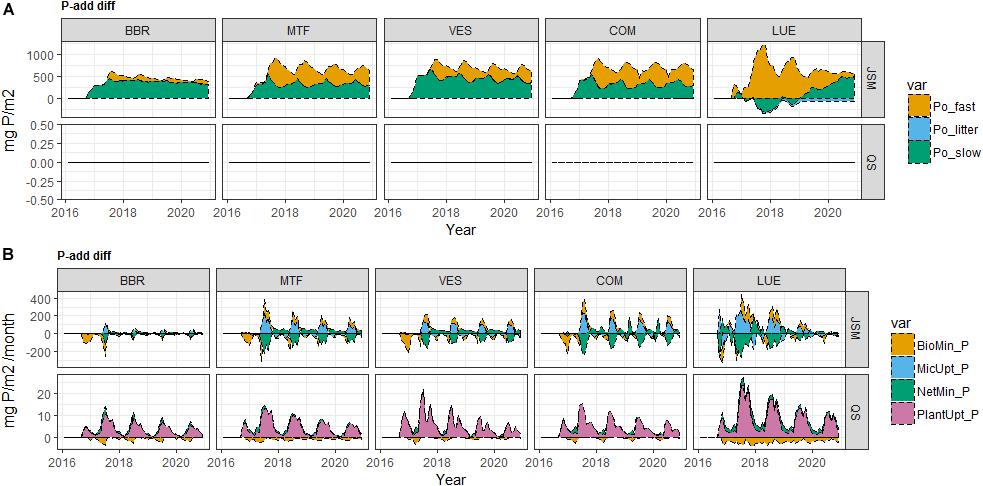
Figure 6. Simulated (A) soil organic P (SOP) pool responses and (B) organic P cycling processes responses to P addition (P-add diff) of JSM and QUINCY-soil (QS) at the study sites along the soil P gradient (BBR > MTF > VES > COM > LUE). Fast P refers to P in microbe, microbial residue and dissolved organic matter (DOM) pools in JSM, and P in fast SOM pool in QUINCY-soil; slow P refers to P in mineral-associated DOM and mineral-associated residue pools in JSM, and P in slow SOM pool in QUINCY-soil; litter P refers to P in litter in both models. Organic P cycling processes include bio-mineralization, microbial uptake, net mineralization, and plant uptake of P. Time for P addition: September 2016.
Effect of SOM Stoichiometry (Sensitivity Analysis)
In general, outputs and nutrient addition responses of JSM and QUINCY-soil showed similar overall sensitivities to changes in SOM stoichiometry parameterization (Figure 7A). In both models, SOM stocks and P mineralization were most sensitive to parameter uncertainty. However, in QUINCY-soil, respiration, net N mineralization, as well as SOC and SIP contents showed no sensitivity to uncertainty in parameters of the SOM stoichiometry. Contrary, with JSM, soil stoichiometry also influenced those model outputs. One key difference between the two models, as shown in Figure 7B, is their different responses to N and P additions. The Rs responses to N addition in QUINCY-soil were constrained around the median value, but they highly deviated from the median value in JSM. Regarding P addition, QUINCY-soil had no Rs responses in each LHS sample; while JSM had strong negative Rs responses that were much constrained to the median value compared to N addition (Figure 7B). With respect to the magnitude and direction of Rs responses to nutrient additions, P-add in JSM had strongest negative responses (−189.32 mg C/year) and N-add in JSM had weakest positive responses (0.07 mg C/year), but we noticed that of all the three treatments, Rs responses could be either positive or negative depending on SOM stoichiometry parameterization.
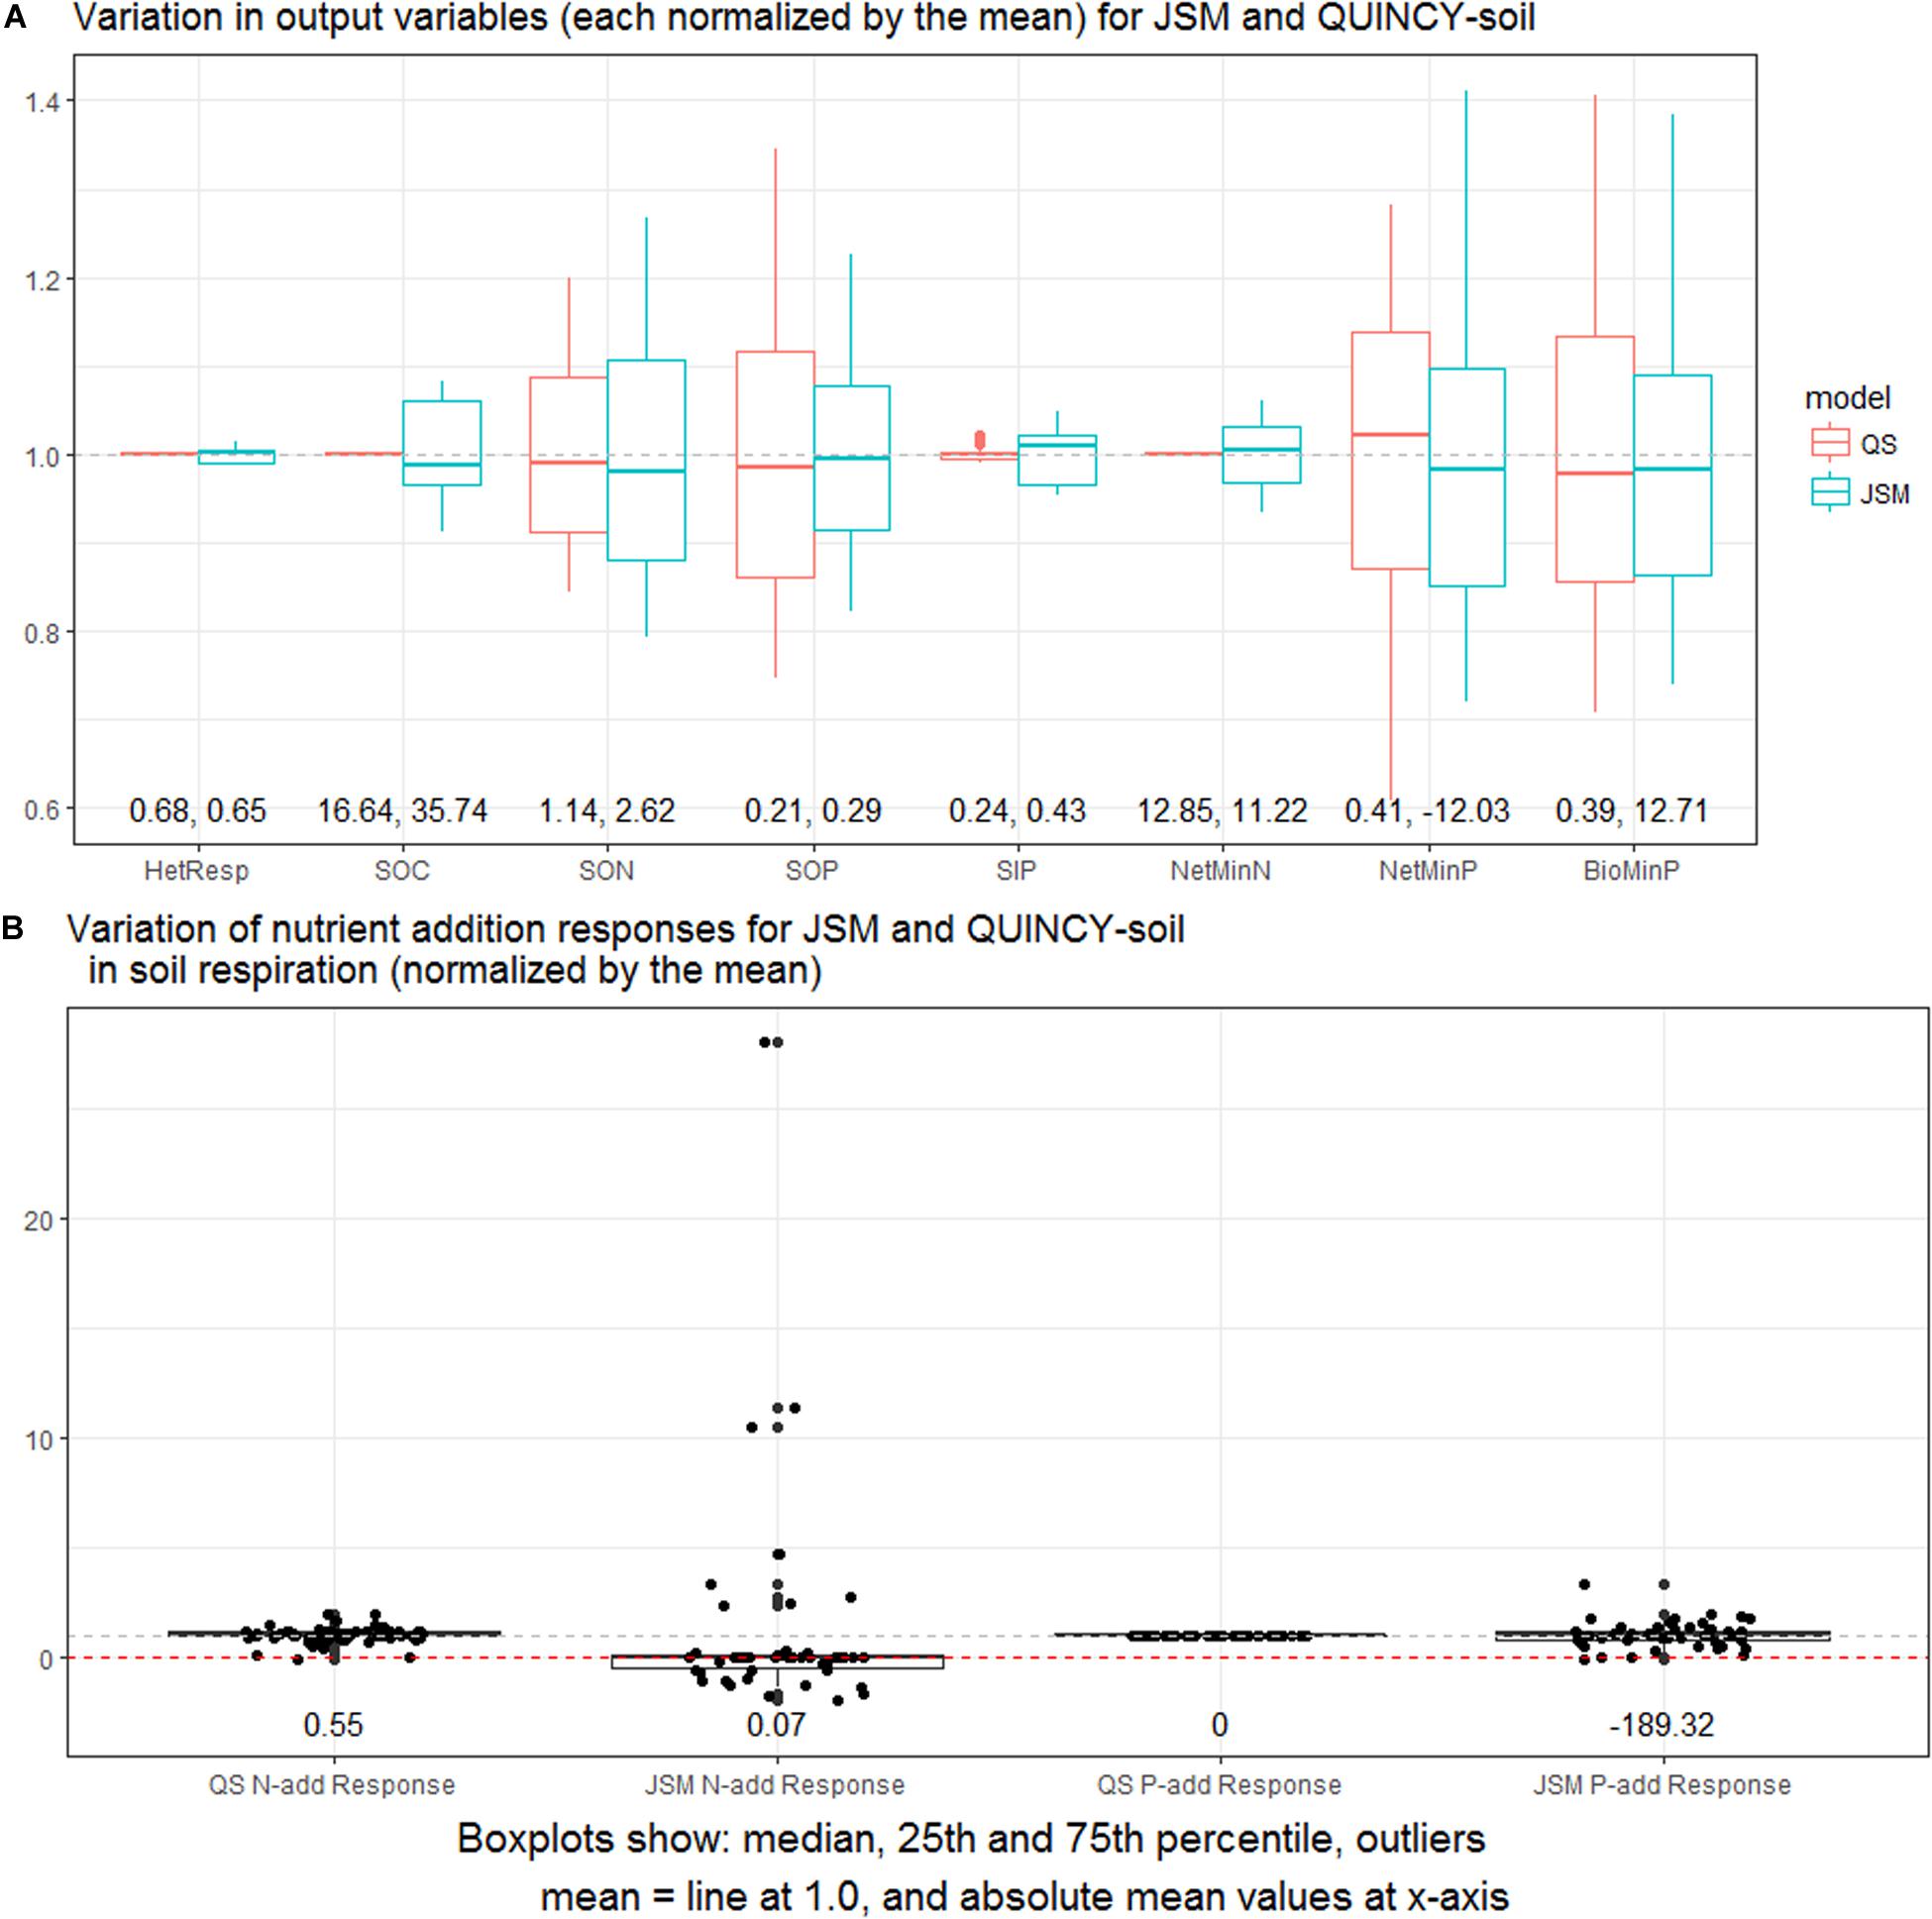
Figure 7. (A) Normalized output variations in the LHS sensitivity analysis for JSM and QUINCY-soil (QS). The selected output variables include respiration, total soil organic C, N, and P, total soil inorganic P, net mineralization of N and P, and P bio-mineralization. (B) Normalized variations of soil respiration responses (mg C/year) to nutrient additions in the LHS sensitivity analysis for JSM and QUINCY-soil. The plots are based on data from the last 10 years of simulations.
Discussion
Effects of Soil Phosphorus Gradient on SOM Profiles
By comparing the model simulations of both models with observations of SOM profiles from the soil P stock gradient (BBR > MTF > VES > COM > LUE), we have found that the JSM is generally better than QUINCY-soil in reproducing the observed SOM profiles (such as SOC, SOP, SIP, and soil C:N ratio, Supplementary Table S1) as well as capturing the observed effect of the soil P gradient on other soil properties (such as SOC, SOP, and soil C:N ratio, Table 4) along the P gradient. Lang et al. (2017) have found that some ecosystem traits, i.e., the proportion of diester P in soil, the residence time of forest floor, fine root biomass, and P content in leaf litter and fine-roots (Table 1), define the P nutrition and distinguish P cycling strategy of these sites along the soil P stock gradient (BBR > MTF > VES > COM > LUE). These ecosystem traits are better correlated with soil P stock, rather than foliage P. Our further analysis of field observation data has indicated, that this soil P stock gradient is also correlated with decreasing SOC and SON contents, and slightly increasing soil C:N, C:P, and N:P ratios (Table 4). These observational trends are better reproduced by JSM. Since the major difference between the two models are the microbially mediated C, N, and P interactions of SOM formation and turnover, this suggests that connections between soil P and C, N cycling are to a large extend regulated by these microbial interactions (Table 2 and Figure 1). Moreover, the fact that the soil P gradient is highly correlated with other ecosystem properties such as fine root biomass and forest floor residence time, with important implications for SOM storage, turnover and depth profiles, highlights the need that TBM should also be able to reproduce plant-soil-microbe interactions in a way to capture these patterns along nutrient gradients.
Simulated Soil Responses to Nutrient Addition
The general pattern of observed Rs responses to nutrient addition, that N addition decreases soil respiration whereas P addition increases it (Feng and Zhu, 2019; Zhou et al., 2014), is not fully reproduced by either model. However, many reported Rs responses from literature are not consistent with the general pattern due to specific site conditions (Wang et al., 2017, Zeng and Wang, 2015, Groffman and Fisk, 2011); therefore, modeling can help understand the driving mechanisms.
QUINCY-soil simulated Rs increases to N addition at all study sites and simulated no Rs changes to P addition in all the model scenarios and sensitivity tests (Table 5 and Figure 7). The key assumption in QUINCY-soil is that the Rs responses to nutrient addition are solely regulated by a heuristic function between soluble N concentration and soil C:N ratio, which aims at mimicking a long-term pattern between N availability and SOM stoichiometry of a fully coupled plant-soil system, rather than describing the process response such as nutrient mining (Meyer et al., 2018) or priming effects (Dijkstra et al., 2013). With respect to N addition in QUINCY-soil, the soluble N concentration increased after N addition, which generally decreased the C:N ratio in the fast SOM pool (Figure 1, Parton et al., 1988). A decreased C:N ratio of fast SOM pool spontaneously increased microbial N demand in QUINCY-soil, which was compensated through increasing litter decomposition, thus leading to an increase in Rs. In some cases, if the site is rich in N, such an increase in Rs could be interrupted due to our prescribed minimum C:N ratio of fast SOM pool, which might be the reason for negative Rs responses to N additions in few occasions (Table 5 and Figure 7). Such a mechanism is not described between soluble phosphate concentration and SOM C:P ratio, leading to no Rs responses to P addition under different soil P, litter quality, fertilization type or SOM stoichiometry in QUINCY-soil.
Jena Soil Model was able to reproduce the Rs decreases to N addition, but only simulated an Rs increase to P addition in the most P-poor site LUE and Rs decreases at other sites (Table 5 and Figure 3). The fact that in JSM, Rs increased after P addition only at the very P-poor site agrees with the finding that P-poor tropical soils usually have positive Rs responses to P addition while other soils not (Hui et al., 2019; Feng and Zhu, 2019, Fanin et al., 2012). Although Rs decreases can be simulated after N and P addition in JSM, the reasons are different for N and P. N addition leads to a decreased N mining and thus decreased respiration, while P addition leads to increased SOC sequestration thus decreased respiration. In JSM, N- and P-add increased the microbial biomass at all study sites but the increases of microbial biomass were much higher when P was added (Figure 3), because the microbial biomass was extremely P demanding in our model parameterization, indicated by the very low microbial N:P ratios (ca. 1, Table 1) compared to the global average value (ca. 6, Xu et al., 2013). N and P additions reduced the microbial mining of N (N mineralization, Supplementary Figure S1) and P (P bio-mineralization, Figure 6) in JSM, respectively. Since the N mining was always associated with C decomposition, a decrease in N mineralization led to a corresponding decrease of respiration in most cases. However, for P, the decrease of P mining did not directly lead to a change of stable SOC pool but only to an increase of microbial biomass C, which further resulted in an increased of C in microbial residue and mineral-associated residue pool, thus reducing respiration.
The magnitude of respiration responses in JSM depended on several interacting processes, such as microbial growth, organo-mineral association, enzyme allocation and depolymerization (Figure 1), and was sensitive to changes of soil P stock, litter quality, and microbial stoichiometry (Table 5, Figure 3, and Supplementary Figure S1). Moreover, P addition did not reduce the mining of P (Figure 6B) and led to a strong increase of microbial biomass at LUE, indicating a P limitation in microbial biomass. The litter decomposition was thus enhanced due to much larger decomposer biomass, leading to an increase in respiration. Alternatively, an increase in respiration after N addition in JSM could also be caused by a decrease of microbial CUE after N addition (cases in sensitivity tests, data not shown), but such a mechanism seems not supported by lab analysis at a grassland site (Spohn et al., 2016), in which the authors observed an increase of microbial CUE after N fertilization. One caveat of JSM simulations was the much stronger Rs response to P-add than N-add, which still held under varying microbial stoichiometry in the sensitivity test (Table 5 and Figure 7). But such a pattern is not supported by any observational evidence. This might be because JSM ignored the N demand of enzyme allocation, which simply underestimated the N demand of soil microbial processes.
Implications for Soil Modeling and Field Observation
Both models used in this study are stand-alone soil models, meaning that no feedback from vegetation was considered, including the responses of root growth or respiration. Therefore it is not possible to directly compare our simulations to many field studies due to the lack of a complete plant-soil-microbe framework (Čapek et al., 2018). Nevertheless, based on our simulations we can identify fields for the further developments of soil models or soil modules in TBMs, and also discuss the implications of our model simulations for collecting and interpreting future field observations.
Jena Soil Model and QUINCY-soil generally performed differently in reproducing the observed soil profiles, as well as simulating soil responses to N and P additions under different litter qualities, fertilization types, and SOM stoichiometry at all study sites. This shows that alternative assumptions about SOM formation and turnover can lead to substantial differences in model simulations and their sensitivity to perturbations. The better performance of JSM to reproduce SOC and soil C:N ratio may be mainly due to the representation of the organo-mineral association (as discussed in section “Effects of Soil Phosphorus Gradient on SOM Profiles”), which is not represented in QUINCY-soil. The relative better performances of JSM to reproduce SON and SOP trends under realistic litter P inputs indicates that correct litter qualities are essential to model different SOM conditions. Unlike stand-alone soil models, in which litter stoichiometry is part of model inputs, TBMs usually model the litter stoichiometry as an important prognostic variable. Therefore this importance of litter quality highlights the challenges in TBMs to correctly simulate vegetation and soil responses to P gradients. Furthermore, the much better performances of JSM in capturing vertical trends of soil C:P and N:P ratios (Supplementary Table S2) implied that the spatial pattern of SOM is strongly regulated by the vertical explicitness of soil microbial and organo-mineral association processes (Yu et al., 2020; Ahrens et al., 2015), which should also be represented in TBMs.
The added N in both models was both taken up by plants in the long term (>50 years), but their short-term (<1 year) responses differed. In JSM, almost all the added N was quickly taken up by plants but in QUINCY-soil, nearly 20% of added N was also instantaneously incorporated into SOM (Supplementary Figure S1). The fast microbial assimilation of N did occur in JSM but was less visible in N pools because their sizes changed much slower compared to QUINCY-soil (Figure 4 and Supplementary Figure S1). This imposed an obstacle to directly compare our results with field 15N tracer studies (e.g., Goodale, 2017) because the recovery of 15N signals is the evidence of N exchange between N pools and does not necessarily imply pool size changes. The slow response of N pool to N addition in JSM may be due to the fixed microbial C:N ratio, which does not allow microbes to take up excess N. However, Rs increased shortly after N addition but leveled out in the long term to a negative response in QUINCY-soil (Figure 3 and Table 5). This contradicted the reported short- and long-term observations that N addition led to decreased Rs (Stiles et al., 2018; Poeplau et al., 2016, Janssens et al., 2010, Camenzind et al., 2018). However, we note that the model currently misses the decline of root growth to nitrogen addition, and associated with this the decline in fresh C input as an energy source for SOM decomposition. The divergence between short- and long-term responses has brought up a noteworthy question for the modeling community. Should we directly apply an empirical relationship derived from long-term observations (the heuristic function discussed in section “Simulated Soil Responses to Nutrient Addition”) in models, or should we describe the processes mechanistically to achieve such a relationship in a progressive manner? For the purpose of describing short-term responses, the heuristic function is not suitable, and our findings also suggest the mechanistic description is better than the heuristic function in simulating the long-term C responses to N addition (Table 5).
With respect to P addition, the two models disagreed on the fates of added P and Rs responses. QUINCY-soil predicted no long-term effects of SOM cycling to P addition and all the added P ended up either being taken by plants or stored as SIP (Supplementary Table S3 and Figure 4). This was obviously against the results from isotopic experiments conducted at soils from BBR and LUE in which a large proportion of isotopic signals were recovered in SOM (Spohn et al., 2018). JSM predicted strong microbial biomass increases and Rs responses, which seems to agree with the observed pattern (Feng and Zhu, 2019), and a large proportion of P stored as SOP (Supplementary Table S3 and Figure 4). We found no effect of initial soil P stock on Rs responses to nutrient addition by our simulations, but we did see effects on responses of bio-mineralization (τ = 0.8, M–K test) and microbial P uptake (τ = 0.8, M–K test) to the P addition along the soil P gradient (BBR > MTF > VES > COM > LUE). These were caused by a stronger reduction of bio-mineralization and a weaker increase of microbial P uptake in P rich site than P poor site.
The JSM simulation suggested that the key process to regulate this response is the P mining process, i.e., bio-mineralization, as we noticed that the simulated Rs increase after P addition concurred with the exceptional responses of bio-mineralization (Figure 6). As discussed in section “Simulated Soil Responses to Nutrient Addition” and Yu et al. (2020), the C and N costs of bio-mineralization seem essential to describe the C, N, and P interactions of plant-soil-microbe systems and need to be included in models but were not yet implemented in the current JSM version. Moreover, the bio-mineralization rate in JSM was significantly higher than in QUINCY-soil (Figure 7A), indicating that the P cycling is very different between explicit and implicit microbial dynamics. Therefore, we do see a reasonable need to improve the soil C, N, and P interactions in TBMs, particularly in the sense of improving SOM P cycling, and our simulations have shown that the inclusion of microbial dynamics and processes might be a plausible solution.
Our findings suggest that the more detailed explicit description of microbial processes and organo-mineral association is required to reproduce observed SOM profiles, to capture SOM trends in the depth profile and along the soil P stock gradient, and to model soil responses to N and P additions. Therefore, these processes should be included in the TBMs in the future.
Moreover, some intriguing patterns in the model simulations, particularly those in JSM, could be potentially enlightening to field studies. For example, we have found a systematic belowground P stress at our study sites, because the JSM simulations show that microbial biomass increments and soil respiration responses are both much higher in P addition than in N addition. It seems a very interesting pattern but needs to be validated with field data. Additionally, diverging temporal effects between short-term and long-term fates of added nutrients in our simulations (Figure 4) suggest the necessity of better experiment designs to tackle the long-term effects of nutrient fertilization. In the other hand, to understand the short-term soil responses to nutrient fertilization, our model simulations indicate that microbial processes or properties, such as microbial biomass, stoichiometry, and CUE as well as nutrient mineralization, are important and should be better tracked in future field or lab studies.
Data Availability Statement
The datasets generated for this study are available on request to the corresponding author.
Author Contributions
SZ, MS, and LY conceived the manuscript idea. LY ran the model simulations. All authors contributed to the interpretation of the results and wrote the manuscript.
Funding
This work was supported by the framework of Priority Program SPP 1685 “Ecosystem Nutrition: Forest Strategies for Limited Phosphorus Resources” of the German Research Foundation (DFG), grant no. ZA 763/2-1 and SCHR 1181/3-1. SZ was supported by the European Research Council (ERC) under the European Union’s Horizon 2020 research and innovation programme (grant agreement No 647204, QUINCY).
Conflict of Interest
The authors declare that the research was conducted in the absence of any commercial or financial relationships that could be construed as a potential conflict of interest.
The reviewer LF declared a past co-authorship with one of the authors SZ to the handling editor.
Acknowledgments
We are grateful to Friederike Lang, Jaane Krüger, and other co-workers for measuring and sharing the data, to Jan Engel and Tea Thum for technical assistance in model simulation, and to Kendalynn Morris for assistance in literature search.
Supplementary Material
The Supplementary Material for this article can be found online at: https://www.frontiersin.org/articles/10.3389/ffgc.2020.543112/full#supplementary-material
References
Abramoff, R. Z., Davidson, E. A., and Finzi, A. C. (2017). A parsimonious modular approach to building a mechanistic belowground carbon and nitrogen model. J. Geophys. Res. Biogeosci. 122, 2418–2434. doi: 10.1002/2017jg003796
Ahrens, B., Braakhekke, M. C., Guggenberger, G., Schrumpf, M., and Reichstein, M. (2015). Contribution of sorption, DOC transport and microbial interactions to the 14C age of a soil organic carbon profile: Insights from a calibrated process model. Soil Biol. Biochem. 88, 390–402. doi: 10.1016/j.soilbio.2015.06.008
Bond-Lamberty, B., Bailey, V. L., Chen, M., Gough, C. M., and Vargas, R. (2018). Globally rising soil heterotrophic respiration over recent decades. Nature 560, 80–83. doi: 10.1038/s41586-018-0358-x
Brahney, J., Mahowald, N., Ward, D. S., Ballantyne, A. P., and Neff, J. C. (2015). Is atmospheric phosphorus pollution altering global alpine lake stoichiometry? Glob. Biogeochem. Cycles 29, 1369–1383. doi: 10.1002/2015gb005137
Camenzind, T., Hättenschwiler, S., Treseder, K. K., Lehmann, A., and Rillig, M. C. (2018). Nutrient limitation of soil microbial processes in tropical forests. Ecol. Monogr. 88, 4–21. doi: 10.1002/ecm.1279
Čapek, P., Manzoni, S., Kaštovská, E., Wild, B., Diáková, K., Bárta, J., et al. (2018). A plant–microbe interaction framework explaining nutrient effects on primary production. Nat. Ecol. Evol. 2, 1588–1596. doi: 10.1038/s41559-018-0662-8
Carey, J. C., Tang, J., Templer, P. H., Kroeger, K. D., Crowther, T. W., Burton, A. J., et al. (2016). Temperature response of soil respiration largely unaltered with experimental warming. Proc. Natl. Acad. Sci. U.S.A. 113, 13797–13802.
Chien, C.-T., Mackey, K. R. M., Dutkiewicz, S., Mahowald, N. M., Prospero, J. M., and Paytan, A. (2016). Effects of African dust deposition on phytoplankton in the western tropical Atlantic Ocean off Barbados. Glob. Biogeochem. Cycles 30, 716–734. doi: 10.1002/2015gb005334
Craine, J. M., Morrow, C., and Fierer, N. (2007). Microbial nitrogen limitation increases decomposition. Ecology 88, 2105–2113. doi: 10.1890/06-1847.1
Dijkstra, F. A., Carrillo, Y., Pendall, E., and Morgan, J. A. (2013). Rhizosphere priming: a nutrient perspective. Front. Microbiol. 4:216. doi: 10.3389/fmicb.2013.00216
Ellsworth, D. S., Anderson, I. C., Crous, K. Y., Cooke, J., Drake, J. E., Gherlenda, A. N., et al. (2017). Elevated CO2 does not increase eucalypt forest productivity on a low-phosphorus soil. Nat. Clim. Change 7, 279–282. doi: 10.1038/nclimate3235
Engels, C., Kirkby, E., and White, P. (2011). “Mineral nutrition, yield and source–sink relationships,” in Marschner’s Mineral Nutrition of Higher Plants, ed. P. Marschner (Waltham: Academic Press), 85–134. doi: 10.1016/b978-0-12-384905-2.00005-4
Fanin, N., Barantal, S., Fromin, N., Schimann, H., Schevin, P., and Hättenschwiler, S. (2012). Distinct microbial limitations in litter and underlying soil revealed by carbon and nutrient fertilization in a tropical rainforest. PLoS One 7:e49990. doi: 10.1371/journal.pone.0049990
Feng, J., and Zhu, B. (2019). A global meta-analysis of soil respiration and its components in response to phosphorus addition. Soil Biol. Biochem. 135, 38–47. doi: 10.1016/j.soilbio.2019.04.008
Fernández-Martínez, M., Vicca, S., Janssens, I. A., Sardans, J., Luyssaert, S., Campioli, M., et al. (2014). Nutrient availability as the key regulator of global forest carbon balance. Nat. Clim. Change 4, 471–476. doi: 10.1038/nclimate2177
Finzi, A. C., Norby, R. J., Calfapietra, C., Gallet-Budynek, A., Gielen, B., Holmes, W. E., et al. (2007). Increases in nitrogen uptake rather than nitrogen-use efficiency support higher rates of temperate forest productivity under elevated CO<sub>2</sub>. Proc. Natl. Acad. Sci. U.S.A. 104, 14014–14019. doi: 10.1073/pnas.0706518104
Fisk, M., Santangelo, S., and Minick, K. (2015). Carbon mineralization is promoted by phosphorus and reduced by nitrogen addition in the organic horizon of northern hardwood forests. Soil Biol. Biochem. 81, 212–218. doi: 10.1016/j.soilbio.2014.11.022
Goll, D. S., Brovkin, V., Parida, B. R., Reick, C. H., Kattge, J., Reich, P. B., et al. (2012). Nutrient limitation reduces land carbon uptake in simulations with a model of combined carbon, nitrogen and phosphorus cycling. Biogeosciences 9, 3547–3569. doi: 10.5194/bg-9-3547-2012
Goll, D. S., Vuichard, N., Maignan, F., Jornet-Puig, A., Sardans, J., Violette, A., et al. (2017). A representation of the phosphorus cycle for ORCHIDEE (revision 4520). Geosci. Model Dev. 10, 3745–3770. doi: 10.5194/gmd-10-3745-2017
Goodale, C. L. (2017). Multiyear fate of a 15N tracer in a mixed deciduous forest: retention, redistribution, and differences by mycorrhizal association. Glob. Change Biol. 23, 867–880. doi: 10.1111/gcb.13483
Groffman, P. M., and Fisk, M. C. (2011). Phosphate additions have no effect on microbial biomass and activity in a northern hardwood forest. Soil Biol. Biochem. 43, 2441–2449. doi: 10.1016/j.soilbio.2011.08.011
Hawkesford, M., Horst, W., Kichey, T., Lambers, H., Schjoerring, J., Møller, I. S., et al. (2012). “Functions of macronutrients,” in Marschner’s Mineral Nutrition of Higher Plants, ed. P. Marschner (Waltham: Academic Press), 135–189. doi: 10.1016/b978-0-12-384905-2.00006-6
Huang, Y., Guenet, B., Ciais, P., Janssens, I. A., Soong, J. L., Wang, Y., et al. (2018). ORCHIMIC (v1.0), a microbe-mediated model for soil organic matter decomposition. Geosci. Model Dev. 11, 2111–2138. doi: 10.5194/gmd-11-2111-2018
Hui, D., Porter, W., Phillips, J. R., Aidar, M. P. M., Lebreux, S. J., Schadt, C. W., et al. (2019). Phosphorus rather than nitrogen enhances CO2 emissions in tropical forest soils: evidence from a laboratory incubation study. Eur. J. Soil Sci. 71, 495–510. doi: 10.1111/ejss.12885
Janssens, I. A., Dieleman, W., Luyssaert, S., Subke, J. A., and Reichstein, M. (2010). Reduction of forest soil respiration in response to nitrogen deposition. Nat. Geosci. 3, 315–322. doi: 10.1038/ngeo844
Jiang, M., Medlyn, B. E., Drake, J. E., Duursma, R. A., Anderson, I. C., Barton, C. V. M., et al. (2020). The fate of carbon in a mature forest under carbon dioxide enrichment. Nature 580, 227–231.
Jing, Z., Chen, R., Wei, S., Feng, Y., Zhang, J., and Lin, X. (2017). Response and feedback of C mineralization to P availability driven by soil microorganisms. Soil Biol. Biochem. 105, 111–120. doi: 10.1016/j.soilbio.2016.11.014
Johnson, D. W., and Turner, J. (2019). Tamm review: nutrient cycling in forests: a historical look and newer developments. For. Ecol. Manag. 444, 344–373. doi: 10.1016/j.foreco.2019.04.052
Jonard, M., Fürst, A., Verstraeten, A., Thimonier, A., Timmermann, V., Potočić, N., et al. (2015). Tree mineral nutrition is deteriorating in Europe. Glob. Change Biol. 21, 418–430. doi: 10.1111/gcb.12657
Klotzbücher, A., Kaiser, K., Klotzbücher, T., Wolff, M., and Mikutta, R. (2019). Testing mechanisms underlying the Hedley sequential phosphorus extraction of soils. J. Plant Nutr. Soil Sci. 182, 570–577. doi: 10.1002/jpln.201800652
Kohler, M., Niederberger, J., Wichser, A., Bierbaß, P., Rötzer, T., Spiecker, H., et al. (2019). Using tree rings to reconstruct changes in soil P availability – Results from forest fertilization trials. Dendrochronologia 54, 11–19. doi: 10.1016/j.dendro.2019.01.001
Kuzyakov, Y., Friedel, J. K., and Stahr, K. (2000). Review of mechanisms and quantification of priming effects. Soil Biol. Biochem. 32, 1485–1498. doi: 10.1016/s0038-0717(00)00084-5
Lamarque, J. F., Bond, T. C., Eyring, V., Granier, C., Heil, A., Klimont, Z., et al. (2010). Historical (1850–2000) gridded anthropogenic and biomass burning emissions of reactive gases and aerosols: methodology and application. Atmos. Chem. Phys. 10, 7017–7039. doi: 10.5194/acp-10-7017-2010
Lamarque, J.-F., Kyle, G. P., Meinshausen, M., Riahi, K., Smith, S. J., van Vuuren, D. P., et al. (2011). Global and regional evolution of short-lived radiatively-active gases and aerosols in the representative concentration pathways. Clim. Change 109:191. doi: 10.1007/s10584-011-0155-0
Lang, F., Krüger, J., Amelung, W., Willbold, S., Frossard, E., Bünemann, E. K., et al. (2017). Soil phosphorus supply controls P nutrition strategies of beech forest ecosystems in central Europe. Biogeochemistry. 136, 5–29. doi: 10.1007/s10533-017-0375-0
Liu, H., Zhou, G., Bai, S. H., Song, J., Shang, Y., He, M., et al. (2019). Differential response of soil respiration to nitrogen and phosphorus addition in a highly phosphorus-limited subtropical forest. China. For. Ecol. Manag. 448, 499–508. doi: 10.1016/j.foreco.2019.06.020
Liu, L., Zhang, T., Gilliam, F. S., Gundersen, P., Zhang, W., Chen, H., et al. (2013). Interactive effects of nitrogen and phosphorus on soil microbial communities in a tropical forest. PLoS One 8:e61188. doi: 10.1371/journal.pone.0061188
McGill, W. B., and Cole, C. V. (1981). Comparative aspects of cycling of organic C, N, S and P through soil organic matter. Geoderma 26, 267–286. doi: 10.1016/0016-7061(81)90024-0
Medlyn, B. E., De Kauwe, M. G., Zaehle, S., Walker, A. P., Duursma, R. A., Luus, K., et al. (2016). Using models to guide field experiments: a priori predictions for the CO2 response of a nutrient- and water-limited native Eucalypt woodland. Glob. Change Biol. 22, 2834–2851. doi: 10.1111/gcb.13268
Meyer, N., Welp, G., Rodionov, A., Borchard, N., Martius, C., and Amelung, W. (2018). Nitrogen and phosphorus supply controls soil organic carbon mineralization in tropical topsoil and subsoil. Soil Biol. Biochem. 119, 152–161. doi: 10.1016/j.soilbio.2018.01.024
Moorhead, D. L., and Sinsabaugh, R. L. (2006). A theoretical model of litter decay and microbial interaction. Ecol. Monogr. 76, 151–174. doi: 10.1890/0012-9615(2006)076[0151:atmold]2.0.co;2
Mori, T., Lu, X., Aoyagi, R., and Mo, J. (2018). Reconsidering the phosphorus limitation of soil microbial activity in tropical forests. Funct. Ecol. 32, 1145–1154. doi: 10.1111/1365-2435.13043
Netzer, F., Pozzi, L., Dubbert, D., and Herschbach, C. (2019). Improved photosynthesis and growth of poplar during nitrogen fertilization is accompanied by phosphorus depletion that indicates phosphorus remobilization from older stem tissues. Environ. Exp. Bot. 162, 421–432. doi: 10.1016/j.envexpbot.2019.03.017
Norby, R. J., Ledford, J., Reilly, C. D., Miller, N. E., and Neill, E. G. (2004). Fine-root production dominates response of a deciduous forest to atmospheric CO<sub>2</sub> enrichment. Proc. Natl. Acad. Sci. U.S.A. 101, 9689–9693. doi: 10.1073/pnas.0403491101
Pan, Y., Birdsey, R. A., Fang, J., Houghton, R., Kauppi, P. E., Kurz, W. A., et al. (2011). A large and persistent carbon sink in the world’s forests. Science 333, 988–993.
Parton, W. J., Stewart, J. W. B., and Cole, C. V. (1988). Dynamics of C, N, P and S in grassland soils: a model. Biogeochemistry 5, 109–131. doi: 10.1007/bf02180320
Poeplau, C., Herrmann, A. M., and Kätterer, T. (2016). Opposing effects of nitrogen and phosphorus on soil microbial metabolism and the implications for soil carbon storage. Soil Biol. Biochem. 100, 83–91. doi: 10.1016/j.soilbio.2016.05.021
Ren, F., Yang, X., Zhou, H., Zhu, W., Zhang, Z., Chen, L., et al. (2016). Contrasting effects of nitrogen and phosphorus addition on soil respiration in an alpine grassland on the Qinghai-Tibetan Plateau. Sci. Rep. 6:34786.
Schimel, J. P., and Weintraub, M. N. (2003). The implications of exoenzyme activity on microbial carbon and nitrogen limitation in soil: a theoretical model. Soil Biol. Biochem. 35, 549–563. doi: 10.1016/s0038-0717(03)00015-4
Spohn, M., Pötsch, E. M., Eichorst, S. A., Woebken, D., Wanek, W., and Richter, A. (2016). Soil microbial carbon use efficiency and biomass turnover in a long-term fertilization experiment in a temperate grassland. Soil Biol. Biochem. 97, 168–175. doi: 10.1016/j.soilbio.2016.03.008
Spohn, M., and Schleuss, P.-M. (2019). Addition of inorganic phosphorus to soil leads to desorption of organic compounds and thus to increased soil respiration. Soil Biol. Biochem. 130, 220–226. doi: 10.1016/j.soilbio.2018.12.018
Spohn, M., and Widdig, M. (2017). Turnover of carbon and phosphorus in the microbial biomass depending on phosphorus availability. Soil Biol. Biochem. 113, 53–59. doi: 10.1016/j.soilbio.2017.05.017
Spohn, M., Zavišić, A., Nassal, P., Bergkemper, F., Schulz, S., Marhan, S., et al. (2018). Temporal variations of phosphorus uptake by soil microbial biomass and young beech trees in two forest soils with contrasting phosphorus stocks. Soil Biol. Biochem. 117, 191–202. doi: 10.1016/j.soilbio.2017.10.019
Stiles, W. A. V., Rowe, E. C., and Dennis, P. (2018). Nitrogen and phosphorus enrichment effects on CO2 and methane fluxes from an upland ecosystem. Sci. Total Environ. 618, 1199–1209. doi: 10.1016/j.scitotenv.2017.09.202
Sulman, B. N., Brzostek, E. R., Medici, C., Shevliakova, E., Menge, D. N. L., and Phillips, R. P. (2017). Feedbacks between plant N demand and rhizosphere priming depend on type of mycorrhizal association. Ecol. Lett. 20, 1043–1053. doi: 10.1111/ele.12802
Sulman, B. N., Shevliakova, E., Brzostek, E. R., Kivlin, S. N., Malyshev, S., Menge, D. N. L., et al. (2019). Diverse mycorrhizal associations enhance terrestrial c storage in a global model. Glob. Biogeochem. Cycles 33, 501–523. doi: 10.1029/2018gb005973
Thum, T., Caldararu, S., Engel, J., Melanie, K., Marleen, P., Reiner, S., et al. (2019). A new model of the coupled carbon, nitrogen, and phosphorus cycles in the terrestrial biosphere (QUINCY v1.0; revision 1996). Geosci. Model Dev. 12, 4781–4802. doi: 10.5194/gmd-12-4781-2019
Viovy, N. (2018). CRUNCEP Version 7 - Atmospheric Forcing Data for the Community Land Model. Research Data Archive at the National Center for Atmospheric Research, Computational and Information Systems Laboratory. Available online at: doi: 10.5065/PZ8F-F017 (accessed December 15, 2019).
Wang, J., Li, Q., Fu, X., Dai, X., Kou, L., Xu, M. S., et al. (2019). Mechanisms driving ecosystem carbon sequestration in a Chinese fir plantation: nitrogen versus phosphorus fertilization. Eur. J. Forest Res. 138, 863–873. doi: 10.1007/s10342-019-01208-z
Wang, Q., Zhang, W., Sun, T., Chen, L. C., Pang, X. Y., Wang, Y. P., et al. (2017). N and P fertilization reduced soil autotrophic and heterotrophic respiration in a young Cunninghamia lanceolata forest. Agric. For Meteorol. 232, 66–73. doi: 10.1016/j.agrformet.2016.08.007
Wang, Y. P., Law, R. M., and Pak, B. (2010). A global model of carbon, nitrogen and phosphorus cycles for the terrestrial biosphere. Biogeosciences 7, 2261–2282. doi: 10.5194/bg-7-2261-2010
Wieder, W. R., Cleveland, C. C., Smith, W. K., and Todd-Brown, K. (2015). Future productivity and carbon storage limited by terrestrial nutrient availability. Nat. Geosci. 8, 441–444. doi: 10.1038/ngeo2413
Wutzler, T., Zaehle, S., Schrumpf, M., Ahrens, B., and Reichstein, M. (2017). Adaptation of microbial resource allocation affects modelled long term soil organic matter and nutrient cycling. Soil Biol. Biochem. 115, 322–336. doi: 10.1016/j.soilbio.2017.08.031
Xu, X., Thornton, P. E., and Post, W. M. (2013). A global analysis of soil microbial biomass carbon, nitrogen and phosphorus in terrestrial ecosystems. Glob. Ecol. Biogeogr. 22, 737–749. doi: 10.1111/geb.12029
Yu, L., Ahrens, B., Wutzler, T., Schrumpf, M., and Zaehle, S. (2020). Jena soil model (JSM v1.0; revision 1934): a microbial soil organic carbon model integrated with nitrogen and phosphorus processes. Geosci. Model Dev. 13, 783–803. doi: 10.5194/gmd-13-783-2020
Yu, L., Zanchi, G., Akselsson, C., Wallander, H., and Belyazid, S. (2018). Modeling the forest phosphorus nutrition in a southwestern swedish forest site. Ecol. Modell. 369, 88–100. doi: 10.1016/j.ecolmodel.2017.12.018
Zaehle, S., Medlyn, B. E., De Kauwe, M. G., Walker, A. P., Dietze, M. C., Hickler, T., et al. (2014). Evaluation of 11 terrestrial carbon–nitrogen cycle models against observations from two temperate Free-Air CO2 Enrichment studies. New Phytol. 202, 803–822. doi: 10.1111/nph.12697
Zaehle, S., Sitch, S., Smith, B., and Hatterman, F. (2005). Effects of parameter uncertainties on the modeling of terrestrial biosphere dynamics. Glob. Biogeochem. Cycles 19:GB3020.
Zeng, W., and Wang, W. (2015). Combination of nitrogen and phosphorus fertilization enhance ecosystem carbon sequestration in a nitrogen-limited temperate plantation of Northern China. For. Ecol. Manag. 341, 59–66. doi: 10.1016/j.foreco.2015.01.004
Zhong, Y., Yan, W., and Shangguan, Z. (2016). The effects of nitrogen enrichment on soil CO2 fluxes depending on temperature and soil properties. Glob. Ecol. Biogeogr. 25, 475–488. doi: 10.1111/geb.12430
Zhou, L., Zhou, X., Zhang, B., Lu, M., Luo, Y., Liu, L., et al. (2014). Different responses of soil respiration and its components to nitrogen addition among biomes: a meta-analysis. Glob. Change Biol. 20, 2332–2343. doi: 10.1111/gcb.12490
Zhu, Q., Riley, W. J., Tang, J., Collier, N., Hoffman, F. M., Yang, X., et al. (2019). Representing nitrogen, phosphorus, and carbon interactions in the E3SM land model: development and global benchmarking. J. Adv. Model. Earth Syst. 11, 2238–2258. doi: 10.1029/2018ms001571
Keywords: phosphorus, nitrogen, microbe, stoichiometry, soil models
Citation: Yu L, Ahrens B, Wutzler T, Zaehle S and Schrumpf M (2020) Modeling Soil Responses to Nitrogen and Phosphorus Fertilization Along a Soil Phosphorus Stock Gradient. Front. For. Glob. Change 3:543112. doi: 10.3389/ffgc.2020.543112
Received: 15 March 2020; Accepted: 23 September 2020;
Published: 15 October 2020.
Edited by:
Sebastian Loeppmann, Christian-Albrechts-Universität zu Kiel, GermanyReviewed by:
Lucia Fuchslueger, University of Vienna, AustriaZachary E. Kayler, University of Idaho, United States
Copyright © 2020 Yu, Ahrens, Wutzler, Zaehle and Schrumpf. This is an open-access article distributed under the terms of the Creative Commons Attribution License (CC BY). The use, distribution or reproduction in other forums is permitted, provided the original author(s) and the copyright owner(s) are credited and that the original publication in this journal is cited, in accordance with accepted academic practice. No use, distribution or reproduction is permitted which does not comply with these terms.
*Correspondence: Lin Yu, bHl1QGJnYy1qZW5hLm1wZy5kZQ==
†Present address: Lin Yu, Centre for Environmental and Climate Research, Lund University, Lund, Sweden